Article

Quality Control Methods Using Quality Characteristics in Development and Operations †

1
Nihon Knowledge Co., Ltd., Tokyo 111-0042, Japan
2
Graduate School of System Design, Tokyo Metropolitan University, Tokyo 191-0065, Japan
*
Author to whom correspondence should be addressed.
This paper is the conference extension of Proceedings of the 14th International Conference on Management of Digital EcoSystems, Venice, Italy, 19–21 October 2022.
Digital 2024, 4(1), 232-243; https://doi.org/10.3390/digital4010012
Submission received: 15 October 2023 / Revised: 25 January 2024 / Accepted: 2 February 2024 / Published: 1 March 2024

Abstract

:
Since the Software Quality Model was defined as an international standard, many quality assurance teams have used this quality model in a waterfall model for software development and quality control. As more software is delivered as a cloud service, various methodologies have been created with an awareness of the link between development productivity and operations, enabling faster development. However, most development methods are development-oriented with awareness of development progress, and there has been little consideration of methods that achieve quality orientation for continuous quality improvement and monitoring. Therefore, we developed a method to visualize the progress of software quality during development by defining quality goals in the project charter using the quality model defined in international standards, classifying each test by quality characteristics, and clarifying the quality ensured by each test. This was achieved by classifying each test by quality characteristics and clarifying the quality ensured by each test. To use quality characteristics as KPIs, it is necessary to manage test results for each test type and compare them with past build results. This paper explains how to visualize the quality to be assured and the benefits of using quality characteristics as KPIs and proposes a method to achieve rapid and high-quality product development.

1. Introduction

In many software development environments, work is often divided between development (Dev) teams, which are responsible for developing features, and operations (Ops) teams, which are responsible for running the service. The Dev team’s primary mission is to add new features to the software, while the Ops team’s mission is to maintain the current environment and keep the service stable and continuous. The Dev and Ops teams have very different missions, and this can lead to team disagreements. However, faster software development is required to keep up with the rapidly changing business environment. To this end, teams should avoid becoming exhausted due to internal conflicts, and DevOps [1] is attracting attention as a way of thinking that “resolves common conflicts between teams and promotes smooth development through collaboration”.
DevOps has a seven-step lifecycle: Plan, Code, Build, Test, Deploy, Operate, and Monitor.
  • Plan: Defines the task management and development requirements for the entire project;
  • Code: Programmers create code according to development requirements;
  • Build: The application that will actually run is built from the source code;
  • Test: Test the built application for bugs and other defects;
  • Deploy: Deploy the application into production;
  • Operation: Perform maintenance and management tasks to ensure continuous service;
  • Monitor: Review information obtained from operations, user assessments, requests, etc.
These steps are performed sequentially and continuously to practice DevOps. The main benefits of implementing DevOps are achieving smooth development, increasing productivity, and speeding up releases.
The essence of DevOps, as mentioned above, is to resolve conflicts between Dev and Ops teams. By eliminating the internal drag-and-tug that has been common in the past, the goal is to achieve smooth development and operations.
To implement DevOps, it is necessary to implement a variety of supporting tools at each step of the lifecycle. Typical tools include version control systems that track file changes under project management and CI/CD tools such as Jenkins [2] that automate tasks previously performed manually. Effective use of these tools leads to increased productivity. This increased productivity means that more human resources can be allocated to improving quality and developing new services, which in turn increases the value of the service.
Automating testing and delivery with tools brings benefits in the form of increased productivity and faster work. Acceleration is simply the speed at which the DevOps lifecycle can be executed. In other words, you can increase the number of DevOps lifecycle cycles in a given period of time. More lifecycle cycles mean faster adoption of market requirements and feedback, which in turn means greater responsiveness to changing market needs.
For example, a developer runs unit tests against locally implemented code, and if the unit tests pass, the developer periodically commits changes to the code to a central repository as part of the CI process. The process is then delegated to Jenkins, the CI enabler, to run build, unit test, and build verification tests (BVT). If the BVT passes, the build is automatically deployed. Automated tests such as functional, performance, security, and regression tests are then run to ensure that the added code does not degrade the quality of existing functionality.
In addition to testing for quality, quality control is performed using various metrics and cascading models such as the V-model. Typically, the pass rate, defect rate, and test coverage of each test type (Table 1) are used to monitor project quality. However, these quality indicators are often difficult to use to assess the quality of software under development. Even if the coding rules and test design and implementation rules are clearly defined, it is difficult to objectively judge whether the quality is good or bad unless it is a derivative development project.
When considering software quality, the quality model [3] defined in the ISO 25000 series (SQuaRE) [4] can be used to classify the quality required of the software under development in terms of the quality characteristics provided by this quality model, shown in Figure 1, and to judge from test results whether each characteristic has been assured. SQuaRE also defines the metrics for each quality attribute, which can be used to determine whether quality has been assured.
Ito et al. [5] proposed a framework that allows the creation of a strategic test plan to achieve incremental quality building in agile development projects. The framework provides a state in which quality can be explained by releasing the product in a ratable manner and comprehensive quality assurance by incrementally building product quality.
To use quality characteristics effectively, we recommend that project managers classify the quality of software goals by quality characteristics and, if possible, also define the quality to be achieved at each milestone by quality characteristics.
Therefore, we have studied how to effectively use quality characteristics and existing quality data in development projects using the V-model. We have studied the international standard, which is also used in countries such as Germany and South Korea. In the JIS (Japanese Industry Standard) standard certification for software [6], we have studied the development process with an awareness of compliance with this standard and have applied it to several projects. With the expansion of the recurring business, several projects are adapting the agile process, so we decided to further expand the development process for the use of quality features and improve it so that it can also be used in projects that use the agile process.

2. Considerations for Using Quality Model in Agile Development Processes

The combination of continuous integration (CI) and continuous deployment (CD) processes as a software engineering practice for rapidly developing and deploying software applications into production is called the CI/CD pipeline. The pipeline is a collection of tools developers, test engineers, and IT operations staff use throughout the continuous software development, delivery, and deployment lifecycle.
The test pyramid, as shown in Figure 2, is a useful technique that allows us to conceptualize how to prioritize the tests in a CI/CD pipeline in terms of their relative number and order of execution. This technique was defined by Mike Cohn [7], with unit tests at the bottom, service tests in the middle, and UI tests at the top. By prioritizing with a test pyramid, you can build a strong foundation of automated unit tests that are quick and easy to execute, then move on to more complex tests that are more complex to write and take longer to execute, and finally, the least complex tests that are fewer in number. The pipeline provides more prioritized feedback.
As in the development process established for the V-model, quality requirements in agile projects are classified and normally described in the project plan. An international standard for quality requirements [8] has already been established, and functional and non-functional requirements can be classified using quality characteristics according to the methodology described in this standard. This method makes it possible to clarify the quality requirements for each actor. The initial quality control is carried out through the various activities of the development process and the rules defined in the project charter. The project charter is a short, formal document that summarizes the entire project and describes the project objectives, how it will be executed, and who will be involved. It is used throughout the project lifecycle and is an important factor in project planning. These projects can use quality characteristics for key quality management indicators, as shown in Table 2.
By including all the practices related to testing in the Agile process pipeline and the review activities necessary to build quality, such as design reviews, it is possible to organize which quality-enhancing activities are included in each practice.
Build, static analysis, unit testing, front-end and back-end integration testing, and the E2E test pipeline can be used to identify common implementation errors and increase software maturity. It is also possible to measure individual execution times within the CI process to immediately detect degradation due to code additions. For example, if the execution time of a test increases compared to the previous test, it is likely that some performance degradation is occurring, and the impact of the added code should be suspected.
Deploying builds in a continuous delivery (CD) process allows portability properties to be checked during the installation process.
Implementing a general CI/CD process and managing the results will help ensure that quality is continuously improved. In addition, by automating and integrating more testing activities, more quality characteristics can be covered in addition to functional conformance. By defining criteria for testing activities, each quality attribute can be used as a quality KPI on an ongoing basis.
In many development projects, GitHub [9] and Atlassian tools [10] can be used as project management tools, task ticket activities can be visualized as kanban boards, and development and bug-fixing activities can be effective for source code control. Project management tools are effective for managing project progress, but they cannot manage quality progress. Test management tools, on the other hand, can manage test cases and test progress and can play a role in quality management, but it is often difficult to use test results in history management.
Shimizu et.al [11] proposed a test result management tool to analyze and extend the coverage of automated tests and our team enhanced the test result management tool. The tool is written in C# and stores test results in SQL Server; for unit tests with API calls, we decided to implement and integrate a report class that can capture CPU load, memory consumption, I/O load, and network load along with functional tests and output this quality data along with the test results. The purpose of the report class is to provide a performance efficiency assessment. The purpose of the report class is to extend the coverage of unit testing by providing a performance efficiency evaluation.
The report class we built called MSTest [12], an extension of NUnit [13], a unit testing framework, with an extension method to obtain quality data necessary for evaluating performance efficiency and to generate test results in XML format along with functional test results (Figure 3).
The generated XML file can be used with the command line generator tool to generate a test result report in HTML format. The class also reads the .trx file of MSTest results generated by Visual Studio and generates a list of API methods called in HTML format to help understand test coverage.
Although it is possible to open a .trx file in Visual Studio and check the test results, there are problems in analyzing the results as it is difficult to see the cause of the failure. We developed this time to not only generate the results of functional and performance tests by outputting reports that automatically describe the pass/fail list, the logs during the tests, and the performance measurement results but also to convert this result information into HTML files to visualize the test result information, Figure 4.
Also, for the API tests created in JMeter, we decided to obtain performance data from the API test execution as well as the unit tests and evaluate whether the updated build has any performance degradation.
Both unit and integration tests were able to produce the following benefits while adding performance efficiency assessments.
  • Increased development productivity by being able to find features and performance and load degrades in the build pipeline;
  • Increased testing efficiency through automation;
  • Increased coverage of automated tests to capture more quality data.
As an example of this project, we are using Ranorex [14] as an E2E testing tool to automate scenario testing. The scenarios include use cases that involve more standard operating procedures called golden routes, use cases that check screen transitions when functions are invoked, and use cases that result in errors due to operational errors, so they are considered to include usability evaluations.
In this way, classifying automated tests using quality characteristics not only allows the quality improvement situation to take test coverage into account but also increases development productivity.

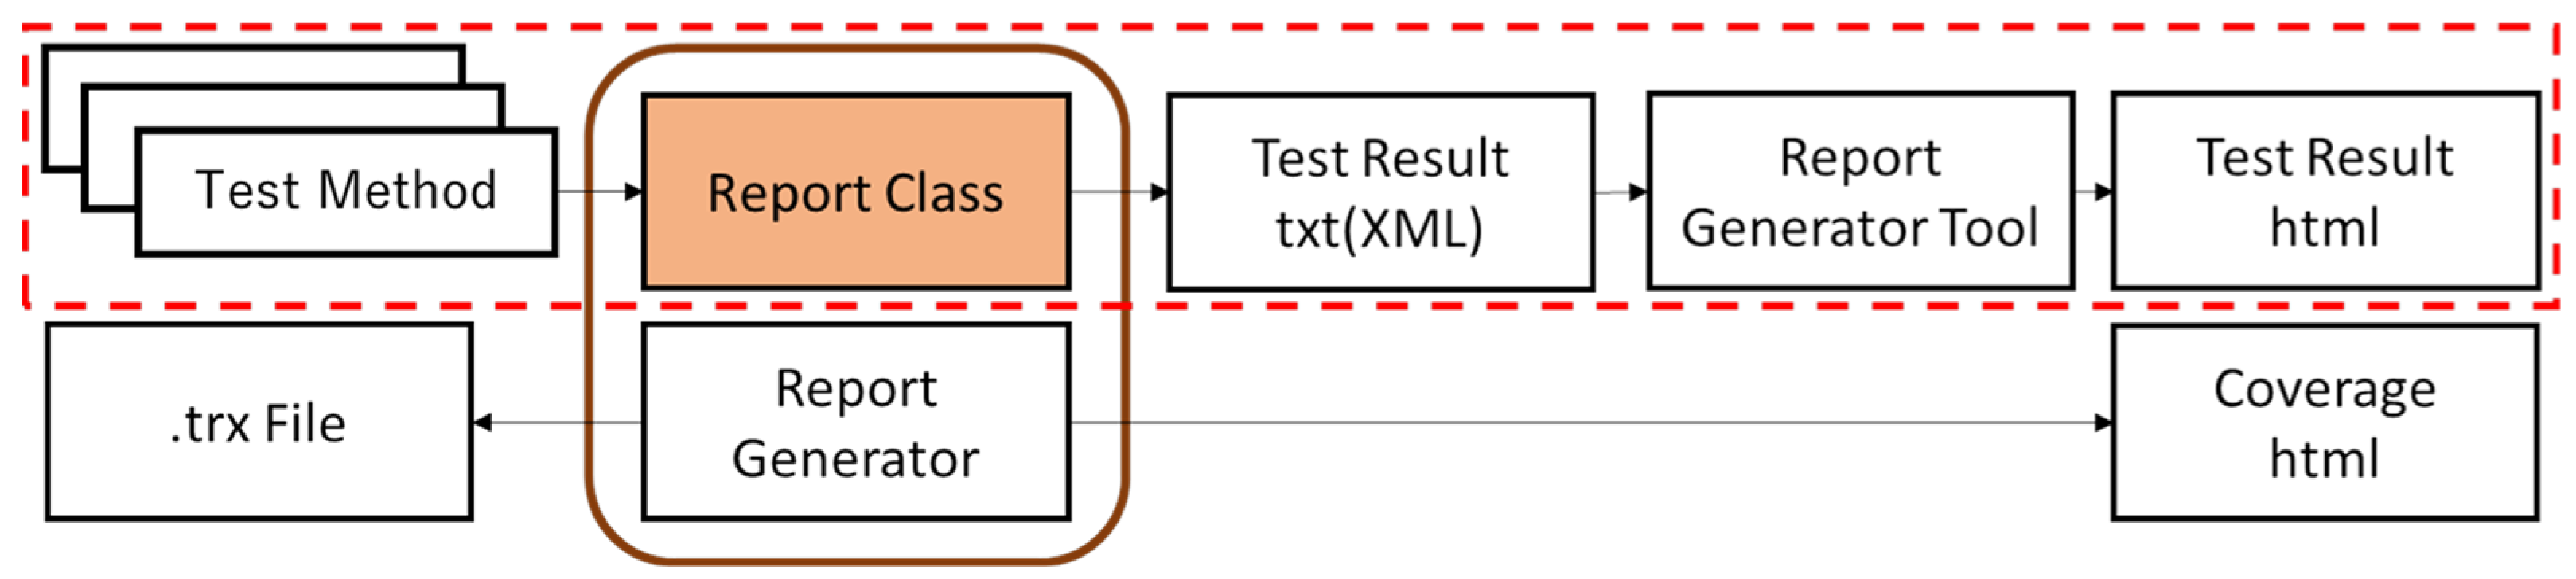
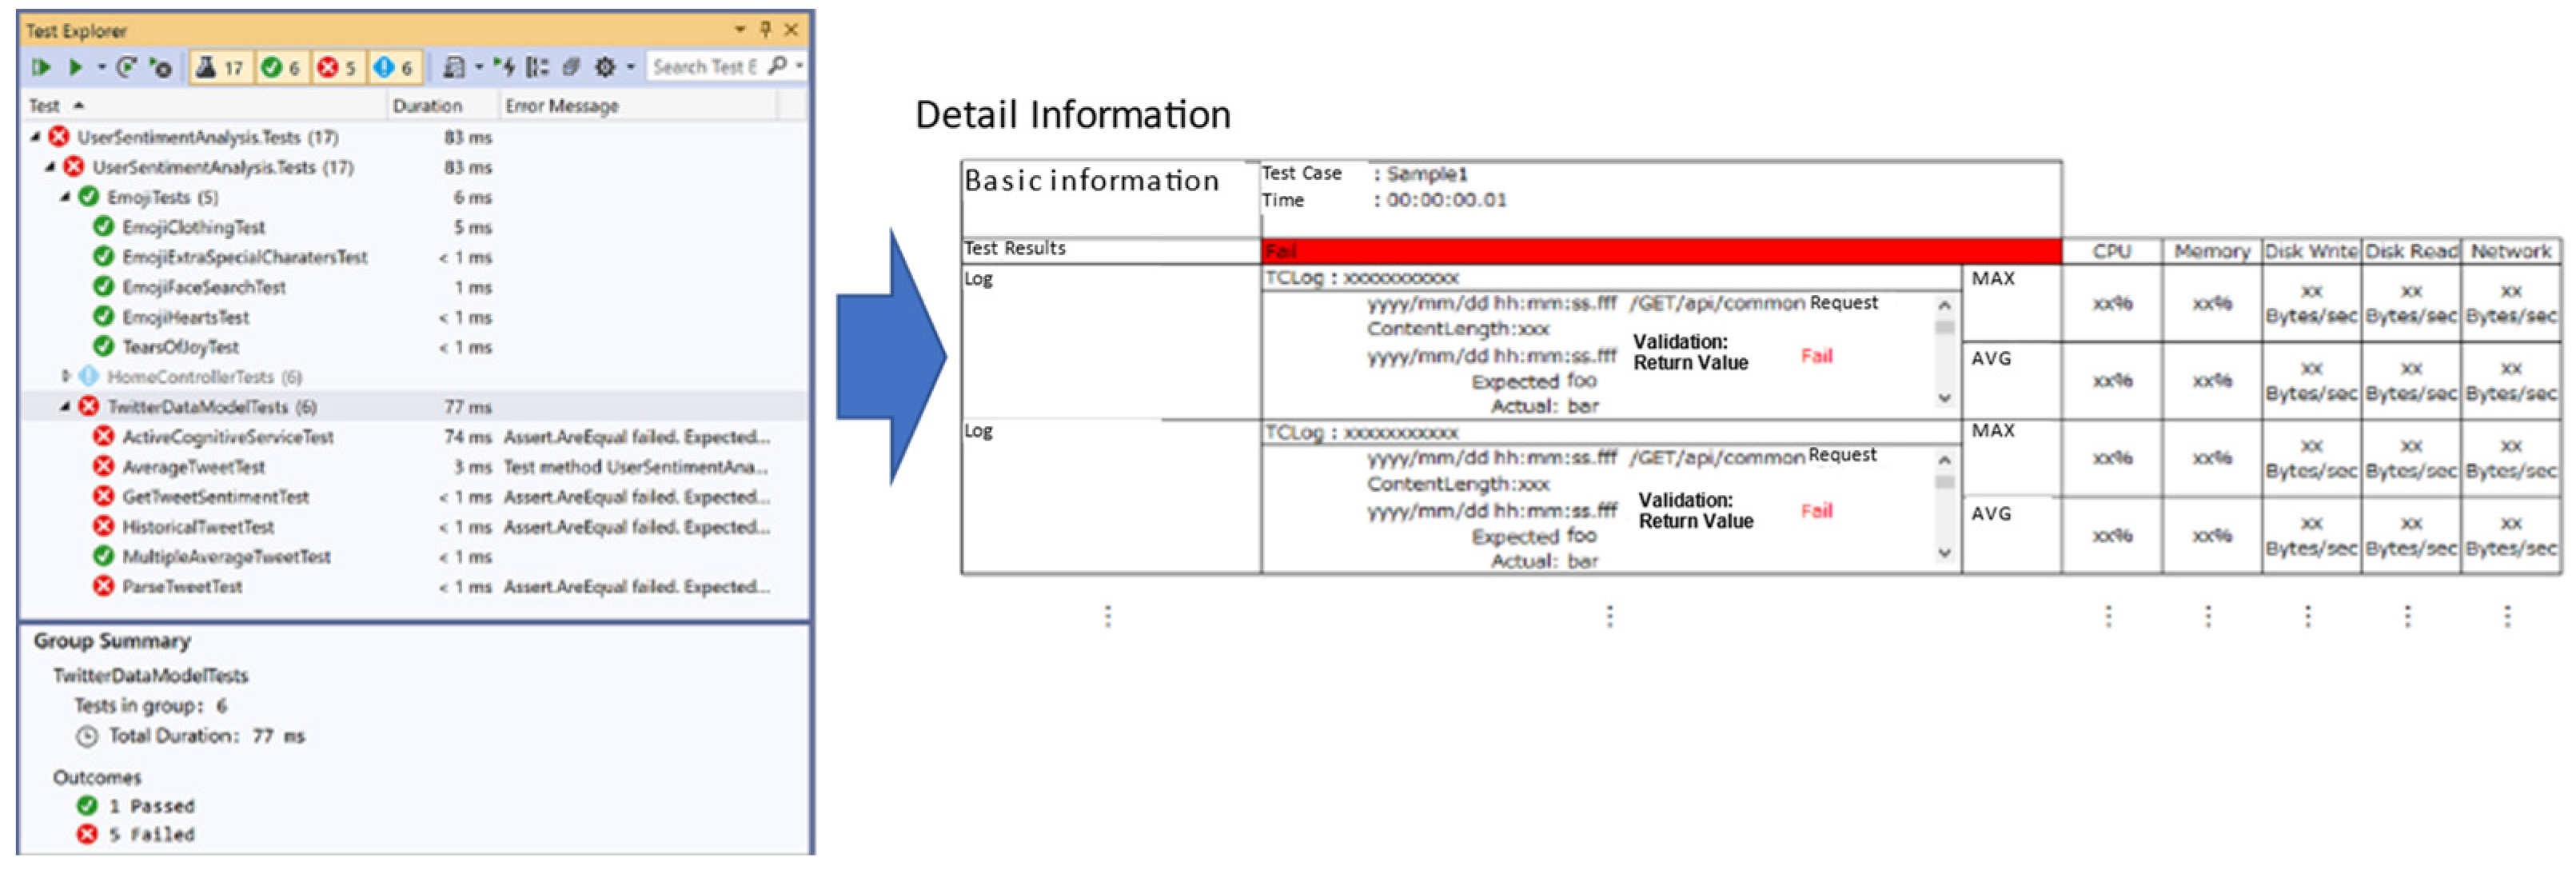
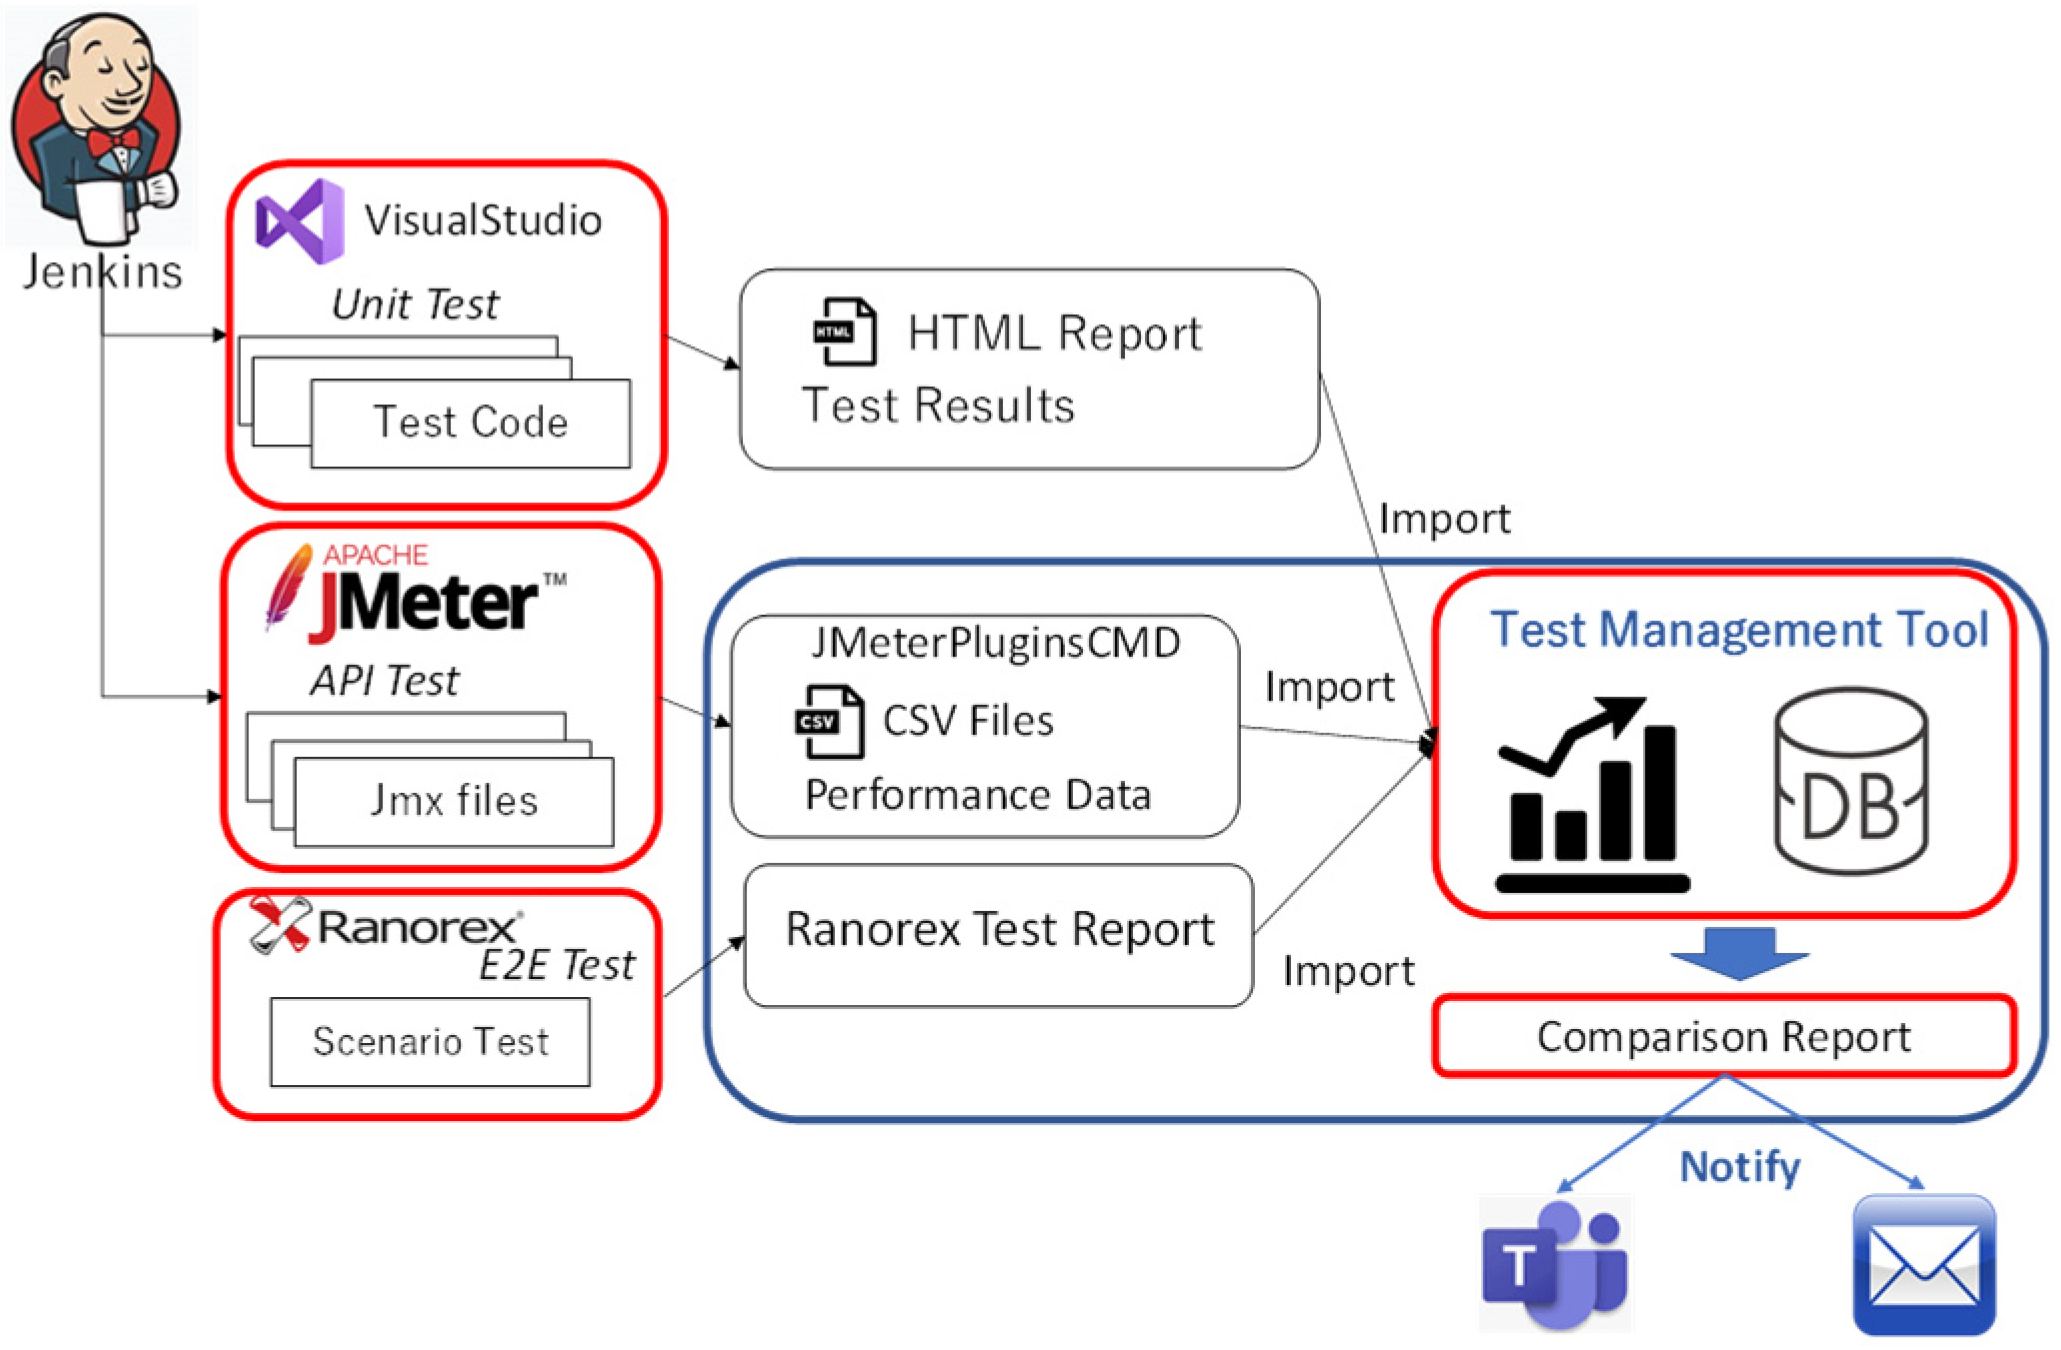
3. Enhance of Management of Test Results for Agile Projects

In software package development and service development, DevOps makes it possible to increase development productivity and increase the frequency of product releases. To ensure stable product releases, it is important to maintain the quality of the product and the test results within the project must be well managed. Since the DevOps project has achieved test automation with CI tools, we will also consider using a pipeline for test result management.
Engineers can quickly detect quality degradation if the test management tool can save the test results of unit tests, integration tests, and E2E tests as Jenkins jobs to be developed and easily report comparisons with multiple past versions. The comparison with the previous build is done in the build pipeline, and the comparison with past versions is easily performed in the tool.
When importing the test results, it compares the test results with the specified multiple past versions, compares the pass rate of the functional tests and the performance data, and generates a simple report with the judgment of whether or not the performance is within the registered threshold range. The URL of the generated result will be notified to you via Teams or e-mail. If you want to check the results of past versions in detail, you can use the comparison function of the tool to generate a detailed report.
The image of the job to process the import of test results from Jenkins is shown in Figure 5.
By running it as a Jenkins job, you can automate the process of importing the results of each test performed in the build pipeline and generating a test report.
The ability to manage test results and compare them with past versions makes it easier to ensure maturity and allows for the immediate detection of quality degradation, whether functional or performance.
The quality guaranteed by the expanded coverage of test automation in the CI process, the comparison process in the test result management tool, the distribution in the CD process, and the development rules in the development project are shown in Table 3.
Our projects are able to automate more quality-related tasks, such as static analysis, known as SAST, and dynamic analysis, known as DAST, than typical DevOps, although it requires some time and effort to integrate it into both the CI process and the CD process. Therefore, by preparing multiple test environments, resilience testing is able to perform security-related testing for automated testing.
Also, the use of test result management tools makes it possible to monitor quality progress from test results obtained in the CI process.

4. Using Quality Characteristics for KPI under Agile Development Projects

We have always used quality characteristics as KPIs for project quality in waterfall software development and have made quality progress visible [15]. In addition, this quality management approach is aware of the international standards [16] used in software certification and the international standards for software testing [17]. Therefore, the use of quality characteristics as KPIs to understand the quality build has also been considered for agile software development projects [18]. In the waterfall model, acceptance testing is planned as a condition for starting testing as the entry criteria for each test level, and acceptance testing is performed by extracting test cases from the test types to be performed at that test level using a stratified method. Since it is impossible to perform acceptance testing in every sprint of the agile process due to time constraints, we decided to investigate the need for acceptance testing and the relationship between the tasks performed in each sprint and quality characteristics through experiments.
We conducted two types of experiments on the impact on quality by conducting software development in an agile process with the following measures to make more effective use of quality characteristics in the agile process.
In the first team, the project manager chose the method of adding quality attributes to the task ticket items so that quality attributes were set when each task was raised, and sub-quality attributes were set for all test cases in the sprint. Second, many rules are defined in the project charter for using quality characteristics for KPIs.
The project manager in the second team adds the definition for the analyzed functional requirements and introduces a process for creating quality requirements at the time of the requirements review, and the following activities are introduced:
  • Designing quality requirements created at the time of the business requirements review and quality requirements for the design and development of the software. Ensure traceability of each issue so that the quality requirements created in the business requirements review can be checked for validity in design and evaluation;
  • Add quality attribute items to Jira and create a Kanban that quality attributes can reference;
  • Before starting a sprint, we created a sprint backlog by selecting tickets to be worked on by the sprint from the product backlog containing the business requirements and mapped the quality characteristics required by the business requirements.
In addition, the following practices are carried out for each sprint;
  • Define the quality requirements for each functional requirement and set the criteria by considering the metrics to be used;
  • Evaluate the design and implementation checkpoints of the functional elements for each quality attribute;
  • Establish evaluation criteria for each quality characteristic and map them to the quality characteristics to be ensured for each test activity;
  • Visualize the progress of the established criteria by assessing the conformance of the quality characteristics at each sprint.
Before starting the first sprint, the project prepared a mapping of activities and quality characteristics, as shown in Figure 6.
Also, the project begins with the following quality objectives:
  • Projected development scale: 2.6 KL;
  • Review density: 20 man-hours/KL;
  • Density of test items: 150 items/KL;
  • Number of bugs: 10/KL.

5. Results of Two Practices

The first project did not establish rules for using quality features in the project and left it up to the developers, which resulted in many tasks being delayed due to the overhead of using quality features. In addition, most tasks were biased toward functional conformance. This result is likely to occur in the waterfall model as well, and without considering the balance of each quality characteristic, the result will be biased toward functional conformance, so efforts are being made to reduce quality characteristics to 70% or less. It was found that simply using quality characteristics would only complicate the work and would not be beneficial.
On the other hand, in the second project, where the use of quality characteristics was specified in the project charter, and the method of using quality characteristics was defined, it became possible to break down the quality status and monitor progress. As a result, smooth project management was realized without disturbing the balance of QCD, and very good results were achieved. In the case of this project, the use of quality characteristics increased the testing density by 144% compared to the case where quality characteristics were not used, resulting in an increase in testing man-hours, but the number of defects detected decreased to 32% of the predicted value. This was a result of the quality characteristics of KPI and the implementation of quality-driven development. In addition, the tasks to be implemented were able to proceed as planned. In other words, using quality characteristics as KPIs makes it possible to proceed with quality-conscious development while being aware of the QCD balance.
Although this experiment was conducted on a small scale of 3.7 KL, similar results can be obtained by determining the quality characteristics to focus on for each sprint and proceeding with development with an awareness of the quality priority order. It was also suggested that the same effect could be achieved by being aware of quality prioritization, such as determining the quality characteristics to focus on in each sprint.
The benefits of using quality characteristics from the experiment are as follows:
  • When using quality characteristics in the agile process, it is assumed that if they are applied to a project for which a project plan has already been drawn up, the overhead of using quality characteristics is large and is likely to significantly affect the sprint’s activities;
  • If the use of quality features is considered from the project planning stage, the following actions can be taken to provide evidence of quality assurance to project management;
  • Declaring the use of quality features in the project charter;
  • Assigning quality characteristics to different activities;
  • The overhead of using quality characteristics should be included in the rough estimate before the project starts.
Finally, an example of a qualitative analysis of a product by quality characteristic in the project is given in Table 4.

6. Conclusions

Regardless of whether the development process used in a project is the cascade model method or the agile method, quality-oriented development can be achieved by using quality characteristics.
In the case of agile processes, it is possible to confirm that quality is continuously improving by defining the metrics to be achieved in each pipeline in the CI/CD pipeline. From the test engineer’s perspective, more time can be spent on test design and automated scripting, leaving more time for exploratory testing. In addition, the results of automated tests become the criteria for initiating manual tests, allowing them to efficiently focus on more complex manual tests. This allows them to efficiently focus on further improving quality.
In an agile process, it is important to design and execute testing activities efficiently in the CI/CD pipeline and to clarify in the sprint plan the quality characteristics that should be prioritized in each sprint. By clarifying the quality characteristics that should be prioritized in each sprint in the sprint plan and by developing a method to use SQuaRE [19] in the agile process, it can be recommended to build quality more efficiently.
In order to use quality characteristics as a KPI in large-scale agile development, it is necessary to prepare a KANBAN for this KPI and check the quality status of each team in a centralized manner. It will be necessary to educate all project members about quality characteristics, specify the purpose and means of using quality KPIs in the project charter, and ensure that project members understand and follow this project charter.

Author Contributions

Conceptualization, methodology, validation, formal analysis, investigation, resources, data curation, writing—review and editing, D.K.; supervision, H.I. All authors have read and agreed to the published version of the manuscript.

Funding

This research received no external funding.

Data Availability Statement

Data are contained within the article.

Conflicts of Interest

Author Daiju Kato was employed by the company Nihon Knowledge Co., Ltd. The remaining authors declare that the research was conducted in the absence of any commercial or financial relationships that could be construed as a potential conflict of interest.

References

  1. DevOps, 10+ Deploys Per Day: Dev and Ops Cooperation at Flickr. 2009. Available online: https://www.slideshare.net/jallspaw/10-deploys-per-day-dev-and-ops-cooperation-at-flickr (accessed on 15 January 2022).
  2. Jenkins. Available online: https://www.jenkins.io/ (accessed on 1 February 2020).
  3. ISO/IEC 25010; Systems and Software Engineering—Systems and Software Quality Requirements and Evaluation (SQuaRE)—System and software quality models. ISO: Geneva, Switzerland, 2011.
  4. ISO/IEC 25000; Systems and Software Engineering—Systems and Software Quality Requirements and Evaluation (SQuaRE)—Guide to SQuaRE. ISO: Geneva, Switzerland, 2014.
  5. Ito, J.; Yamaguchi, S.; Okazaki, K.; Yokosuka, S.; Kimoto, K.; Yamanaka, M.; Nagata, A.; Yamaguchi, T.; Hosoya, S. Quality Assurance by Quality Stepwise Refinement in Agile Development. Report on the Results of the Subcommittee Meeting of the Software Quality Control Research Group. 2018, pp. 137–144. Available online: https://www.juse.or.jp/sqip/workshop/report/at-tachs/2018/4_aqa_ronbun.pdf (accessed on 15 January 2022). (In Japanese).
  6. JIS X 25051; Software Engineering-Systems and Software Quality Requirements and Evaluation (SQuaRE)-Requirements for Quality of Ready to Use Software Product (RUSP) and Instructions for Testing. JISC: Tokyo, Japan, 2016.
  7. Cohn, M. The Forgotten Layer of the Test Automation Pyramid. Available online: https://www.mountaingoatsoftware.com/blog/the-forgotten-layer-of-the-test-automation-pyramid/ (accessed on 1 February 2022).
  8. ISO/IEC 25030; Systems and Software Engineering—Systems and Software Quality Requirements and Evaluation (SQuaRE)—Quality Requirements Framework. ISO: Geneva, Switzerland, 2019.
  9. GitHub. Available online: https://github.com/ (accessed on 1 February 2022).
  10. Atlassian. Available online: https://www.atlassian.com/ (accessed on 1 February 2020).
  11. Kato, D.; Shimizu, A.; Ishikawa, H. Quality classification for testing work in DevOps. In Proceedings of the 14th International Conference on Management of Digital EcoSystems (ACM MEDES 2022), Venice, Italy, 19–21 October 2022. [Google Scholar]
  12. MSTest. Available online: https://github.com/Microsoft/testfx-docs/ (accessed on 1 February 2021).
  13. NUnuit. Available online: https://nunit.org/ (accessed on 1 February 2021).
  14. Ranorex. Available online: https://ranorex.com/ (accessed on 1 February 2020).
  15. Kato, D.; Ishikawa, H. Develop quality characteristics based quality evaluation process for ready to use software projects. Com-put. Sci. Inf. Technol. 2016, 6, 9–21. [Google Scholar] [CrossRef]
  16. ISO/IEC 25051; Software Engineering—Systems and Software Quality Requirements and Evaluation (SQuaRE)—Requirements for Quality of Ready to Use Software Product (RUSP) and Instructions for Testing. ISO: Geneva, Switzerland, 2014.
  17. ISO/IEC/IEEE 29119-3; Software and Systems Engineering—Software Testing—Part 3: Test Documentation. ISO: Geneva, Switzerland, 2021.
  18. Kato, D.; Okuyama, A.; Ishikawa, H. Introduction of test management based on quality characteristics. In Proceedings of the 1st Inter-national Workshop on Experience with SQuaRE Series & Their Future Direction IWESQ 2019), Putrajaya, Malaysia, 2 December 2019. [Google Scholar]
  19. Shang, W. Bridging the divide between software developers and operators using logs. In Proceedings of the 34th International Conference on Software Engineering (ICSE‘12), Zurich, Switzerland, 2–9 June 2012. [Google Scholar]
Figure 1. ISO/IEC 25010 quality model for system/software product quality.
Digital 04 00012 g001
Figure 2. Test pyramid.
Digital 04 00012 g002
Figure 3. Created report class (upper is process and lower is operation. Square frame is developed area).
Digital 04 00012 g003
Figure 4. Easy visualization of test results.
Digital 04 00012 g004
Figure 5. Architecture of test results management (The red part is the process flow and the blue part is the test result management process).
Digital 04 00012 g005
Figure 6. Mapping quality characteristics to activities.
Digital 04 00012 g006
Table 1. Famous quality metrics for quality control.
Metrics TypesMetrics
Defect densityRatio per page of design documents
Ratio per line or step of codes
Ratio per test cases
Defect removal ratesRemoval rate per phases
Removal rate per components
Removal rate per test cases
Pass ratesPass rates per test sets
Pass rates per test cases
Pass rates per function points
CoveragesDocuments review coverage
Test coverage per line of codes
Test coverage per test cases
Table 2. Famous quality metrics for quality control.
ActivitiesQuality CharacteristicsQuality Sub-Characteristics
Activities in the Whole Development Process
Coding RulesSecurityConfidentiality
Integrity
MaintainabilityModularity
Reusability
Modifiability
Testability
Design ReviewFunctional SuitabilityFunction completeness
Function correctness
ReliabilityMaturity
Availability
Fault tolerance
Recoverability
MaintainabilityTestability
Inspection ReviewReliabilityMaturity
Activities in CI process
Static AnalysisReliabilityMaturity
SecurityIntegrity
MaintainabilityAnalysability
Unit test
Integration test
Regression test
Functional SuitabilityFunction completeness
Function correctness
Function appropriateness
ReliabilityMaturity
E2E testFunctional SuitabilityFunction completeness
Function correctness
Function appropriateness
UsabilityOperability
User error protection
ReliabilityMaturity
Trough out the CI process
Measurement of processing timePerformance EfficiencyTime behavior
Resource utilization
MaintainabilityAnalysability
Activity in CD operations
install testPortabilityInstallability
Table 3. Quality covered by CI/CD pipeline process.
Quality CharacteristicsQuality Sub CharacteristicsEvaluation by
Function SuitabilityFunctional Completeness
Unit test
Static analysis (SAST)
Integration test
Dynamic analysis (DAST)
Performance test
Regression test
E2E test
Functional Correctness
Functional Appropriateness
Performance EfficiencyTime Behaviour
Resource Utilization
Capacity
CompatibilityCo-existence
Interoperability-
UsabilityAppropriateness Recognizability-
Learnability-
Operability
Unit test
E2E test
User Error Protection
User Interface Aesthetics
Accessibility-
ReliabilityMaturity
Unit test
Static analysis (SAST)
Integration test
Dynamic analysis (DAST)
Performance test
Regression test
E2E test
Test results management
Availability
Fault Tolerance
Recoverability-
SecurityConfidentiality
Static analysis (SAST)
Dynamic analysis (DAST)
Regression test
Integrity
Non-repudiation-
Authenticity-
Accountability-
MaintainabilityModularity
Covered by the development process and project charter
Reusability
Analysability
Modifiability
Testability
PortabilityAdaptability-
Installability
CD process
Replaceability-
Table 4. Example of quality analysis classified by quality characteristics.
Quality CharacteristicsQuality Analysis
Function
suitability
Functional suitability is ensured because the functional requirements that satisfy the functional requirements are considered in the design document, implemented, and confirmed to work properly through various tests.
Performance
efficiency
Compared to the operation before the enhancement, the performance of the functions implemented in the previous version has not deteriorated, and the import of new reports, a new function, is comparable to the import speed of the report functions implemented in the previous version, thus meeting the performance requirements. As load and capacity requirements have not been verified for this project, it can be concluded that ensuring only performance efficiency is not a problem.
CompatibilityThere are no problems with interfacing with other systems, such as EXCEL output and ZIP compression, and compatibility is ensured because there are no problems with co-existence with other systems in the same environment and no code-level implementation that would affect others.
UsabilityThe enhancement does not create new screens but enhances existing screens and identifies no new usability issues, ensuring usability.
ReliabilityReliability is ensured because functional requirements are met throughout the process:
requirements->specification->design->implementation->testing
The quality of the requirements developed during the requirements review is ensured by the associated activities, and any bugs found during the various reviews and tests are fixed.
SecurityThe same level of security as the previous version has been confirmed by testing. The same level of security as the previous version is guaranteed.
MaintainabilityMaintainability is ensured because it is based on coding conventions, various documents are written in the same format as the previous version, and the level of description is written at the same or higher granularity than the previous version.
PortabilityThe installation procedure is the same as the previous version. Portability is, therefore, guaranteed.
Disclaimer/Publisher’s Note: The statements, opinions and data contained in all publications are solely those of the individual author(s) and contributor(s) and not of MDPI and/or the editor(s). MDPI and/or the editor(s) disclaim responsibility for any injury to people or property resulting from any ideas, methods, instructions or products referred to in the content.

