Article

Aleppo Pixelated: An Urban Reading through Digitized Historical Maps and High-Resolution Orthomosaics Case Study of al-ʿAqaba and al-Jallūm Quarters

Andreas Pittas Art Characterization Lab (APAC), The Science and Technology in Archaeology and Culture Research Center (STRAC), The Cyprus Institute, 2121 Nicosia, Cyprus
Digital 2024, 4(1), 152-168; https://doi.org/10.3390/digital4010007
Submission received: 30 November 2023 / Revised: 16 January 2024 / Accepted: 18 January 2024 / Published: 23 January 2024

Abstract

:
This article relies on a combination of digital and analog data to analyze the 2D urban development of al-ʿAqaba and Jallūm districts in the Old City of Aleppo. The dataset consists of vectorized historical maps of the city spanning various historical periods. The oldest map in the collection dates back to the 1900s. Additionally, there are high-resolution orthomosaics created from a 3D model obtained through Terrestrial Laser Scanning (TLS) and Aerial Photogrammetry techniques. Through the analysis and integration of these various data types, the article proposes an analog-digital workflow that tracks the alterations in the urban fabric of the designated study area. The analysis primarily examines the alterations in the city’s two-dimensional layout and the distribution of mass and void. Tracking the changes in the street network of the studied area is the main goal of this research, along with recognizing the spatial changes in the built environment. The article identified changes in both the open spaces and the street layout.

1. Introduction

The digitization of historical analog maps serves as reference points to better understand and trace the development of historical centers. For example, the digitization of historical maps allows researchers to compare the layout of cities from different time periods. By overlaying these maps, it is possible to analyze how historical centers grew over time and identify those urban expansions. This process provides invaluable insights into the factors that have shaped the development of cities, such as the influence of trade routes, political and religious influences, and population growth. However, this process poses several challenges, with the biggest one being the limited survey techniques used to produce these maps.
Equally important is the use of digital technology and its innovative approaches for studying and analyzing the historical urban fabric, particularly in cases of significant damage. It not only allows for rapid field acquisition and off-site damage assessment, but also informs post-disaster decisions, restoration, and conservation projects. Additionally, it enables tracking the progress and quality of such projects and provides insights into the past and a broader context of the 3D spatial development of a city.
The Old City of Aleppo is an outstanding example of urban forms in the Mediterranean region. The city is characterized by a complex network of narrow and winding streets that reflect an older palimpsest from the Hellenistic period [1]. Still, some researchers posit that the conscious planning of the city goes back to the Bronze Age [2].
This study takes advantage of technological leaps in the field of 3D documentation, visualization, and analysis. It utilizes a hybrid point cloud acquired through Terrestrial Laser Scanning and Aerial Photogrammetry to compare and identify the 2D changes of the urban fabric in two districts in the Old City of Aleppo. The study area encompasses al-Jallūm and al-ʿAqaba quarters, from the Umayyad Mosque in the east and north to Bāb Qinnasrin in the south and Bāb Antakia in the west.

2. State-of-the-Art

With the rapid development of photogrammetric and laser mapping, both aerial and terrestrial, acquiring high-resolution spatial information is becoming easier, faster, and more effective [3,4]. The spatial data are finding their applications in various domains. One of the most prominent is in urban heritage.
Using digital models in urban heritage studies has been an ever-growing trend. Initially, reality-capture models provided the opportunity to create aesthetic and accurate historical models of cities [5]. However, their use has developed to be a tool in smart-city mapping and land administration [6].
Essentially, it can be considered the ideal platform for implementing various analyses, such as urban thermal environments for investigating thermal comfort [7], solar potential estimation [8], urban accessibility [9], geometric analyses for conservation and valorization purposes [10], and designing interactive experiences [11]. One of the most interesting applications of 3D urban data sets is applying feature-based and deep learning methods to extract information about roads and traffic that can be used for the creation of High-Definition (HD) maps necessary for the development of autonomous driving and traffic visibility evaluation [12].
Cartographic representations play a pivotal role in the design, planning, and implementation of any restoration or renovation work. Historical maps provide invaluable information about the development and the state of conservation of an urban area. The transition into the digital platform has brought forward extensive research concerning the methods of transforming, geo-referencing, and disseminating old maps in the digital age. Lia Maria Papa explored the innovative techniques for cartography in the 19th century and the use of technology to design innovative approaches to extract valuable information from old maps [13]. Milan Talich discusses requirements for the digitization of old maps, as well as the different workflows for the online geo-referencing of said maps [14].
An example of the use of old maps in tracking urban development is the work of Shujing Dong and Danjie Shen [15]. The authors suggest the creation of a digital historical urban landscape information database in Luoyang, China, in different historical periods, based on information available in historical maps. A group of researchers also investigated the reconstruction of the landscape through old maps of Katowice, Poland [16].
Closer to home, and in the case of war-afflicted historical centers, the diversity of the damage has rendered the traditional methods of survey, documentation, and analysis very longsome, unpractical, and possibly inaccurate. Therefore, 3D urban surveys can be used to conduct in-depth analysis of other aspects of the urban spaces, such as urban density and monitoring the change in mass and void. Inherently, “as-built” models offer an increased accuracy of the results of the analysis because of the reliability and precision of the models, as well as the wide range of available tools and plugins that can be used for analysis. Recent restoration projects in Aleppo are already utilizing digital technology such as Terrestrial Laser Scanning (TLS) and Photogrammetry as a base and/or supplement for the projects’ workflows [17,18].

3. Materials and Methods
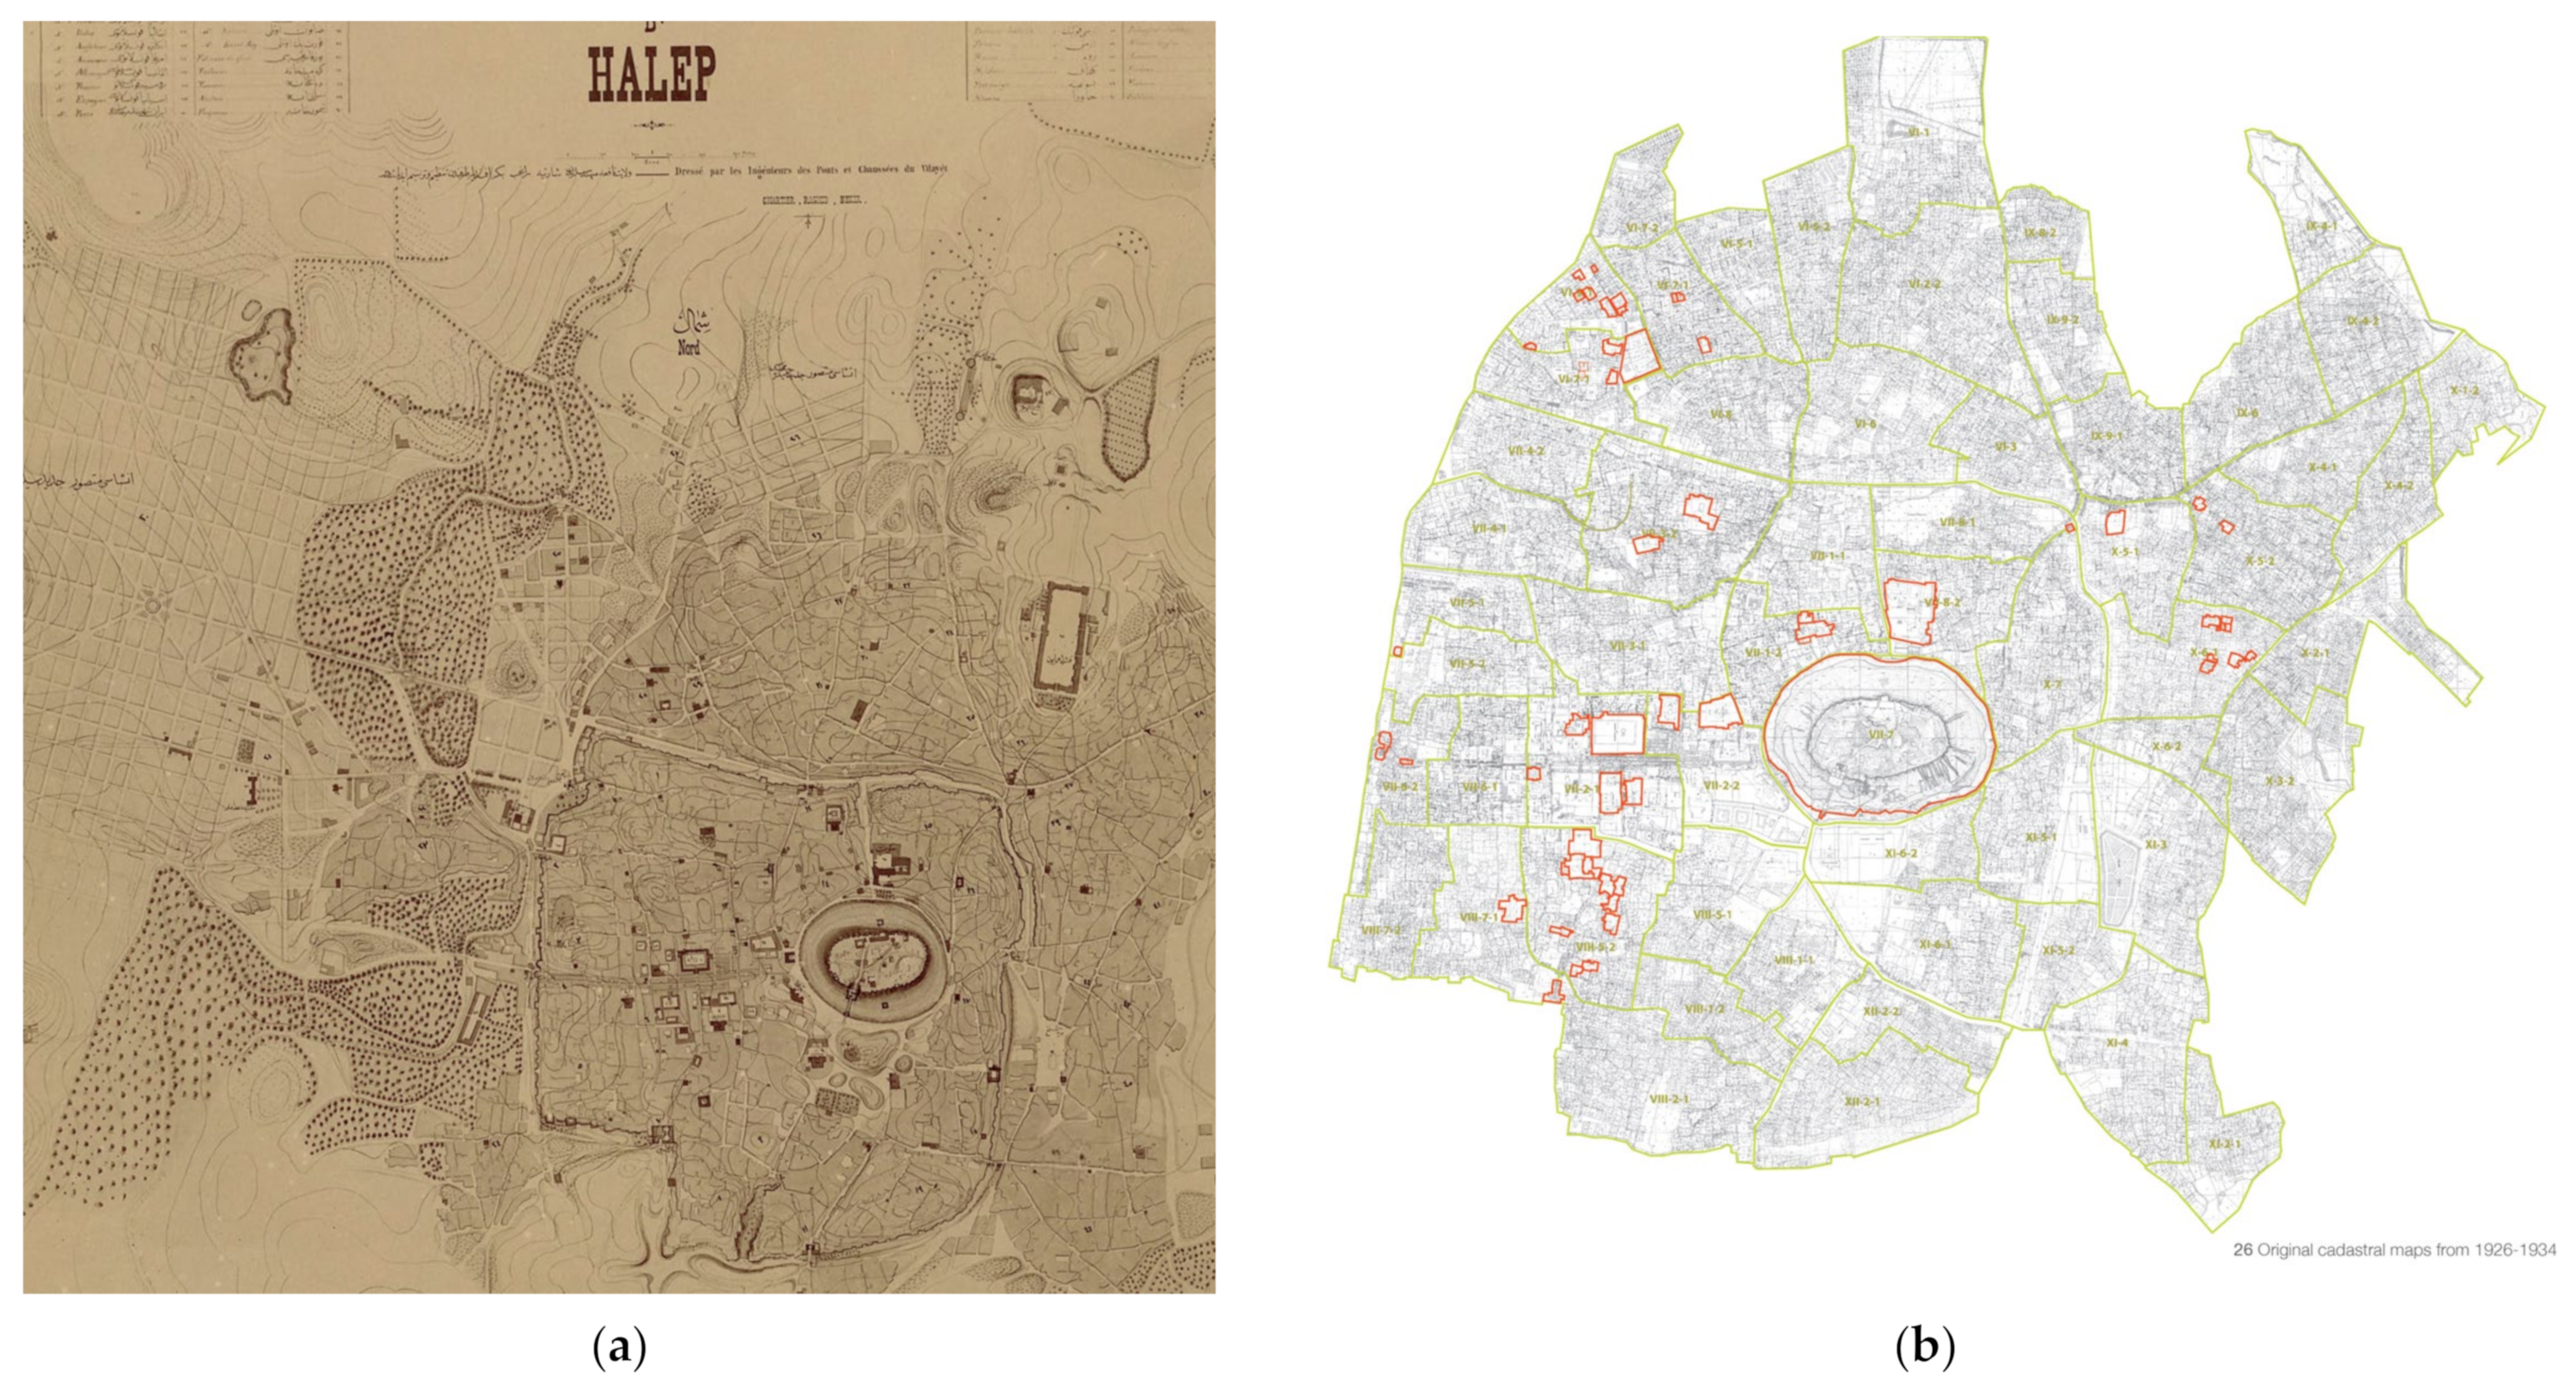
Aleppo’s layout is characterized by a street grid that still preserves the palimpsest of the Hippodamian plan of Hellenistic Aleppo [1]. Various maps were prepared for Aleppo, the earliest of which was prepared by Carsten Niebuhr in 1778 and published in his book titled, Travels through Arabia and other countries in the East [19]. Despite the limited accuracy and the lack of scale, it is the first cartographic map prepared for Aleppo, outlining the street network, built blocks, and the most important urban elements of the city [19].
By the late 18th century, the use of the accurate topographical survey was a necessity, mainly to facilitate the planning of infrastructure projects, recording and organizing of ownership rights, and overseeing the urban growth of any urban center. Various government agencies have mapped Aleppo throughout different historical periods, ranging from the Ottoman era to the French Mandate period (1919–1946), as well as in the 20th and 21st centuries [19]. Researchers have also created maps of the city during their studies [20].
Aleppo has been the subject of many urban and architectural studies by renowned researchers [20] such as Heinz Gaube and Eugen Wirth [21], Jean-Claude David [22], Jean Sauvaget [23], and Giulia Annalinda Neglia [24,25]. These studies heavily relied on 2D plans and sections to visualize the urban development of Aleppo. This reliance is understandable given the technological limitations of the 19th and 20th centuries in terms of surveying, modeling, and visualization.
This study relies on the combination of three maps: the Ottoman map of Aleppo, the French cadastral maps of the 1930s, and the maps of the Aleppo Archive in Exile project 2017 (Table 1).
The Ottoman map of Aleppo is the oldest map of the city with scale reference. Gaube and Wirth mentioned it, but it was not accessible to them with full resolution [21]. This map is now digitally available through the website of the National Library of France under the title “Plan Gabriel de la ville d’Halep” [26]. In the library archives, the map is attributed to the 18th century without providing a definite date. However, Gaube and Wirth suggest it is from 1900, and this paper follows suit. They also mention that it was prepared by the Ottoman Road and Bridges engineers, with a scale of 1:5000 (Figure 1a) [21].
This map depicted buildings with the earliest drawing of the contour lines, which makes it one of the most valuable topographical resources of the city. The map was never studied in relation to urban fabric development. Therefore, it can provide enhanced insight into the transformation of quarters, cul-de-sac formation, and changes in void and mass ratio. The map has visible deformation in the center (Figure 1a), therefore, the two maps (the French cadastral maps of the 1930s and the maps of the Aleppo Archive in Exile project 2017) were chosen to facilitate the referencing process of the Ottoman map and the survey orthomosaic.
The French Cadastral maps of the 1930s offer an accurate survey of the city [22] before the drastic 20th-century changed the fabric of the city as a result of the master plans of Gutton and Banshoya (Figure 1b) [27]. The maps combine dense visual information prepared for Aleppo, such as the parcels, courtyards, and the function of buildings.
The third map, prepared by the Brandenburg University of Technology (BTU) under the Aleppo Archive in Exile project [28], was chosen because of the bulk of information and metadata incorporated in the maps (Figure 1c). They include cartographic information about courtyards, parcels, and a number of the most important buildings and their detailed floor plans [28].
By using three maps of the city from different time periods with different information, the comparisons with survey orthomosaic are not only easier in terms of identifying similar features across the cartographic dataset but also enrich the axes of comparisons. It provides insight not only into the post-war damage but also into the prominent changes in the study area in the past 100 years.
Therefore, this research aims to apply a digital workflow of the study of the urban transformation of that section of Aleppo in terms of the quantitative changes to the street network and mass-and-void distribution. For the street networks, the research aims to identify the change of orientation, the addition of new streets, the closure of streets, and the creation of cul-de-sac streets. In terms of mass-and-void distribution, this research aims to pinpoint the change in the size and distribution of open spaces, the relation between mass and void, and changes in the layout of the city in response to the changes in the streets. The unit of choice for the analysis is meters.
Table 1. A comparison between the various maps used in the research.
Map NameDateScaleAccuracyOriginMethod of Acquisition
The Ottoman map18th1:5000There is a noticeable deviation in the linearity of streets.The Ottoman Road and Bridges EngineersPossibly made through topographic surveys.
The French cadastral maps 1930s No available information.A team headed by C. Duraffourd [21]Topographic Surveys.
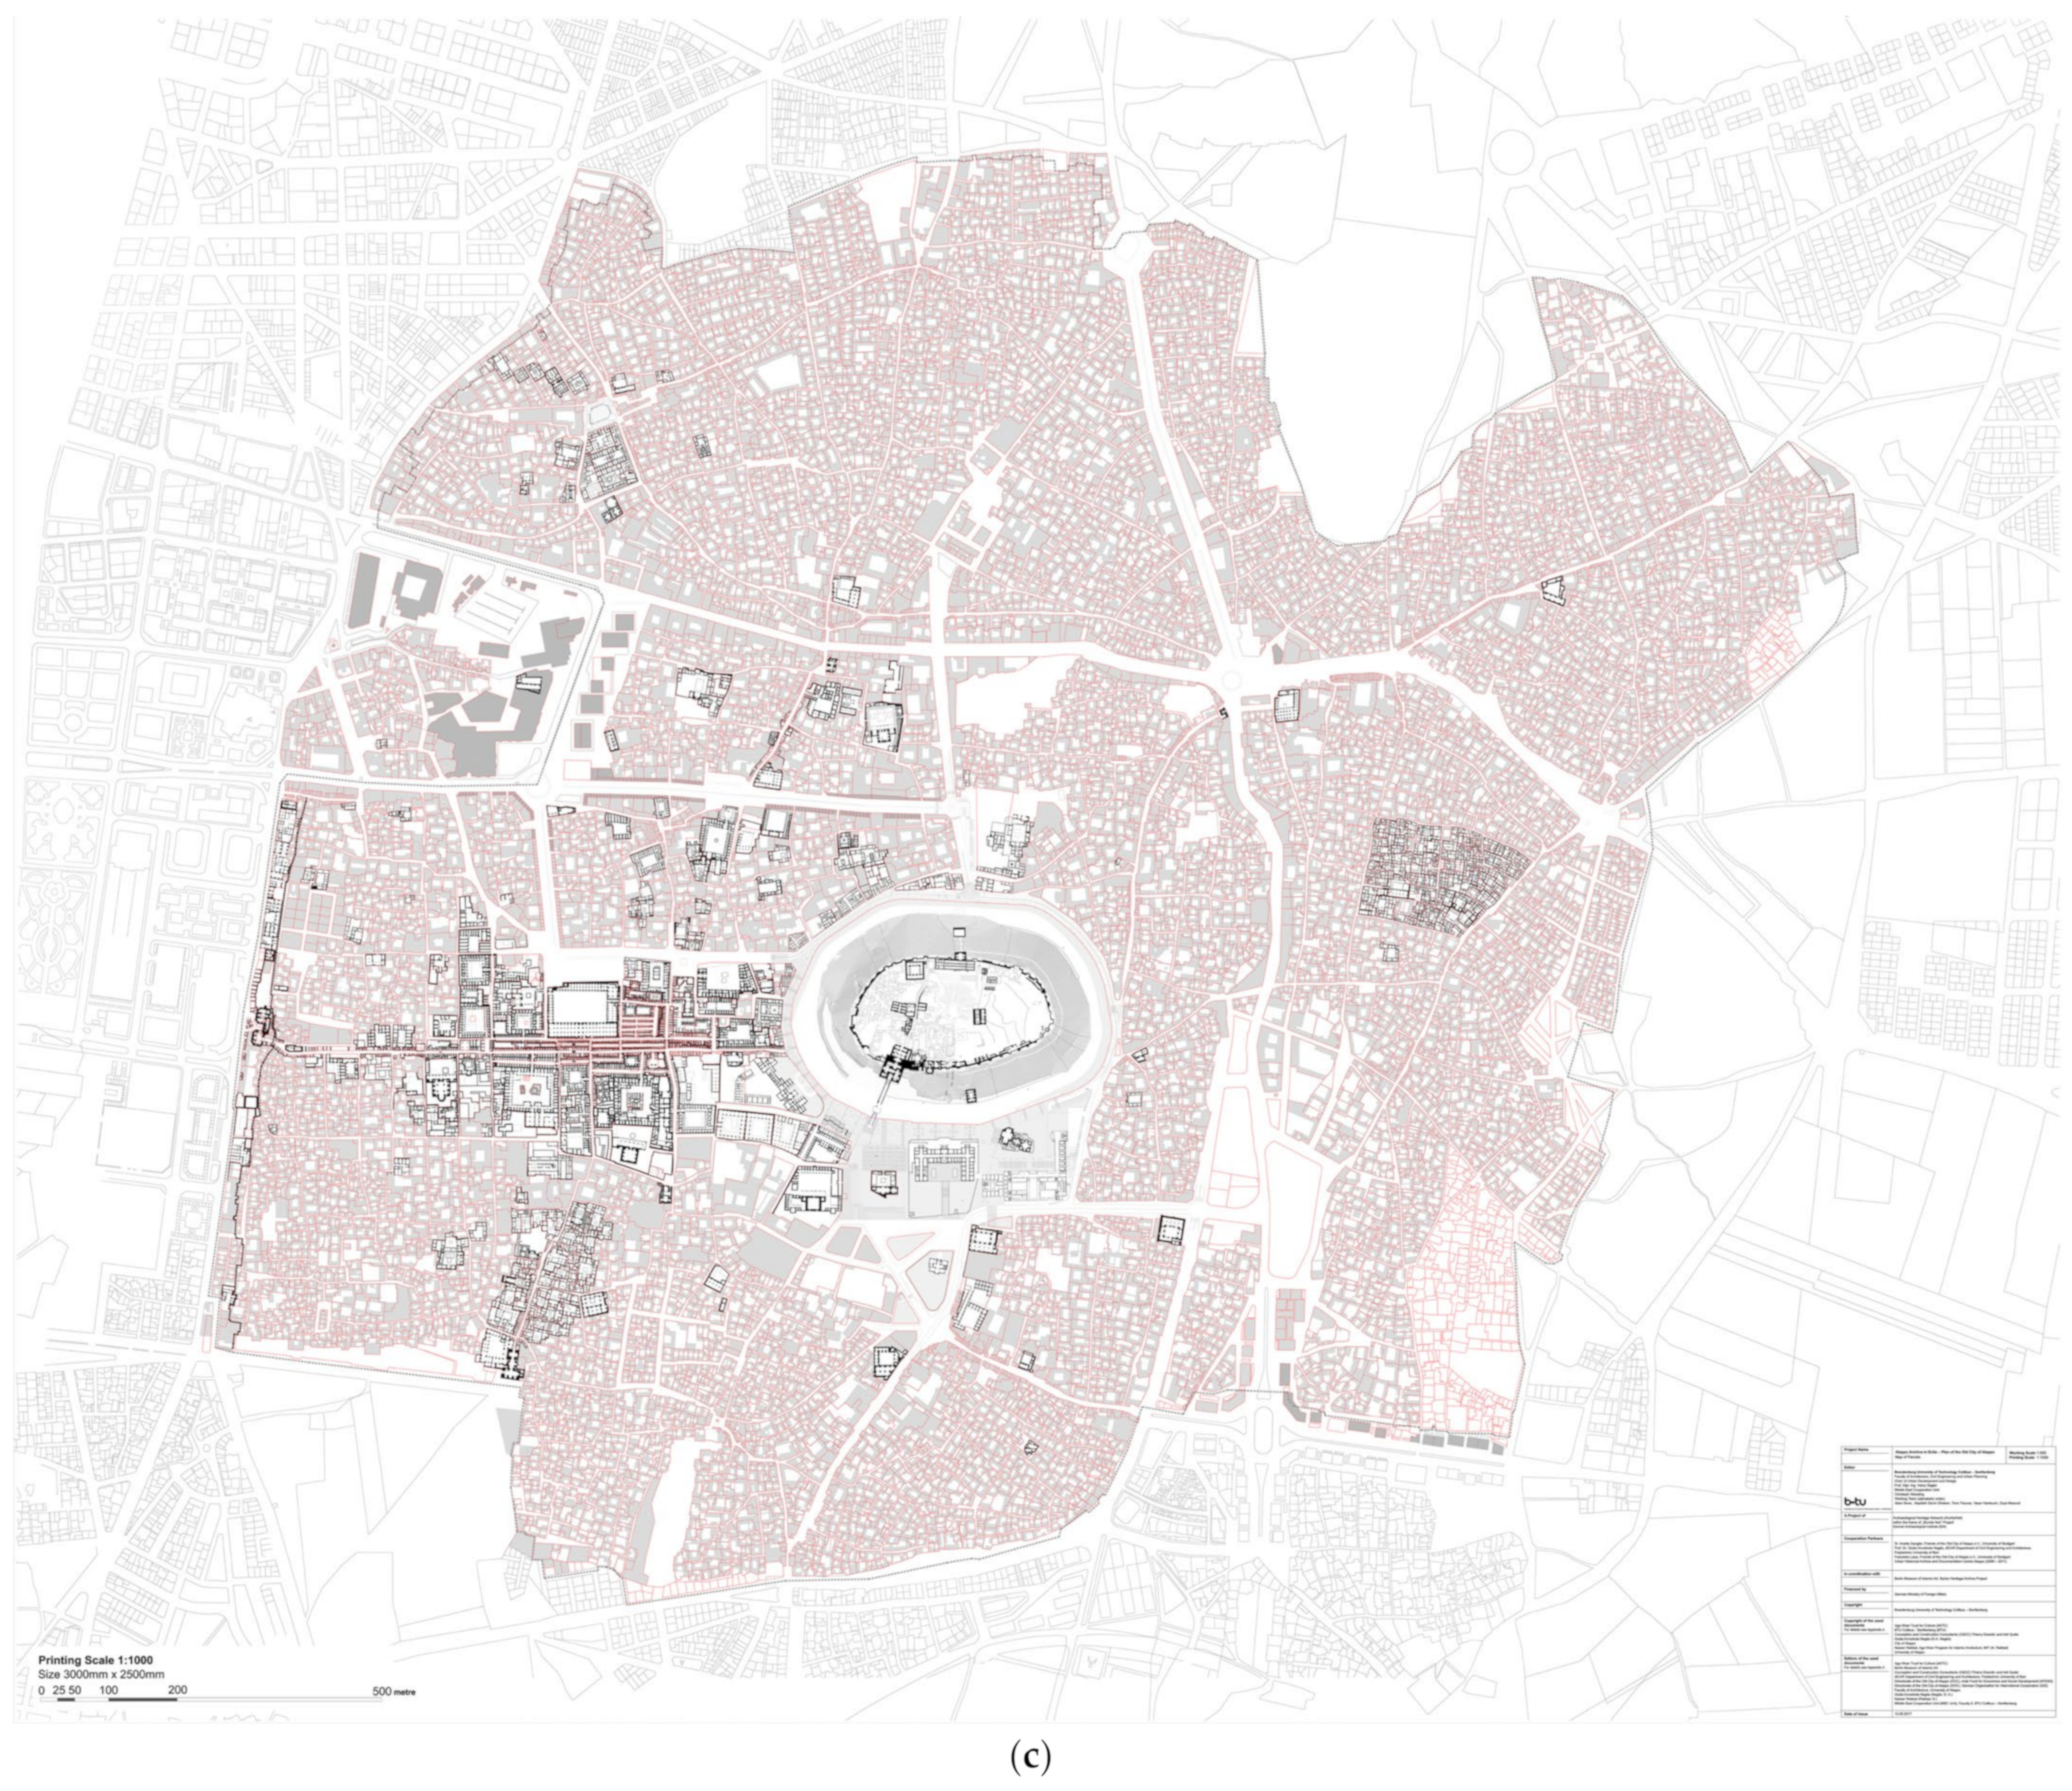
Aleppo Archive in Exile—Plan of the Old City of Aleppo20171:1000No available information.The Brandenburg University of Technology (BTU) [28]Combination of the following survey maps of Aleppo: 1-Aleppo Cadastral Plan. In Syrian Heritage Archive Project. Adapted from DOC, GIZ (eds.) (1997–1998) Digitized Cadastral Plan of Aleppo based on French Cadastral Plans of Old Aleppo (1926–1930).
2-Directorate of the Old City of Aleppo (ed.) Aleppo Cadastral Plan with Courtyard. Urban Historical Archive and Documentation Center for Aleppo.
Digital Orthomosaics20181:11:1 ± 20 cmThe AuthorLaser scanning and Aerial Photogrammetry

3.1. Digital Workflow and Methodology

The digital workflow was developed on three fronts: first, the hybrid point cloud was acquired, and processed, and the orthomosaic was generated. Second, the historical cartographic dataset was vectorized. Third, the analysis workflow was designed to combine all the maps and orthomosaic. Since the analysis aims to pinpoint the two-dimensional changes in the city, the process involves vectorizing the raster maps and geo-referencing them based on the survey map in QGIS. By combining these datasets and utilizing appropriate analysis techniques, valuable insights can be gained regarding changes to the built environment.

3.2. Hybrid Point Cloud Acquisition and Processing

The field survey was conducted in 2018 as part of the Ph.D. dissertation titled “Digital Reconstruction of The Urban Morphology of The Old City of Aleppo: Between the Mamluk and the Post-War City, the case of “Jallūm and al-ʿAqaba Districts. A parametric Study”. During the survey, 1823 scans were acquired using FARO focus 330X (The instrument was donated to the Directorate of Antiquities, Syria by CYARK during the collaboration for project ANQA. Available online: https://anqaproject.org/#1) with various resolution and quality settings, depending on the level of detail of the reordered areas [29].
The scans were then processed in Autodesk Recap, sub-sampled to a target resolution of 5 cm, and exported as a point cloud. The aerial photogrammetry data was acquired from a private drone pilot who used DJI Phantom 4 to record the area in early 2018. The data set included 3600 geo-referenced photos. The photos were preprocessed in Adobe Lightroom Classic (10) and then processed in Agisoft Metashape (1.7.4) to generate a dense point cloud. However, since the drone photos were not performed for the purpose of photogrammetry, they were not distributed homogeneously. Therefore, small blank spots appear in the orthomosaic (Figure 2). These blank areas were compensated for by the laser scans and by generating another point cloud from videos taken by the same drone at the time of data acquisition. The missing data set is compromised solely because of roofs that can be annexed to the available data set at any moment. More importantly, for the scope of the urban study, it does not majorly affect the accuracy of the alignment (Figure 2).
The laser and photogrammetric point clouds were combined in Agisoft Metashape, then meshed, and textured to generate the final orthomosaic. As the orthomosaic includes coordinate information, it was used for geo-referencing the vectorized cartographical dataset.
A detailed description of the data acquisition process and its challenges were presented and published in the 26th International Conference on Cultural Heritage and New Technologies (CHNT26) [29].

3.3. Aligning, Geo-Referencing and Superimposing Datasets

The Ottoman map is of great morphological importance. It is the oldest map of Aleppo, based on an on-site professional geometrical survey at the end of the Ottoman rule of Syria. The map incorporates details of the walls, important buildings, and elevation data. It offers valuable information about the expansion of the city. However, there is a clear deformation in the map, causing the central section of the city to appear curved (Figure 3a). This was probably caused by the early surveying techniques and is unlikely due to the digitization process.
It portrays the cul-de-sac streets and the final development of the city quarters within the walls before the destructive urban projects of the 19th century. However, the portrayal of the courtyard is not comprehensive, as only a few buildings include their interior courtyard in the map.
The initial stage of the digitizing workflow was tracing the intramural section of the Ottoman map (Figure 3b), the French cadastral map, and the map of BTU Cottbus in Autodesk AutoCAD. The vectorized versions were then imported to QGIS to be geo-referenced. They were aligned and geo-referenced manually, using the drone coordinates of orthomosaic (Figure 4).
The easier alignment to begin with was the alignment of the French cadastral map and the BTU map, with orthomosaic from the field survey. Five reference points were selected from different areas on all maps; then a linear transformation was applied (Figure 4). Unlike previous processes, the geo-referencing of the Ottoman map was not as straightforward.
Aligning the Ottoman map to orthomosaic proved to be difficult because of the curved distortion in the center, the tilting distortion around the main souk, and the post-war destruction that compromised possible alignment points. To simplify this task, the Ottoman map was aligned with the BTU map, as it was easier to identify common elements between the two maps.
A testing protocol was developed to allow for an accurate placement of common points or Ground Control points (GCPs). The process revolves around testing different points on the Ottoman map that are more likely to have remained unchanged. Different combinations of points were tested to achieve the best superimposition with the least distortion and best correction of the deformation. Two transformations were tested using 160 (GCPs).
The first transformation was “Polynomial 3” while the other was the “Thin Plate Spline” (Figure 5a,b). The former resulted in moderate superimposition and correction of the deformation of the map but with significant distortion outside the studied area. Figure 5c displays values representing the errors of GCPs when applying the “Polynomial 3” transformation. With the latter option, the superimposition was improved, and the control over correcting the deformation was enhanced within the studied area. Considering the challenges that were discussed, the alignment result appeared to have an acceptable level of accuracy (Figure 6).
At this stage, a comprehensive layered map of Aleppo is created. It encompasses the prominent cartographic data of Aleppo, where each layer complements different missing elements of other maps. Besides the selected base maps, several aerial photographs were aligned in the same file, such as the aerial photograph taken by Michel Ecochard in 1936 [30] and images from the declassified archive of the Spy-Satellite “Corona” taken between 1968–1970 [31]. The alignment process allowed accurate tracking of the spread of the high-rise buildings, the division of courtyards, and new commercial and residential constructions.

4. Results

The Ottoman map not only documented the major streets in the studied quarters but also included some of the courtyards, particularly those belonging to important buildings such as Khan al-Jumruk (Figure 6b, number 1), al-Bahramiyya Mosque (Figure 6b, number 2) and The Umayyad Mosque. Additionally, the map suggested the presence of multiple defensive bastions positioned along the city walls, a detail that aligns with Arabic historical accounts [32,33]. While the general layout is preserved, there are several new streets and cul-de-sac streets (Figure 7). We can recognize that the biggest loss in mass is the removal of the area north of the Umayyad Mosque to create the road and the square in front of the mosque, as a result of the successive masterplans of André Gutton in 1954 and Gioji Banshoya in 1974 [34].
From (Figure 7), we can classify the 2D morphological changes as the following:
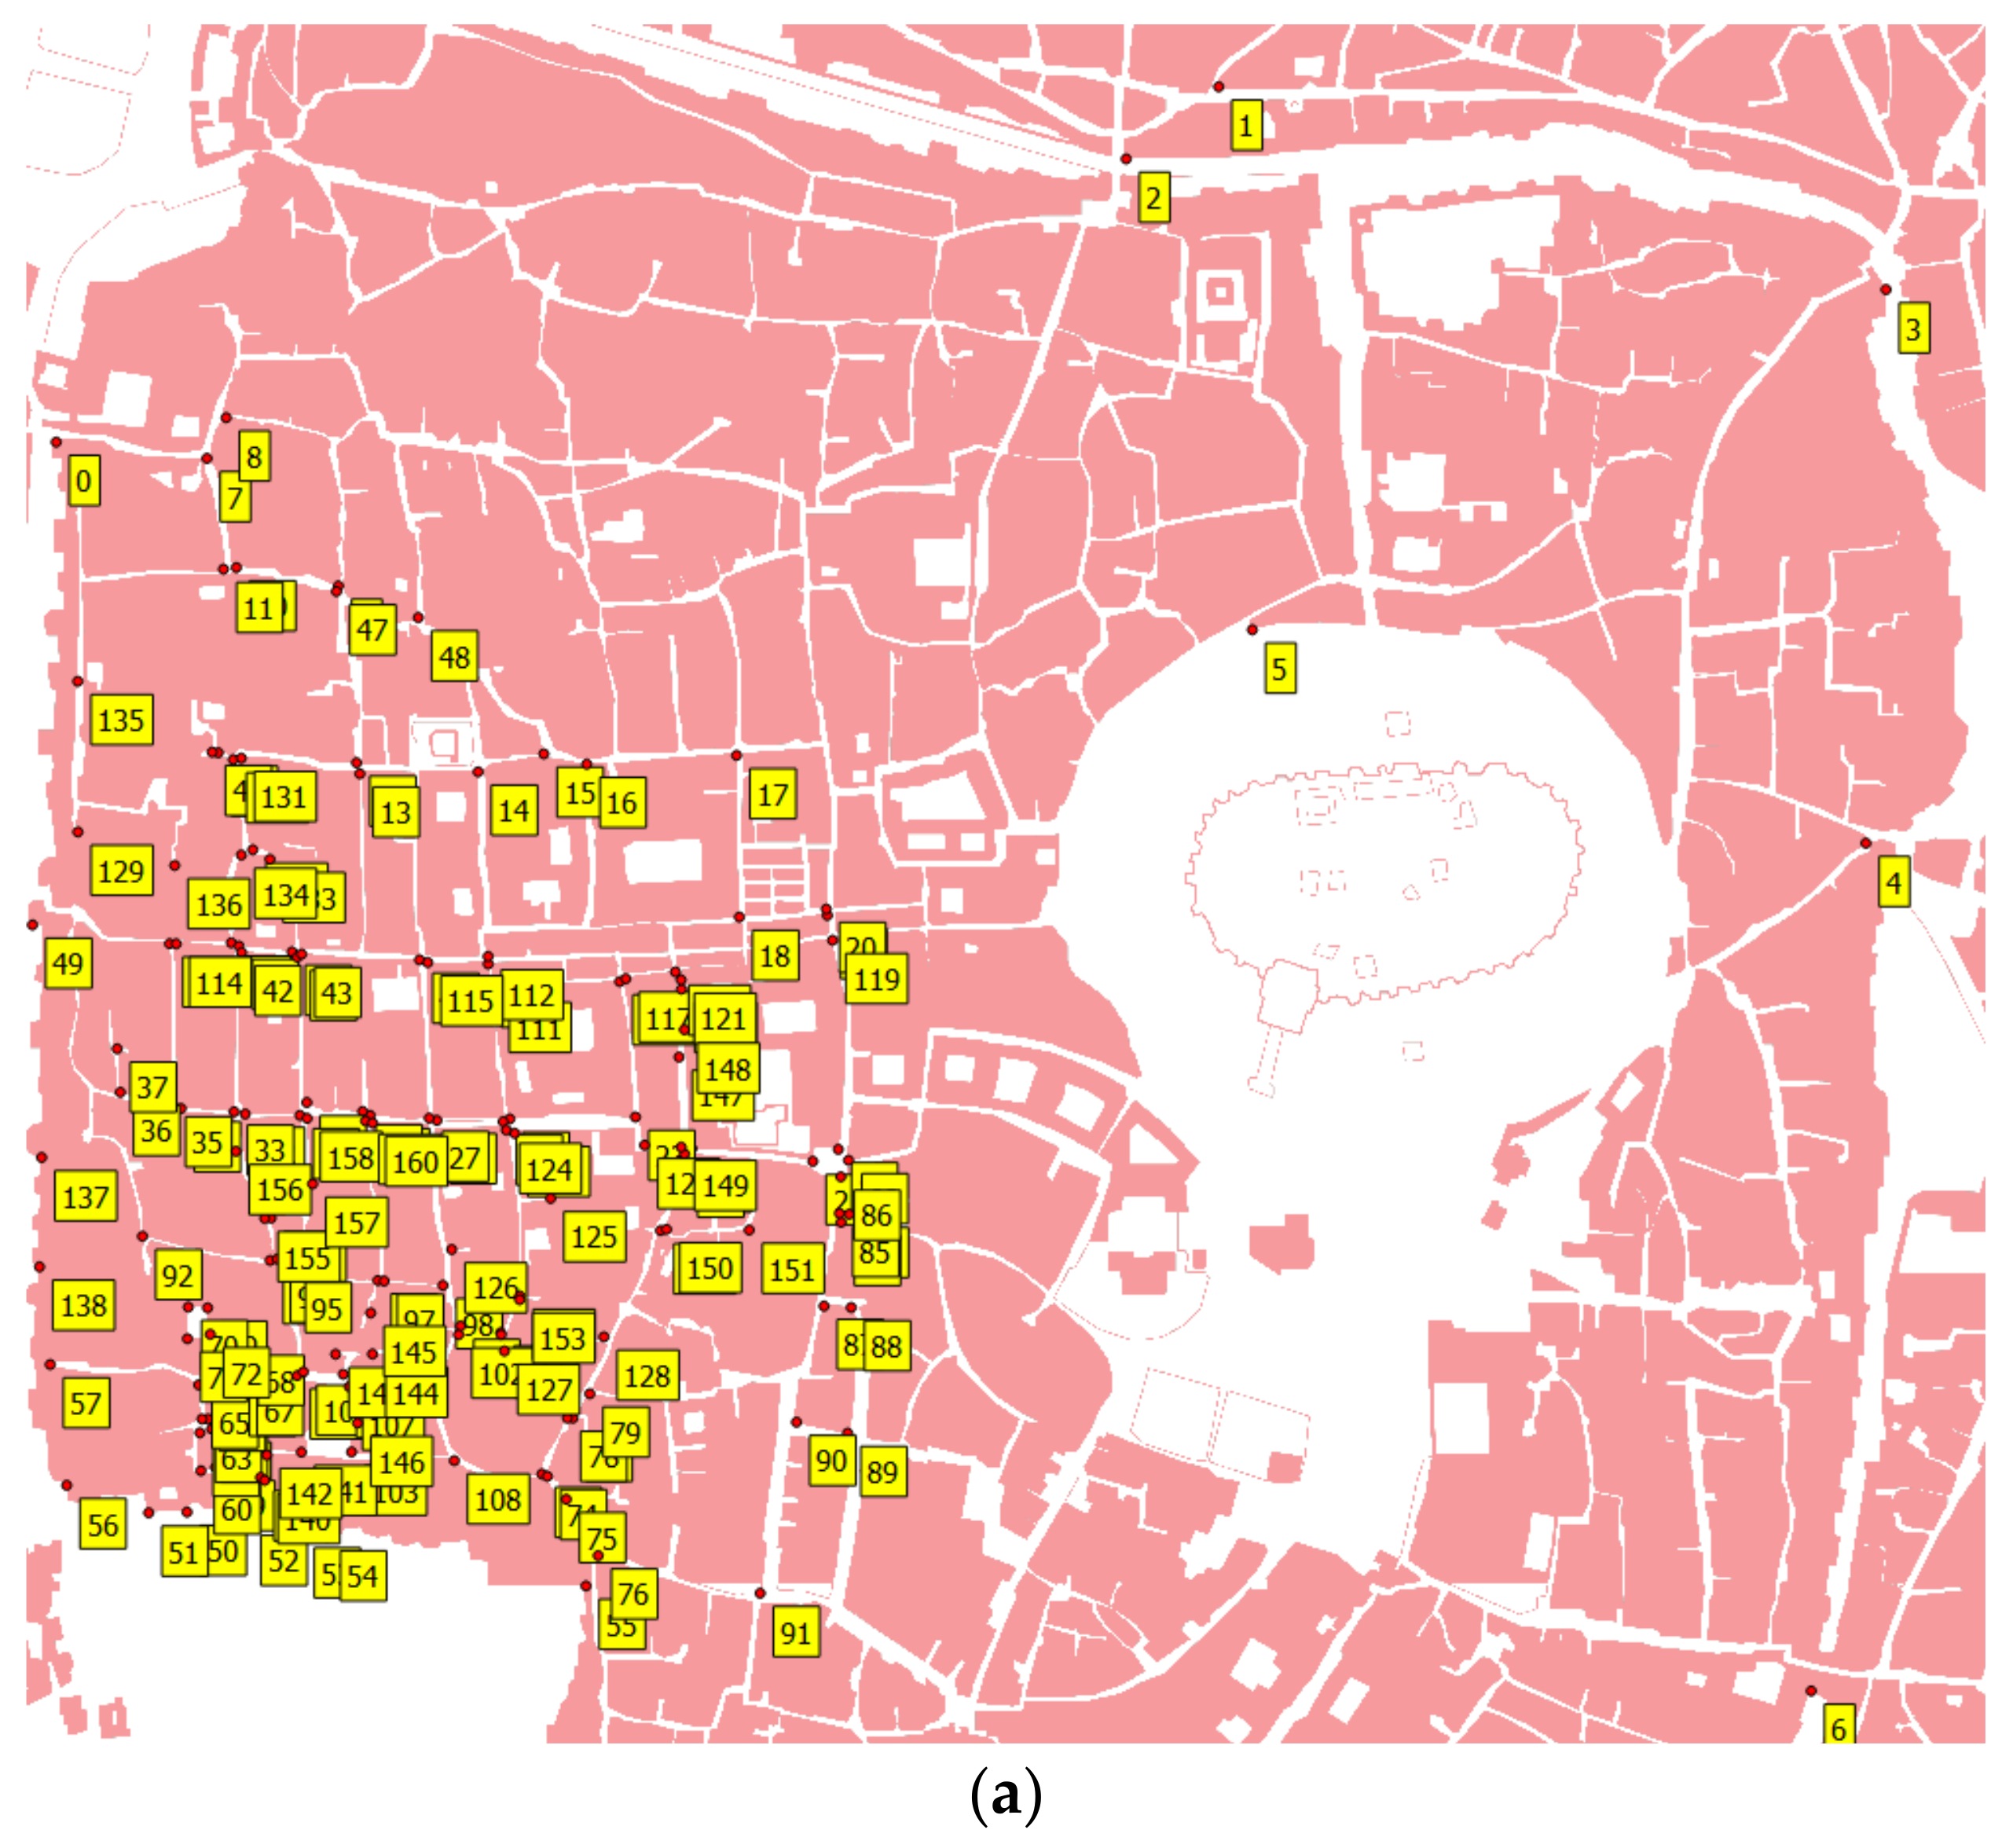
  • The addition of cul-de-sac streets or new streets: The layout of the cul-de-sac streets is mostly preserved, particularly those located behind the city walls. However, there are two notable differences when comparing the modern map to the historical one. Firstly, the street directly behind the walls of the city (Figure 7, number 1) was a cul-de-sac that was extended until Bāb Antakiya. The perpendicular street (Figure 7, number 4) was also extended to meet the street parallel to the wall (Figure 7, number 1). Other cul-de-sac streets that were extended are visible in Figure 7, number 3, 28. However, street number 28 can either be a cul-de-sac that was converted to a street, or this representation could mean that the existing covered section of the street named “Ṣibāṭ Sūdān” was extending further.
  • New streets also emerged further separating the fabric (Figure 7, number 5, 6). Street 2 which is the wide street leading towards the higher elevation of al-ʿAqaba (Figure 7, number 2) is not visible in the Ottoman map. However, it seems unlikely that it did not exist due to the different elevations around its sides and the fact that it borders an open space number (20). At al-Shūʽaybiyya Mosque (Figure 6b, number 4), two streets diverge from each other (Figure 7, below area 20), which is only represented in the modern map.
  • The new streets and the extended cul-de-sac streets resulted in separating several insulae, especially the section of Tallet al-ʿAqaba behind the wall. It was separated into six distinct blocks that also accommodated high-rise buildings despite its initial advantageous elevation. Another division of blocks is visible around streets numbers 8, 10, 11, 12, 13, 14, 16,18, and 22. While added cul-de-sac streets can be observed in Figure 7, numbers 7, 9, 17, 21, 23, 24, 25, 26, 29, 30, 31, 32, 33, and 34. Street number 27 represents a unique example of a street that does not correspond to a modern street. It is possible that it is another surveying error, and this street was the one directly behind the western walls of the city.
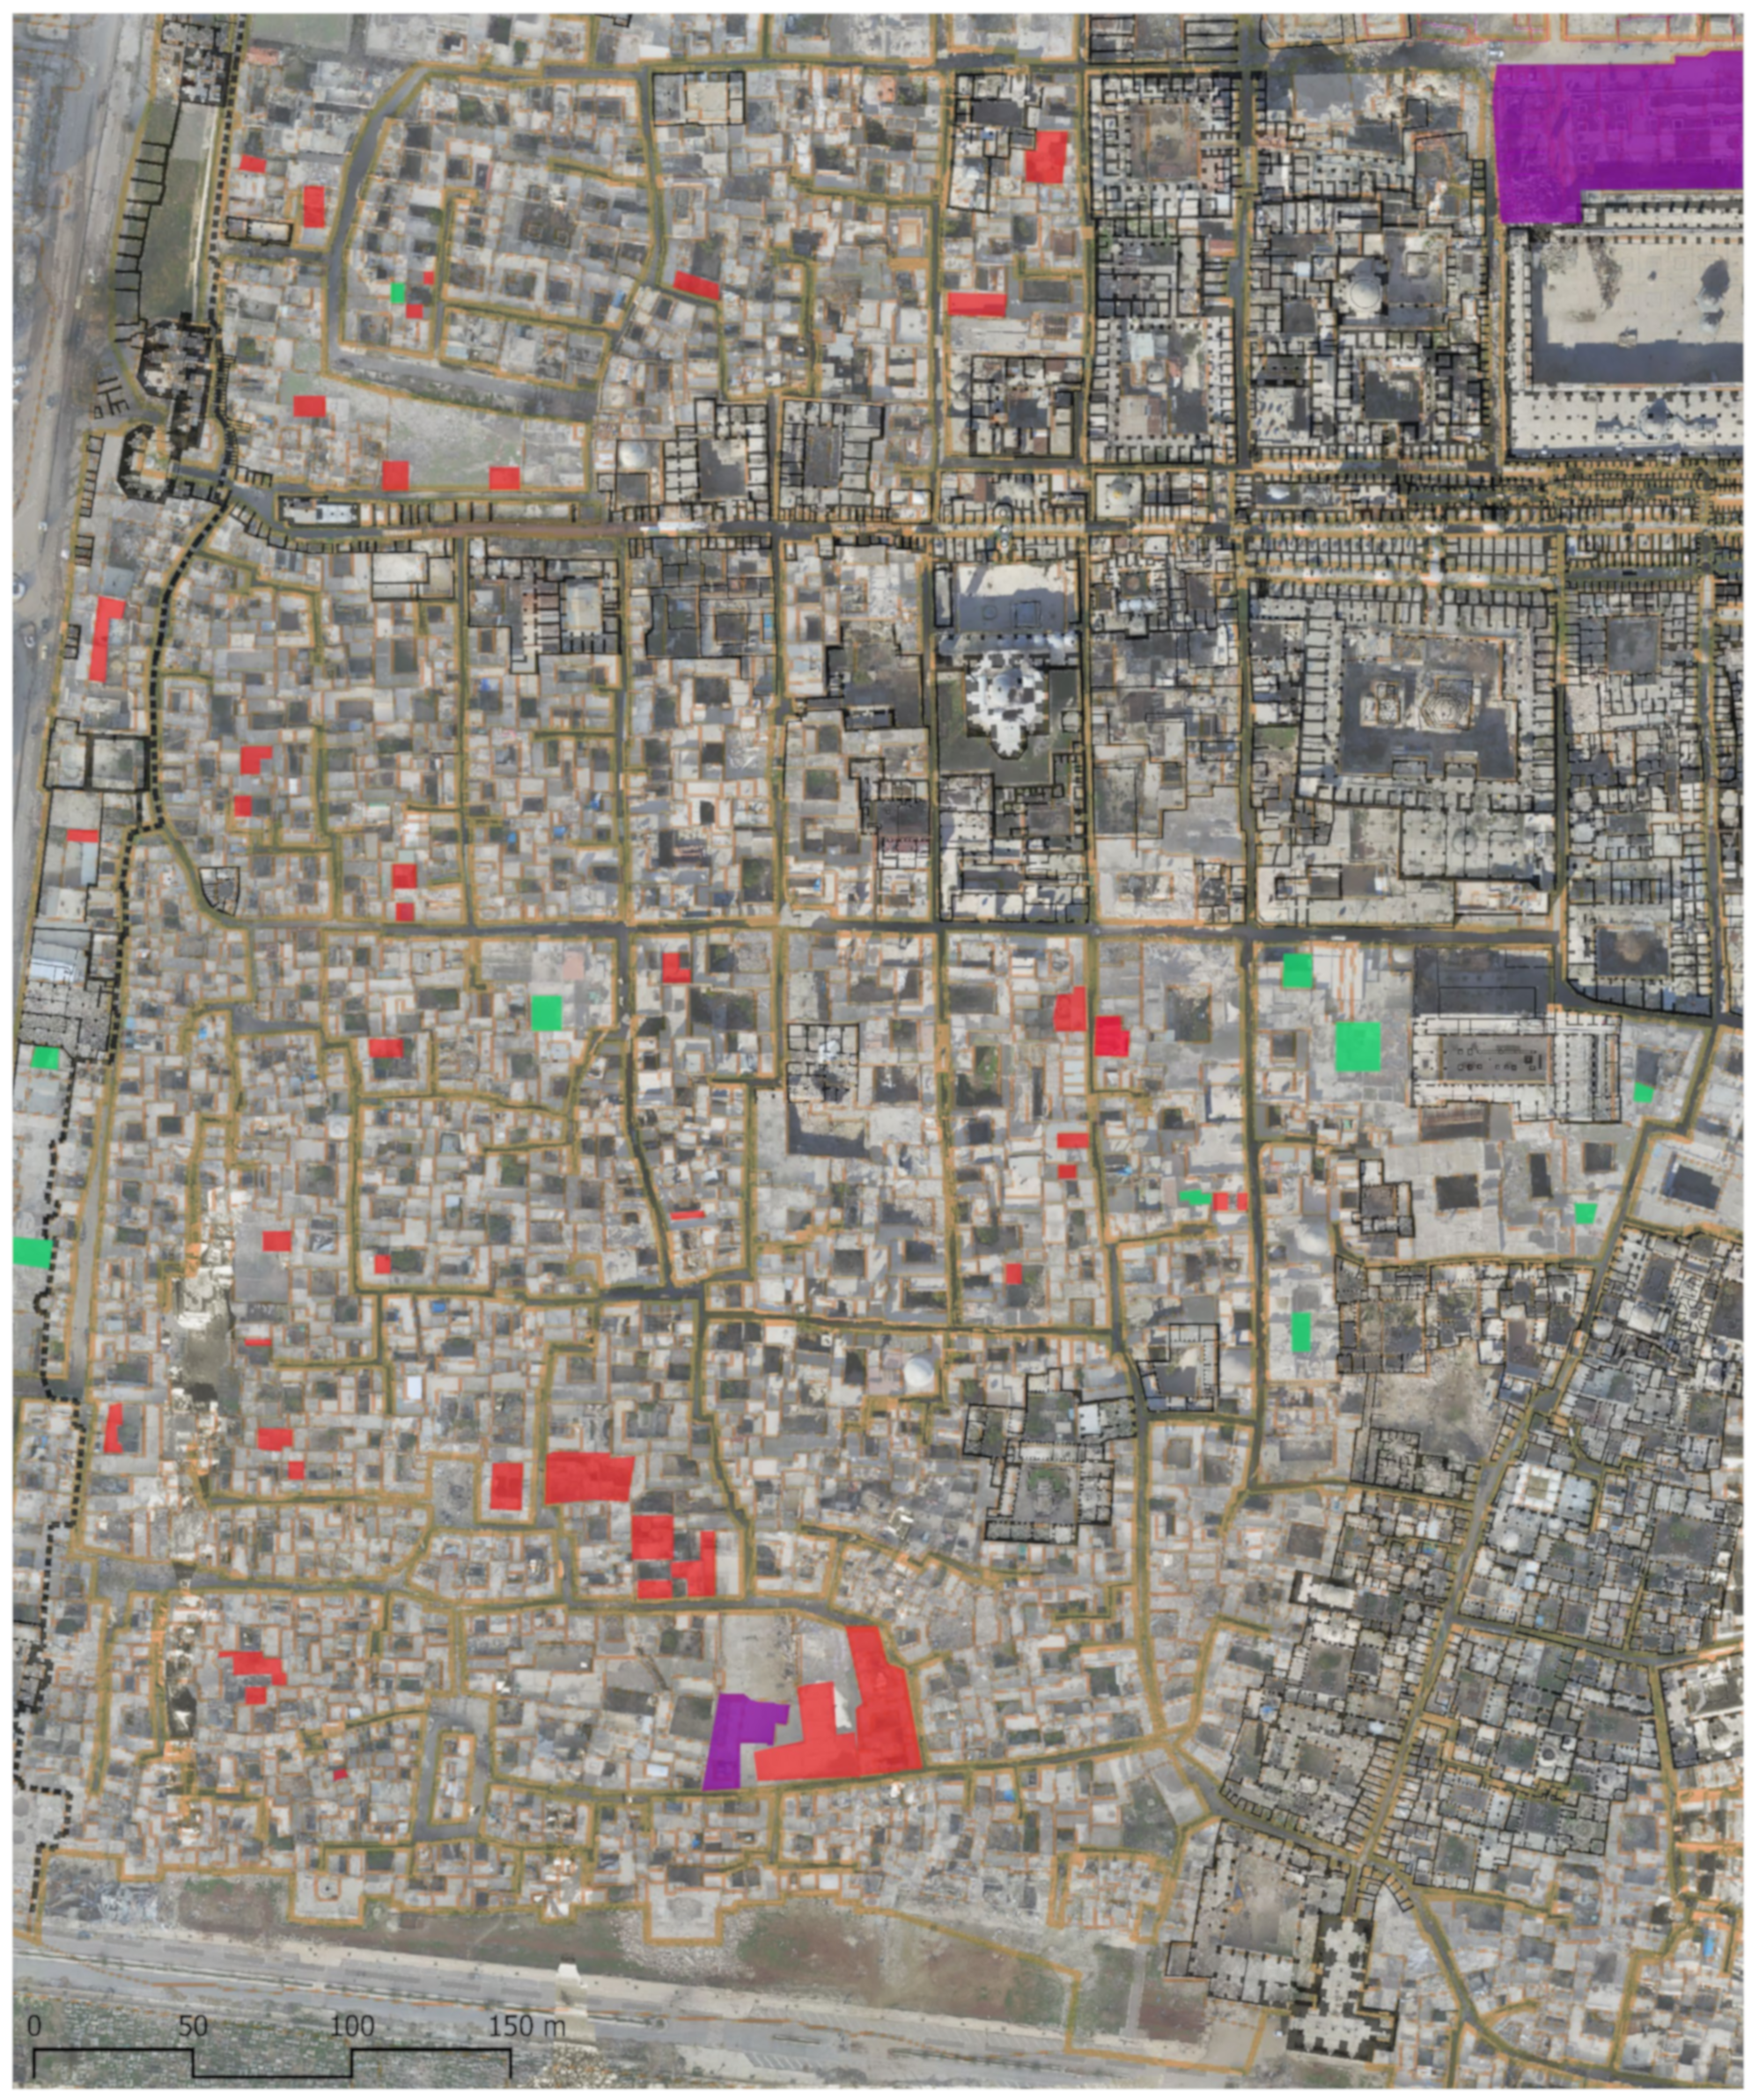
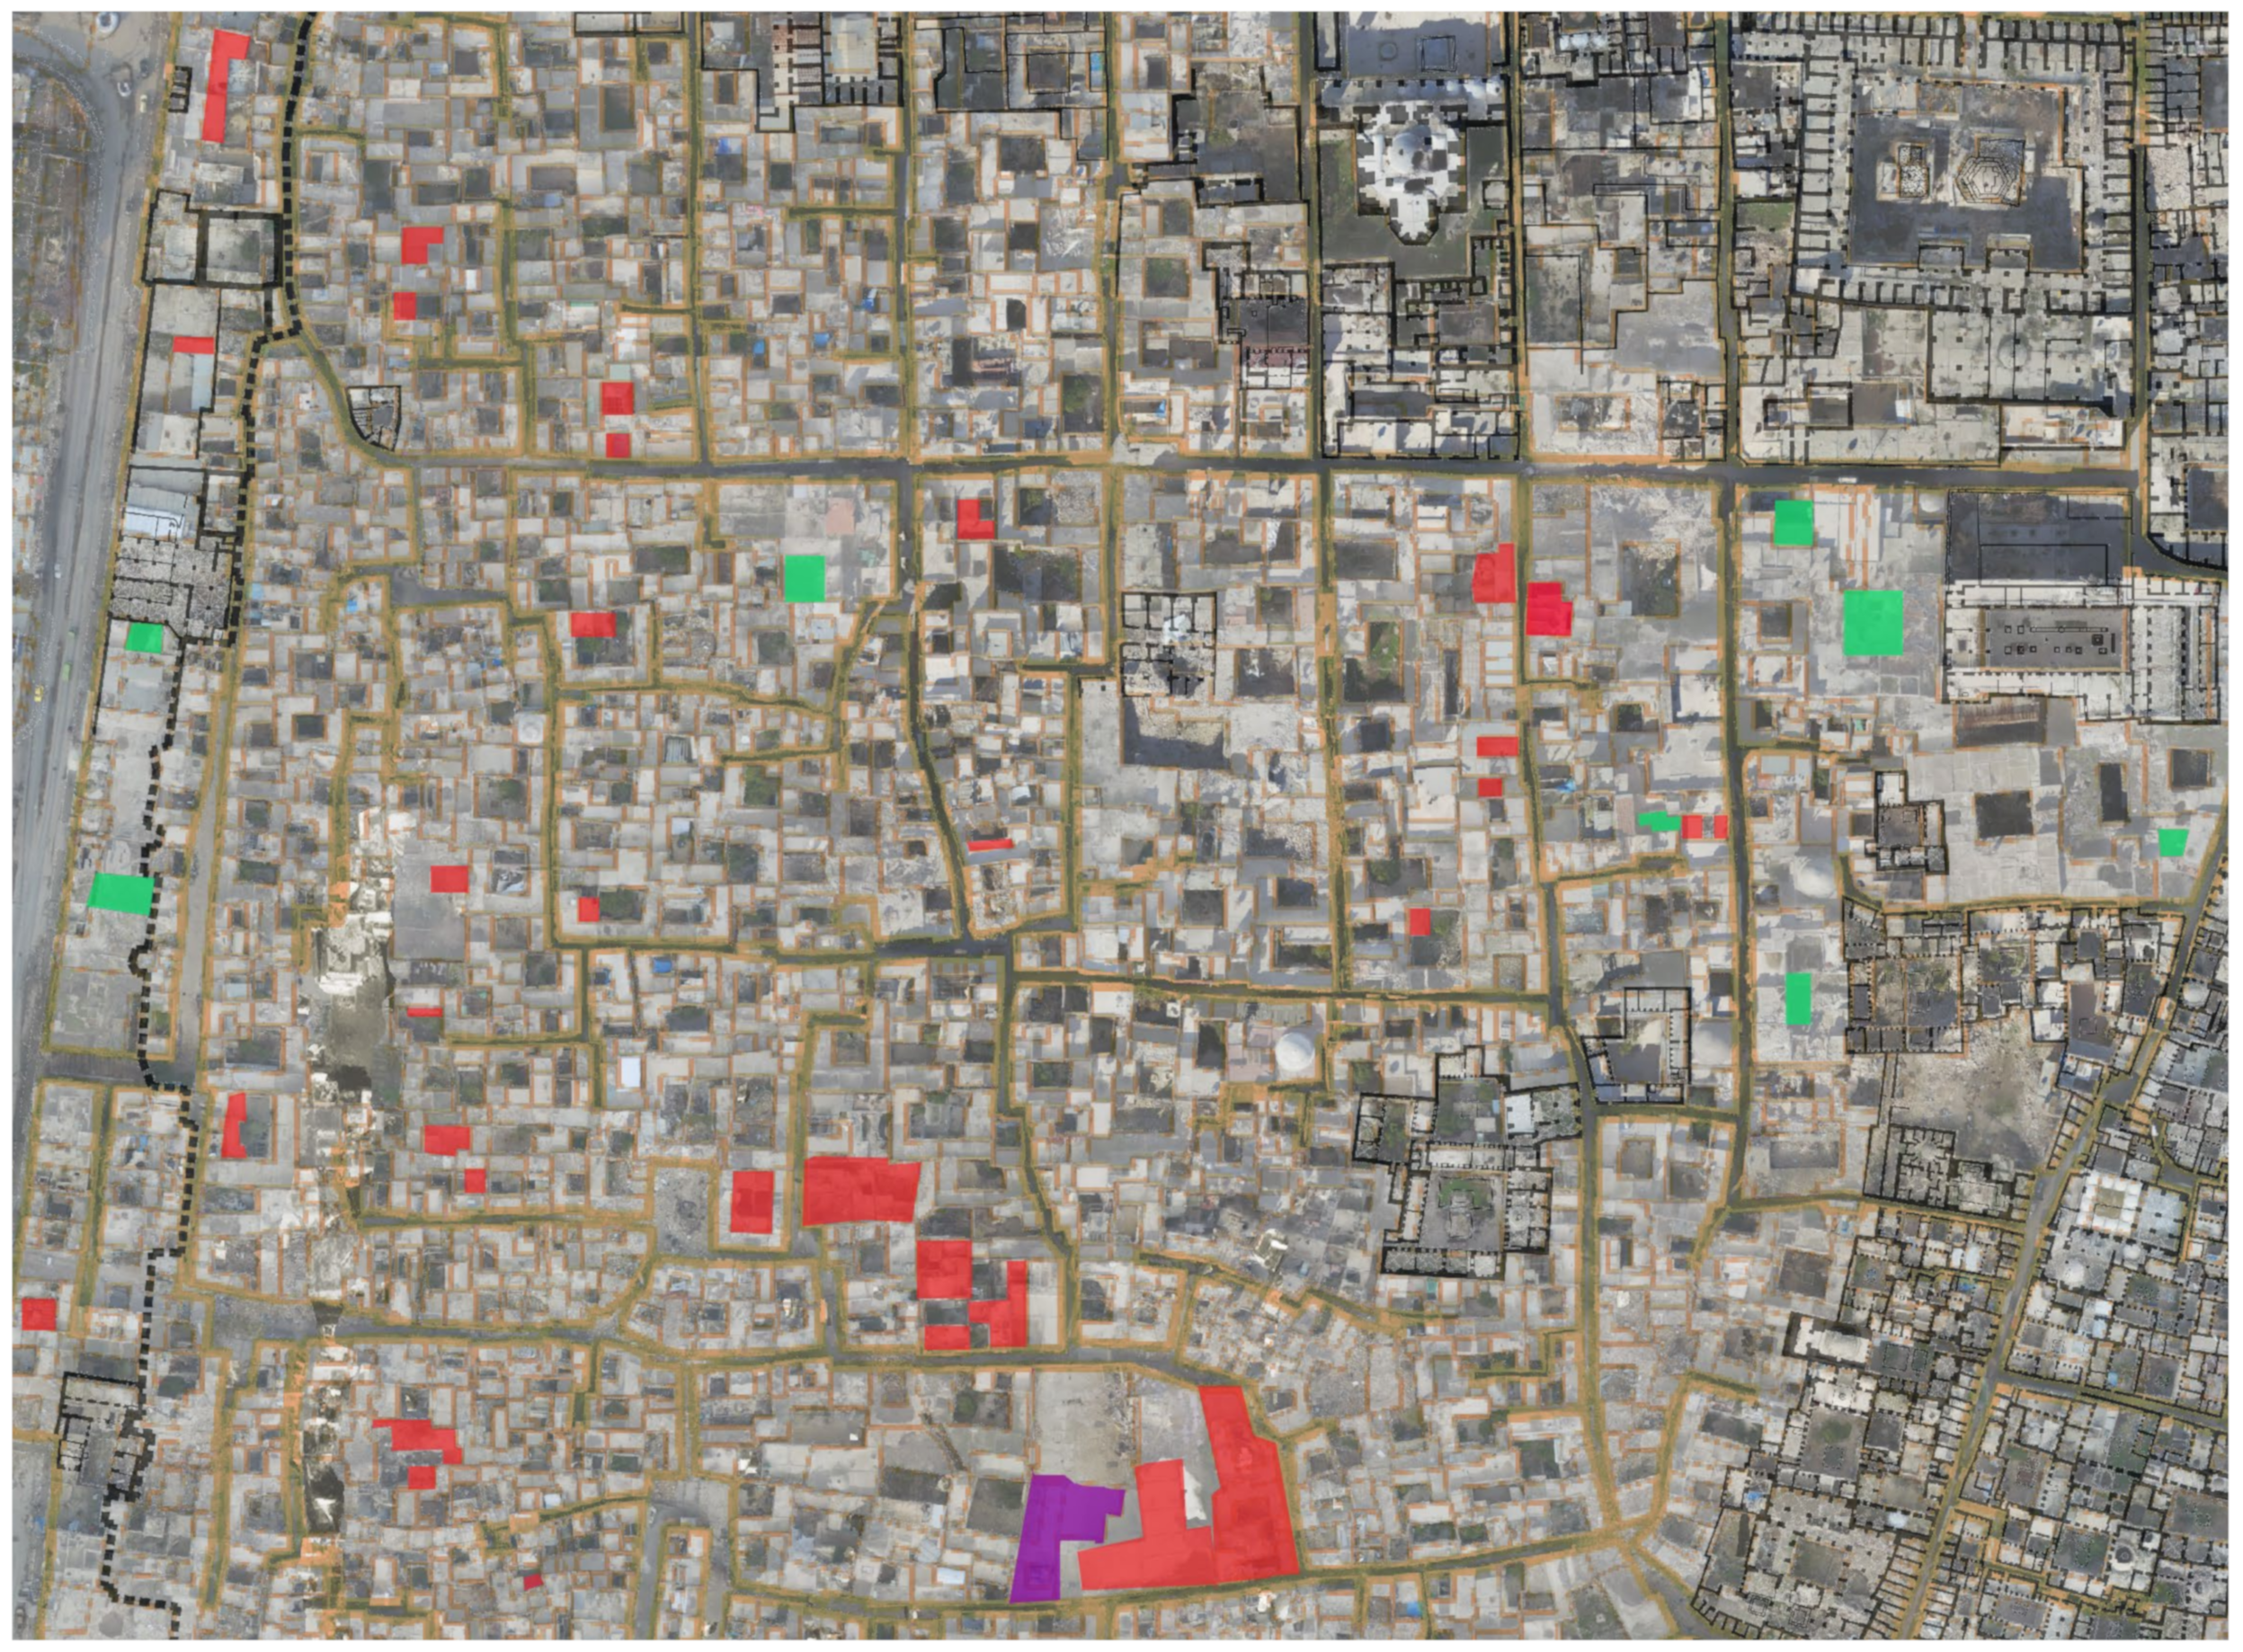
  • The division or the removal of courtyards: In Figure 7, there are some noticeable differences regarding the size, and number of courtyards. Specifically, the number and size of courtyards have decreased possibly due to division of the family house into smaller units to accommodate the families of the children or the change of the residential function. Adding another layer from the cadaster map of the 1930s (Figure 8) reveals additional information compared to the survey results regarding the changes in the size and distribution of open spaces and courtyards. In Figure 8 and Figure 9, courtyards marked with red have been subject to alteration, division, and or covering. On the other hand, courtyards that were not observed in the BTU map and the French cadaster are marked in light green.
  • The addition of buildings within a previously open space: Two open spaces were built partially, space number 20 and space 19, where a public school and some residential parcels were added (Figure 7 and Figure 8). Space number 15 remained the same. Unfortunately, the Ottoman map does not contain additional information about the courtyards, which hinders a complete analysis of the changes in the open spaces.
  • The removal of buildings to create an open space: This change is only observed in two locations. The first one is the square in front of the Umayyad Mosque and the other is the removal of a small section of residential buildings to accommodate the yard of the public school (Figure 7, space 19). Both changes are marked in purple in (Figure 8 and Figure 9).

5. Discussion

Historical maps improve the understanding of the growth and development of a city. In the case of Aleppo, the integration of the Ottoman map within a GIS environment, along with more recent maps—both before and after the war—provide a contribution to the collaborative database of studies of Aleppo.
Despite the previously discussed distortion of the Ottoman map, it provided information about the urban changes and elevation information (Figure 1a and Figure 3). The comparison between the combined cartographic maps with the 3D survey revealed additional courtyards that were not included in all the previous maps.
We can discuss the urban changes in terms of the historical and social aspects. The addition of new streets and cul-de-sac streets can be viewed as an outcome of the division of big courtyard–houses to allow children of the family to have an independent residential unit. It can also be attributed to the change in the function of the city walls. After the revolutionary advances in artillery technology expressed in the cannon, city fortifications were transformed [35]. The use of heavy artillery made walls less important [35]. In Aleppo, this could have caused the residential function to replace the obsolete walls and bastions of the city. Parts of the defensive wall started to be separated into smaller parcels and transformed into other functions; accessing those new functions required new streets and cul-de-sac streets.
The change in size and the alteration of open spaces can be attributed to the repeated division of big courtyard–houses, which was the beginning of the change in mass and void ratio. The high-rise concrete buildings followed the urban masterplans, especially in al-ʿAqaba and to the west of the studied area, amplifying the existing problem and causing more abandonment of the houses due to the loss of privacy [20]. As residential parcels were sold to commercial enterprises or storage facilities, they had to be adapted to such a change in use. In cases where the residential use continued, new stories were added to accommodate either the growth of the family or the owner’s intention to increase leasing revenues. But more importantly, adding additional stories can also be viewed as an act to claim back the privacy of the residential building by elevating the height advantage of the new concrete buildings. Overall, the analysis and comparison suggest low to moderate-level alterations in terms of the 2D layout.
Finally, old cartographic representations are valuable evidence of a point in time in the life of an urban fabric, especially when they are prepared with a scale reference. However, depending on the technique of acquisition, they can include errors or deformations. The methodology presented in this article attempted to address those issues of accuracy for the specific case of the Ottoman map of Aleppo. The pipeline is easily replicable by scholars from different disciplines, e.g., urban planners, architectural historians, and archaeologists. Each attempt can lead to new knowledge depending on the area of expertise of the researchers. Future research will attempt to examine the urban development of the studied area in the 3D dimension and explore the possibility of comparing the point cloud of the city with a 3D model based on the Ottoman map.
Nonetheless, one size does not fit all. There will be a continuous need to develop new approaches to implement old maps in digital studies, not only as a witness of a certain time period in the development of a city but also as an artifact in themselves. Airborne photogrammetric and laser mapping will continue to be the primary facilitator of the process.

6. Conclusions and Outlook

Reality capture technology has gained increased importance as an urban analysis tool. It is capable of giving insight into the past while at the same time informing future decisions about conservation, preservation, and restoration projects. Through the combination of historical maps and orthomosaic, new urban details are revealed. In this study, the digital pipeline enabled the identification of large-scale transformation, such as loss of public space, as well as small-scale transformation, such as the changes in cul-de-sacs and occasionally of courtyards.
The case study of al-Jallūm and al-ʿAqaba sets a proof of concept for combining 3D tools in the analysis of the evolution of historic centers. It can also be further developed for the evaluation of the state of conservation of the city as well as the risks and threats that face the historical fabric, especially during and post-conflict. Future research will focus on examining these 2D changes in the third dimension to attempt to identify the vertical growth of the city through the use of point clouds.

Funding

This research was conducted during a PhD project funded under the Stipendium Hungaricum Scholarship.

Data Availability Statement

The datasets presented in this article are not readily available because the data is still part of an ongoing research.

Acknowledgments

Parts of this study were developed for a PhD dissertation titled: Digital Reconstruction of The Urban Morphology of The Old City of Aleppo: Between the Mamluk and the Post-War City, the case of al-Jallūm and al-‘Aqaba Districts. A parametric Study”. The dissertation was successfully defended at Pázmány Péter University in September 2023. The author would like to convey a heartfelt thanks to The Directorate General of Antiquities in Damascus and Aleppo for their help and logistic support. The author would like to acknowledge the invaluable efforts of archaeologist Rahaf Hamwi for the data acquisition process.

Conflicts of Interest

The author declares no conflict of interest.

References

  1. Burns, R. Cities of The Ancient World—Aleppo: A History; Routledge: New York, NY, USA, 2017. [Google Scholar]
  2. Nigro, L. Yamkhad/Aleppo: Investigating the Second Millennium B.C. Capital of Northern Syria Through Islamic, Byzantine and Classical Towns. Environ. Des. J. Islam. Environ. Des. Res. Cent. 1999, 2, 46–55. [Google Scholar]
  3. Petrie, G. Airborne Photogrammetric Mapping. In The Routledge Handbook of Geospatial Technologies and Society; Routledge: London, UK, 2023; pp. 202–225. [Google Scholar]
  4. Lemmens, M. Airborne and Ground-based Laser Scanning. In The Routledge Handbook of Geospatial Technologies and Society; Routledge: London, UK, 2023; pp. 171–187. [Google Scholar]
  5. Balsa-Barreiro, J.; Fritsch, D. Generation of visually aesthetic and detailed 3D models of historical cities by using laser scanning and digital photogrammetry. Digit. Appl. Archaeol. Cult. Herit. 2018, 8, 57–64. [Google Scholar] [CrossRef]
  6. Suwardhi, D.; Trisyanti, S.W.; Virtriana, R.; Syamsu, A.A.; Jannati, S.; Halim, R.S. Heritage Smart City Mapping, Planning and Land Administration (Hestya). ISPRS Int. J. Geo Inf. 2022, 11, 107. [Google Scholar] [CrossRef]
  7. Maragkogiannis, K.; Kolokotsa, D.; Konstantaras, A. Combining terrestrial laser scanning and computational fluid dynamics for the study of the urban thermal environment. Sustain. Cities Soc. 2014, 13, 207–216. [Google Scholar] [CrossRef]
  8. Vo, A.V.; Laefer, D.F.; Smolic, A.; Zolanvari, S.I. Per-point processing for detailed urban solar estimation with aerial laser scanning and distributed computing. ISPRS J. Photogramm. Remote Sens. 2019, 155, 119–135. [Google Scholar] [CrossRef]
  9. Serna, A.; Marcotegui, B. Urban accessibility diagnosis from mobile laser scanning data. ISPRS J. Photogramm. Remote Sens. 2013, 84, 23–32. [Google Scholar] [CrossRef]
  10. Pepe, M.; Costantino, D.; Alfio, V.S.; Angelini, M.G.; Garofalo, A.R. CityGML Multiscale Approach for the Conservation and Management of Cultural Heritage: The Case Study of the Old Town of Taranto (Italy). Int. J. Geo Inf. 2020, 9, 449. [Google Scholar] [CrossRef]
  11. Cipriani, L.; Bertacchi, S.; Bertacchi, G. An optimised workflow for the interactive experience with cultural heritage through reality-based 3D models: Cases study in archaeological and urban complexes. In Proceedings of the GEORES 2019—2nd International Conference of Geomatics and Restoration, Milan, Italy, 8–10 May 2019. [Google Scholar]
  12. Wang, C.; Wen, C.; Dai, Y.; Yu, S.; Liu, M. Urban 3D modeling using mobile laser scanning: A review. Virtual Real. Intell. Hardw. 2020, 2, 175–212. [Google Scholar] [CrossRef]
  13. Papa, L.M. Considerations about Old Maps in the Digital Era. Disegno 2019, 5, 91–102. [Google Scholar]
  14. Talich, M. Digitization of Old Maps and Possible On-line Tools for Their Use. In Digital Cultural Heritage; Kremers, H., Ed.; Springer: Cham, Switzerland, 2019; pp. 331–341. [Google Scholar]
  15. Dong, S.; Shen, D. A Study of Historical Urban Landscape Layering in Luoyang. Land 2023, 12, 663. [Google Scholar] [CrossRef]
  16. Cybulski, P.; Wielebskil, Ł.; Medyńska-Gulij, B.; Lorek, D.; Horbiński, T. Spatial visualization of quantitative landscape changes in an industrial region between 1827 and 1883. Case study Katowice, southern Poland. J. Maps 2020, 16, 77–85. [Google Scholar] [CrossRef]
  17. The Aga Khan Trust for Culture. Old City of Aleppo: Building Information and Preliminary Damage Assessment; The Aga Khan Trust for Culture: Geneva, Switzerland, 2018. [Google Scholar]
  18. The Aga Khan Trust for Culture. Plan of Reconstruction and Recovery of the Ancient City of Aleppo: Strategy and Proposed Restoration Projects; The Aga Khan Trust for Culture: Salamiyah, Syria, 2019. [Google Scholar]
  19. Raymond, A. Aux origines du plan d’Alep par Rousseau: Le plan de Vincent Germain de 1811. In The Ottoman Empire and Its Heritage, Politics, Society and Economy, Syria and Bilad Al-Sham under Ottoman Rule; Brill: Leiden, The Netherlands, 2010; Volume 43, pp. 499–512. [Google Scholar]
  20. Stürzbecher, K.; Windelberg, J.; Abdul Aziz Hallaj, O. (Eds.) Rehabilitation of the Old City of Aleppo, Development Plan for the Old City of Aleppo; GTZ: Aleppo, Syria, 1998. [Google Scholar]
  21. Gaube, H.; Wirth, E. Aleppo: Historische und Geographische Beiträge zur Baulichen Gestaltung, zur Sozialen Organisation und zur Wirtschaftlichen Dynamik Einer Vorderasiatischen Fernhandelsmetropole—Karten; Dr. Ludwig Reichert: Wiesbaden, Germany, 1984. [Google Scholar]
  22. David, J.-C.; Boissière, T. (Eds.) Alep et Ses Territoires, Fabrique et Politique D’une Ville (1868–2011); Presses de l’Ifpo, Institut Français du Proche-Orient: Beyrouth, Lebanon, 2014. [Google Scholar]
  23. Sauvaget, J. Alep Essai Sur le Développement d’une Grande Ville Syrienne, des Origines au Milieu du XIX Siècle; Librairie Orientaliste Paul Geuthner: Paris, France, 1941. [Google Scholar]
  24. Neglia, G.A. Aleppo: Processes of Formation of the Medieval Islamic City; Poliba Press: Bari, Italy, 2009. [Google Scholar]
  25. Neglia, G.A. Persistences and Changes in The Urban Fabric of The Old City of Aleppo. Environ. Des. J. Islam. Environ. Des. Cent. 2001, 1–2, 32–41. [Google Scholar]
  26. Raghid, B. Plan Général de la Ville d’Halep Dressé par les Ingénieurs des Ponts et Chaussées du Vilayet Chartier. National Library of France. Available online: https://gallica.bnf.fr/ark:/12148/btv1b52507324h/f3.item.zoom (accessed on 26 August 2023).
  27. The Aleppo Archive. A Place for the Memory of Urban History; The Aleppo Archive: Aleppo, Syria, 2012. [Google Scholar]
  28. Zarrin Ghalam, S.; Wessling, C. Making the Past Visible for the Future: Map of the Old City of Aleppo. In The UNESCO Memory of the World Programme; Edmondson, R., Jordan, L., Prodan, A., Eds.; Springer: Cham, Switzerland, 2020. [Google Scholar]
  29. Orabi, R. Challenges of Applying Reality Capturing Methods in a Post-Conflict Urban Context: The Digital Survey in the Old City of Aleppo. In Proceedings of the 26th International Conference on Cultural Heritage and New Technologies, Vienna, Austria, 2–4 November 2021. [Google Scholar]
  30. Archnet. Écochard: Aleppo Album. Available online: https://www.archnet.org/collections/151?media_content_id=91326. (accessed on 16 January 2019).
  31. USGS Earth Resources Observation and Science (EROS) Center. USGS EROS Archive—Declassified Data—Declassified Satellite Imagery—1. 13 July 2018. Available online: https://www.usgs.gov/centers/eros/science/usgs-eros-archive-declassified-data-declassified-satellite-imagery-1?qt-science_center_objects=0#qt-science_center_objects (accessed on 13 January 2024).
  32. Ibn, K.; Al-Ghazzī, H.; Shaath, S.; Fakhuri, M. Nahr Al-Dzahab fī Tarīkh Ḥalab; Maronite Printing House: Aleppo, Syria, 1991; Volume 2. [Google Scholar]
  33. Ibn, K. Al-‘Ajamī, Kunūz Al-Dzahab fī Tarīkh Ḥalab; Bakkūr, S.S.F., Ed.; Dar Al-Qalam al-‘Arabī: Aleppo, Syria, 1966. [Google Scholar]
  34. David, J.-C. Valorisation du patrimoine mondial alépin, Valeur d’usage et référence identitaire, attraction touristique, vitrine du nouveau centre. In Alep et Ses Territoires: Fabrique et Politique D’une Ville (1868–2011); Presses de l’Ifpo: Beyrouth, Lebanon, 2014; pp. 393–417. [Google Scholar]
  35. De la Croix, H. Military Architecture and the Radial City Plan in Sixteenth Century Italy. Art Bull. 1960, 42, 263–290. [Google Scholar] [CrossRef]
Figure 1. (a) A section of the digital copy of the map from the website of The National Library of France [26]. (b) The French Cadastral Map [27]. (c) The BTU map [28].
Digital 04 00007 g001aDigital 04 00007 g001b
Figure 2. The orthomosaic of the aerial photogrammetry, exported from Agisoft Metashape, by the author.
Digital 04 00007 g002
Figure 3. (a) The vectorized intramural city based on the Ottoman map of Aleppo published by (Available online: https://gallica.bnf.fr/ark:/12148/btv1b52507324h/f3.item.zoom (accessed on 26 August 2023)) [26], redrawn by the author. (b) A section of vectorized map superimposed on the digital copy of the Ottoman map, showing the accuracy of the vectorizations, by the author.
Digital 04 00007 g003
Figure 4. The orthomosaic from the survey superimposed with the Aleppo Archive in Exile map (in light blue tint), exported from QGIS, compiled by the author.
Digital 04 00007 g004
Figure 5. (a). Location and number of the ground control points (GCPs) on the Ottoman map. (b) Location and number of the (GCPs) on the BTU map. (c) The accuracy of the GCPs in Polynomial 3 transformation, exported from QGIS.
Digital 04 00007 g005aDigital 04 00007 g005b
Figure 6. (a) The geo-referenced Ottoman map (in light red) and the BTU map (in black) overlaid on the orthomosaic (in RGB values) created in QGIS by the author. (b) An enlarged section of the geo-referenced Ottoman map focusing on the northern part of the studied area.
Digital 04 00007 g006
Figure 7. The geo-referenced maps of 1900 (in light red) and the BTU overlaid, exported from QGIS by the author.
Digital 04 00007 g007
Figure 8. The orthomosaic from the survey superimposed on the BTU map and the map of the 1930s, exported from QGIS, created and designed by the author. The red color represents the removal or division of a courtyard. The light green represents courtyards not visible in other maps. The purple color represents open spaces that were created by removing sections or complete buildings.
Digital 04 00007 g008
Figure 9. An enlarged section of Figure 8 showing the changed parcels. The red color represents the removal or division of a courtyard. The light green represents courtyards not visible in other maps. The purple color represents open spaces that were created by removing sections or complete buildings.
Digital 04 00007 g009
Disclaimer/Publisher’s Note: The statements, opinions and data contained in all publications are solely those of the individual author(s) and contributor(s) and not of MDPI and/or the editor(s). MDPI and/or the editor(s) disclaim responsibility for any injury to people or property resulting from any ideas, methods, instructions or products referred to in the content.

