Article

Evaluation of the Performances of a Monolayer Cover with an Elevated Water Table Used for the Reclamation of the Abandoned Aldermac Mine Site (Québec, Canada)

by
Abdelkabir Maqsoud
1,*,
Mamert Mbonimpa
1,
Mostafa Benzaazoua
1,2 and
Sophie Turcotte
3
1
RIME—Research Institute on Mines and the Environment, Université du Québec en Abitibi-Témiscamingue, 675, 445 Boul. de l’Université, Rouyn-Noranda, QC J9X 5E4, Canada
2
Mining Environment and Circular Economy, Mohammed VI Polytechnic University, Lot 660, Hay Moulay Rachid, Ben Guerir 43150, Morocco
3
Direction de la Restauration des Sites Miniers, Ministère de l’Énergie et des Ressources Naturelles, 400, Boul. Lamaque, Val d’Or, QC J9P 3L4, Canada
*
Author to whom correspondence should be addressed.
Mining 2022, 2(1), 65-85; https://doi.org/10.3390/mining2010005
Submission received: 29 November 2021 / Revised: 24 January 2022 / Accepted: 27 January 2022 / Published: 3 February 2022

Abstract

:
Until 2008, the Aldermac mine was considered one of the most problematic abandoned mines sites in Québec due to the high production of acid mine drainage caused by mine tailings spread over a large area. The site was reclaimed between 2008 and 2009 to reduce the ecological footprint and to minimize any further tailings oxidation (production of acid mine drainage). For this purpose, a monolayer cover with an elevated water table was used as an oxygen barrier on the north zone of the site. To assess the performance of the monolayer with an elevated water table cover, a network of observation wells was set up to monitor the water table level and collect groundwater samples for the analysis of physical and chemical parameters. Results of water table level measurements show that the cover successfully maintains the tailings within the water table at all times, thus preventing further tailings oxidation. Hydrogeochemical results, interpreted with principal component analysis, show that the quality of water is improving, thus indicating that reclamation is helping to reduce groundwater contamination at the site.

1. Introduction

The extraction of mineral resources plays an important role in the Canadian economy. However, mining operations generate large volumes of solid wastes. These wastes include soil overburden, waste rock extracted to reach the orebody, and fine-grained mill tailings produced by ore processing plants [1]. Mine wastes can have significant adverse effects on the environment if they are not properly managed, particularly when they contain iron sulfide minerals such as pyrite (FeS2) or pyrrhotite (Fe1-xS). This is primarily because the oxidation of these minerals (in the presence of water) by atmospheric oxygen often results in the production of acid, which can contaminate surrounding environments. This oxidation reaction takes place in aqueous media in the presence or absence of bacteria according to the equation:
4FeS2 + 15O2 + 14H2O ⟶ 4Fe(OH)3 + 8H2SO4
When mine wastes contain carbonate minerals, partial or complete neutralization of the acid produced by sulfide oxidation is possible. However, if the acid neutralization potential of a waste is not sufficient or has been exhausted, acid mine drainage (AMD) will be generated. Under acidic conditions, many of the metals contained in mine wastes become mobile and can spread to receiving waters [1]. In these situations, actions must be taken at the mine site to prevent environmental impacts caused by AMD [1,2,3].
A variety of management options and reclamation strategies are available to avoid or mitigate acid production in potentially acid-generating (PAG) mine wastes. In humid climates, which are predominant throughout most Canadian provinces, techniques that limit the availability of oxygen are generally the most viable options [2,3,4].
For this purpose, it is possible to use a water cover to reduce the availability of oxygen to the underlying acid-generating mine wastes [5,6,7]. An oxygen barrier can also be created by placing a cover made of oxygen-consuming materials such as wood waste, straw mulch, or other organic residues [8,9]. Another effective way to limit oxygen migration is to use a cover with capillary barrier effects (CCBE) (e.g., [10,11,12,13,14,15,16]). A CCBE relies on the water retention contrast between two superimposed materials (fine-grained over coarse-grained materials), to create a capillary barrier effect that limits the vertical flow of water at the interface. When overlapped by a coarse–grained material layer, the CCBE maintains the fine-grained material layer near saturation. Another alternative is to use a monolayer cover with an elevated water table (EWT). The concept behind a monolayer-EWT cover is to raise or maintain the water table to a position that allows maintaining the reactive tailings at a sufficiently high degree of water saturation; the high degree of water saturation will prevent tailings oxidation (for more detail see [17,18,19,20,21,22,23,24,25]).
Other techniques can be used such as hydraulic barriers with the objective to limit water infiltration. These hydraulic barriers can be made by compacted clay material, geosynthetic material and geomembranes. Additional details can be found in [26].
The present study examines the case of the abandoned Aldermac mine site (Abitibi, Québec), where a monolayer EWT cover made of a granular material was implemented. This article begins with a brief description of the Aldermac site and history of its reclamation. Piezometric level measurements and geochemical data are presented in order to evaluate the performance of the site’s reclamation. Statistical analyses, including principal component analysis (PCA), are used to aid in the interpretation of the geochemical data. Finally, major outcomes and perspectives on future research work conclude this paper.

2. Site Description

The Aldermac mine site is located in the Abitibi region of Québec about 15 km west of Rouyn–Noranda (Figure 1). This abandoned mine site is the result of the exploitation of rich deposits of zinc and copper between 1931 and 1943. Over its lifespan, the mine produced nearly 1.5 million tons of acid-generating tailings that contain significant amounts of both pyrite and pyrrhotite. The acid generating potential (AP) of the tailings was previously determined to be about 253.54 kg CaCO3/t [27]. Since the tailings do not contain neutralizing minerals, their neutralization potential (NP) is essentially negligible.
Although tailings at Aldermac were placed in an impoundment, a lack of appropriate confinement structures resulted in the wastes spreading to cover an area of about 60 ha, including both the tailings storage facilities (TSF) and affected spill zones in the valley of Stream 1 (Figure 1). Therefore, until 2008 the Aldermac mine site was considered one of the most problematic abandoned mine sites in Québec.
Various options have been proposed for the reclamation of different areas of the Aldermac site, including CCBEs, a monolayer-EWT cover, hydraulic barrier (constructed from a geomembrane), forestry residue cover, and water flooding [27]. In order to determine the most appropriate option for each area of the site, a Pugh matrix was used to identify the options that could best meet a list of predefined criteria. The targeted criteria were: environmental effectiveness, technical feasibility, availability of materials, environmental impact of construction, maintenance of structures, compatibility with the environment, capital cost, and risk of failure.
After thorough evaluation, the Aldermac site was reclaimed between 2008 and 2009 [27]. The main objective of this work was to limit further oxidation of the reactive tailings and prevent the production of more AMD. Reclamation of the site (Figure 2) was performed as follows [27,28]:
  • Tailings in the South area were excavated with part of the contaminated soils and confined using a high-density polyethylene (HDPE) geomembrane cover.
  • Tailings and contaminated soils along Stream 1 were excavated and deposited in the North area.
  • Tailings and contaminated soils from the Intermediate area were excavated and deposited in the North area.
  • Two areas separated by a dike (Terrace 1 and 2, see Figure 2) were created in the North area. Tailings in this area were confined with watertight dikes to create ideal conditions for a monolayer-EWT cover composed of a granular material (sand and gravel). The monolayer-EWT cover has a thickness of about 1 m and acts as a protective layer against evaporation.
Thus, two different techniques were combined for the reclamation of the abandoned Aldermac mine site: a low saturated hydraulic conductivity (ksat) cover made of an HDPE geomembrane and a monolayer-EWT cover. Further details can be found in [20,21].
The concept behind a monolayer-EWT cover is based on maintaining the water table above the reactive tailings. By maintaining the underlying tailings at a high degree of saturation, oxygen fluxes from the surface can be greatly reduced and the oxidation of sulfides essentially inhibited. Prior studies on reactive tailings have shown a correlation between the depth of the water table and oxygen fluxes. Furthermore, laboratory tests have shown the influence of the degree of saturation on the sulfide oxidation rates in tailings [7,22,23,24,29,30,31,32,33,34,35,36].

3. Materials and Methods

The performance of the Aldermac monolayer-EWT cover was evaluated through geochemical monitoring of groundwater. However, in the absence of geochemical background data (i.e., prior to mining activity), this assessment was a major challenge, and it is for this reason that the approach described in the following sections was adopted.

3.1. Observation Well Network

The success of the reclamation of the North area of the abandoned Aldermac mine site using a monolayer-EWT cover is based on the cover’s ability to permanently maintain an EWT above the interface between the cover and the reactive tailings. To evaluate the cover’s, a network of six observation wells was installed during the site’s reclamation (T1 to T6; Figure 2). The depths of these observation wells (surface wells) are close to the interface between the granular cover and the underlying tailings. These observations wells enable sampling of the groundwater and water table level measurements. However, only observation wells T4 and T6 are equipped with data loggers that allow for continuous measurements of water table levels.
Piezometers (CP-1, CP2, T7 to T11) were installed in the glacial till aquifer around the mine site. The different layers encountered below the cover (from top to bottom) and their thicknesses are presented in Table 1. Table 1 shows that the tailings lie directly on top of a natural clayey soil. The thickness of this clay layer is between 3.4 and 17.2 m. Below the clay, on can find glacial till material that are found directly on the bedrock. These piezometers were mainly used for groundwater sampling monitoring campaigns that were performed after the site’s reclamation with the objective of evaluating aquifer contamination. However, the present study focuses primarily on pore waters in the tailings.

3.2. Water Sampling

Three water sampling campaigns have been performed each year (spring, summer, and fall) since the site’s reclamation. Water sampling was performed using a low-flow method, with flow rates of 0.1–0.5 L/min. This method minimizes the stress (drawdown) imposed during sampling [37,38,39,40]. Physical and chemical parameters, such as pH, electrical conductivity (EC) and temperature, were measured in situ during the pumping tests and, once the parameters stabilized, water sampling was performed. Samples were collected in clean polyethylene bottles, transported to the laboratory in iceboxes (to preserve their quality by avoiding precipitation), and stored at 4 °C until physical and chemical analyses could be performed. Samples for determining metal concentrations were collected separately and preserved with ultrapure nitric acid (pH < 2).

3.3. Physical and Chemical Analyses

Field measurements of pH and EC were performed using a PCSTestr 35 multi-parameter probe. Metal concentrations were determined in the laboratory by ICP-AES for: Al, As, Ba, Be, Bi, Ca, Cd, Co, Cr, Cu, Fe, Mg, Mn, Mo, Ni, Pb, Se, S, Ti, and Zn. Sulfate (SO4) concentrations were determined using ionic chromatography (IC).

3.4. Statistical Analyses

Statistical tools used in this study included the Principal Components Analysis (PCA), which is a statistical method considering at least two variables. The PCA allows a graphical representation of the correlation between the variables, as well as of positions of the original variables with regard to the vectors of these variables [39,40,41,42,43]. Graphs showing the results are then drawn using the correlation matrix. Using diagrams, the PCA describes the correlation between the various variables and the chosen determining factors. Then, these graphs are represented in a circle of radius 1. The interpretation considers that the greater the correlation value (closer to −1 or +1), the stronger the correlation between the variables and the factor. The position of variables is thus determined by their correlation to the factors. The PCA method was adopted in several hydrogeochemical studies [21,40,44,45,46,47,48,49,50,51] because of its relative superior efficiency compared to other available methods, such as Collins, Stiff, Schoeller and Piper diagrams [51].

4. Investigation Results

4.1. Hydrogeological Behavior

Manual measurements of the water table level were performed three times per year from June 2012 to October 2014. Results from these measurements are presented in Figure 3. The lowest water table levels were measured in August, while the highest levels were usually measured in November. This behavior reflects the lower precipitation levels and higher evaporation that occur during summer and the higher water table recharge that occurs in the fall.
Water table level measurements were also used to evaluate the location of the EWT with respect to the soil surface and the interface between the reactive tailings and the monolayer cover. Results showed that, over the studied period, the EWT was constantly maintained above the cover/tailings interface. Therefore, oxidation of the tailings by atmospheric oxygen should be negligible. Minimum, maximum, and average values of the water table height (relative to the depth of the tailings) are shown in Table 2 for all observation wells. Minimum water table heights ranged from 0.34 m (T6) to 0.85 m (T2) above the cover/tailings interface; maximum water table heights varied from 0.48 m (T6) to 0.99 m (T2) above the interface; and average water table height varied from 0.40 (T6) to 0.93 m (T2) above the interface.
As previously mentioned, observation well T4 was instrumented in 2012 with a data logger for continuous water table level measurements. An additional sensor was also placed outdoors near the piezometer for atmospheric pressure measurements. Continuous water table levels and precipitation (measured at the Rouyn-Noranda climate station) for the period from 2012 to 2014are presented in Figure 4. The data show that the water table level at T4 was sensitive to changes in precipitation, increasing after precipitation events and decreasing after periods without precipitation. The water table level at well T4 remained close to the soil surface, with stagnant water even occasionally observed at the soil surface during the spring period (Figure 4). Maximum water table levels were observed during April (22 April 2013 and 23 April 2014) following the end-of-winter snowmelt. After the spring freshet, water table levels showed a downward trend, corresponding to periods of recession and drying up. After these periods, there was a further increase in the water table level during late summer and early fall. Finally, during the winter, a slight decreasing tendency was observed. This behavior is typical of a water table close to the soil surface. This is because the piezometric behavior of such materials is directly influenced by climatic conditions. For example, significant rainfall generates an increase in the water table; lack of precipitation, higher evaporation, or increased drainage can cause decline in the water table level.
The lowest piezometric levels were observed in July (15 July 2012; 31 July 2013 and 29 June 2014), with the water table located 0.43, 0.63, and 0.68 m above the cover/tailings interface for each year, respectively. These levels are significantly lower than those measured manually (Table 2), thus suggesting that continuous monitoring of the water table level could be highly relevant for monitoring.

4.2. Hydrochemical Behavior

During the studied period, 10 water sampling campaigns were performed at the different observation wells. This section presents data on EC, pH and the correlation between Ca + Mg and SO4, followed by a statistical analysis of the data corresponding to the relevant parameter analyzed and interpretation of the results with PCA.

4.2.1. Electrical Conductivity and pH

Figure 5 shows the EC and pH measured in wells T1–T6. Well T3 had the highest average EC at 1234 µS/cm, while well T1 had the lowest average EC at 237 µS/cm. EC showed a decreasing trend in well T6 (from 3020 µS/cm in 2011 to 240 µS/cm in 2014), which is located close to the final effluent of the terraces. This was most likely as a result of mitigation measures. The highest pH values were measured in well T5, which showed an average value of 6.5, while the lowest values were measured in well T6, which had an average value of 4.2.

4.2.2. Correlation between Concentrations of Ca + Mg vs. SO4

To identify the origin and processes contributing to water mineralization, correlations of Ca + Mg vs. SO4 were performed for all sampling campaigns at each observation well. Figure 6 shows that the correlation between Ca + Mg vs. SO4 in wells T4 and T6 is very high (R2 = 0.97 and 0.87, respectively). Sulfate concentrations in wells T4 and T6 were higher than those in waters from the other wells, sometimes exceeding 1000 mg/L. This could be explained by a combination of gypsum/anhydrite dissolution and/or evaporation. The excess of Ca is likely related to the dissolution of gypsum.

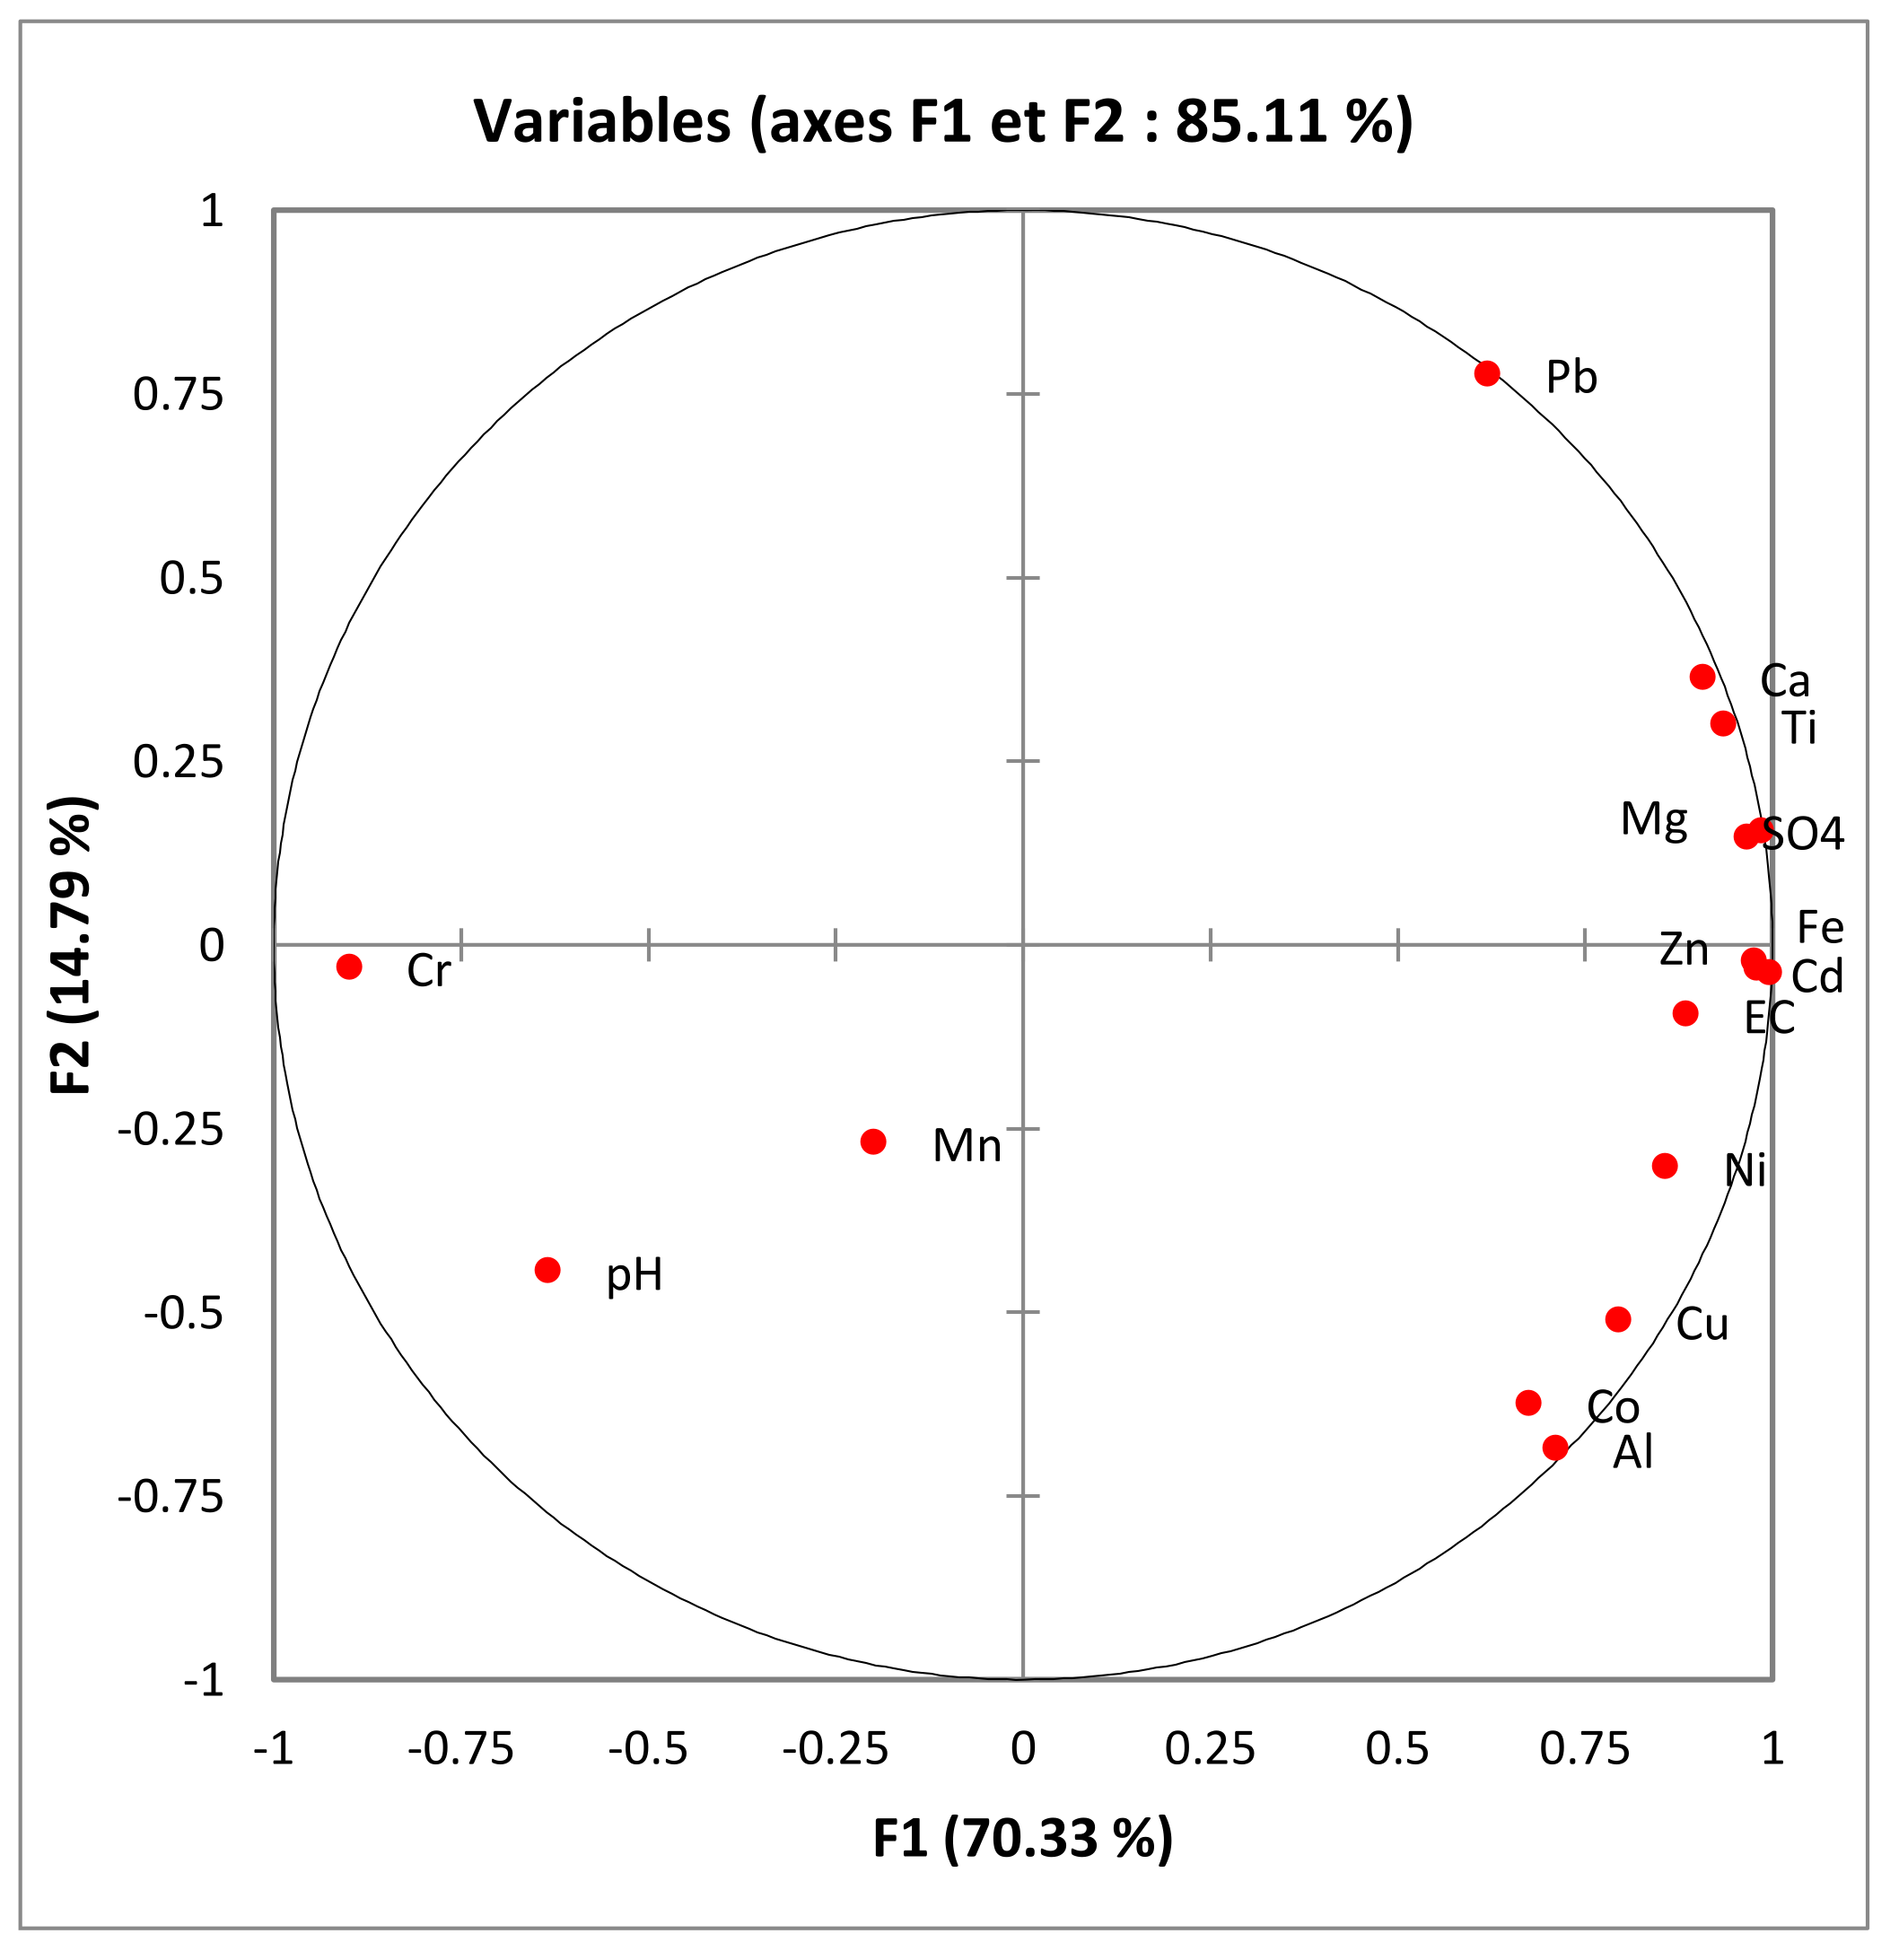
4.2.3. Principal Component Analysis

As previously mentioned, for the purposes of interpretation, only results obtained during two campaigns of water table sampling were considered in the PCA: (i) after the end of the mine site reclamation as the initial stage (first campaign); (ii) three years later (tenth campaign).
  • First campaign
Statistical parameters such as minimum, maximum, median, and mean values were calculated. These parameters were plotted using box plot presentations (Figure 7) for EC, Ca, Al, Fe, Zn, and SO4 [51]. Graphical representation showed the lowest, highest, and median values, as well as the first and third quartiles. Samples were characterized by very broad variation between the minimum and maximum values (Figure 7), which are as follows: EC (498 and 3020 µS/cm), Ca (40.50 and 230.0 mg/L), Al (0.67 and 22.04 mg/L), Fe (11.7 and 194.0 mg/L), Zn (0.03 and 1.99 mg/L), and SO4 (147 and 1343 mg/L). Additionally, the relative standard deviations of the EC, Ca, Fe, Zn, and SO4 (974 µS/cm, 74.52, 80.43, 0.77 and 481.56 mg/L, respectively) were high and indicated that the measured values vary over a large range (Figure 7).
PCA was performed using EC, Al, Ca, Co, Cd, Cr, Fe, Mg, Mn, Ni, Pb, SO4, Ti, Zn and pH as inputs and calculations were limited to three factors. The total percentage of the variance captured by these three factors corresponded to 98.99%; F1 = 87.5%, F2 = 6.4%, and F3 = 5.0% (see Table 3). Since F2 and F3 were lower than 10%, which is the minimum accepted value for hydrochemical groundwater analysis [40,45], they were not included in the PCA interpretation.
The correlations between different variables are presented in Table 4, which shows that the EC and the concentrations of metallic elements and SO4 are correlated. These parameters are mainly related to AMD contamination. The fact that Ti did not present any correlation with other parameters was interpreted as an indication that this element is possibly originating from a different source.
In the spatial presentation, factor F1 is positively correlated with metal (Al, Co, Fe, Mg, Cu, Cr, Ni, Pb and Zn) and SO42− concentrations, as well as with EC (Table 4 and Figure 8) and negatively correlated with pH.
In the spatial representation and along factor F1 (Figure 9), water samples showing low pH values (T6) are opposed to water samples with higher pH values and lower metallic concentrations (T1, T2, T4 and T5). This is an indication that the factor F1 entails opposition between contaminated water with relatively high concentrations and the water without contamination.
Contamination in the water sampled from well T6 is likely related to leaching of the contamination that occurred before the site was reclaimed. However, it is also possible that the contamination is due by the surface effluent water which originates around piezometers CP-1 and CP-2 and where the soil has not been properly cleaned (see Figure 2 for location).
Factors F2 and F3 cannot be interpreted due to low variance expressed by these factors and due to the absence of opposition between water sampled in the observation wells.
  • Tenth campaign
Statistical parameters such as minimum, maximum, median, and mean values were determined and plotted using box plot presentations for EC, Ca, Al, Fe, Zn, and SO4 (Figure 10).
Graphical representation showed the lowest, highest and median values, as well as the first and third quartiles. Samples were characterized by very broad variation between the minimum and maximum values (Figure 10): EC (76 and 292 µS/cm), Ca (10.5 and 115 mg/L), Al (0 and 5.8 mg/L), Fe (0.01 and 16.4 mg/L), Zn (0.004 and 0.276 mg/L), and SO42− (13.1 and 440 mg/L). In addition, the relative standard deviations of the EC, Ca, Fe, Zn and SO4 (86.38 µS/cm, 36.59, 2.61, 7.64 and 170.96 mg/L, respectively) are also presented. These values are lower than those calculated for the first campaign.
A direct comparison to the results obtained during the first campaign (2011, Figure 7) clearly indicates that mineralization of waters sampled during 2014 was lower than that of waters collected during the first campaign. This evolution of water mineralization is related to the beneficial impact of the mine site reclamation.
PCA was performed using the same parameters as in the first campaign and the variance calculation was limited to three factors. Results showed that total percentage of the variance expressed by these three factors corresponded to more than 94.1%, whereas the variance expressed by factors F1 and F2 was 70.3% and 14.8%, respectively. In addition, the variance expressed by factor F3 was about 9%. Therefore, factor F3 was not included in the PCA interpretation (see Table 5 for factors and parameters correlation).
Correlations between different variables are presented in Table 6 and show that the EC and the concentrations of metallic elements and SO4 are correlated. The Mn is correlated to Cr and Ba. In addition, pH was not correlated with Fe, Cu, Co, Cr, Al or EC. These parameters are mainly related to the AMD contamination. However, the fact that Mn presented no correlation with any other parameters was interpreted as an indication that possibly, this element is originating from a different source.
Factor F1 is positively correlated with SO4, Ni, Mg, Fe, Cu, Co, Ca, Cd, Al, Ti, Zn and EC and negatively to Cr, Ba, and pH. These oppositions indicate that when pH decreases, sulfate and metallic elements concentration increase (see Figure 11).
In the spatial representation and along factor F1 (Figure 12), water samples with low pH and relatively high concentrations of SO4 and metallic elements (T6 and T4) are opposed to water samples with low metal concentrations and high pH (T1, T2 and T5).
This is an indication that factor F1 captures the difference between waters with relatively high concentrations in metals, SO4, and low pH and less-contaminated waters with circumneutral pH.
The higher mineralisation of the waters in observation wells T4 and T6 are likely related to the contamination by AMD effluents.
Factor F2 (explaining 14.79% of the variance) is positively correlated with Pb (Figure 12) and along this factor is observed opposition between water with Pb concentration (T3) to the other samples without Pb. Due to low correlations between Pb and Ni, Mn, Cu Co, Ba and Al, the Pb likely has a different origin than that of the AMD.

5. Other Results

Results of the PCA show that contaminated water was collected in observation well F6. This contamination could be related to the location of a channel that drains effluents from the abandoned Aldermac mine site. Surface water likely infiltrates across the monolayer cover, then reaches the water table. However, based on the statistical parameters and the PCA configuration, it may be concluded that the water displays significant improvement (Figure 6 and Figure 10). To illustrate this effect, observation well T6 (considered the most contaminated with AMD) was selected. For this last selected observation well, PCA was performed using all available hydrogeochemical data (Campaigns 1 to 10 performed after mine site reclamation); the variance expressed by three factors being 87.66%.
As presented in Figure 13, factor F1 (79.4% of total variance) correlates positively with all elements except Cr. Factor F2 (8.3% of total variance) correlates positively with Cr. Finally, factor F3 has 5.5% of the total variance. Due to variance expressed by F2 an F3 (lower than 10) these factors cannot be interpreted.
In the individual plan presentation projection and along factor F1, the opposition between highly mineralized waters (samples 1 and 2) and waters with low mineralization (samples 7, 8, 10) is observed (Figure 14). However, along factor F2 there is opposition between metal-loaded waters and waters with low metal concentrations. Two principal groups of groundwater can be identified:
  • Group 1 has a high mineralization and low pH; these samples were collected in the first stage after the mine site reclamation. These waters can be considered contaminated water with existing AMD where the EC ranged between 3020 and 1636 µS/cm and SO4 between 1342 and 1415 mg/L.
  • Group 2 has low mineralization and relatively high pH (close to 5 for samples collected during the tenth campaign). These waters represent low metal contamination.
Between these two groups, two samples with intermediate positions showing the hydrochemical evolution of sampled water were observed. This evolution confirms the positive impact of the mine site reclamation in terms of improvement of the water quality at the Aldemac mine site.

6. Conclusions

The main objective of this study was to evaluate the impact of the construction of a monolayer cover with an EWT at the abandoned Aldemac mine site. The behavior of the EWT was directly influenced by climatic conditions (precipitation input, loss by evaporation or drainage) in addition to the type of floor soils. The level of this water table was consistently maintained above the tailings/cover interface, and on multiple occasions, it was very close to the ground surface. The water table height varied between 0.40 and 0.93 m above the interface.
Hydrogeochemical analyses indicated that:
  • Concentrations of different dissolved elements and EC declined between the first water sampling campaign performed at the end of the site’s reclamation, and the tenth sampling campaign, which was performed three years later.
  • Matrix of correlations indicated that mineral associations of the last campaign were different than those obtained during the first campaign.
All results indicate an improving trend in terms of the geochemical quality of groundwater samples. This effect was confirmed with samples taken from the most contaminated observation well, where a concentrations of all dissolved elements (from the beginning of hydrochemical monitoring in November 2011 until November 2014) showed reductions.
Consequently, these results showed a trend towards improvement of the geochemical quality of the groundwater due to reclamation measures performed at the Aldermac mine site. However, water quality monitoring programs must be pursued. Additionally, hydrogeochemical modeling should be performed in order to estimate the time required for complete dissipation of AMD contamination at the Aldermac mine site.

Author Contributions

Conceptualization, A.M. and M.M.; methodology, A.M. and M.M.; validation, A.M., M.M., M.B. and S.T.; formal analysis, A.M.; investigation, A.M. and M.M.; resources, A.M. and M.M.; data curation, A.M.; writing—original draft preparation, A.M.; writing—review and editing, M.M., M.B. and S.T.; visualization, A.M. and M.M.; supervision, A.M. and M.M.; project administration, A.M. and M.M.; funding acquisition, A.M. and M.M. All authors have read and agreed to the published version of the manuscript.

Funding

This research was funded by Ministère de l’Énergie et des Ressources naturelles, direction du développement et du milieu minier (PU 2010-06-537).

Conflicts of Interest

The authors declare no conflict of interest.

References

  1. Aubertin, M.; Bussière, B.; Bernier, L. Environnement et Gestion des Résidus Miniers [CD-ROM]; Les Éditions de l'École Polytechnique de Montréal: Montréal, QC, Canada, 2002. [Google Scholar]
  2. Ritcey, G.M. Tailings Management, Problems and Solutions in the Mining Industry. In Process Metallurgy 6; Elsevier: Amsterdam, The Netherlands, 1989. [Google Scholar]
  3. SRK. Guide Technique Préliminaire sur le Drainage Rocheux Acide; BCAMD Task Force; Centre de Recherches Minérales: Québec, QC, Canada, 1989; Volume 1. [Google Scholar]
  4. MEND. MEND Manual; Report 5.4.2; Secretariat CANMET: Ottawa, ON, Canada, 2001; Volume 4-Prevention and Control. [Google Scholar]
  5. Fraser, W.W.; Robertson, J.D. Subaqueous Disposal of Reactive Mine Waste: An Overview and Update of Case Studies-MEND/Canada. In Proceedings of the International Land Reclamation and Mine Drainage Conference and 3rd International Conference on the Abatement of Acidic Drainage, Pittsburgh, PA, USA, 24–30 April 1994; pp. 250–259. [Google Scholar]
  6. Amyot, D.; Vézina, S. Flooding as a Reclamation Solution to an Acidic Tailings Pond-the Solbec case. In Proceedings of the 4th International Conference on Acid Rock Drainage, Vancouver, BC, Canada, 31 May–6 June 1997; pp. 681–696. [Google Scholar]
  7. Simms, P.H.; Yanful, E.K.; St-Arnaud, L.; Aubé, B. A laboratory evaluation of metal release and transport in flooded preoxidized mine tailings. Appl. Geochem. 2001, 15, 1245–1263. [Google Scholar] [CrossRef]
  8. Cabral, A.; Racine, I.; Burnotte, F.; Lefebvre, G. Diffusion of oxygen through a pulp and paper residue barrier. Can. Geotech. J. 2000, 37, 201–217. [Google Scholar] [CrossRef]
  9. Tassé, N.; Germain, D. Performance of Forestry Wastes for the Treatment of Acid Mine Drainage through a Reactive Barrier. In Proceedings of the 7th International Symposium on Environmental Issues and Waste Management in Energy and Mineral Production (SWEMP 2002), Calgliari, Italy, 7–10 October 2002; pp. 723–773. [Google Scholar]
  10. Nicholson, R.V.; Gillham, R.W.; Cherry, J.A.; Reardon, E.J. Reduction of acid generation in mine tailings through the use of moisture-retaining cover layers as oxygen barriers. Can. Geotech. J. 1989, 26, 1–8. [Google Scholar] [CrossRef]
  11. Collin, M.; Rasmuson, A. Mathematical Modelling of Water and Oxygen Transport in Layered Soil Covers for Deposits of Pyritic Mine Tailings, Acid Mine Drainage: Designing for Closure. In Proceedings of the GAC-MAC Annual Meeting, Vancouver, BC, Canada, 16–18 May, 1990; pp. 311–333. [Google Scholar]
  12. Bussière, B.; Maqsoud, A.; Aubertin, M.; Martschuk, J.; McMullen, J.; Julien, M. Performance of the oxygen limiting cover at the LTA site, Malartic, Québec. Env. Soc. CIM 2006, 99, 1–11. [Google Scholar]
  13. Bussière, B.; Maqsoud, A.; Aubertin, M.; Martschuk, J.; McMullen, J.; Julien, M. Results from the Monitoring Program at the LTA Site: Hydraulic Behaviour of the Cover. In Proceedings of the Mining Industry Conference, Montréal, QC, Canada, 27–29 May 2003. [Google Scholar]
  14. Bussière, B.; Maqsoud, A.; Demers, I.; Doumbouya, I. Modélisation Physique de Divers Scénarios de Recouvrement et Étude du Comportement Hydrogéologique: Site Manitou; Report PU-2008-03-371 for MERN; Quebec’s Ministry of Energy and Natural Resources: Rouyn-Noranda, QC, Canada, 2009. [Google Scholar]
  15. Maqsoud, A.; Bussière, B.; Mbonimpa, M.; Aubertin, M.; Chouteau, M. Suction break to control slope-induced effects in covers used as gas barrier. Can. Geotech. J. 2011, 48, 53–71. [Google Scholar] [CrossRef]
  16. Maqsoud, A.; Bussière, B.; Turcotte, S.; Roy, M. Performance Evaluation of Covers with Capillary Barrier Effects (CCBE) under Deep Groundwater Conditions Using Experimental Cells. In Proceedings of the Conférence Canadienne de Géotechnique, GeoOttawa, Ottawa, ON, Canada, 1–4 October 2017. [Google Scholar]
  17. Dagenais, A.M. Technique de Contrôle du Drainage Minier Acide Basées sur les Effets de Barrière Capillaire. Ph.D. Thesis, Polytechnique Montréal, Montreal, QC, Canada, 2005. [Google Scholar]
  18. Ethier, M.P.; Bussière, B.; Aubertin, M.; Maqsoud, A.; Demers, I.; Dionne, J. Field Investigation Results of the Elevated Water Table Technique Combined with a Monolayer Cover on Reactive Tailings. In Proceedings of the Conference Canadienne de Géotechnique, GeoRegina, Regina, SK, Canada, 28 September–1 October 2014 [CD-ROM]. [Google Scholar]
  19. Ethier, M.P.; Bussière, B.; Aubertin, M.; Maqsoud, A.; Lacroix, R. In Situ Evaluation of the Elevated Water Table Technique Combined with a Monolayer Cover Made with Low Sulphide Tailings: Monitoring Strategy and Preliminary Results. In Proceedings of the 66th Canadian Geotechnical Conference and the 11th Joint CGS/IAH-CNC Groundwater Conference, Montréal, QC, Canada, 29 September–3 October 2013 [CD-ROM]. [Google Scholar]
  20. Maqsoud, A.; Mbonimpa, M.; Bussière, B.; Dionne, J. Réhabilitation du Site Minier Abandonné Aldermac, Résultats Préliminaires du Suivi de la Nappe Surélevée. In Proceedings of the 66th Canadian Geotechnical Conference and the 11th Joint CGS/IAH-CNC Groundwater Conference, Montréal, QC, Canada, 29 September–3 October 2013. [Google Scholar]
  21. Maqsoud, A.; Mbonimpa, M.; Bussière, B.; Benzaazoua, M. The Hydrochemical Behaviour of the Aldermac Abandoned Mine Site after its Rehabilitation. In Proceedings of the Conférence Canadienne de Géotechnique, GeoQuébec, Québec, QC, Canada, 20–23 September 2015. [Google Scholar]
  22. Ouangrawa, M.; Aubertin, M.; Molson, J.W.; Bussière, B.; Zagury, G.J. Preventing acid mine drainage with an elevated water table: Long-term column experiments and parameter analysis. Water Air Soil Pollut. 2010, 213, 437–458. [Google Scholar] [CrossRef]
  23. Ouangrawa, M.; Molson, J.; Aubertin, M.; Zagury, G.; Bussière, B. The Effect of Water Table Elevation on Acid Mine Drainage from Reactive Tailings: A Laboratory and Numerical Modeling Study. In Proceedings of the 7th International Conference on Acid Rock Drainage (ICARD), St. Louis, MO, USA, 26–30 March 2006; Barnhisel, R.I., Ed.; The American Society of Mining and Reclamation: St. Louis MO, USA, 2006; pp. 1473–1482. [Google Scholar]
  24. Demers, I.; Bussière, B.; Rousselle, M.; Aubertin, M.; Pabst, T.; Lacroix, R. Laboratory Evaluation of Reclamation Scenarios for the Spillage Areas of the Abandoned Manitou Mine Site Using Goldex Tailings. In Proceedings of the World Mining Congress, Montréal, QC, Canada, 11–15 August 2013. [Google Scholar]
  25. Pabst, T.; Aubertin, M.; Bussière, B.; Molson, J. Column tests to characterize the hydrogeochemical response of pre-oxidised acid-generating tailings with a monolayer cover. Water Air Soil Pollut. 2014, 225, 1841. [Google Scholar] [CrossRef]
  26. Maqsoud, A.; Bussère, B.; Mbonimpa, M. Low Saturated Hydraulic Conductivity Covers. In Hard Rock Mine Reclamation: From Prediction to Management of Acid Mine Drainage; Bussière, B., Guittonny, M., Eds.; CRC Press: New York, NY, USA, 2021. [Google Scholar]
  27. SNC-Lavalin. SNC-Lavalin. Restauration du Site Minier Aldermac, Rapport tel que construit des travaux effectués en 2008-2009, Ministère des Ressources naturelles et de la Faune Rouyn-Noranda, Québec, 2010, SNC-Lavalin, Mines et Métallurgie. Available online: chrome-extension://efaidnbmnnnibpcajpcglclefindmkaj/viewer.html?pdfurl=https%3A%2F%2Fmern.gouv.qc.ca%2Fwp-content%2Fuploads%2FDocument_17-01-033-N.pdf&clen=17914532&chunk=true (accessed on 1 February 2022).
  28. Cyr, J.; Maurice, R.; Isabelle, D. Restauration du Site Minier Aldermac. In Proceedings of the Symposium Rouyn-Noranda: Mines and the Environment, Rouyn-Noranda, Québec, QC, Canada, 6–19 November 2011 [CD-ROM]. [Google Scholar]
  29. Elberling, B.; Nicholson, R.V. Field determination of sulphide oxidation rates in mines tailings. Water Resour. Res. 1996, 32, 1773–1784. [Google Scholar] [CrossRef]
  30. Tibble, P.A.; Nicholson, R.V. Oxygen consumption on sulphide tailings and covers: Measured rates and applications. In Proceedings of the 4th International Conference on Acid Rock Drainage, Vancouver, BC, Canada, 31 May–6 June 1997; pp. 647–661. [Google Scholar]
  31. Elberling, B.; Damgaard, L.R. Microscale measurement of oxygen diffusion and consumption in subaqueous sulphide tailings. Geochem. Cosmochim. Acta 2001, 65, 1897–1905. [Google Scholar] [CrossRef]
  32. Hollings, P.; Hendry, M.J.; Nicholson, R.V.; Kirkland, R.A. Quantification of oxygen consumption and sulphate release rates for waste rock piles using kinetic cells: Cluff Lake uranium mine, northern Saskatchewan, Canada. Appl. Geochem. 2001, 16, 1215–1230. [Google Scholar] [CrossRef]
  33. Mbonimpa, M.; Aubertin, M.; Aachib, M.; Bussière, B. Diffusion and consumption of oxygen in unsaturated cover materials. Can. Geotech. J. 2003, 40, 916–932. [Google Scholar] [CrossRef]
  34. Mbonimpa, M.; Aubertin, M.; Bussière, B. Oxygen consumption test to evaluate the diffusive flux into reactive tailings: Interpretation and numerical assessment. Can. Geotech. J. 2011, 48, 878–890. [Google Scholar] [CrossRef]
  35. Maqsoud, A.; Bussière, B.; Bouzahzah, H. Physical modelling of different reclamation scenarios for the abandoned Principale mine site (Quebec, Canada). In Proceedings of the Tailing and mine waste, Vancouver, BC, Canada, 19–23 November 2019. [Google Scholar]
  36. Maqsoud, A.; Diaby, S.; Mbonimpa, M. Performance evaluation of Ity mine site reclamation (Ivory Coast) using physical models based on clay materials. J. Afr. Earth Sci. 2021, 176, 104110. [Google Scholar] [CrossRef]
  37. Puls, R.W.; Barcelona, M.J. Low-Flow (Minimal Grawdown) Groundwater Sampling Procedures in Ground Water Issues, US; EPA, EPA/540/540/S-95/504; EPA Environmental Research Center: Ada, OK, USA, 1996. [Google Scholar]
  38. Puls, R.W.; Cynthia, J.P. Low-Flow Purging and Sampling of Ground Water Monitoring Wells with Dedicated Systems. Groundw. Monit. Remediat. 1995, 15, 116–123. [Google Scholar] [CrossRef]
  39. Curran, C.A.; Eng, K.; Konrad, C.P. Commission Analysis of Low Flows and Selected Methods for Estimating Low-Flow Characteristics at Partial-Record and Ungagged Stream Sites in Western Washington; Report 2012–5078; Survey Scientific Investigations; U.S. Geological Survey: Reston, VA, USA, 2012. Available online: http://pubs.usgs.gov/sir/2012/5078/pdf/sir20125078.pdf (accessed on 31 January 2022).
  40. Maqsoud, A.; Neculita, C.; Bussière, B.; Benzaazoua, M. Hydrochemical evolution of the Abandoned Manitou Mine site during and after tailings deposition. Environ. Sci. Pollut. Res. 2016, 23, 9054–9072. [Google Scholar] [CrossRef] [PubMed]
  41. Wold, S.; Esbensen, K.; Geladi, P. Chemometric and intelligent. Lab. Syst. 1987, 2, 27–52. [Google Scholar]
  42. Farnham, I.M.; Johannesson, K.H.; Singh, A.K.; Hodge, V.F.; Stetzenbach, K.J. Factor analytical approaches for evaluating groundwater trace elementchemistry data. Anal. Chim. Data 2003, 490, 123–138. [Google Scholar] [CrossRef]
  43. Joliffe, I. Principal Component Analysis. In Encyclopedia of Statistics in Behavioral Science; John Wiley & Sons, Ltd: Hoboken, NJ, USA, Print; ISBN 9780470860809.
  44. Lghoul, M.; Maqsoud, A.; Hakkou, R.; Kchikach, A. Hydrochemical study on the contamination of groundwater in an abandoned mine area, Kettra (Morocco). J. Geochem. Explor. 2013, 144, 456–467. [Google Scholar] [CrossRef]
  45. Bakalowicz, M. Water geochemistry: Water quality and dynamics. Groundw. Ecol. 1994, 4, 97–127. [Google Scholar]
  46. Blavoux, B.; Mudry, J. Utilisation de l’analyse en composantes principales pour l’étude du fonctionnement hydrocinématique de trois aquifères karstiques de la France. Hydrogéologie 1985, 1, 53–59. [Google Scholar]
  47. Helena, B.; Pardo, R.; Vega, M.; Barrado, E.; Fernandez, J.M.; Fernandez, L. Temporal evolution of groundwater composition in an alluvial aquifer (Pisuerga River, Spain) by principal component analysis. Water Res. 2000, 34, 807–816. [Google Scholar] [CrossRef]
  48. Maqsoud, A.; Veillette, J.; Bakalowicz, M. Hydrochimie de l’esker Saint Mathieu-Lac Berry. In Proceedings of the 57th Canadian Geotechnical Conference, Québec, QC, Canada, 25–27 October 2004; pp. 28–35. [Google Scholar]
  49. Singh, E.J.K.; Gupta, A.; Singh, N.R. Groundwater quality in Imphal West District, Manipur, India, with multivariate statistical analysis of data. Environ. Sci. Pollut. Res. 2013, 20, 2421–2434. [Google Scholar] [CrossRef] [PubMed]
  50. Santolaria, Z.; Urieta, J.S.; Lanaja, F.J.; Pardo, A.; Rodriguez-Casals, C. Hydrochemistry dynamics in remote mountain lakes and its relation to catchment and atmospheric features: The case study of Sabocos Tarn, Pyrenees. Environ. Sci. Pollut. Res. 2015, 22, 231–247. [Google Scholar] [CrossRef] [PubMed]
  51. Güler, C.; Thyne, G.-D.; McCray, J.-E.; Turner, A.-K. Evaluation of graphical and multivariante statistical methods for classification of water chemistry data. Hydrogeol. J. 2002, 10, 455–474. [Google Scholar] [CrossRef]
Figure 1. Location of the Aldermac mine site (modified from [27]).
Mining 02 00005 g001
Figure 2. Location of different sectors at the Aldermac mine site (modified from [27]): T1 to T11 and CP-1 and CP-2 are piezometers; ALD 9 and ALD10 are the water effluent of the mine site.
Mining 02 00005 g002
Figure 3. Piezometric level measurements (in meters above sea level—MASL) performed in various observation wells installed in the Aldermac mine site.
Mining 02 00005 g003
Figure 4. Continuous piezometric level measurements at observation well T4.
Mining 02 00005 g004
Figure 5. Electrical conductivity and pH in water samples from wells T1–T6.
Mining 02 00005 g005
Figure 6. Evolution of Ca2+ + Mg2+ vs. SO42−.
Mining 02 00005 g006
Figure 7. Distribution of major components in sampled water collected during the first campaign.
Mining 02 00005 g007
Figure 8. Principal component analysis for sampled water during first campaign: projection of variables on the plane F1-F2.
Mining 02 00005 g008
Figure 9. Principal component analysis for sampled water during first campaign: projection of individuals on the plane F1-F2.
Mining 02 00005 g009
Figure 10. Distribution of major components in sampled water collected during last campaign.
Mining 02 00005 g010
Figure 11. Principal component analysis for water sampled during the tenth campaign: projection of variables on the plane F1-F2.
Mining 02 00005 g011
Figure 12. Principal component analysis for water sampled during the tenth campaign: projection of individuals on the plane F1-F2.
Mining 02 00005 g012
Figure 13. Principal component analysis for sampled water at the observation well T6: projection of variables on the plane F1-F2 (campaigns 1 to 10).
Mining 02 00005 g013
Figure 14. Principal component analysis for sampled water at the observation well T6: projection of individuals on the plane F1-F2 (campaigns 1 to 10).
Mining 02 00005 g014
Table 1. The different layers encountered below the cover (from top to bottom) and their thicknesses.
Thickness (m)Sand and GravelTailingsTop SoilClayGlacial TillRock
T71.072.891.6810.871.83
T81.522.591.5217.151.57
T9 4.93
T10 1.10 4.29
T11 1.523.350.761.09
T12 1.103.762.05
CP1 4.24
CP2 4.121.24
Table 2. Minimum, maximum and average water table level in meters above the cover/tailings interface.
Observation WellMinimum (m)Maximum (m)Average (m)
T10.750.880.79
T20.850.990.93
T30.590.730.66
T40.830.980.91
T50.590.970.80
T60.340.480.40
Table 3. Correlation between chemical parameters from observation wells installed in 2011 (first campaign).
Factor F1 (87.5%)Factor F2 (6.4%)Factor F3 (5%)
SO40.97−0.19−0.10
Pb0.610.410.67
Ni0.990.04−0.07
Mn0.890.30−0.31
Mg0.980.06−0.15
Fe0.88−0.30−0.14
Cu0.95−0.210.09
Co0.960.16−0.07
Cr0.930.22−0.18
Ca0.98−0.10−0.14
Cd0.960.120.26
Ba−0.200.82−0.28
Al0.990.010.03
Ti0.960.200.14
Zn0.95−0.040.27
EC0.98−0.11−0.17
pH−0.920.28−0.02
Table 4. Correlation between variables and factors (F1 and F2) from observation wells installed in 2011 (first campaign).
VariablesSO4PbNiMnMgFeCuCoCrCaCdBaAlTiZnEcpH
SO41
Pb0.461
Ni0.950.571
Mn0.830.460.931
Mg0.950.520.990.951
Fe0.960.340.830.680.841
Cu0.970.570.900.730.890.961
Co0.890.600.990.950.980.720.821
Cr0.850.530.960.980.970.680.760.991
Ca0.990.470.970.890.980.920.950.920.911
Cd0.880.810.940.810.910.760.900.920.870.881
Ba−0.28−0.04−0.190.08−0.15−0.23−0.29−0.13−0.06−0.23−0.171
Al0.960.630.990.890.980.850.930.970.930.960.97−0.211
Ti0.880.760.970.890.950.730.860.970.940.900.98−0.120.931
Zn0.920.760.900.730.880.860.970.850.780.900.97−0.220.950.931
EC0.990.450.970.880.980.940.950.910.890.990.88−0.210.960.890.901
pH−0.95−0.46−0.89−0.69−0.87−0.92−0.94−0.82−0.75−0.89−0.860.35−0.92−0.90−0.900.921
Table 5. Correlation between variables and factors (F1 and F2) from observation wells installed on the abandoned Aldermac mine site, in 2014 (tenth campaign).
Factor F1 (70.3%)Factor F2 (14.8%)Factor F3 (9%)
SO40.990.160.03
Pb0.620.78−0.05
Ni0.86−0.300.22
Mn−0.20−0.270.86
Mg0.970.150.21
Fe0.98−0.02−0.15
Cu0.79−0.51−0.25
Co0.68−0.620.16
Cr−0.90−0.030.43
Ca0.910.360.12
Cd0.99−0.04−0.03
Al0.71−0.69−0.13
Ti0.940.300.04
Zn0.98−0.030.06
EC0.89−0.090.13
pH−0.63−0.44−0.34
Table 6. Correlation between chemical parameters from observation wells installed on the Aldermac mine site, in 2014 (tenth campaign).
VariablesSO4PbNiMnMgFeCuCoCrCaCdAlTiZnEcpH
SO41
Pb0.741
Ni0.790.251
Mn−0.19−0.34−0.031
Mg0.980.700.82−0.051
Fe0.960.610.76−0.260.911
Cu0.710.130.71−0.160.640.861
Co0.55−0.110.930.040.590.600.741
Cr−0.88−0.61−0.660.55−0.79−0.94−0.81−0.511
Ca0.960.850.65−0.120.960.870.520.36−0.781
Cd0.970.590.88−0.240.950.970.810.71−0.910.871
Al0.59−0.080.76−0.040.560.740.970.86−0.680.390.741
Ti0.980.830.66−0.160.960.920.610.39−0.840.990.910.471
Zn0.950.560.93−0.200.950.920.750.75−0.850.860.990.700.881
EC0.890.510.660.120.880.910.800.53−0.750.850.850.710.880.801
pH−0.67−0.68−0.660.15−0.73−0.49−0.10−0.38−0.42−0.96−0.64−0.07−0.650.73−0.331
Publisher’s Note: MDPI stays neutral with regard to jurisdictional claims in published maps and institutional affiliations.

