Article

Consistency and Rheological Properties of Cemented Paste Backfills Prepared with Tailings with Varying Free Muscovite Content

Research Institute of Mines and Environment (RIME), Université du Québec en Abitibi-Témiscamingue (UQAT), Rouyn-Noranda, QC J9X 5E4, Canada
*
Author to whom correspondence should be addressed.
Mining 2025, 5(1), 10; https://doi.org/10.3390/mining5010010
Submission received: 25 July 2024 / Revised: 14 January 2025 / Accepted: 19 January 2025 / Published: 26 January 2025

Abstract

:
The presence of free muscovite in tailings can negatively affect the mechanical strength and rheological properties of cemented paste backfill, as has been observed for several cementitious materials. The aim of this study is to evaluate the influence of free muscovite content in tailings on the consistency and rheology of cemented paste backfill. For this purpose, cemented paste backfill mixtures were prepared from two different tailings. The mixtures were prepared at solids contents between 70% and 74% and with the addition of 5% GU (general use Portland cement)/slag binder. In addition, the influence of muscovite was studied by varying the muscovite content of the tailings from about 14% to 25%. Abrams cone slump tests and rheological analyses were carried out for each recipe. The results show a decrease in slump height and an increase in yield stress, Herschel–Bulkley flow index, and infinite shear rate Cross viscosity with increasing muscovite content for a given solids content. Therefore, water should be added to maintain the required flowability of cemented paste backfill, which increases the water/binder ratio and may affect the mechanical strength. A method is presented for determining the amount of binder to be incorporated to maintain the water/binder ratio of the original cemented paste backfill recipe.

1. Introduction

Throughout its history, the mining sector has been a pivotal contributor to Quebec’s economic, political, and social advancement. Quebec is home to a diverse range of mining resources, with the majority concentrated in the Abitibi-Témiscamingue, Côte-Nord, and Nord-du-Québec regions [1]. The exploitation of precious and base metals, which is becoming increasingly scarce and costly, has a considerable influence on the global demand for these materials. However, mining also generates a substantial amount of mine waste, including waste rock and concentrator waste commonly known as mine tailings.
Mine tailings are typically stored in the form of slurry, with a solids content by mass (Cw) between 25% and 45% [2]. However, this type of storage presents risks of hydro-geotechnical instability that could lead to the failure of the retaining dykes. To remedy this instability problem, which is primarily caused by water, some mining companies are increasingly adopting densified tailings storage in the form of thickened [3], paste [4], or filtered [5] tailings.
Cemented paste backfill (CPB) is another method of tailings management that can reduce the volume of tailings stored at the surface by up to 50% [6]. CPB is prepared from filtered tailings, binder, and mixing water. The purpose of underground backfilling is to provide structural stability to maintain the rock masses around the mined areas (voids), thereby increasing the safety of personnel, equipment, and infrastructure against various incidents that could compromise ground stability. Mine backfilling also allows the recovery of economically viable ore pillars that act as supports [7,8,9,10,11,12].
While backfilling can reduce the financial burden of environmental taxes associated with the storage of tailings on the surface of tailings impoundments, it is important to note that the use of binders can lead to an increase in operational costs. The binder represents the costliest component of the mine backfill operation. Indeed, [13] indicated that the costs associated with cemented mine backfill typically represent 20% of the total cost of mining operations, with binder costs representing 75% of backfilling costs in Canada. As indicated by [14], the costs associated with cemented mine backfill typically account for between 25% and 40% of the total costs incurred in mining operations in China. Furthermore, the costs of cementitious agents account for approximately 70% to 80% of the overall costs associated with backfilling. Although the property sought for CPB is its mechanical strength, generally expressed in terms of the unconfined uniaxial compressive strength, the rheology of these materials is also important. CPB is typically transported from the preparation plant to the excavated sites for filling via pipelines and boreholes. The transportation of CPB (as with many other paste-like materials) is dependent on its consistency and rheological properties, which permit its conveyance by gravity or by a combination of pumping and gravity [15]. It is of the utmost importance to prevent plugging phenomena on CPB distribution lines, which account for 35% of all issues inherent to cemented paste backfill technology and 65% of issues specific to transport [16]. Therefore, an appropriate design of the distribution line is required. Loop flow tests remain the optimal tool for this design [17,18,19,20,21,22]. Nevertheless, it is not feasible to conduct such costly tests on a regular basis to accommodate the fluctuations in the physical, chemical, and mineralogical properties of CPB. The design for estimating head losses and pumping pressures based on the rheological properties of CPB mixtures and numerical modelling [19,22] represents an alternative, less costly solution for loop flow testing. As previously stated, the composition of the CPB is a mixture of filtered tailings, binder, and water [23,24]. The selection of the binder type to be added to the mixture, which is expressed as a percentage Bw (the mass of the binder in relation to the dry mass of the solids in the CPB), is of paramount importance to achieve the desired mechanical strength. The percentage of binder (Bw) is typically within the range of 3% to 10% [25,26,27]. Similarly, the type of mixing water (fresh water, lake water, or recycled process water) and its quantity are determining factors in obtaining a specific consistency, which is typically expressed in terms of cone slump, with a typical range of 15–25 cm [12,13,28].
While these parameters are relatively controllable in the CPB preparation process, this is not the case for mine tailings, whose physical, chemical, and mineralogical characteristics can vary over time during mine backfill operations. The physical characteristics may include variations in grain size distribution, depending on the liberation mesh, relative density of solid grains or specific gravity, and specific surface. This study focuses on the mineralogical variability of the tailings, with a particular emphasis on the phyllosilicate content, particularly the muscovite (sericite), which belongs to the mica group. The presence of muscovite is a common occurrence in the mining districts of Quebec [29,30,31,32].
It is well established in the field of concrete and mortar that free phyllosilicates, particularly those belonging to the mica group, can have a detrimental impact on the water absorption, consistency, and strength of cementitious materials [33,34,35,36]. It is widely acknowledged that the presence of phyllosilicates, such as muscovite, can exert considerable influence on the rheological properties of cementitious materials. In the case of fresh cement pastes containing a polycarboxylate superplasticizer, for example, the presence of free muscovite has been demonstrated to significantly impair the dispersing capacity of the superplasticizer, leading to a loss of fluidity and an increase in the paste shear threshold (yield stress) and plastic viscosity [37]. In general, muscovite and other phyllosilicate minerals are characterized by their distinctive crystallochemical structure. Some of these minerals, such as micas, exhibit a planar morphology, characterized by crystals arranged in layers [38], compared to other silicate families that do not exhibit this habitus and tend to form grains whose shape is dependent on the crystallization system [39]. With this typical planar morphology, the surface charges of muscovite suspensions exhibit a distinctive electrostatic anisotropy, a property commonly observed in numerous other phyllosilicates. In contrast, other mineral families display isotropic behaviour [40,41]. This electrostatic anisotropy affects the nature of interactions between muscovite particles in a solid suspension. As suggested by [42,43], three principal modes of particle association can occur for planar minerals, depending on pH: face-to-face, edge-to-face, and edge-to-edge. The rheological properties of the muscovite are influenced by these interparticle interactions, as well as by the water that is absorbed and/or adsorbed by the sheets [44,45,46,47,48]. In the study conducted by [47], suspensions of pure vermiculite, muscovite, and quartz were analyzed (at 5–30%, 10–35%, and 10–40% solids by volume for vermiculite, muscovite, and quartz, respectively). With increasing solids content, the muscovite mineral exhibited a notable enhancement in specific rheological characteristics, including yield stress and viscosity, compared to other minerals such as quartz. This phenomenon was primarily attributed to the anisotropic surface charge of the muscovite, as evaluated through electrokinetic zeta potential measurements and potentiometric titration. The findings indicated that the surface charge could undergo variations depending on the pH of the suspension, leading to diverse types of particle–particle interactions and ultimately affecting the fluid’s flowability. Furthermore, the type of phyllosilicate was shown to uniquely impact the variability of rheological properties, depending on whether the phyllosilicate structure was planar, fibrous, or spongy [44,45,48].
To date, there is a paucity of research investigating the impact of the mineralogy of mine tailings on the consistency, rheological properties, and mechanical strength of CPBs. It is therefore conceivable that the presence of free phyllosilicates in tailings, particularly free muscovite, could negatively impact the rheological properties and mechanical strength of CPBs. This negative impact on rheological properties may result in a high demand for pumping energy to avoid pipeline blockage. Given the potential for muscovite content in tailings to vary over time, it is recommended that the application of a CPB recipe defined by a standard cone slump determined in flow loop testing should be accompanied by constant monitoring of the slump and mineralogy. This allows the implementation of necessary corrective measures. Furthermore, knowledge of the rheological properties can provide additional information that may facilitate a more comprehensive understanding of the impact of this mineralogical variation.
The objective of this study was to ascertain the influence of the free muscovite content (X) (X = mass of dry muscovite/mass of dry tailings) on the consistency and rheological properties of CPB mixtures. To this end, consistency tests and rheological analyses were conducted on CPB mixtures prepared using the above-mentioned tailings, to which pure muscovite was added to produce CPB mixtures with varying muscovite contents. To ascertain the impact of muscovite content alone, it is essential that the muscovite be added to tailings that possess a particle size distribution identical to that of the tailings. This study provides operational guidelines to help underground mine backfill operators consider the variability of muscovite in tailings. It should be mentioned that the influence of the muscovite content on the mechanical strength of CPB was addressed in a companion study.

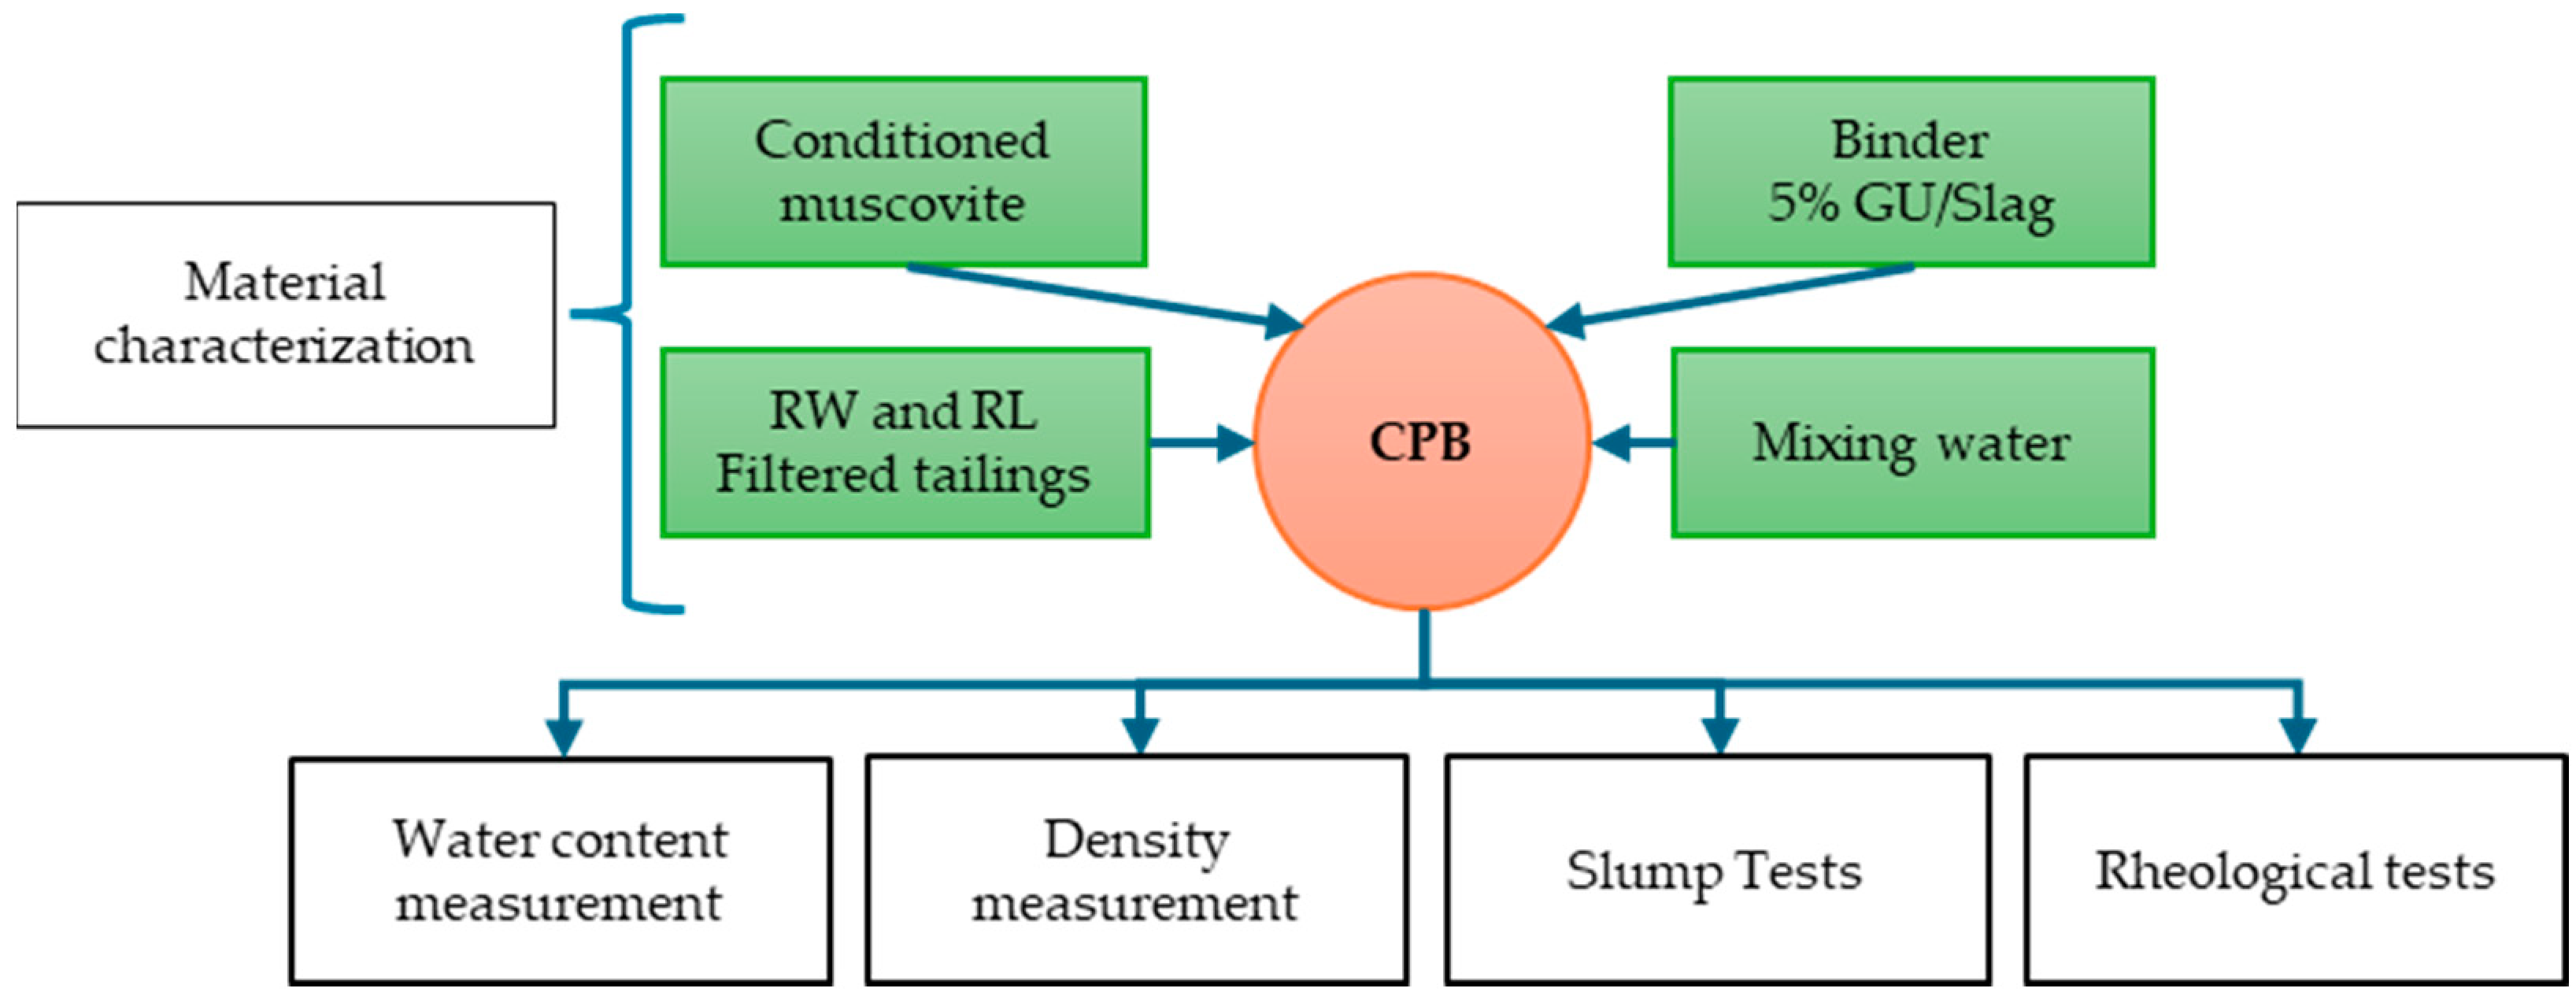
2. Material Characterization and Methodology

The flowchart in Figure 1 illustrates the experimental program. The program began with conditioning the muscovite and characterizing the materials. CPB mixtures with varying proportions of muscovite were prepared at fixed solids contents and subjected to standard Abrams cone tests and rheological analyses. The details are presented in the subsequent sections.

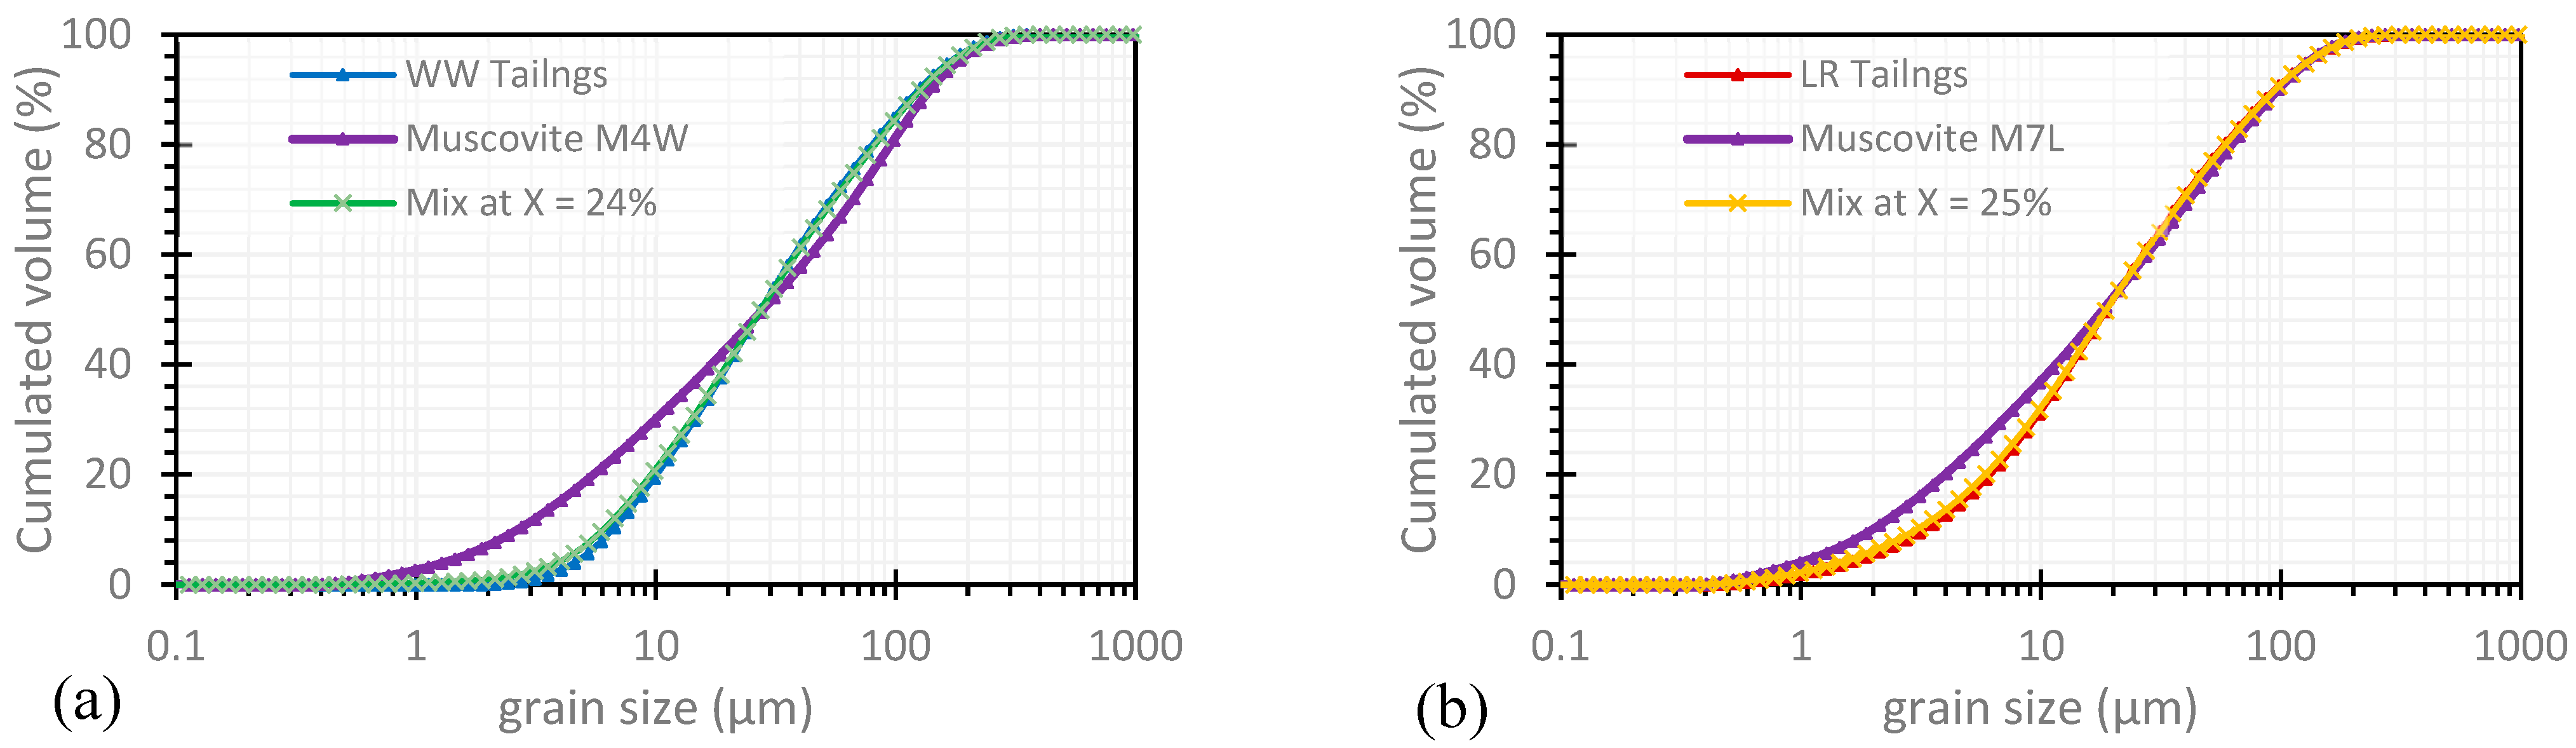
2.1. Physical Characterization of Mine Tailings and Muscovite

The materials employed in this study comprised mine tailings sampled from two distinct Abitibi mines, designated RL and RW. Approximately 200 kg of each type of filtered tailings was received in a filtered state. The muscovite used to amend the tailings was obtained from muscovite veins within a pegmatite dyke of a poorly mineralized lithium and niobium/tantalum occurrence at the Aldous site in Preissac, which was performed with permission from the owner of the mining claim. The geographic coordinates of the sampling site, as collected on site, were 48°22′33.3″ N 78°14′31.8″ W. This raw muscovite was meticulously prepared with the objective of obtaining a material with the purest possible mineralogical composition and a particle size curve as close as possible to that of the tailings. The preparation of this raw muscovite commenced with a series of steps (1 to 8, see Figure 2)), including washing, sorting, drying, the separation of minerals, and the pulverization of the separated pure sheets. Further details on the pulverization process are provided below.
Following homogenization, the materials were subjected to physical characterization, including the determination of the gravimetric water content (w), the relative density of solid grains or specific gravity (Gs), and the specific surface area (Ss).
The water content (w) was determined by drying the sample. Subsequently, this value is employed to calculate the solids content by weight (Cw) of the tailings with the following Equation (1) (Cw = mass of solids/wet mass of the material):
C w = 1 1 + w  
The homogenized RL and RW tailings exhibited water contents w of 17.6% and 22.3% and solids contents Cw of 85% and 81.8%, respectively. The pulverized muscovite was dry (w = 0% and Cw = 100%).
The particle size distribution curves of the materials were determined using a Malvern Panalytical Mastersizer 3000 laser particle sizer (Malvern Panalytical Ttd, Malvern, UK). Figure 3 illustrates the particle size distributions of the two tailings, demonstrating that the RW tailings exhibit slightly coarser particle sizes than the RL tailings. The maximum grain size of both tailings was approximately 300 µm.
Table 1 illustrates the particle size characteristics of the mine tailings utilized in this study. The diameters, Dp, correspond to p% passing on the cumulative grain-size distribution curve. The coefficients of uniformity (CU) are 8 and 6 (indicating well-graded materials as CU > 5) and the coefficients of curvature (CC) are 1.03 and 0.84 for the RL and RW tailings, respectively. The proportions of particles smaller than 20 µm (P20µm) and 80 µm (P80µm) are 52% and 40% for RL, and 87% and 80% for RW, respectively.
The pulverization process of the muscovite was conducted using a Fritsch Planetary Ball Mill Pulverisette 5 (Fritsch, Idar-Oberstein, Germany). In the first stage, the pulverization aimed to reduce the dimensions of the muscovite from centimetre-sized sheets to millimetre- and micrometre-sized powders. The resulting material was then subjected to a 300 µm sieving process, which corresponded to the maximum size of the RL and RW tailings. The fraction of particles smaller than 300 µm in diameter was then subjected to a series of additional pulverization steps with varying duration of pulverization duration and grinding speeds. This procedure enabled us to find the ideal muscovite pulverization time and speed to obtain a particle size distribution curve of the muscovite close to that of each of the two tailings under consideration. One of the conditions for achieving this particle size distribution concordance was to ensure that the P20µm values for the tailings and muscovite were closely aligned, given the influence of P20µm on the rheological properties of CPB [49]. The particle size curves for muscovite pulverized at 300 rpm for 7 min (referred to as M7L) and for 4 min (referred to as M4W) were as similar as possible to those for the RW and RL tailings, respectively.
Figure 4 presents a comparison of the particle size distributions of the RL and RW tailings with those of the respective muscovite powders, M7L and M4W. The particle size characteristics of M7L and M4W are presented in Table 1. The particle size distribution curves of the muscovite powders are similar to those of their respective tailings, although there is a tendency for the former to exhibit finer fractions from D50 onwards. Furthermore, the two powders M4W and M7L, are well-graded with CU of 16 and 14 and have Cc of 1.0 and 0.9, respectively. The P20µm values were found to be similar. The percentage of particles under the size range of 20 µm is 52% for muscovite M7L, 41% for muscovite M4W, and 52% for RL tailings. Of course, M7L is finer than M4W because RL is finer than RW.
The mass of dry muscovite, ∆Mmu, to be added to an initial mass of dry mine tailings (Mt-s) to achieve the target total muscovite content Xf in the tailings–muscovite mixture can be calculated using Equation (2).
M m u = X f X i 1 X f M t - s = X f X i C w - t 1 X f M t - w
In this equation, Xi refers to the initial muscovite percentage in the tailings (with < Xf), Cw-t denotes the initial solids content of the tailings, and Mt-w denotes the initial mass of the wet tailings.
Based on Equation (2), the ratio of muscovite incorporated into the tailings (α) to the mass of dry tailings (Mt-s) is defined by Equation (3) (a ratio can also be calculated based on the e mass of wet tailings Mt-w).
α = M m u M t - s = X f X i 1 X f
Figure 4 also illustrates the particle size distribution curves of the mixtures between the tailings RL and RW and muscovite powders M7L and M4W with α = 13%, respectively. The rationale behind selecting α = 13% is elucidated below. The curves were derived theoretically based on the grain size distribution curves of tailings and muscovite powders using Equation (4). It can be observed that the particle size distribution curves of the tailings–muscovite mixtures exhibit minimal variation when 13% muscovite is added to the dry tailings, in comparison to the curves of the tailings themselves. Consequently, the particle size of the tailings–muscovite mixtures for α = 13% may have an insignificant impact on the consistency and rheological properties of CPB.
P m i x - d = P   R - d 1 α + P M - d   × α
In this context, the symbols Pmix-d, PR-d, and PM-d represent the particle fractions of the muscovite-amended tailings mixture, the tailings, and the muscovite finer than diameter d, respectively.
The relative density of the solid grains (Gs) was determined by using an ULTRAPYC 1200e helium pycnometer (Anton Paar QuantaTec Inc, Boynton Beach, FL, USA). Furthermore, the specific surface area (Ss) was determined using a Gemini 2375 specific surface analyzer from Micromeritics (Micromeritics Instrument Corp, Norcross, GA, USA), in accordance with the Brunauer, Emmett, and Teller (BET) method [50]. The results indicate Gs values of 2.85, 2.85, 3.01, and 2.79 and Ss values of 22.64, 17.77, 2.80, and 1.99 m2/g for the M7L, M4W, RL, and RW materials, respectively. If we consider that the Gs of muscovite is reported to be between 2.76 and 3.00 [51], the value, GS, obtained for the muscovite powders M7L and M4W (2.85) falls within this range. The discrepancies in the specific surface areas of powders M7L and M4W can be attributed to the differences in their particle size distribution curves (M7L is finer than M4W).

2.2. Mineralogical Characterization of Tailings and Muscovite

Following homogenization, the four materials were subjected to mineralogical characterization using a Bruker D8 Advance X-ray diffractometer (Bruker AXS, Billerica, MA, USA). Data were determined using the quantitative Rietveld method (relative precision of 0.5%) with TOPAS software (software version 1.148.28, TOPAS, Hingham, MA, USA) [52]. The results obtained are presented in Table 2. Thus, the results confirmed the complete purity of the muscovite. The tailings RL and RW contain two phyllosilicates: muscovite at 15% and 14% and clinochlore at 6.2% and 5%, respectively. The RL tailings contain a markedly higher concentration of pyrite, at 12.6%, in comparison to the RW tailings, which contain only 2.6% pyrite. Quartz, a tectosilicate, is present in proportions of 51.5% and 45.8% in the RL and RW tailings, respectively. The presence of albite is limited to the RW tailings, with a concentration of 19%. Augite, a mineral that is found in ultramafic rocks, is present in proportions of 10.4% and 10% in the RL and RW tailings, respectively.
The objective of this study was to examine the impact of muscovite content on the consistency and rheological properties of CPB mixtures. To this end, muscovite was incorporated into the tailings (with an initial muscovite content Xi) in muscovite content increments of 2%, with a maximum variation in muscovite content of 10%. Accordingly, the objective was to attain six desired muscovite contents, Xf, of 14, 16, 18, 20, 22, and 24% for the RW tailings and 15, 17, 19, 21, 23, and 25% for the RL tailings, regarding each solids content of CPB. The maximum muscovite content (approximately 25%) is representative of tailings from certain mines in Abitibi and Northern Quebec, where muscovite content fluctuates between approximately 0% and 27% [29,31,32]. By varying the muscovite content from Xi = 15% to Xf = 25% for the RL tailings and from Xi = 14% to Xf = 24% for the RW tailings, the mass of dry muscovite corresponding to α = 13.3% and α = 13.1% must be added to the RL and RW dry tailings, respectively. This explains the value of 13% that was previously employed in Section 2.1.
Given the fine-grained nature of the tailings, it can be assumed that the muscovite present (before adding pure muscovite) is exclusively free muscovite. The incorporation of the free muscovite, M7L and M4W, respectively, into the RL and RW tailings alters the proportions of the other minerals present in the tailings. The revised proportions for each mineral were estimated using Equation (5).
P m i n e r a l - f = P m i n e r a l - i 1 X f 1 + X i  
In this equation, Pmineral-f (%) represents the final proportion of mineral i in the tailings–muscovite mixture. Pmineral-i (%) refers to the initial proportion of mineral i in the tailings. The variables Xi and Xf are defined in Equation (2). The calculation of the new proportions of minerals in the tailings–muscovite mixtures allows for an evaluation of the extent to which the addition of muscovite affects the reduction in the proportions of other minerals present in the tailings, and whether this impact can be considered negligible or substantial. Table 2 illustrates the mineralogical composition of the tailings to which the maximum amount of muscovite (α = 13%) was added. As illustrated in Equation (3), the greater the initial proportion of mineral i in the tailings (Pmineral-i), the more pronounced the impact of adding 13% muscovite on Pmineral-f (this is the case for quartz). Several minerals present in the residues showed slight decreases. The percentage of the other phyllosilicate (clinochlore) present in the RL and RW tailings decreased from 6.2% to 5.5% and from 5.0% to 4.4%. In the context of this study, it is assumed that variations in the mineralogical composition of the tailings, except for muscovite, do not influence the results of the consistency and rheology measurements planned in this study. Thus, the impact of muscovite addition will be the main variable, allowing us to justify the difference in results due to the variability of muscovite content (for a given solids content).

2.3. Mixture Preparation

The preparation of the CPB mixtures was initiated with the theoretical calculation of the masses of all the ingredients, with the objective of preparing the CPB recipes with targeted solids contents, Cw. As previously stated, the muscovite content in the CPB mixtures was altered by 2% increments from the initial value, reaching a maximum of 10%. Equation (2) was employed to ascertain the requisite mass of dry muscovite to be incorporated into the dry tailings. The CPB mixtures were prepared with a binder ratio, Bw, of 5% (based on the mass of tailings plus dry muscovite). The binary GU/slag binder was employed. The quantity of binder required for the mixture can be determined using Equation (6):
M b = M s - t + M m u B w = 1 + α B w M t - s = 1 + α B w C w - t M t - w
where Bw is the binder ratio and Cw-t is the initial solids content of the tailings.
Finally, the quantity of water to be added to the mixture (ΔMw) to achieve the desired CPB solids content, Cw, can be obtained using the following equation:
M w = C w - t C W + C w - t 1 C w α + 1 + α B w C w M t - w  
Once the masses of wet tailings, dry muscovite, water, and binder for a given CPB recipe were known, these ingredients were mixed using a paste mixer (OMCAN model) following the same procedure for all CPB mixtures. The binder, muscovite powder, and half of the calculated mixing water were added to the mixer and mixed for an average of 6 s to homogenize the latter and initiate hydration of the binder. Half of the tailings was then added for approximately 10 s. The mixture was then stirred at 91 rpm for 1 min. After a short pause of about 10 s during which the remainder of the tailings and water were added to the mixer, mixing continued for 3 min. Mixing was then continued at 116 rpm for 30 s and then at the maximum speed of 282 rpm for 2 min, which is the maximum speed possible for the OMCAN paste mixer. It should be noted that each time the speed was changed, mixing had to be paused before moving to a higher speed, which explains the short pauses between speed changes. Approximately 5 kg of CPB was prepared for each mixture. In accordance with the methodology described above, the same mixing energy, which is a function of mixing speed, mixing time, and mixing load [53,54], was used for each CPB recipe preparation to ensure the reproducibility of the tests. The CPB mixing energy is known to affect the consistency and rheological properties of CPB [53,54].
Table 3 shows the various mixtures subjected to the experimental tests. The variation of Cw for a given muscovite content, X, aims to study its effect on the rheological behaviour of CPB mixtures of different consistencies. For RW tailings, decreasing Cw values of 74%, 72%, and 70% were targeted, corresponding to water contents, w, of 36%, 39%, and 43%, respectively. For the RL tailings, Cw values of 73%, 71%, and 69% were targeted, corresponding to water contents, w, of 37%, 41% and 45%, respectively. For the tailings, RL, it was not possible to determine the rheological properties of CPB at a solids content of 74%, unlike at 73%. Therefore, the maximum solids content considered is 73%. The choice of targeting a range of solids contents was intended to cover a wide range of Abrams cone slump heights. It also allows us to see the effect of muscovite on the rheological properties of the CPB mixtures at different solids contents to see if the trends are repeated when Cw is varied. The difference in the Cw of CPB between the two types of tailings is primarily driven by the paste consistency, which is influenced by the physical properties unique to each tailings type.
For each CPB mixture, the water content, w, was determined by oven drying at 60 °C to verify the actual Cw value. Figure 5 compares the measured and target (theoretical) Cw values. For the RW tailings, the mean Cw values measured for the six muscovite contents are 70.2%, 72%, and 73.7%, respectively (see Figure 5b), with standard deviations of 0.04%, 0.04%, and 0.08%. For the RL tailings, the mean Cw values measured for the six muscovite contents are 69.1%, 70.8%, and 72.6%, respectively (see Figure 5b), with standard deviations of 0.5%, 0.4%, and 0.4%. The differences observed in Figure 5 between the measured and desired Cw values are negligible. They are not due to the presence of muscovite but to the uncertainty in the mixture proportioning and water content measurements. Indeed, the measured and target Cw values were compared for several pure muscovite suspensions with solids contents ranging from 12.5% to 72%. The difference between the measured and target values is very small. To facilitate the presentation of the results in the figures, the target Cw values are used in the legends.

2.4. Measurement of Cone Slumps

Cone slump measurements were performed using a standard Abrams cone (see Figure 6), which is a truncated cone that is 30 cm in height, 20 cm in diameter at the base, and 10 cm in diameter at the top. The slump test was performed in accordance with ASTM Procedure C-143 [55]. Because of the amount of CPB required to perform this test, only one test was performed for each CPB mixture.

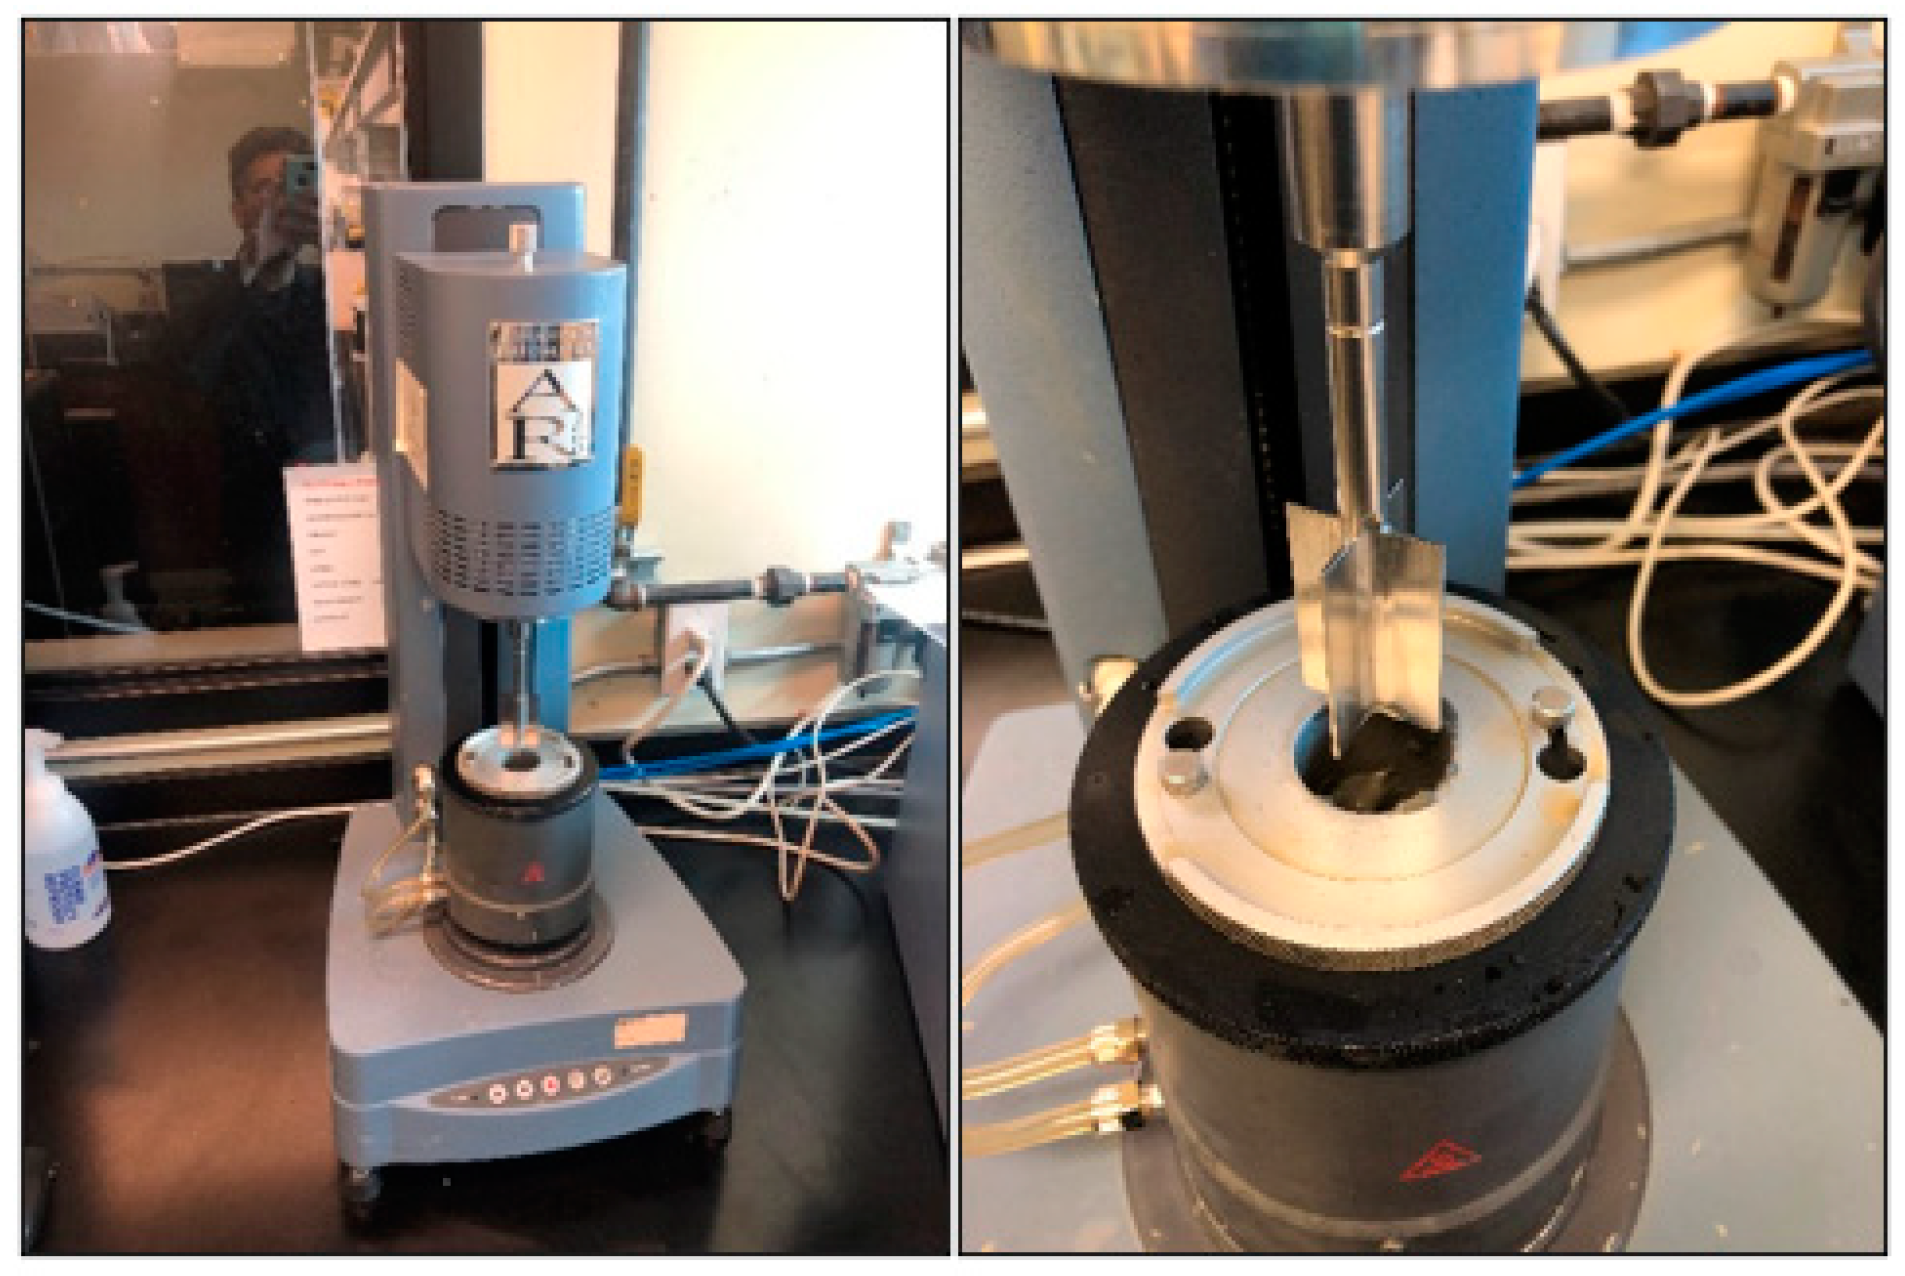
2.5. Rheological Measurements and Analysis

The rheological properties of the CPB were determined in triplicate using an AR2000 rheometer from TA Instrument (TA Instrument, New Castle, DE, USA). A vane geometry with a diameter of 14 mm and height of 20 mm, equipped with four orthogonal blades, was used for the tests. During the test, the geometry was lowered into a cylinder with a diameter of 15 mm and a height of 42 cm. The lateral gap was 1 mm and the bottom gap was 4 mm (see Figure 7). This geometry was chosen because it is well suited for analyzing the rheological properties of materials with high solids content, and its use with tailings and CPB has been reported by several authors [53,54,56,57,58,59,60,61,62,63].
Prior to each series of rheological tests, the inertia of the engine system was calibrated, both with and without the geometry, including mapping and zeroing the air gap and controlling the test temperature at 20 °C using a Peltier system. Before each rheological test, the density of each CPB mixture was determined. This density was used to calculate the weight corresponding to the volume of CPB required for a test, which was 28.72 mL. The rheometer displayed this weight when the CPB was placed in the static cylinder in terms of the vertical stress exerted by the backfill at the bottom of the cylinder. A continuous ramp flow mode procedure was followed, with an ascending step followed by a descending step. The ascending and descending steps were programmed by varying the shear rate γ̇ (s−1) from 0.1 s−1 to 100 s−1 and then from 100 s−1 to 0.1 s−1, respectively. The choice of the maximal shear rate of 100 s−1 was based on preliminary rheological tests on CPB with Cw of about 74%. At shear rates exceeding 100 s−1, the ascending and descending flow curves tend to overlap, reflecting significant destructuring of the material.
Each step of the flow procedure involved 20 shear stress measurement points τ (Pa) over a period of 150 s. The results of the rheological analyses are expressed in terms of flow curves or rheograms τ(γ̇) and apparent dynamic viscosity curves η(γ̇), where η = τ/γ̇. Different rheological models available in the Data Analysis software (version 1.0.12) provided with the rheometer were used to fit the experimental curves to determine rheological properties for practical use.
Given the shape of the obtained flow curves, the Herschel–Bulkley rheological model, defined by Equation (8), was the best model used to fit the experimental rheogram data [64]:
τ = τ 0 + k γ ˙ n
where τ is the shear stress (Pa), τ0 is the shear threshold or yield stress (Pa), k is the consistency index (Pa·sn) (k is related to the viscosity of the fluid), γ̇ is the shear rate (1/s), n is the flow index (-), (n < 1 for shear-thinning fluids, n = 1 for Bingham type fluids, and n > 1 for shear-thickening fluids).
For analyzing the viscosity curves, the Cross rheological model shown in Equation (9) [65] was used:
η = η + η 0 η 1 + k c γ ˙ n c
where η is the dynamic viscosity (Pa·s), η is the dynamic viscosity when the shear rate tends to infinity or is sufficiently high (Pa·s), η0 is the initial dynamic viscosity (Pa·s), kc is a constant, and nc is a flow index specific to the Cross model.
The quality of the fit between the measured and calculated curves was assessed by the standard error SE (see Equation (10)) provided by the Data Analysis software using the least squares method. The standard error represents the degree of fit of the mathematical model to the experimental data. The further the measured data deviate from the rheological model, the greater the error is. It is therefore necessary to fit the flow curves to different rheological models to determine the one that best fits and therefore has the lowest SE value.
S E = x m x c 2 N 2 0.5 R a n g e × 1000
In this equation, xm is the experimental value, xc is the value calculated by the rheological model, N is the total number of measured data, and Range is the difference between the maximum and minimum measured values. The standard error is considered acceptable if it is less than 20‰ according to the TA instrument manual.
As the rheological tests were carried out in triplicate, the results presented below correspond to the average of the tests. Error bars were plotted around these averages, representing the standard deviation of each variable studied (yield stress, flow index, and infinite viscosity). The shorter the error bars, the less scattered the values are and the closer they tend to the mean, and vice versa.
The analysis of the flow curves showed that the yield stress given by the Herschel–Bulkley model could be underestimated due to data at low shear rates, affecting the values of the other model parameters. Even for Bingham fluids, the Herschel–Bulkley model can underestimate the yield stress [66]. A polynomial mathematical model was then used to obtain the yield stress values that mirror the Bingham model. The SE values of the polynomial model were 7.9‰ and 9.4‰ with standard deviations of 2.2‰ and 2.7‰ for the RW and RL tailings-based CPB mixtures, respectively. Figure 8a,b compare the yield stress obtained from the Herschel–Bulkley model and the polynomial model for the CPB mixtures based on RW and RL tailings, respectively. There was a greater underestimation of the yield stress values for RL tailings-based CPB mixtures compared to those based on RW tailings. The difference between the yield stress of the two models before the correction was on average 21.5 Pa and 28.9 Pa, with a standard deviation of 35.2 Pa and 15.1 Pa for the RW and RL tailings-based CPB mixtures, respectively.
An adjustment of the rheograms was performed by imposing the values of the yield stress obtained by the polynomial model for the shear rate γ̇ = 0. Even with this correction of the rheograms, the Herschel–Bulkley model gives slightly lower shear yield stresses than the values imposed at γ̇ = 0, but the difference between the yield stresses of the Herschel–Bulkley model and the polynomial model is reduced. On average, this difference is 4.41 Pa and 6.35 Pa with a standard deviation of 2.72 Pa and 5.45 Pa for the RW and RL tailings-based CPB mixtures, respectively.

3. Experimental Results

The CPB formulations studied were designed to understand the effects of muscovite content on the consistency and rheological properties of CPB mixtures at varying solids contents.

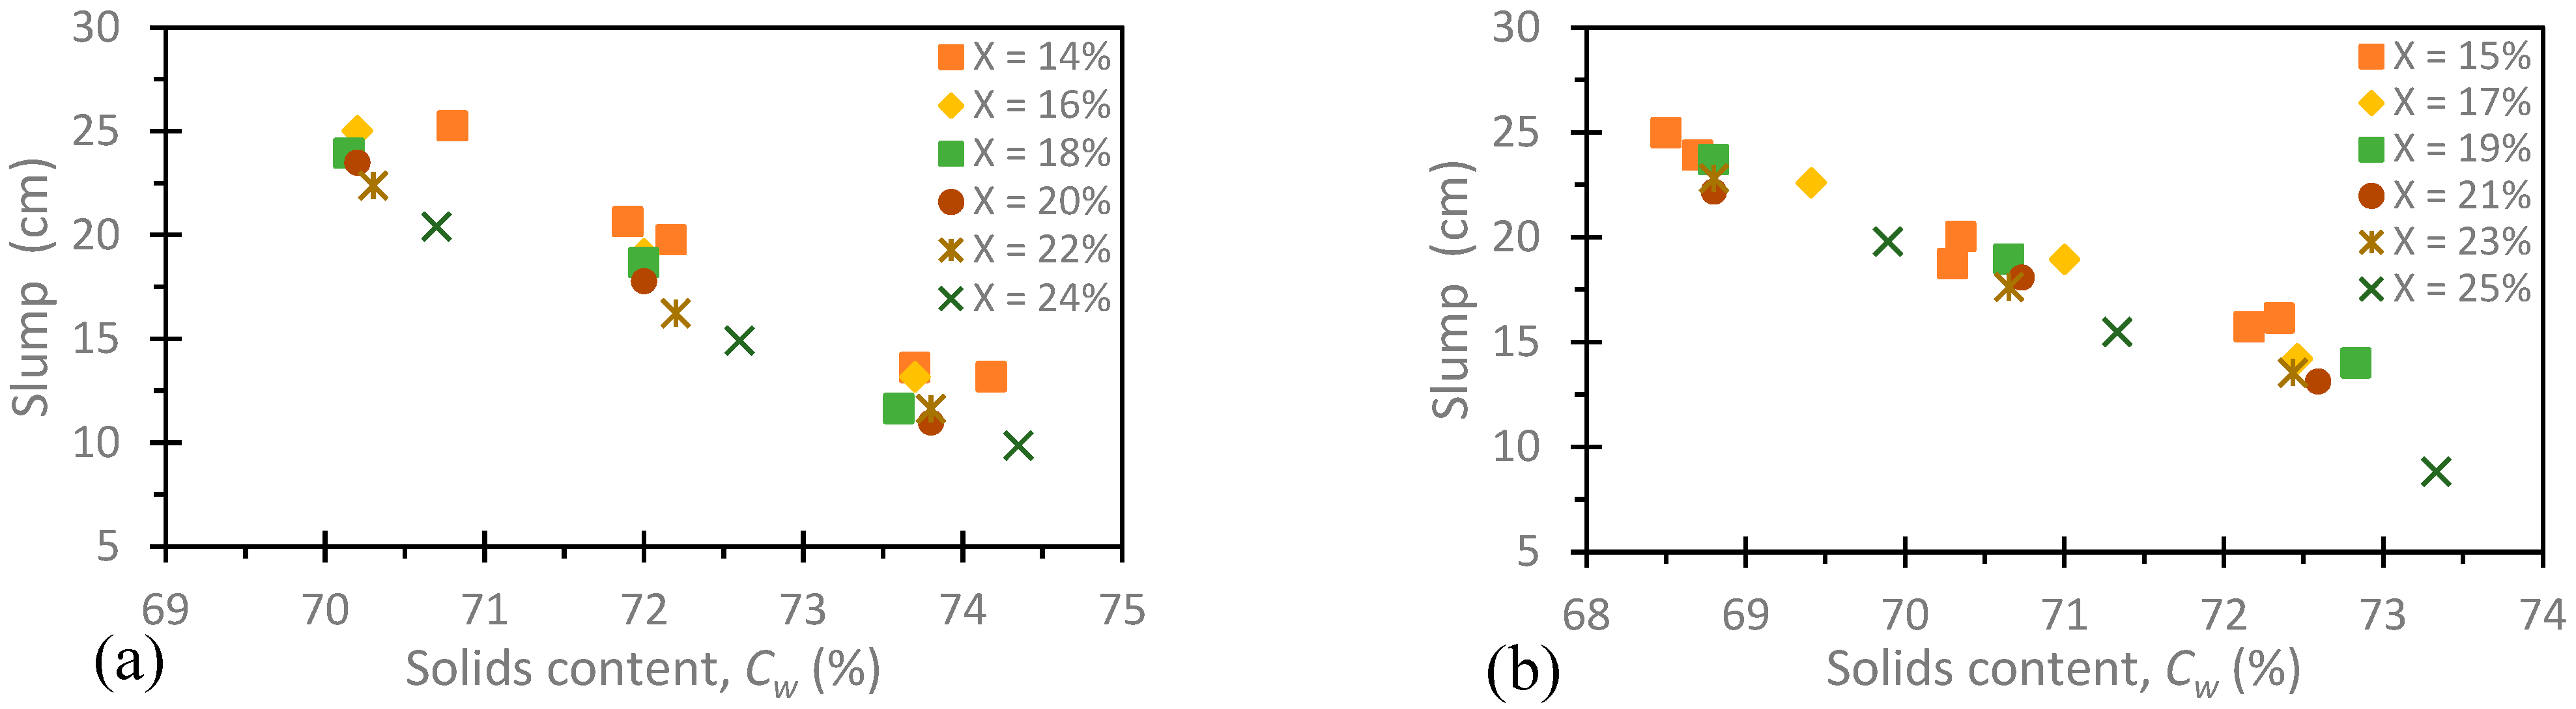
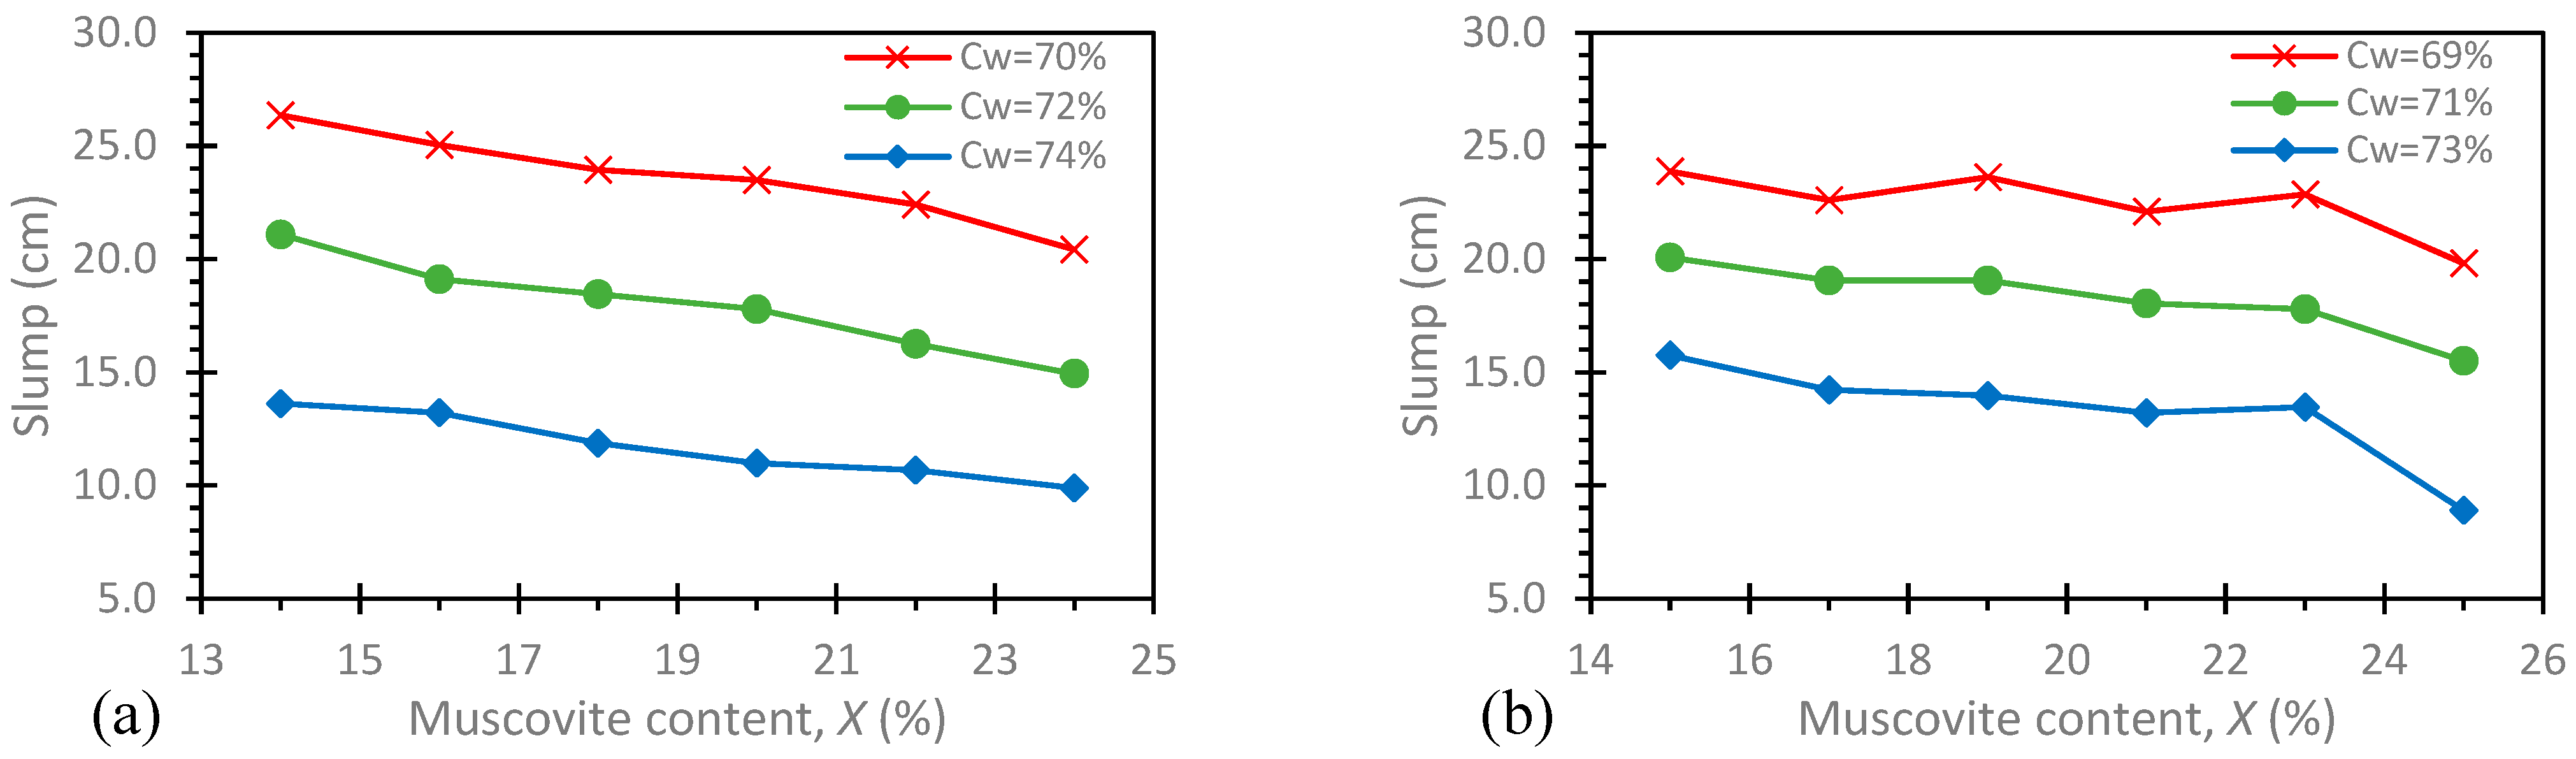
3.1. Effect of Solid and Muscovite Contents on the Abrams Cone Slump of CPB Mixtures

Figure 9 shows the Abrams cone slump as a function of solids content, Cw, for the studied CPB formulations with different muscovite contents, X. Figure 9a shows the slump of CPB based on RW tailings for recipes with solids contents between 68% and 76%. Figure 9b shows the consistency of CPB based on RL tailings for mixtures with solids contents between 68% and 74%. These results show that there is a negative linear relationship between slump and solids content for both types of RW and RL tailings-based CPB mixtures: increasing Cw decreases the slump value, which increases the consistency of the CPB. In Figure 9a, mixtures containing 14% muscovite have slumps of 28.2 cm and 9.2 cm for Cw of 68% and 75.5%, respectively. Similarly, for a 24% muscovite content in the CPB, the slumps are 20.4 cm and 9.9 cm for Cw values of 70.7% and 74.4%, respectively. In the case of Figure 9b, the CPB mixtures containing 15% muscovite showed slumps of 25 cm and 11 cm for Cw values of 68.5% and 74.3%, respectively. For mixtures containing 25% muscovite, the slumps are 19.8 cm and 8.8 cm for Cw values of 70% and 73.3%, respectively.
Figure 10 shows the Abrams cone slump as a function of muscovite content in the CPB mixtures. The effect of muscovite was studied in the case of CPB mixtures based on RW tailings for three different solids contents: 70%, 72%, and 74%. As shown in Figure 10a, a decrease in slump was observed with increasing free muscovite content in the mixtures for a given Cw. For example, for a Cw of 70%, the slumps at the minimum (14%) and maximum (24%) muscovite contents were 26.4 cm and 20.4 cm, respectively. Furthermore, for a Cw of 74%, the slumps are 13.6 cm and 9.9 cm for muscovite contents of 14% and 24%, respectively.
The influence of muscovite on CPB mixtures based on RL tailings was investigated for solids contents of around 69%, 71%, and 73%. The results presented in Figure 10b show the same trend as Figure 10a, with a reduction in values as a function of free muscovite in the CPB. For a solids content of around 69%, the slump is 23.9 cm and 19.8 cm for muscovite contents, X, of 15% and 25%, respectively. For Cw around 73%, slumps are 15.7 cm and 8.9 cm for muscovite contents, X, of 15% and 25%, respectively.
The mining industry practice for CPB transportation is to use a cone slump that is fixed at the design stage but can be adjusted during the backfilling operation according to variations in mineralogy, including muscovite. As the slump decreases with increasing free muscovite content in the CPB, adding water to the mixture is the solution for achieving the initial fixed slump. The impact of adding water is discussed below (Section 4.1).

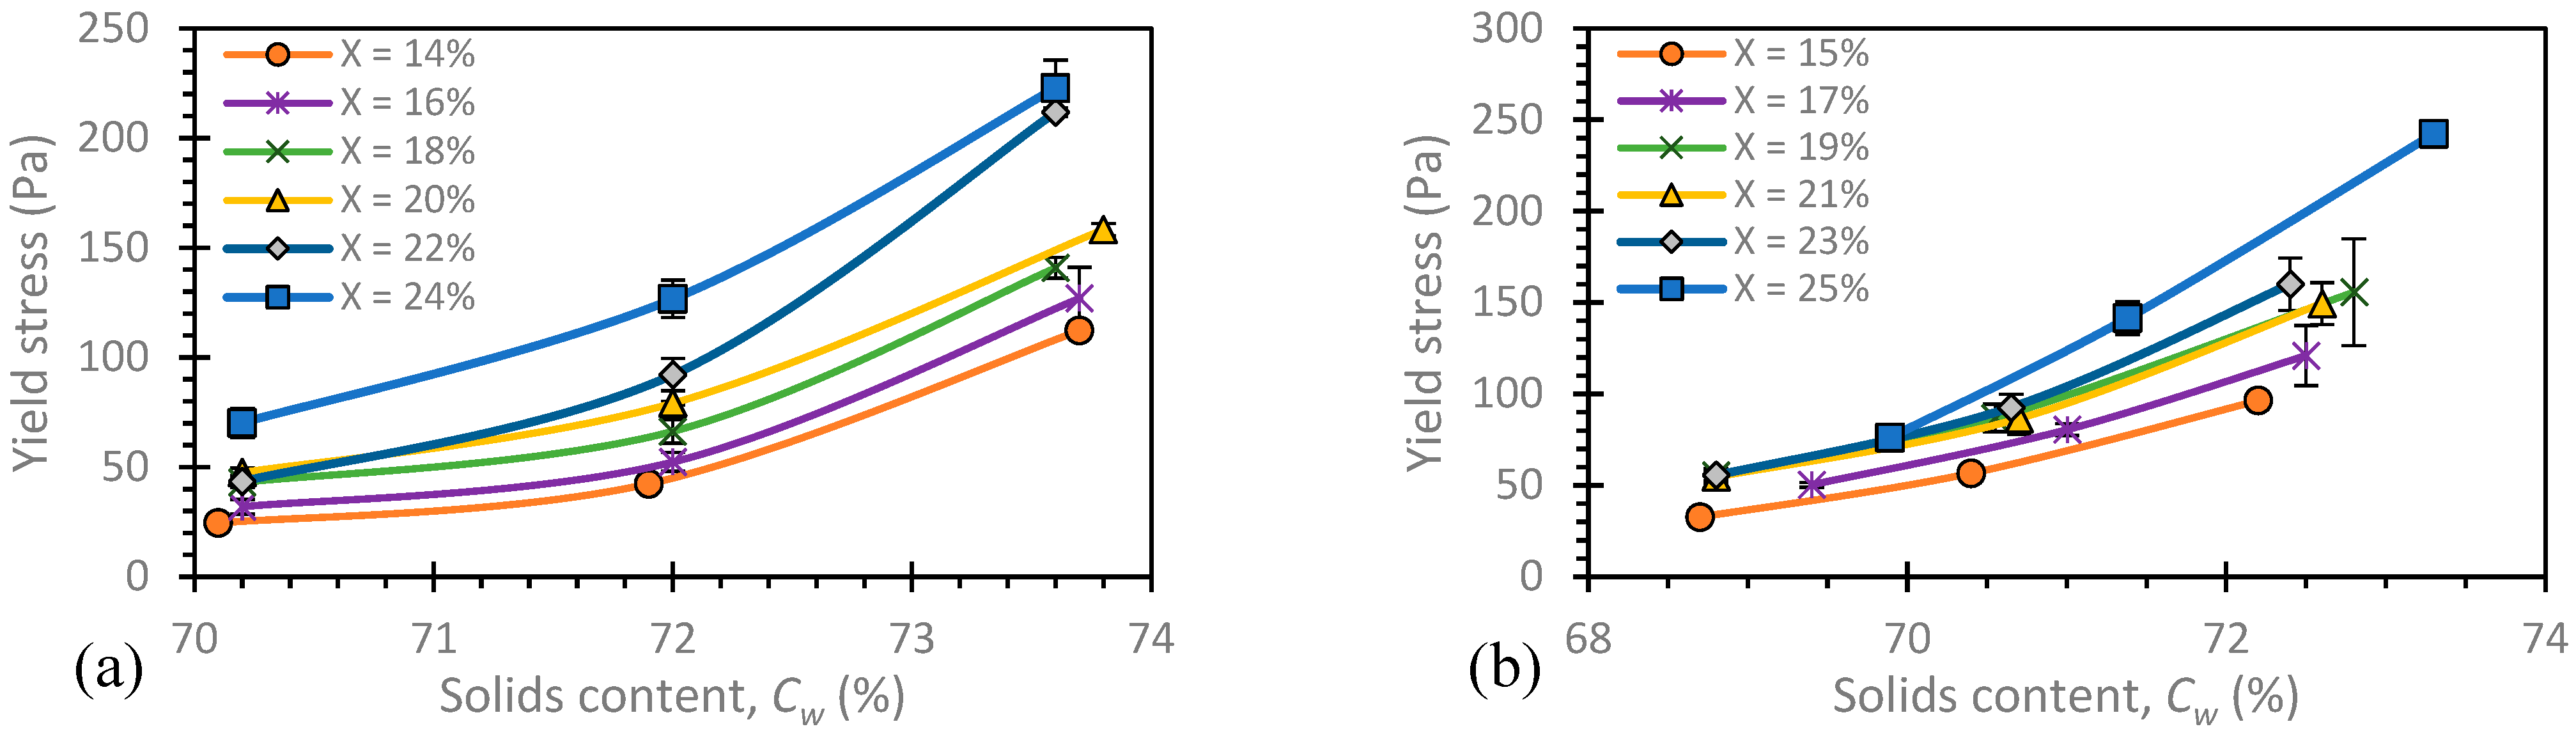
3.2. Effect of Solids Content and Muscovite Content on Flow Curves

Figure 11a,b show typical flow curves or rheograms resulting from rheological tests carried out using the continuous descending ramp flow method on different CPB recipes prepared at Cw = 70% and 71% with RW and RL tailings, respectively. For both types of tailings, these rheograms show an increase in shear stress for a given shear rate as the muscovite content, X, in these mixtures, increases. For example, at an arbitrary shear rate of about 40 s−1, the shear stress increased from 66 Pa to 133 Pa as X increased from 14 to 24% for CPB prepared at Cw = 70% with RW tailings (Figure 11a) and from 130 Pa to 234 Pa as X increased from 15 to 25% for CPB prepared at Cw = 71% with RL tailings (Figure 11b). This trend was also observed for the other solids contents.
After adjusting these rheograms with the polynomial model according to the procedure described in Section 2.5, the adjusted rheograms were fitted with the Herschel–Bulkley model (Equation (8)) to determine the three model parameters: yield stress τ0, consistency index k, and flow index n. For all the rheological analyses conducted, the average SE values for the Herschel–Bulkley model are 15.1‰ and 22.8‰, with standard deviations of 3.7‰ and 6.0‰, respectively, for RW and RL tailings-based CPB blends. It should be noted that the RW tailings-based mixtures with 73.3% solids content and 25% muscovite gave the highest SE values compared to the other mixtures.
Considering the random tendencies of the k values, many authors [67,68] “trivialize” this parameter when analyzing rheological data, although it is essential for calculating fluid flows with Herschel–Bulkley behaviour [69]. The consistency index k is often negatively and linearly correlated with the flow index n [66]. In this paper, only the influence of the muscovite content, X, on τ0 and n are discussed. The yield stress obtained for CPB mixtures with different muscovite contents, X, is shown in Figure 12 as a function of solids content, Cw. For both types of tailings used in CPB preparation, a similar trend was observed: for a given muscovite content X, the yield stress τ0 increased with solids content, as expected. According to Figure 12a, the value of τ0 in mixtures containing 14% muscovite increased from 25 Pa for Cw = 70% to 112 Pa for Cw = 74%. For mixtures containing 24% muscovite, τ0 increased from 70 Pa and 223 Pa when Cw values increased from 70% to 74%. Figure 12b shows that for mixtures with 15% muscovite, the yield stress is 33 Pa and 97 Pa for Cw values of 69% and 72%, respectively, and 76 Pa and 242 Pa for Cw values of 70% and 73.3%, respectively.
To better understand the influence of muscovite content, X, on the yield stress, Figure 13 illustrates the variation in yield stress τ0 as a function of muscovite content, X, for each solids content. τ0 increases X. In fact, when X varies from 14% to 24%, the results in Figure 13a, corresponding to tests carried out on CPB mixtures based on RW tailings, show that τ0 increases from 25 Pa to 70 Pa and from 112 Pa and 223 Pa for CPB with Cw values of 70% and 74%, respectively. In the case of CPB based on RL tailings, when X varies from 15% to 25%, Figure 13b shows an increase in τ0 from 33 Pa to 76 Pa for Cw of 70% and from 96 Pa to 242 Pa for Cw of 74%.
The flow index “n” of the Herschel–Bulkley model (Equation (8)) is a dimensionless rheological parameter indicating the type of fluid. The effect of muscovite content, X, on this parameter is shown in Figure 14. Most of the studied CPB mixtures remained as pseudoplastic or shear-thinning fluids (n < 1). In general, a slight increase in the flow index is observed with increasing muscovite content, and this increase also depended on the solids content of the CPB mixture. Figure 14a for RW tailings-based CPB mixtures shows that n varies from 0.53 to 0.65 as the muscovite content, X, increases from 14% to 24% for Cw of 70%. For Cw = 74%, n increases from 0.77 to 1.06 as X varies from 14% to 24%. On the other hand, when the muscovite content varies from 15% to 25% in RL tailings-based CPB mixtures (see Figure 14b), the flow index increases from 0.48 to 0.61 and from 0.65 to 0.80 for Cw of 71% and 73%, respectively.
Figure 14 shows that the flow index increases with the solids content Cw. For example, for CPB mixtures based on RW tailings containing 14% muscovite, the value of n varies from 0.53 to 0.77 as Cw increases from 70% to 74%. It should be noted, however, that the measurement error in n values is greater for solids contents of approximately 74%.
It should be remembered that increasing the values of yield stress, consistency index K, and flow index n leads to increased pressure drop along the CPB line and increased pumping energy demand (if pumping is used). As previously mentioned in the introduction, the pressure loss can be estimated from the rheological properties using analytical equations [69,70] or measured using flow loop tests [17,18,19,20,21,22].

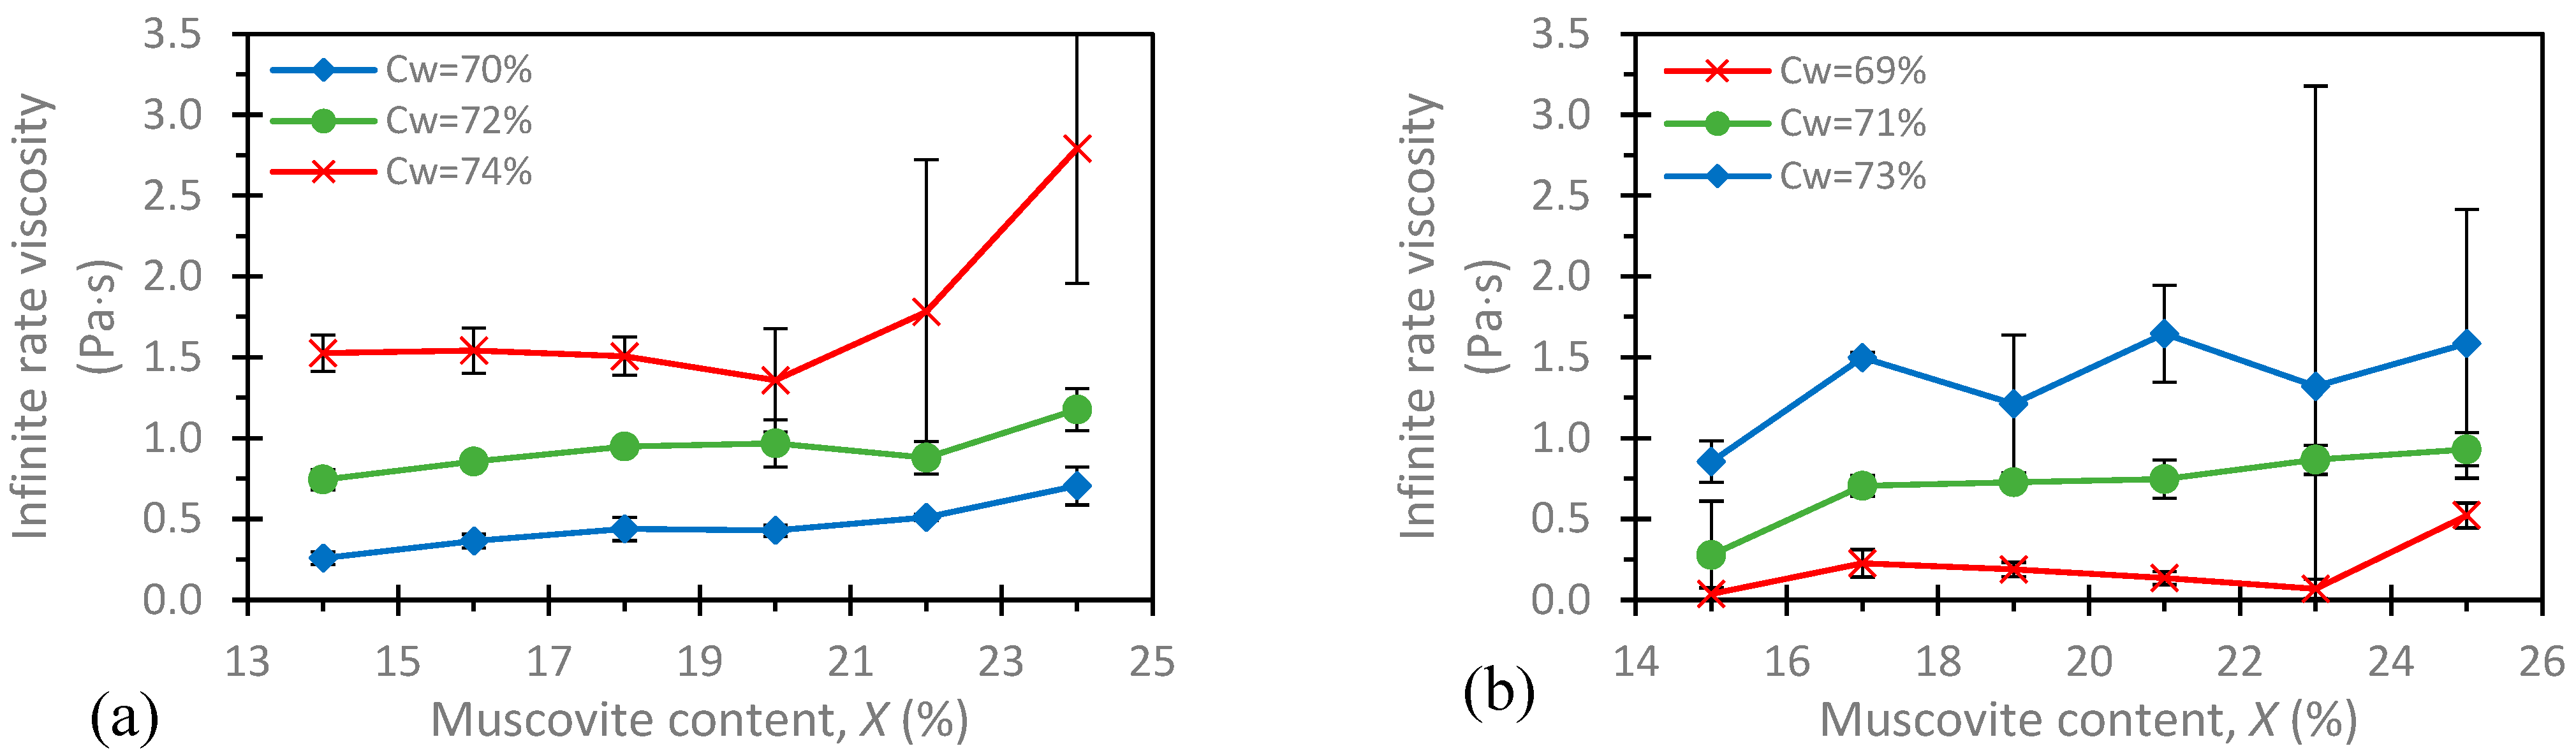
3.3. Effect of Solid and Muscovite Contents on Dynamic Viscosity Curves

Figure 15a,b show typical dynamic viscosity curves (η) obtained from rheological tests following the continuous downward ramp flow method for CPB mixtures prepared at Cw = 72% and 71% with RW and RL tailings, respectively, as the muscovite content in these mixtures increases. For these solids contents, the viscosity values decreased with increasing shear rate. At the maximum shear rate for which data were recorded (95 s−1), the viscosity curves have not yet reached the horizontal asymptote corresponding to the η viscosity defined in Equation (9). Furthermore, as shown on the rheograms, the dynamic viscosity at a given shear rate increases with muscovite content in these mixtures. For example, at a shear rate around 40 s−1, the dynamic viscosity increases from 1.6 Pa·s to 3.2 Pa·s as the muscovite content increases from 14 to 24% for CPB mixtures prepared at 70% solid with RW tailings (Figure 15a) and from 3.2 Pa·s to 6.7 Pa·s as the muscovite content increases from 15 to 25% for CPB mixtures prepared at 71% solid with RL tailings (Figure 15b).
All viscosity curves were fitted using the Cross model (Equation (9)) to obtain the model parameters. However, only the infinite shear rate dynamic viscosity η is presented in this study. The latter viscosity is used to calculate CPB transport in pipelines because of the high shear rates achieved in pipelines [71,72]. The average standard error SE values are 8.0‰ and 10.0‰ with standard deviations of 2.3‰ and 2.2‰ for CPB based on RW and RL tailings, respectively.
Figure 16 shows the variation in the Cross dynamic infinite viscosity η as a function of the muscovite content, X, for CPB mixtures based on the two types of tailings. A general trend of increasing η values with higher muscovite content is observed for the solids contents of the CPB mixtures studied. For example, in Figure 16a, the infinite viscosity η is 0.26 Pa·s and 0.71 Pa·s for muscovite contents of 14% and 24%, respectively, in CPB mixtures based on RW tailings with Cw = 70%. CPB mixtures with Cw = 74% show viscosities η of 1.53 Pa·s and 2.79 Pa·s for muscovite contents of 14% and 24%, respectively. For CPB mixtures based on RL tailings, Figure 16b shows that the dynamic viscosity at infinite shear rate η is 0.28 Pa·s and 0.93 Pa·s for mixtures with muscovite contents of 15% and 25%, respectively, for a Cw of 71%. Moreover, for Cw = 74%, this viscosity η increases from 0.85 Pa·s to 1.59 Pa·s as the muscovite content varies from 15% to 25%.
Figure 16 also shows that the dynamic viscosity η increases with solids content. For example, η increases from 0.26 Pa·s to 1.53 Pa·s as the solids content varies from 70% to 74% in the case of the CPB mixture based on RW tailings containing 14% muscovite. However, some of the values for 74% mixtures are subject to large errors owing to the large scatter of infinite rate viscosity values. This is true for muscovite contents above 22% for both tailings. At high solid and muscovite contents, irregularities are observed in the rheograms of 74% mixtures, which explains the large error bars in some results.

4. Discussion of the Results

The factors influencing the observed consistency and rheological behaviour of the studied CPB mixtures in response to muscovite variation are briefly outlined in the introduction. Emphasis is placed on the physicochemical properties of muscovite, notably its planar shape, which results in a distinct anisotropic surface charge, and its water sorptivity. These mechanisms are currently being investigated in a complementary PhD study.
This section discusses the effect of muscovite content on the solids content required for a given Abrams cone slump and proposes a method of adjusting the binder ratio to maintain a given water/binder ratio after adding water to the mixture to achieve a target slump. The effect of the type of tailings is also discussed.

4.1. Impact of Muscovite Content on the Solids Content Required to Maintain a Given Slump of CPB Mixtures

With increasing free muscovite content in tailings and therefore in CPB, maintaining a target slump to ensure trouble-free backfill transport may be impossible without adding water or reducing the solids content. Figure 17 shows the solids content required to achieve a given slump as a function of muscovite content in CPB mixtures. For a given slump, increasing the muscovite content in CPB mixtures resulted in a decrease in the solids contents. This trend is more evident for CPB mixtures made with RW than with RL tailings. To maintain a 7.5″ or 19.1 cm slump, for example, the solids content of RW tailings-based CPB mixtures must decrease from 72.3% to 71.2% as the muscovite content increases from 14% to 24% (Figure 17a). In the case of RL tailings-based CPB mixtures (Figure 17b), a fixed solids content can be maintained almost constant for a muscovite content of up to 19%. For example, to maintain a slump of 7.5″ or 19.1cm, the solids content decreases from 70.8% to 70.2% as the muscovite content increases from 15% to 25%.
To decrease the solids content, Cwi, of a wet mass, Mt-w, of CPB prepared with tailings containing a muscovite content, Xi, to a solids content, Cw2, after increasing the muscovite content from Xi to Xf, the amount of water to add, ΔMw1-2, can be calculated using Equation (11):
M w 1 - 2 = C w 1 C w 2 M t - w + 1 C w 2 M m u C w 2
where ΔMmu is the mass of muscovite to be added for increasing muscovite content from Xi to Xf, (see Equation (2)). As a theoretical example, consider one ton of wet CPB (Mt-w = 1000 kg) with Bw = 5% GU/slag based on RW tailings with a free muscovite content of 14%, giving an Abrams cone slump of 19.1 cm and Cw1 of 72.3%. The initial water/binder ratio (W/B)1 is approximately 8.0. The same mixture, but this time containing 24% muscovite (an increase of 79.5 kg muscovite per ton of wet CPB according to Equation (2)), will prompt the addition of 47.6 kg of water (see Equation (11)) to fluidize the paste and maintain it at a slump of 19.1 cm (Cw2 = 71.2%).
The addition of water to a given mixture to reduce Cw increases the water/binder (W/B) ratio. For the previous example, the water/binder ratio will increase from 8.0 to 9.4. The presence of more water than in the design mixture reduced the mechanical strength of the CPB. It is assumed that adding a binder to achieve the water/binder ratio of the original mix design would provide a solution to this decrease in mechanical strength. The amount of binder to be added ΔMB can be calculated from the amount of water added ΔMw1-2 (see Equation (12)).
M B = M w 1 - 2 W / B
By adding ΔMB = 5.9 kg of binder (obtained from Equation (12)), the water/cement ratio returned to 8.0 and the solid and binder contents increased to 71.7% and 5.3%, respectively.
In this example, the addition of the binder, ΔMB, did not result in a significant increase in the solids content and binder ratio, which is less likely to affect the consistency (slump) and rheological properties of the CPB mixtures. Alternatively, the effect of binder addition on these properties should be considered. It would probably be conservative to formulate the initial CPB recipe with tailings containing the highest expected muscovite content in the hope that this would not incur significant additional costs when the muscovite content decreases.

4.2. Effect of Tailings Type

The CPB mixtures investigated in this study were prepared using two types of tailings: RW and RL. Despite their similar muscovite contents of 14% and 15% for RW and RL tailings, respectively, it was found that CPB mixtures based on RW tailings yielded significantly greater slumps than those based on RL tailings for the same solids content. For example, at a fixed solids content of 72.2%, the slumps for CPB mixtures based on RW and RL tailings are 19.8 cm and 15.7 cm, respectively, at the initial muscovite contents (see Figure 8). The same applies to the rheological properties. At a solids content of about 72%, the yield stress is 52 Pa and 97 Pa for RW and RL tailings-based CPB mixtures, respectively (see Figure 11). This difference is mainly due to differences in the physical and mineralogical properties of the two tailings. Firstly, RW tailings are coarser than RL tailings (see Figure 3) and have a correspondingly lower specific surface area. It has been shown that the finer the grain size tailings, the lower the slump and the more water the CPB mix will require to achieve a given slump [26]. In addition, the relative density of the solid grains in RL tailings (Gs = 3.01) is higher than in RW tailings (Gs = 2.79) due to the presence of more pyrite in RL tailings (12.6%) than in RW tailings (2.6%) (see Table 2). As Cw, Bw, and muscovite contents are calculated in relation to the dry mass of the tailings, the difference in Gs gives rise to differences in the volume of the tailings, cement, and muscovite employed in the mixture. The total phyllosilicate contents of the RW and RL tailings, 19% and 21% respectively, are not sufficiently high to justify the difference in the behaviour of the two tailings. Finally, apart from phyllosilicates, differences in quartz and albite contents could also influence the behaviour of CPB mixtures prepared with these two tailings. The conclusion to be drawn from this is that a specific approach is required for each type of tailings.

5. Conclusions

The aim of this study was to investigate the combined effect of the variability of the muscovite content in two types of tailings (RW and RL) used to prepare CPB and the solids content on the slump and rheological properties of these CPB mixtures. The muscovite content, X, varied from 14% to 24% and from 15% to 25% for RW and RL tailings, respectively. The solids contents, Cw, of CPB mixtures, ranging between 69% and 74%, were targeted for a given muscovite content. The results presented above led to the following conclusions:
For a given muscovite content, X, increasing the solids content, Cw, in CPB mixtures reduces the Abrams cone slump and increases the yield stress τ0, the flow index n, and dynamic viscosity at infinite (high) shear rates η.
For a given solids content, Cw, increasing muscovite content in CPB mixtures is associated with a reduction in Abrams cone slump and increases in τ0, n, and η.
The addition of water to the CPB mix would be necessary to maintain the desired flowability or slump with an increase in muscovite content, which would reduce the solids content and consequently the water/binder ratio for a constant binder content and could lead to a reduction in mechanical strength.
The results presented here provide a tool for estimating the quantities of binder to be added to the CPB mix to ensure fluidity and maintain the target water/binder ratio determined when formulating CPB mixtures.
In practice, it is desirable to carry out this formulation with tailings containing the maximum expected muscovite content. Reducing the muscovite content will have a positive effect but could increase backfilling costs.
The equations developed and presented in this study could help underground mine backfill operators account for the variability of muscovite in tailings in CPB formulations.
Finally, it should be noted that this study did not investigate the influence of muscovite content on the mechanical strength of CPB, which constitutes a limit of this research. However, as mentioned at the end of the introduction, this specific aspect is being addressed in a separate study carried out by another researcher in our team.

Author Contributions

Conceptualization, M.M., T.B., A.M. and H.G.M.; methodology, H.G.M., M.M. and T.B.; formal analysis, H.G.M.; investigation, H.G.M.; resources, T.B. and M.M.; data curation, H.G.M. and M.M.; writing—original draft preparation, H.G.M.; writing—review and editing, M.M., T.B. and A.M.; visualization, H.G.M. and M.M.; supervision, M.M., T.B. and A.M.; project administration, T.B. and M.M.; funding acquisition T.B. and M.M. All authors have read and agreed to the published version of the manuscript.

Funding

This research was funded by FRQNT (Fonds de Recherche du Québec, Nature et Technologies), Programme de recherche en partenariat sur le développement durable du secteur minier—Volet valorisation des résidus miniers (grant number: 2022-0MN-301195); the Natural Sciences and Engineering Research Council of Canada (NSERC) (Discovery Grants Program, RGPIN-2020-06357, to Mbonimpa); the industrial partners Agnico Eagle Mines Ltd. and the Iamgold Corporation, Westwood Mine; and the Research Institute of Mines and Environment (RIME UQAT-Polytechnique).

Data Availability Statement

The datasets presented in this article are not readily available because the system is currently under development at UQAT.

Acknowledgments

The authors would like to express their gratitude to the URSTM (Unité de Recherche et de Service en Technologie Minérale) staff members for their support and for providing a multitude of training courses in the laboratory. Furthermore, the authors would also like to thank the industrial partners, Agnico Eagle Mines Ltd. and the Iamgold Corporation, Westwood Mine, for providing and ensuring the delivery of mine tailings, which was essential for the completion of this research.

Conflicts of Interest

The authors declare no conflicts of interest. The funders had no role in the design or execution of this study; in the collection, analyses, or interpretation of data; in the writing of the manuscript; or in the decision to publish the results. In addition, a small part of the results of the same research project will be published as a conference paper (77th Canadian Geotechnical Conference and the 16th Joint CGS/IAH-CNC Groundwater Conference, GeoMontreal 2024).

References

  1. Institut de la Statistique du Québec (ISQ) 2021. La Production Minérale au Québec en. 2019. Available online: https://statistique.quebec.ca/fr/fichier/mines-en-chiffres-production-minerale-quebec-2019.pdf (accessed on 13 January 2025).
  2. Bussiere, B. Hydrogeotechnical properties of hard rock tailings from metal mines and emerging geoenvironmental disposal approaches. Can. Geotech. J. 2007, 44, 1019–1052. [Google Scholar] [CrossRef]
  3. Robinsky, E.; Barbour, S.L.; Wilson, G.W.; Bordin, D.; Fredlund, D.G. Thickened sloped tailings disposal: An evaluation of seepage and abatement of acid drainage. In Proceedings of the 2nd International Conference on the Abatement of Acidic drainage, Montreal, QC, Canada, 16–18 September 1991. [Google Scholar]
  4. Newman, P.; White, R.; Cadden, A. Paste, the future of tailings disposal. In Proceedings of the 2nd International Conference on Mining and the Environment, Mataram, Indonesia, 18–19 August 2021; Volume 594. [Google Scholar]
  5. Melis, L.A. Development of the Disposal Technology Research Component of the National Uranium Tailings Program. In Report 0SQC2-00252, Prepared for The Canada Centre for Mineral and Energy Technology, Energy, Mines and Resources; CANMET: Ottawa, ON, Canada, 1985; p. 111. [Google Scholar]
  6. Paynter, J.T.; Dodd, J.C. The design, commissioning and operation of the Golden Giant paste backfill plant. In Proceedings of the 29th Annual Meeting of the Canadian Mineral Processors (Division of the CIM), Ottawa, ON, Canada, 21–23 January 1997; pp. 21–25. [Google Scholar]
  7. Mitchell, R.J. Model studies on the stability of confined fills. Can. Geotech. J. 1989, 26, 210–216. [Google Scholar] [CrossRef]
  8. Balasubramaniam, A.S. (Ed.) Stability of cemented tailings mine backfill. In Computer and Physical Modelling in Geotechnical Engineering, Proceedings of International Symposium on Computer and Physical Modelling in Geotechnical Engineering, Bangkok, Thailand, 3-6 December 1986; CRC Press: Boca Raton, FL, USA, 1989; Volume 1, pp. 501–508. [Google Scholar]
  9. Hassani, F.; Archibald, J. Mine backfill, CD-ROM. Can. Inst. Mine Metall. Pet. 1998, 47–66. [Google Scholar]
  10. Belem, T.; Benzaazoua, M.; Bussiere, B. Mechanical behaviour of cemented paste backfill. In Proceeding of the 55th Canadian Geotechnical Conference, Montreal, QC, Canada, 20–23 October 2000; pp. 575–580. [Google Scholar]
  11. Benzaazoua, M.; Belem, T.; Bussiere, B. Chemical factors that influence on the performance of mine sulphidic paste backfill. Cem. Concr. Res. 2002, 52, 1133–1144. [Google Scholar] [CrossRef]
  12. Belem, T.; Benzaazoua, M. Design and application of underground mine paste backfill technology. Geotech. Geol. Eng. 2008, 26, 147–174. [Google Scholar] [CrossRef]
  13. Belem, T.; Benzaazoua, M.; Bussière, B. Utilisation du Remblai en Pâte Comme Support de Terrain. Partie I: De sa fabrication à sa Mise en place Sous Terre. In Symposium International Après-Mines, GISOS; GISOS, Ed.; GISOS: Nancy, France, 2003. [Google Scholar]
  14. Wang, C.L.; Ren, Z.Z.; Huo, Z.K.; Zheng, Y.C.; Tian, X.P.; Zhang, K.F.; Zhao, G.F. Properties and hydration characteristics of mine cemented paste backfill material containing secondary smelting water-granulated nickel slag. Alex. Eng. J. 2021, 60, 4961–4971. [Google Scholar] [CrossRef]
  15. Thomas, E.G. Fill Technology in Underground Metalliferous Mines; Australian Mineral Foundation: Glenside, Australia, 1979. [Google Scholar]
  16. De Souza, E.; Archibald, J.F.; Dirige, A.P.E. Economics and Perspectives of Underground Backfill Practices in Canadian Mining. In 106th Annual General Meeting of the Canadian Institute of Mining; Metallurgy and Petroleum: Montreal, QC, Canada, 2003. [Google Scholar]
  17. Clark, C.C.; Vickery, J.D.; Backer, R.R. Transport of total tailings paste backfill: Results of full-scale pipe test loop. Rep. Investig. 1996, 9573, 67. [Google Scholar]
  18. Kalonji, K.; Mbonimpa, M.; Belem, T.; Ouellet, S.; Gelinas, L.P. Backfilling in the Permafrost: Predicting Pressure Loss and Temperature Distribution Along the Paste Backfill Pipeline System. In Paste 2026, Proceeding of the 25th International Conference on Paste, Thickened and Filtered Tailings Paste 2023, 29 April–6 May 2023; Fairmont Banff Springs Hotel: Banff, AB, Canada, 2023. [Google Scholar]
  19. Kalonji, K.; Mbonimpa, M.; Belem, T.; Ouellet, S.; Gélinas, L.P. Numerical Procedure for Scaling up Pressure Loss from Mini Flow Loop Tests. In Paste 2026, Proceeding of the 25th International Conference on Paste, Thickened and Filtered Tailings Paste 2023, 29 April–6 May 2023; Fairmont Banff Springs Hotel: Banff, AB, Canada, 2023. [Google Scholar]
  20. Qi, C.; Chen, Q.; Dong, X.; Zhang, Q.; Yaseen, Z.M. Pressure drops of fresh cemented paste backfills through coupled test loop experiments and machine learning techniques. Powder Technol. 2020, 361, 748–758. [Google Scholar] [CrossRef]
  21. Liu, H.L.; Hou, C.; Li, L.; Du, J.F.; Yan, B.X. Experimental investigation on flow properties of cemented paste backfill through L-pipe and loop-pipe tests. J. Cent. South Univ. 2021, 28, 2830–2842. [Google Scholar] [CrossRef]
  22. Jin, R.; Wang, X.; Zhang, S.; Huo, H.; Li, J.; Ni, W. Slurry Transportation Characteristics of Potash Mine Cemented Paste Backfills via Loop Test Processing. Processes 2024, 12, 2929. [Google Scholar] [CrossRef]
  23. Landriault, D.A. Paste backfill Mix Design for Canadian Underground Hard Rock Mining. In The 97th Annual General Meeting of the CIM; Rock Mechanics and Strata Control Session: Halifax, NS, Canada, 1995. [Google Scholar]
  24. Benzaazoua, M.; Fall, M.; Ouellet, S. Étude pluridisciplinaire visant à mettre au point un outil expert pour la prédiction du comportement des remblais en pâte. In Rapport n° R-390; IRSST: Montreal, QC, Canada, 2004. [Google Scholar]
  25. Brackebusch, F.W. Basics of Paste Backfill Systems. Min. Eng. 1994, 46, 1173–1178. [Google Scholar]
  26. Benzaazoua, M.; Belem, T.; Ouellet, S.; Fall, M. Utilisation du Remblai en Pâte Comme Support de Terrain. Partie II: Comportement a Court, a Moyen et a Long Terme. In Apres-Mines 2003; GISOS, Ed.; GISOS: Nancy, France, 2003. [Google Scholar]
  27. Tariq, A.; Yanful, E.K. A Review of binders used in Cemented Paste Tailings for Underground and Surface Disposal Practices. J. Environ. Manag. 2013, 131, 138–149. [Google Scholar] [CrossRef] [PubMed]
  28. Landriault, D. Keynote Address: They said “It will never work”–23 Years of Paste Backfill 1981–2006. In Paste 2006, Proceedings of the Ninth International Seminar on Paste and Thickened Tailings, Paste 2006, Limerick, Ireland, 3–7 April 2006; Australian Centre for Geomechanics: Crawley, Australia, 2006; pp. 277–292. [Google Scholar]
  29. Amri, M.; Belem, T.; Mrad, H.; Gélinas, L.P.; Masmoudi, F. Prediction of the Mechanical Properties of Cemented Paste Backfill Using Artificial Intelligence Approaches. In Paste 2023, Proceedings of the 25th International Conference on Paste, Thickened and Filtered Tailings, 29 April 2023; University of Alberta: Edmonton, Canada; Australian Centre for Geomechanics: Perth, Australia, 2023; pp. 233–243. [Google Scholar]
  30. Benzaazoua, M.; Bussière, B.; Demers, I.; Aubertin, M.; Fried, É.; Blier, A. Integrated mine tailings management by combining environmental desulphurization and cemented paste backfill: Application to mine Doyon, Quebec, Canada. Miner. Eng. 2008, 21, 330–340. [Google Scholar] [CrossRef]
  31. Ethier, M.P.; Bussière, B.; Aubertin, M.; Maqsoud, A.; Demers, I.; Broda, S. In situ evaluation of performance of reclamation measures implemented on abandoned reactive tailings disposal site. Can. Geotech. J. 2018, 55, 1742–1755. [Google Scholar] [CrossRef]
  32. Ouffa, N. Solubilité de Différents Minéraux Aluminosilicatés en Vue de Leur Contribution à la Géopolymérisation dans les Remblais Miniers en Pâte. Master’s Thesis, École Polytechnique, Montreal, QC, Canada, 2019. [Google Scholar]
  33. Danielsen, S.W.; Rueslåtten, H.G. Feldspar and Mica. Key Minerals for Fine Aggregate Quality. Bull. Eng. Geol. Environ. 1980, 22, 216–219. [Google Scholar] [CrossRef]
  34. Mshali, M.R.; Visser, A.T. Influence of Mica on Compactability and Moisture Content of Cement–Treated Weathered Granite Gravel. In Proceedings of the 33rd Southern African Transport Conference SATC 2014, Pretoria, South Africa, 7–10 July 2014. [Google Scholar]
  35. Khoshkbijari, R.K.; Samimi, M.F.; Mohammadi, F.; Talebitaher, P. Effects of Mica and Feldspar as partial cement replacement on the rheological, mechanical and thermal durability of self-compacting mortars. Constr. Build. Mater. 2020, 263, 120–149. [Google Scholar] [CrossRef]
  36. Xue, H.L.; Han, C.Q.; Chen, M.L.; Fan, G.; Zhou, J.W. Improving mechanical properties of manufactured sand concrete with high biotite content: Application of magnetic separation process and equipment optimization. Constr. Build. Mater. 2022, 350, 128–861. [Google Scholar] [CrossRef]
  37. Chi, H.; Wang, C.; Tian, Y.; Xie, Z.; Yuan, Q.; Chen, Z.; Zhu, X. Unraveling polycarboxylate superplasticizer (PCE) compatibility in muscovite-blended cement paste through aggregation mechanisms. J. Build. Eng. 2024, 95, 110–133. [Google Scholar] [CrossRef]
  38. Radoslovich, E.W. The structure of muscovite, KAl2(Si3Al)O10(OH)2. Acta Crystallogr. 1960, 13, 919–932. [Google Scholar] [CrossRef]
  39. Liebau, F. Structural chemistry of silicates: Structure, bonding, and classification; Springer Science & Business Media: Berlin/Heidelberg, Germany, 2012; Volume 13, pp. 919–932. [Google Scholar]
  40. Van Olphen, H. An Introduction to Clay Colloid Chemistry, 2nd ed.; Wiley: New York, NY, USA, 1977. [Google Scholar]
  41. Carty, W.M. The colloidal nature of kaolinite. Mater. Equip./Whitewares Ceram. Eng. Sci. Proc. 2001, 22, 31. [Google Scholar]
  42. Luckham, P.F.; Rossi, S. The colloidal and rheological properties of bentonite suspensions. Adv. Colloid Interface Sci. 1999, 82, 43–92. [Google Scholar] [CrossRef]
  43. Rand, B.; Melton, I.E. Particle interactions in aqueous kaolinite suspensions: I. Effect of pH and electrolyte upon the mode of particle interaction in homoionic sodium kaolinite suspensions. J. Colloid Interface Sci. 1977, 60, 308–320. [Google Scholar] [CrossRef]
  44. Burdukova, E.; Bradshaw, D.J.; Laskowski, J.S. Effect of CMC and pH on the rheology of suspensions of isotropic and anisotropic minerals. Can. Metall. Q. 2007, 46, 273–278. [Google Scholar] [CrossRef]
  45. Burdukova, E.; Becker, M.; Ndlovu, B.; Mokgethi, B.; Deglon, D.A. Relationship Between Slurry Rheology and Its Mineralogical Content. In 24th Int. Minerals Processing Congress; China Scientific Book Service Co. Ltd.: Beijing, China, 2008; pp. 2169–2178. [Google Scholar]
  46. Leroy, P.; Revil, A. A mechanistic model for the spectral induced polarization of clay materials. J. Geophys. Res. 2009, 114, 6–21. [Google Scholar] [CrossRef]
  47. Ndlovu, B.N.; Becker, M.; Forbes, E.; Deglon, D.; Franzidis, J.P. The influence of phyllosilicate mineralogy on the rheology of mineral slurries. Miner. Eng. 2011, 24, 1314–1322. [Google Scholar] [CrossRef]
  48. Ndlovu, B.N.; Forbes, E.; Becker, M.; Deglon, D.A.; Franzidis, J.P.; Laskowski, J.S. The effects of chrysotile mineralogical properties on the rheology of chrysotile suspensions. Miner. Eng. 2011, 24, 1004–1009. [Google Scholar] [CrossRef]
  49. Landriault, D.; Welch, D.; Morrison, D. Mine tailings disposal as a paste backfill for underground mine backfill and surface waste deposition; Short Course; Society for Mining, Metallurgy, and Exploration: Englewood, CO, USA, 1996; pp. 65–72. [Google Scholar]
  50. Brunauer, S.; Emmett, P.H.; Teller, E. Adsorption of gases in multimolecular layers. J. Am. Chem. Soc. 1938, 60, 309–319. [Google Scholar] [CrossRef]
  51. Jahns, R.H.; Lancaster, F.W. Physical Characteristics of Commercial Sheet Muscovite in the Southeastern United States. Geol. Surv. Prof. Pap. 1950, 225, 167. [Google Scholar]
  52. Young, R.A. The Rietveld Method; Oxford University Press: Oxford, UK, 1996. [Google Scholar]
  53. Dikonda, R.K.; Mbonimpa, M.; Belem, T. Specific Mixing Energy of Cemented Paste Backfill, Part I: Laboratory Determination and Influence on the Consistency. Minerals 2021, 11, 1165. [Google Scholar] [CrossRef]
  54. Dikonda, R.K.; Mbonimpa, M.; Belem, T. Specific Mixing Energy of Cemented Paste Backfill, Part II: Influence on the Rheological and Mechanical Properties and Practical Applications. Minerals 2021, 11, 1169. [Google Scholar] [CrossRef]
  55. ASTM C143/C143M-15a; Standard Test Method for Slump of Hydraulic Cement Concrete. American Society of Testing Material International: West Conshohocken, PA, USA, 2015.
  56. Nguyen, D.Q.; Boger, D.V. Direct yield stress measurement with the vane method. J. Rheol. 1985, 29, 335–347. [Google Scholar]
  57. Barnes, H.A.; Nguyen, Q.D. Rotating vane rheometry—A review. J. Non-Newton. Fluid Mech. 2001, 98, 1–14. [Google Scholar] [CrossRef]
  58. Kwak, M.; James, D.F.; Klein, K.A. Flow behaviour of tailings paste for surface disposal. Int. J. Miner. Process. 2005, 77, 139–153. [Google Scholar] [CrossRef]
  59. Wu, D.; Fall, M.; Cai, S.J. Coupling temperature, cement hydration and rheological behaviour of fresh cemented paste backfill. Miner. Eng. 2013, 42, 76–87. [Google Scholar] [CrossRef]
  60. Ouattara, D.; Yahia, A.; Mbonimpa, M.; Belem, T. Effects of superplasticizer on rheological properties of cemented paste backfills. Int. J. Miner. Process. 2017, 161, 28–40. [Google Scholar] [CrossRef]
  61. Ouattara, D.; Mbonimpa, M.; Yahia, A.; Belem, T. Assessment of rheological parameters of high density cemented paste backfill mixtures incorporating superplasticizers. Constr. Build. Mater. 2018, 190, 294–307. [Google Scholar] [CrossRef]
  62. Panchal, S.; Deb, D.; Sreenivas, T. Variability in rheology of cemented paste backfill with hydration age, binder and superplasticizer dosages. Adv. Powder Technol. 2018, 29, 2211–2220. [Google Scholar] [CrossRef]
  63. Roshani, A.; Fall, M. Rheological properties of cemented paste backfill with nano-silica: Link to curing temperature. Cem. Concr. Compos. 2020, 114, 103–785. [Google Scholar] [CrossRef]
  64. Herschel, W.H.; Bulkley, R. Konsistenzmessungen von Gummi Benzolloesungen. Kolloid-Z. 1926, 39, 291–300. [Google Scholar] [CrossRef]
  65. Cross, M.M. Rheology of Non-Newtonian Fluids. A New Flow Equation for Pseudo-plastic Systems. J. Colloid Sci. 1965, 20, 417–437. [Google Scholar] [CrossRef]
  66. Ouattara, D.; Mbonimpa, M.; Yahia, A.; Belem, T. Investigations of the Performance of Superplasticizers on Rheological Properties of Highly Viscous Cemented Paste Backfill Mixtures. Ph.D. Thesis, UQAT, Rouyn-Noranda, QC, Canada, 2017. [Google Scholar]
  67. Cyr, M.; Legrand, C.; Mouret, M. Study of the shear thickening effect of superplasticizers on the rheological behaviour of cement pastes containing or not mineral additives. Cem. Concr. Res. 2000, 30, 1477–1483. [Google Scholar] [CrossRef]
  68. Yahia, A.; Perrot, A. Measuring Procedures. In Measuring Rheological Properties of Cement-Based Materials; Sonebi, M., Feys, D., Eds.; Springer: Berlin, Germany, 2024; Volume 39. [Google Scholar] [CrossRef]
  69. Swamee, P.K.; Aggarwal, N. Explicit equations for laminar flow of Herschel–Bulkley fluids. Can. J. Chem. Eng. 2011, 89, 1426–1433. [Google Scholar] [CrossRef]
  70. Vatankhah, A.R. Analytical solutions for Bingham plastic fluids in laminar regime. J. Pet. Sci. Eng. 2011, 78, 596–600. [Google Scholar] [CrossRef]
  71. Pullum, L.; Fourie, A.B.; Jewell, R.J. Pipelining Tailings, Pastes and Backfill. In Proceedings of the 10th International Seminar on Paste and Thickened Tailings, Perth, Australia, 13–15 March 2007; Volume 1315, pp. 113–127. [Google Scholar]
  72. Hallbom, D.J. Pipe Flow of Homogeneous Slurry. Ph.D. Thesis, University of British Columbia, Vancouver, BC, Canada, 2008. [Google Scholar]
Figure 1. Experimental diagram.
Mining 05 00010 g001
Figure 2. Muscovite preparation steps.
Mining 05 00010 g002
Figure 3. Grain size distribution curves of used tailings.
Mining 05 00010 g003
Figure 4. Particle size distribution of tailings, muscovite, and mixtures of tailings with 13% muscovite: (a) RW tailings and (b) RL tailings.
Mining 05 00010 g004
Figure 5. Comparison of measured and targeted solids contents for cemented paste backfill mixtures containing different muscovite contents: (a) RW tailings and (b) RL tailings.
Mining 05 00010 g005
Figure 6. Standard Abrams cone slump test.
Mining 05 00010 g006
Figure 7. AR 2000 rheometer (from TA Instruments, DE, USA) used for the rheological test.
Mining 05 00010 g007
Figure 8. Comparison between the yield stress values of the Herschel–Bulkley and the polynomial models: (a) mixtures based on RW tailings and (b) mixtures based on RL tailings.
Mining 05 00010 g008
Figure 9. Impact of solids content on the Abrams cone slump of cemented paste backfill mixtures based on: (a) RW tailings and (b) RL tailings.
Mining 05 00010 g009
Figure 10. Impact of muscovite content on Abrams cone slump of cemented paste backfill mixtures based on: (a) RW tailings and (b) RL tailings.
Mining 05 00010 g010
Figure 11. Typical rheograms of cemented paste backfill mixtures containing different muscovite contents, X: (a) 70% solids content for mixture based on RW tailings and (b) 71% solids content for mixture based on RL tailings.
Mining 05 00010 g011
Figure 12. Influence of the solids content on the yield stress of cemented paste backfill mixtures containing different muscovite contents X: (a) mixtures based on RW tailings and (b) mixtures based on RL tailings.
Mining 05 00010 g012
Figure 13. Influence of muscovite content, X, on the yield stress of cemented paste backfill mixtures with different solids contents: (a) mixtures based on RW tailings and (b) mixtures based on RL tailings.
Mining 05 00010 g013
Figure 14. Influence of muscovite content, X, on the flow index n of the Herschel–Bulkley model of cemented paste backfill mixtures with different solids contents: (a) mixtures based on RW tailings and (b) mixtures based on RL tailings.
Mining 05 00010 g014
Figure 15. Dynamic viscosity curves of cemented paste backfill mixtures for different muscovite contents X: (a) mixtures based on RW tailings at a solids content of Cw = 70% and (b) mixtures based on RL tailings at Cw = 71%.
Mining 05 00010 g015
Figure 16. Influence of muscovite content, X, on the infinite viscosity of the Cross η model of cemented paste backfill mixtures with different solids contents: (a) mixtures based on RW tailings and (b) mixtures based on RL tailings.
Mining 05 00010 g016
Figure 17. Impact of muscovite content on the solids content required to maintain a given slump for (a) RW tailings-based cemented paste backfill and (b) RL tailings-based cemented paste backfill.
Mining 05 00010 g017
Table 1. Grain size distribution characteristics of materials.
Grain-Size ParametersTailings RLTailings RWMuscovite M7LMuscovite M4W
D90 (µm)94.412597.5130
D60 (µm)26.637.827.745.3
D50 (µm)18.927.418.230.1
D30 (µm)9.414.57.011.3
D10 (µm)3.36.92.02.8
CU (-)8.25.713.916.4
CC (-)1.00.80.91.0
P20µm (%)51.739.852.340.9
P80µm (%)87808575
Table 2. Mineralogical composition (in wt%) of the materials used.
Minerals M7L M4WRLRWRL + M7L
(α = 13%)
RW + M4W
(α ≈ 13%)
Quartz051.545.845.540.1
Muscovite *10015.114.325.124.3
Pyrite012.62.611.12.3
Clinochlore *06.255.54.4
Gypsum01.911.70.9
Albite00190.016.6
Ankerite0100.90.0
Augite010.4109.28.8
Calcite01.32.21.11.9
* Phyllosilicates10021.319.331.329.3
* Minerals classified under the phyllosilicate group.
Table 3. Experimental program.
Muscovite Content XTarget Cw (%)Conducted Tests
RWRL
Xi = 14% ≤ XXf = 24%70, 72, 74-
  • Water content
  • Slump
  • Rheology
Xi = 15% ≤ XXf = 25%-69, 71, 73
  • Water content
  • Slump
  • Rheology
Disclaimer/Publisher’s Note: The statements, opinions and data contained in all publications are solely those of the individual author(s) and contributor(s) and not of MDPI and/or the editor(s). MDPI and/or the editor(s) disclaim responsibility for any injury to people or property resulting from any ideas, methods, instructions or products referred to in the content.

