Article

TLS in Sustainable Mining Engineering: 3D Convergence and Surface Changes in Chamber Excavation in CH Salt Mine “Wieliczka”

1
Department of Land Surveying, University of Agriculture in Krakow, 21 Mickiewicza Ave., 31-120 Krakow, Poland
2
The “Wieliczka” Salt Mine, 10 Daniłowicza Street, 32-020 Wieliczka, Poland
*
Author to whom correspondence should be addressed.
Mining 2025, 5(1), 15; https://doi.org/10.3390/mining5010015
Submission received: 29 December 2024 / Revised: 4 February 2025 / Accepted: 10 February 2025 / Published: 15 February 2025
(This article belongs to the Special Issue Feature Papers in Sustainable Mining Engineering)

Abstract

:
When volumes of mining excavations change, rock mass is displaced. Convergence in a salt mine may lead to substantial deformations. The displacement may, in turn, cause an inrush of water from the rock mass into the mine, which is a catastrophic event. Hence, salt excavation convergence is regularly monitored. Traditionally, convergence is measured at monitoring stations. The measurements were first performed with rigid instruments (such as a wire extensometer), then with manual laser rangefinders, and now attempts are made to employ terrestrial laser scanning (TLS). This article presents the evolution of TLS surveys in the mine. The method is demonstrated with multiple scans of a heritage chamber at the Wieliczka salt mine. The analyses indicate that TLS streamlines measurements and offers copious results. The main aim of this study was to identify the most effective and reliable determination of geometric changes in the excavation using TLS data from several years. The differences represented by the models adjusted to a common coordinate system with an error of 5 mm can be considered correct and reflecting the actual changes in the excavation. This gives significant opportunities for the use of TLS data in monitoring the behavior of mine workings in the future. However, considering the insufficient accuracy, the technology must not be the sole source of insight into mining excavation convergence.

1. Introduction

Laser scanning has become an indispensable part of various areas of human activity as a technique for collecting environmental data in medicine, industry, and research. Laser scanning data are very useful for diverse analyses, design documentation drafting, as-is surveys, damage assessment, and spatial surveys and planning.
A terrestrial laser scanning (TLS) survey provides metric information about an object’s geometry in the form of a point cloud rendered in three dimensions. Additionally, scanning offers auxiliary information, such as return intensity at individual points, which reflects the type (material) of the measured medium. It can also provide information on some physical properties (such as moisture level). A complete point cloud is a multidimensional set of points representing the measured object.
In the context of underground mining, laser scanning offers relatively rapid and easy access to geometric information. Terrestrial laser scanning can be used to measure the plumb and horizontal alignment of engineering structures or investigate deformations both on the surface and within the rock mass [1]. The issue of using TLS technology in mining and geological hazard research has so far met with considerable recognition in the research community, which was confirmed in the review study of Kekeç et al. [2,3]. The authors concluded that geodetic and photogrammetric methods are less effective than the TLS method in terms of accuracy, speed and efficiency in conducting measurements, which explains the increasing popularity of this technology. So far, TLS data have been successfully applied both in determining slope stability and rock fall runout [4,5], convergence [6] or mapping mining paths [7,8] or in the determination of underground mining-induced displacement field [9,10,11] or deformation of buildings in mining areas [12,13]. The application of TLS data in 3D convergence and surface changes in mining excavations is performed using different methodological approaches, in which researchers evaluate both the accuracy efficiency of the solution, as well as time efficiency and simplicity. For example, Szwarkowski and Moskal calculated differential model of mining surface based on laser measurements, which presents differences up to 3 cm in coordinate values [14]. The solution of comparison of generated networks (grids) from point cloud data for extraction of surface deformation was also described by Li and Wang for Gubei Coal Mine, Huainan [15]. The approach of using cross-sections from TLS data (an empirical method, approximation by a semi-ellipse and approximation by a semi-ellipse with attached straight sections) in monitoring the deformation of a rockmass (e.g., convergence) was described, among others, by Janus and Ostrogórski [16]. Currently far superior, TLS can provide up to millimeter-level accuracy [9,10]. TLS is an active remote sensing technique that enables the acquisition of high-density and high-accuracy object data. However, TLS technology underground also has some limitations. During measurements, the TLS equipment transport, setup, and the number of scan station collection points are depending on the user’s expertise and can be time consuming [11]. In addition, TLS technology is mainly suitable for measuring small areas. Therefore, the use of mobile laser scanners (MLS) and SLAM (Simultaneous Localization And Mapping)-enabled handheld laser scanners devices is becoming increasingly popular.
Mining is far from being environmentally friendly. Mining voids migrate towards the surface due to convergence and appear as a continuous feature (a subsidence trough) or a non-continuous feature (such as a sink). The mine archives offer such records: ‘On 10 October 1834, a sink into the chamber occurred, reaching up to the surface, slightly north-west to the intersection of Klaśnieńska Street and Janińska Street. A multifamily building collapsed together with utility buildings. Several houses were damaged’ [17].
The deformation process is monitored by measuring the ground surface configuration and excavation geometry [18,19]. Salt mining facilities require constant monitoring of excavation and rock mass deformation due to a substantial hydrological threat [20,21]. One way to monitor changes in rock mass is to measure convergence. Convergence is defined as a slow and gradual constriction of excavation voids or a negative increase in distances between walls of underground excavations, a quantifiable narrowing of exploitation voids.
The authors present the potential of using TLS to measure convergence in salt excavations. This article provides an overview of traditional methods of measuring convergence and new high-tech measurements. This study’s aim is to investigate the potential of using laser scanning in analyses of convergence and surface changes in a chamber excavation in the Wieliczka Salt Mine. The scientific goal is to identify the most effective and reliable determination of geometric changes in the excavation using TLS data from several years.

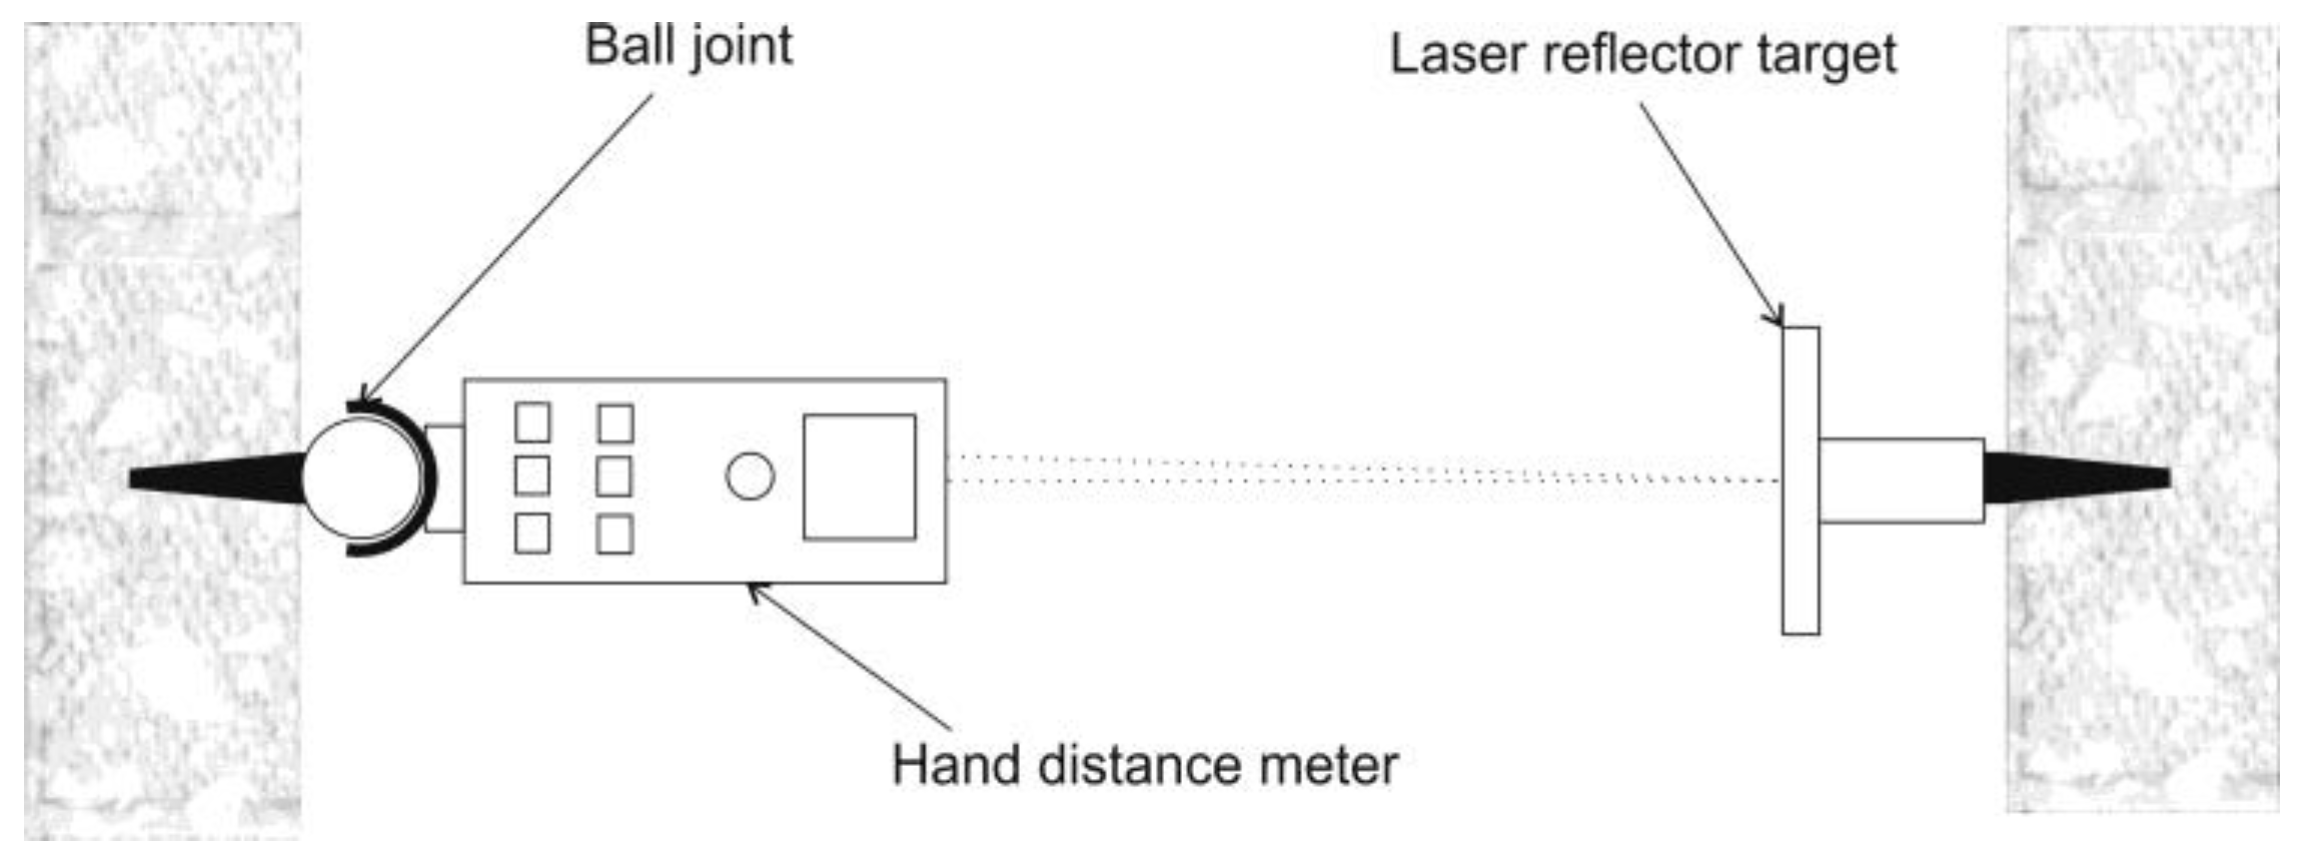
2. Traditional Convergence Measurement Methods

Excavation convergence, the constriction of mining voids, is a typical manifestation of rock mass pressure. In salt mining, however, convergence is particularly relevant. Because of the rheological properties of rock salt (elasticity, plasticity, and viscosity), convergence can take up to several hundred years. Convergence leads to changes in rock mass geometry, causing displacements and deformations that may be of catastrophic consequences (inrush of water and uncontrolled deformation). Therefore, measurements and analysis of the deformation in excavations and the entire salt mine are the primary tools for deformation monitoring and safety.
Elasticity theory refers to convergence as dilatation. Formally, there is absolute convergence (a change in a specific dimension), relative convergence (a change in a quantity value relative to the initial value), linear convergence, surface convergence, and volume convergence. According to elasticity theory, relative volume convergence (ξV), the values of which are small relative to the excavation dimensions, can be defined as [22,23]:
ξ V = d V d V d V
where
  • dV′ is the excavation volume after deformation, and
  • dV is the initial excavation volume.
Figure 1 shows a constricting cuboid excavation in a local coordinate system. The volume of the excavation changes due to three axial displacements (along the local cuboid coordinate system x, y and z adequately u, v, and w).
Assuming labels as in Figure 1, Relationship (1) can be formulated as:
ξ V = d x d y d z ( u + d x ) ( v + d y ) ( w + d z ) d x d y d z
Considering that the displacements have negative scalar components and the displacement (relative change in the distance, relative linear convergence) is a derivative of the displacement, Equation (2) can be converted to:
ξ V = ( ξ x + 1 ) ( ξ y + 1 ) ( ξ z + 1 ) 1
where ξ x , ξ y , ξ z are axial relative linear convergences.
Assuming the displacements are small relative to the excavation and linear convergences (deformations) are small relative to one, then according to elasticity theory, reduced Relationship (3) yields:
ξ V = ξ x + ξ y + ξ z
Therefore, the volume convergence of the excavation is a sum of linear convergences in three perpendicular directions. Volume convergence has to be known to analyze the deformation process, but it is hard to measure.
When discussing changes in the initial shape of a 3D object such as excavation, one expects a result that is a change in volume in cubic meters or per milles for relative convergence for an idealized measurement. In fact, due to the limitations of underground workings and their characteristics, linear monitoring stations have become a standard. Depending on the measurement method, they provide millimeter-level accuracy [9].
Linear convergence can be measured with various methods. Traditionally, these are enclosed telescopic monitoring stations, as shown in Figure 2a. A classical calipers approach is also employed (Figure 2b). These solutions, however, restrict access to the chamber. A manual distance meter is a different option (Figure 3).
A network of points anchored in the roof, floor, and sides is installed in the excavation. Some points have targets with reflective film fixed to them, while others have a manual laser rangefinder on a ball joint. Thanks to the ball joint, the beam can be aimed at the target. This method is convenient because it does not restrict the accessibility of the excavation space with monitoring stations. Still, it is less accurate. Considering the minuscule increases in convergence in salt mines, greater measurement error is detrimental but necessary for organizational, technical, and financial reasons.
The monitoring networks of all salt mines in Poland were expanded in the late 1970s because of catastrophic events (Mining “Wapno”) caused by the inrush of water [25,26]. The mine in Wieliczka became a testing ground where measurement methods were developed while monitoring changes because of its complex geological and mining profiles and relative safety. Technological advances and pressure to ensure adequate excavation safety led to several hundred new monitoring stations in different parts of all eight levels of the mine.
Throughout its history, the Wieliczka mine employed several monitoring configurations, using both stationary and mobile devices. The first measurement method in the Wieliczka Salt Mine is the telescopic convergence indicator with a very simple principle of operation (Figure 2a). Two concentric tubes are anchored in the roof and floor. One of them slides into the other. The scale at the interface can be used to read changes down to 0.01 mm. Regrettably, the station was damaged during the chamber’s redevelopment and dismantled. Appreciating the fragility of stationary stations, the mine authority turned to mobile solutions. These were tape or rod convergence indicators (Figure 2b). Laser distance meter and targets (Figure 3) are yet another possibility commonly used today [9].
Today, the Wieliczka Salt Mine has two monitoring cycles. One is conducted by a third party controlling 548 stations in 117 excavations on levels I through VIII. The measurements are conducted every five years and concern excavations of secondary historical importance that may, nevertheless, potentially threaten the entire mine. The other cycle consists of annual measurements by the mine staff. It covers approximately 240 stations on levels I through III near the Spa Tourist Trail and the Cracow Saltworks Museum [10].
Considering technological advances, it is possible to attempt to measure excavation geometry with laser scanners and determine convergence based on the scanning data.

3. Materials and Methods
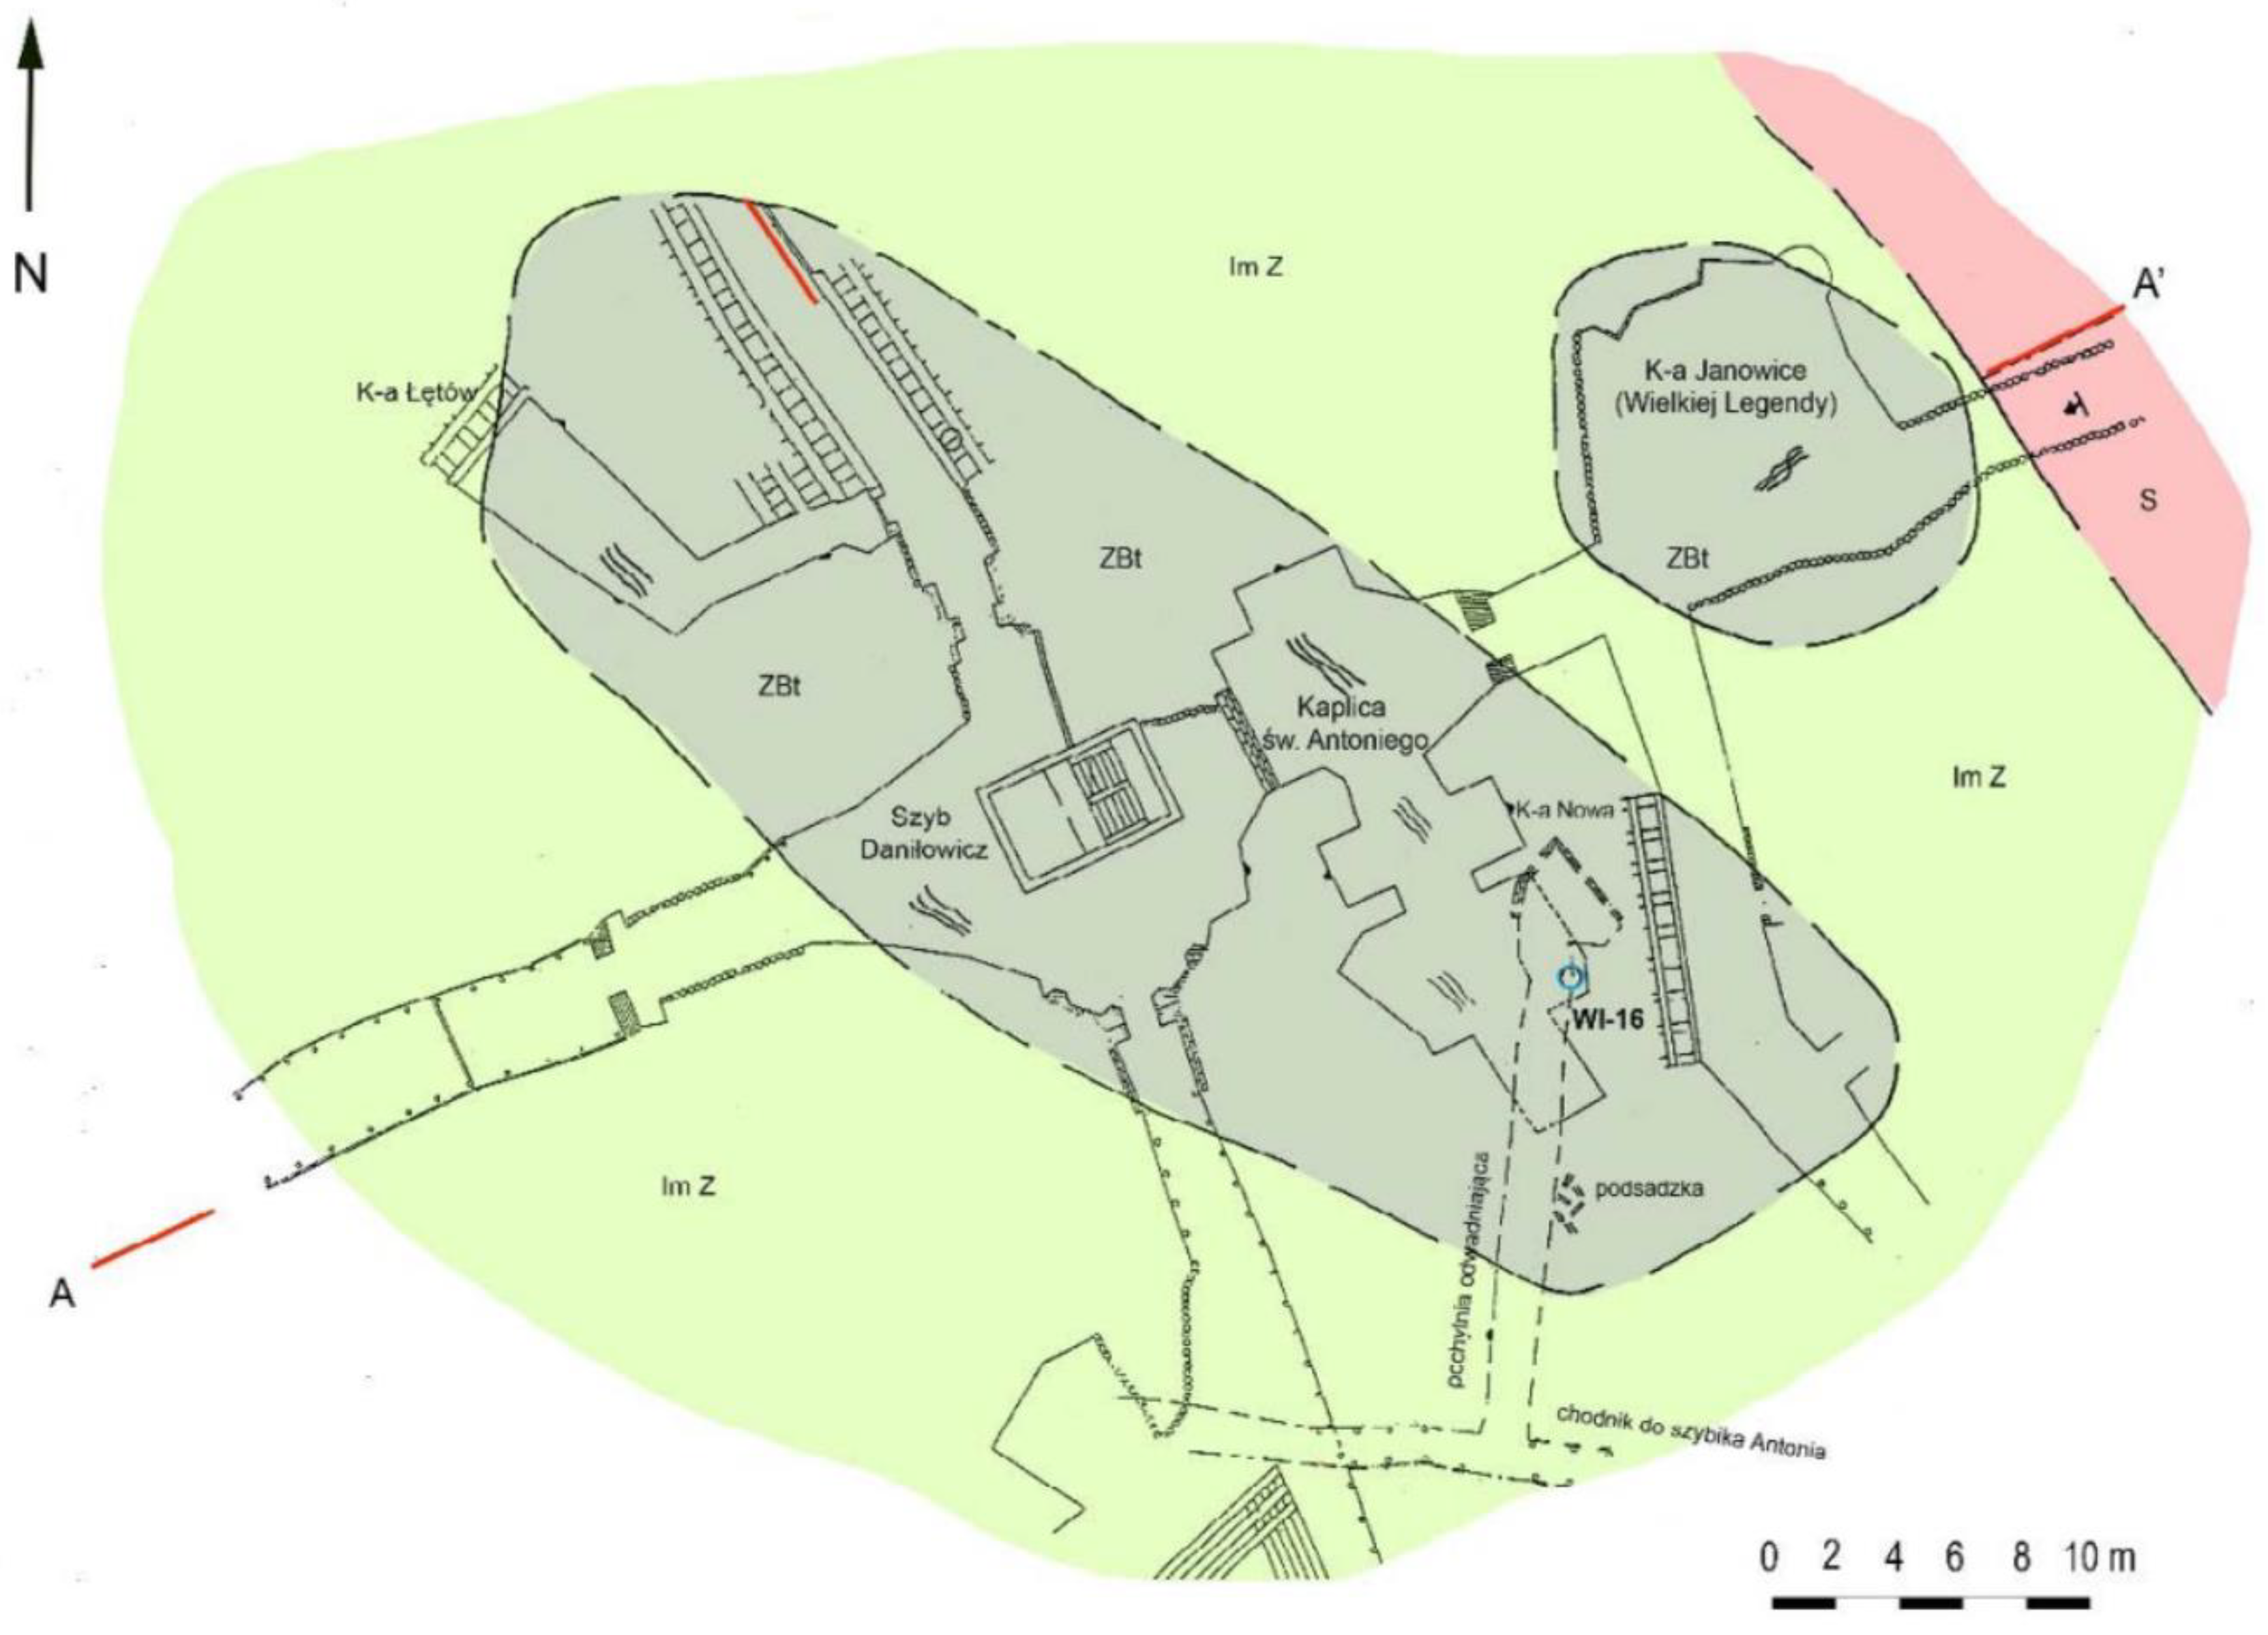
3.1. Study Sites

The investigation of 3D convergence and surface changes using TLS data was conducted in a chamber excavation of the Wieliczka Salt Mine. The St Anthony Chapel is located 64 m below the surface on the first level of the mine. Today, it is one of the most valuable sites open to the public. It is unique in that it has always been a religious object ever since it was built in 1687–1710. Regrettably, considering the chapel’s disadvantaged location very close to the Daniłowicz Shaft and hydro-geological conditions on site, it has always been at risk of excess water and humidity, detrimental to the green salt chamber. As it is historically priceless, many attempts have been made to protect the excavation and preserve it for future generations of miners and tourists.
The St Anthony Chapel was excavated in a single block of green salt found during the excavation of the Daniłowicz Shaft, which is part of the tourist route today [14]. The approximate dimensions of the chamber are 19.1 min length, 7.6 m in width, and 5.8 m in height. The position of the site relative to the surrounding excavations is shown on the geological map (Figure 4) and the geological profile (Figure 5).
Color coding in Figure 4: light green—ganuge in a megabreccia deposit (ImZ), dark green—typical megabreccia green salt (Zbt), and pink—contaminated salt in stratified deposit (S). The geological analysis revealed that the site is a chamber excavation in a salt rock mass. Therefore, it can be expected to converge slowly due to salt’s plasticity (flow). Effects of the stresses in the excavation are initially observable only with geodetic measurement methods. Then, as the stress reaches its maximum, visible deformations occur, such as cracks, caving, or even complete failure of excavations.
The St Anthony Chapel is subject to regular traditional measurements (levelling, linear measurements) and laser scanning. The traditional measurements in the St Anthony Chapel are performed once a year. The chamber has two horizontal monitoring stations, transverse and longitudinal, which were installed in 2009, and one vertical station, which was fixed and monitored in 2005. Terrestrial laser scanning data are five point clouds. The first one was collected in 2012 by a third party. Following scans from 2021, 2022, 2023, and 2024 were performed by the mine staff.

3.2. Convergence Measurement Methods of Mining Workings

The configuration of the monitoring stations in the St Anthony Chapel is a classic example of a spatial change monitoring system. There are three stations in the excavation. The horizontal stations are perpendicular to each other, monitoring any transverse and longitudinal changes. The measurements conducted since 2009 involve a manual rangefinder measuring the distance between points fixed to sides opposite to each other [24,27]. The points are marked with a stainless steel bolt. The rangefinder and a special target are pressed against them, and the distance is measured at 1 mm accuracy. The Wieliczka mine has two types of vertical monitoring stations. The first consists of a point fixed to the floor from which the distance to the target fixed to the roof is measured with a rangefinder. The other method is the one employed on the site. It consists of two well-defined points. One of them is usually fixed to the roof so that any vertical changes can be identified. The other point becomes a side benchmark, a reference for the station. In the case of the site at hand, one vertical station has been observed since 2005 using technical levelling at 1 mm accuracy.
When laser scanning technology became available, engineers started to employ it to measure salt mine excavations. A query into the surveying records in Wieliczka revealed a mention of the first use of a Callidus laser scanner in 2002. The measurement took place in a chamber on level II, down, and the point cloud is presented in Figure 5.
Other records of TLS in the Wieliczka Salt Mine are from 2005, when the St Kinga Chapel was surveyed with three systems: Surfaizer, Cyrax 2500, and Riegl (Figure 6, Figure 7 and Figure 8). The scanning devices available on the market at that time were used only to obtain demonstration point clouds. Finally, in 2016, the mine’s management purchased the first Z + F laser scanner, which began regular data acquisition on mine workings.
Monitoring of 3D convergence and surface changes from TLS data was initiated in 2012. It was then that the mine commissioned the first TLS survey of the site. Regrettably, only the resultant point cloud is available without auxiliary information about the number of stations or accuracy. Even though such critical information was missing, the authors decided to include this point cloud in the study, considering its apparent good quality. Then, monitoring involved traditional measurements until 2021. The exceptional value of the site and prospective conservation efforts motivated the Survey and Geology Department staff to establish 11 monitoring points jointly with the Cracow Saltworks Museum. The points are expansion anchors cemented into salt rock. Adapters for rotary tilting black and white targets by Z + F are screwed into the anchors to carry out measurements. The configuration of the targets in the chamber and the internal view of the point cloud are shown in Figure 9.
The 2021 scan was conducted with Leica BLK 360. The survey involved n = 23 stations. The mean registration error was RMS (Root Mean Square error) = ±6 mm. The other scans in 2022–2024 were completed with a Zoller + Fröhlich model 5010C. The change in the device was due to the insufficient accuracy of the first system. Leica BLK 360 is a complete system that is perfect for narrow excavations in the Wieliczka mine. Its dimensions (165 × 100 mm2) and weight of approximately 1 kg are its key assets. It was soon discovered that it was merely adequate for the surveys. It could not be used on sites where relatively good accuracy was expected due to its low accuracy and a comparably large degree of point cloud ‘contamination’. The Z + F 5010C scanner was selected for surveys in places where better accuracy was expected. In 2022, the scanning involved n = 10 stations, with a mean point cloud registration error of RMS = ±1.1 mm (2023: n = 11, RMS = ±1.4 mm; 2024: n = 20, RMS = ±0.9 mm). The improved accuracy came at the cost of lower ergonomics (Z + F 5010C dimensions: 170 × 286 × 395 mm3, approximately 10 kg). The technical performance more than compensates for the difficulty involved in moving the system around the facility.

3.3. Methods

The first step in this study on 3D convergence and surface change measurements with TLS data was to verify whether the results of the traditional measurement methods are reflected in the results of point clouds. To this end, the authors compared TLS distance measurements with the results of the direct linear station measurements.
The preparation of point clouds for differential model building involved several steps. These were a rough manual cleanup (filtration) of the clouds, cleanup (filtration) in CloudCompare 2.13.2 with the SOR and Noise filters, and georeferencing the point clouds [28]. At the georeferencing step, the authors decided to reject the 2012 and 2021 datasets because no targets were registered and their quality was below par.
Then, the point clouds were aligned to a common coordinate system. The 2022 point cloud was selected as the reference dataset. The coordinates of the targets were extracted from it. The coordinates of the six targets were extracted semi-automatically, meaning the targets were manually selected, and their centers were automatically determined with the software’s algorithms. The 3D coordinates of the centers were exported to a text file. Next, the authors transformed the other clouds by aligning them to the reference (the 2022 cloud) using the coordinates of the targets. All coordinates were employed for georeferencing. The georeferencing process is the registration of the point cloud with defined referenced coordinate. Registration is a computational process aimed at determining the transformation parameters between two Cartesian coordinate systems, represented by sets of corresponding points located on scans from two stations: (X1, Y1, Z1), (X2, Y2, Z2). The mathematical model of registration, which is presenting the relationship between single scan stations, can be written in the form of a seven-parameter Helmert transformation:
X 1 Y 1 Z 1 = λ R X 2 X c Y 2 Y c Z 2 Z c
In Equation (5), the rotation matrix R is formed by three axial torsion angles, popularly denoted in photogrammetry as: ω, ϕ, κ. The position of the coordinate system of scanner station 1 (X1, Y1, Z1), in the reference system of scanner station 2 (X2, Y2, Z2) is expressed by the components of the translation vector: (Xc, Yc, Zc). Equation (5) presents the general case of the seven-parameter Helmert transformation with scale change. If we assume for point clouds that the scale change factor λ = 1, then the transformation represents the case of a rigid body transformation (point cloud). The constant value of the λ factor is provided by the real, absolute scale of the acquired three-dimensional object data in the TLS technology. The point cloud registration process, therefore, consists in determining six parameters of the Helmert transformation for two point clouds that have common elements, thanks to which all coordinates acquired in the scanning process can be transformed to the desired coordinate system.
When recalculating the accuracy of registration, the software determines the best corresponding points, assuming the minimum number of points for 3D objects to be three.
The 3D convergence and surface change analysis from TLS data was based on differential models. It is a technique employed in analyzing and processing point clouds. It involves juxtaposing two datasets to detect and determine the values of any differences between them, which reflect spatial changes. This study followed a two-pronged methodology in terms of model generation methods.
The data were processed with the following software packages: Autodesk AutoCAD 2024, CloudCompare 2.13.2, Autodesk ReCap 2022, Leica Cyclone Core 2023 and Microsoft Office.
The first approach to point cloud differentiation covered all the point clouds. Their models were generated by registering clouds to clouds in the software environment. The description of the method for building differential models in CloudCompare has to start by specifying the datasets used and how they were juxtaposed. The spatial changes in the excavation were analyzed using all the point clouds that had been filtered and cleaned up, but each retained its coordinate system. Considering the minuscule scale of changes identified through traditional measurements, the expected differences should be in millimeters. The best possible configuration was to compare the first cloud from 2012 to the others. This approach could additionally demonstrate changes in the St Anthony Chapel over ten years. The first step was to roughly overlay a cloud on a cloud by manually moving one entity over the other using the Translate/Rotate tool. The process was completed for all three dimensions to minimize the distances between the entities as far as possible. Next, the authors moved on to overlay the clouds precisely, once again using the software’s tools, namely Fine Registration (ICP). The tool automatically precisely registers two entities relative to each other with two primary assumptions of rough registration and object similarity. ICP is a point cloud registration algorithm employed to minimize the difference between two clouds of points. The Iterative Closest Point algorithm keeps one point cloud, the reference or target, fixed, while transforming the other, the source, to best match the reference. The transformation (combination of translation and rotation) is iteratively estimated in order to minimize an error metric, typically the sum of squared differences between the coordinates of the matched pairs. ICP is one of the widely used algorithms in aligning three dimensional models given an initial guess of the rigid transformation required. If the two preconditions are satisfied, one can progress to the next step. When two entities were selected, the 2012 point cloud and one of the consecutive point clouds, the authors chose the reference and model entity. The reference entity is the same for all the models. The authors decided to use the 2012 point cloud as the reference so that it can be compared to the consecutive point clouds. After registration, the differential models could be generated and adapted for visualization. The models were built with Cloud-to-Cloud Distance. In this case, the model is generated based on differences in distances between the registered datasets. Just as before, the first step was to select the reference cloud and the compared cloud. It was important to use the 2012 data as the reference both for the first model and each consecutive model that emerged from the registration.
The other approach to point cloud differentiation involved georeferenced point clouds. The comparison was performed for point clouds with a common georeference. The data employed come from the three last scanning sessions, which means they are complete and of the highest quality. The differential models were generated as described above and using the same parameters. As the clouds had a common coordinate system, the first step, registration, was omitted.
The two-pronged post-processing policy provided the opportunity to compare the accuracies of the two approaches. The information from the differential models was then complemented with spectral information from return intensity analysis for damp locations and those at extreme risk of water impact.

4. Results

4.1. Quality of TLS Datasets and Direct Linear Station Measurement

The assessment of the quality of the TLS data compared to traditional measurements yielded ambiguous conclusions. With the exception of the 2021 data, which differ substantially from the other datasets, the mean difference between linear station distances for traditional measurements was ±5 mm, which is much more than the mean annual change observed over the entire period of approximately −1 mm per year (Table 1, Figure 10).
The initial verification of the consistency of the H1, H2 and V1 base lengths proved the sense of further research on the application of TLS data in the study of the convergence of salt mines. The differences in the lengths of H1, H2 and V1 bases from TLS data and traditional measurement were millimeters, so it was assumed that the TLS data could be useful.

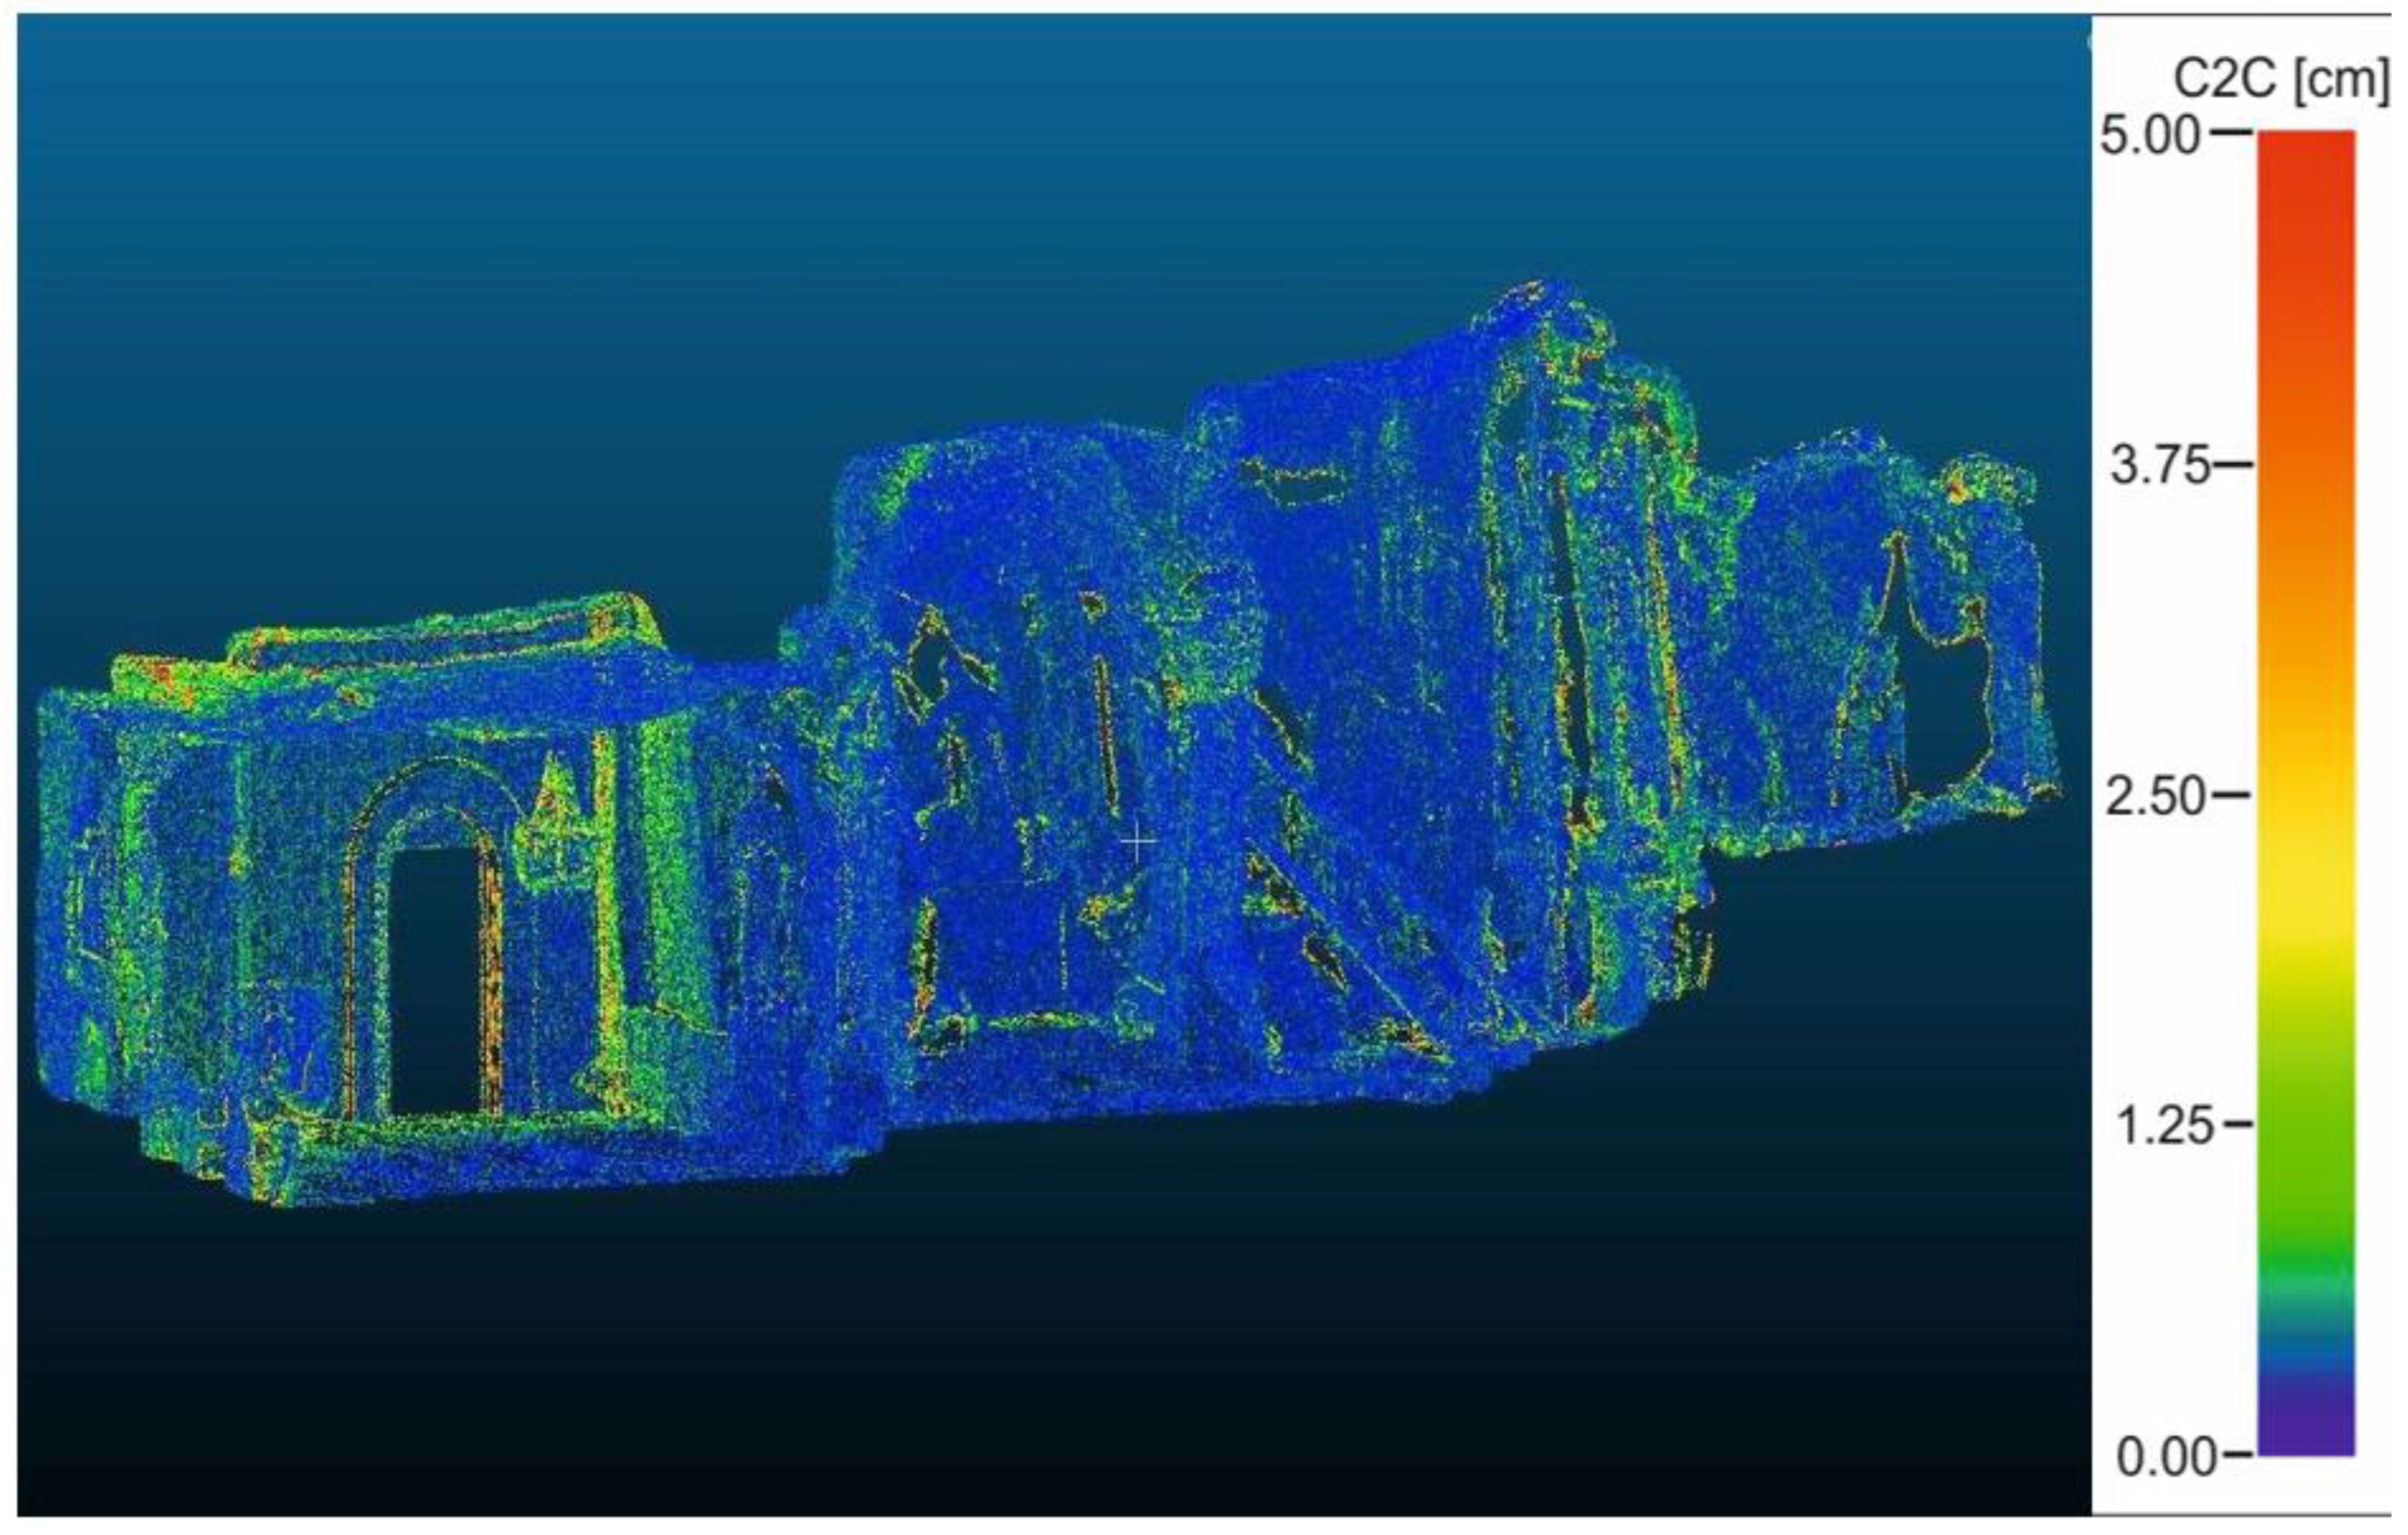
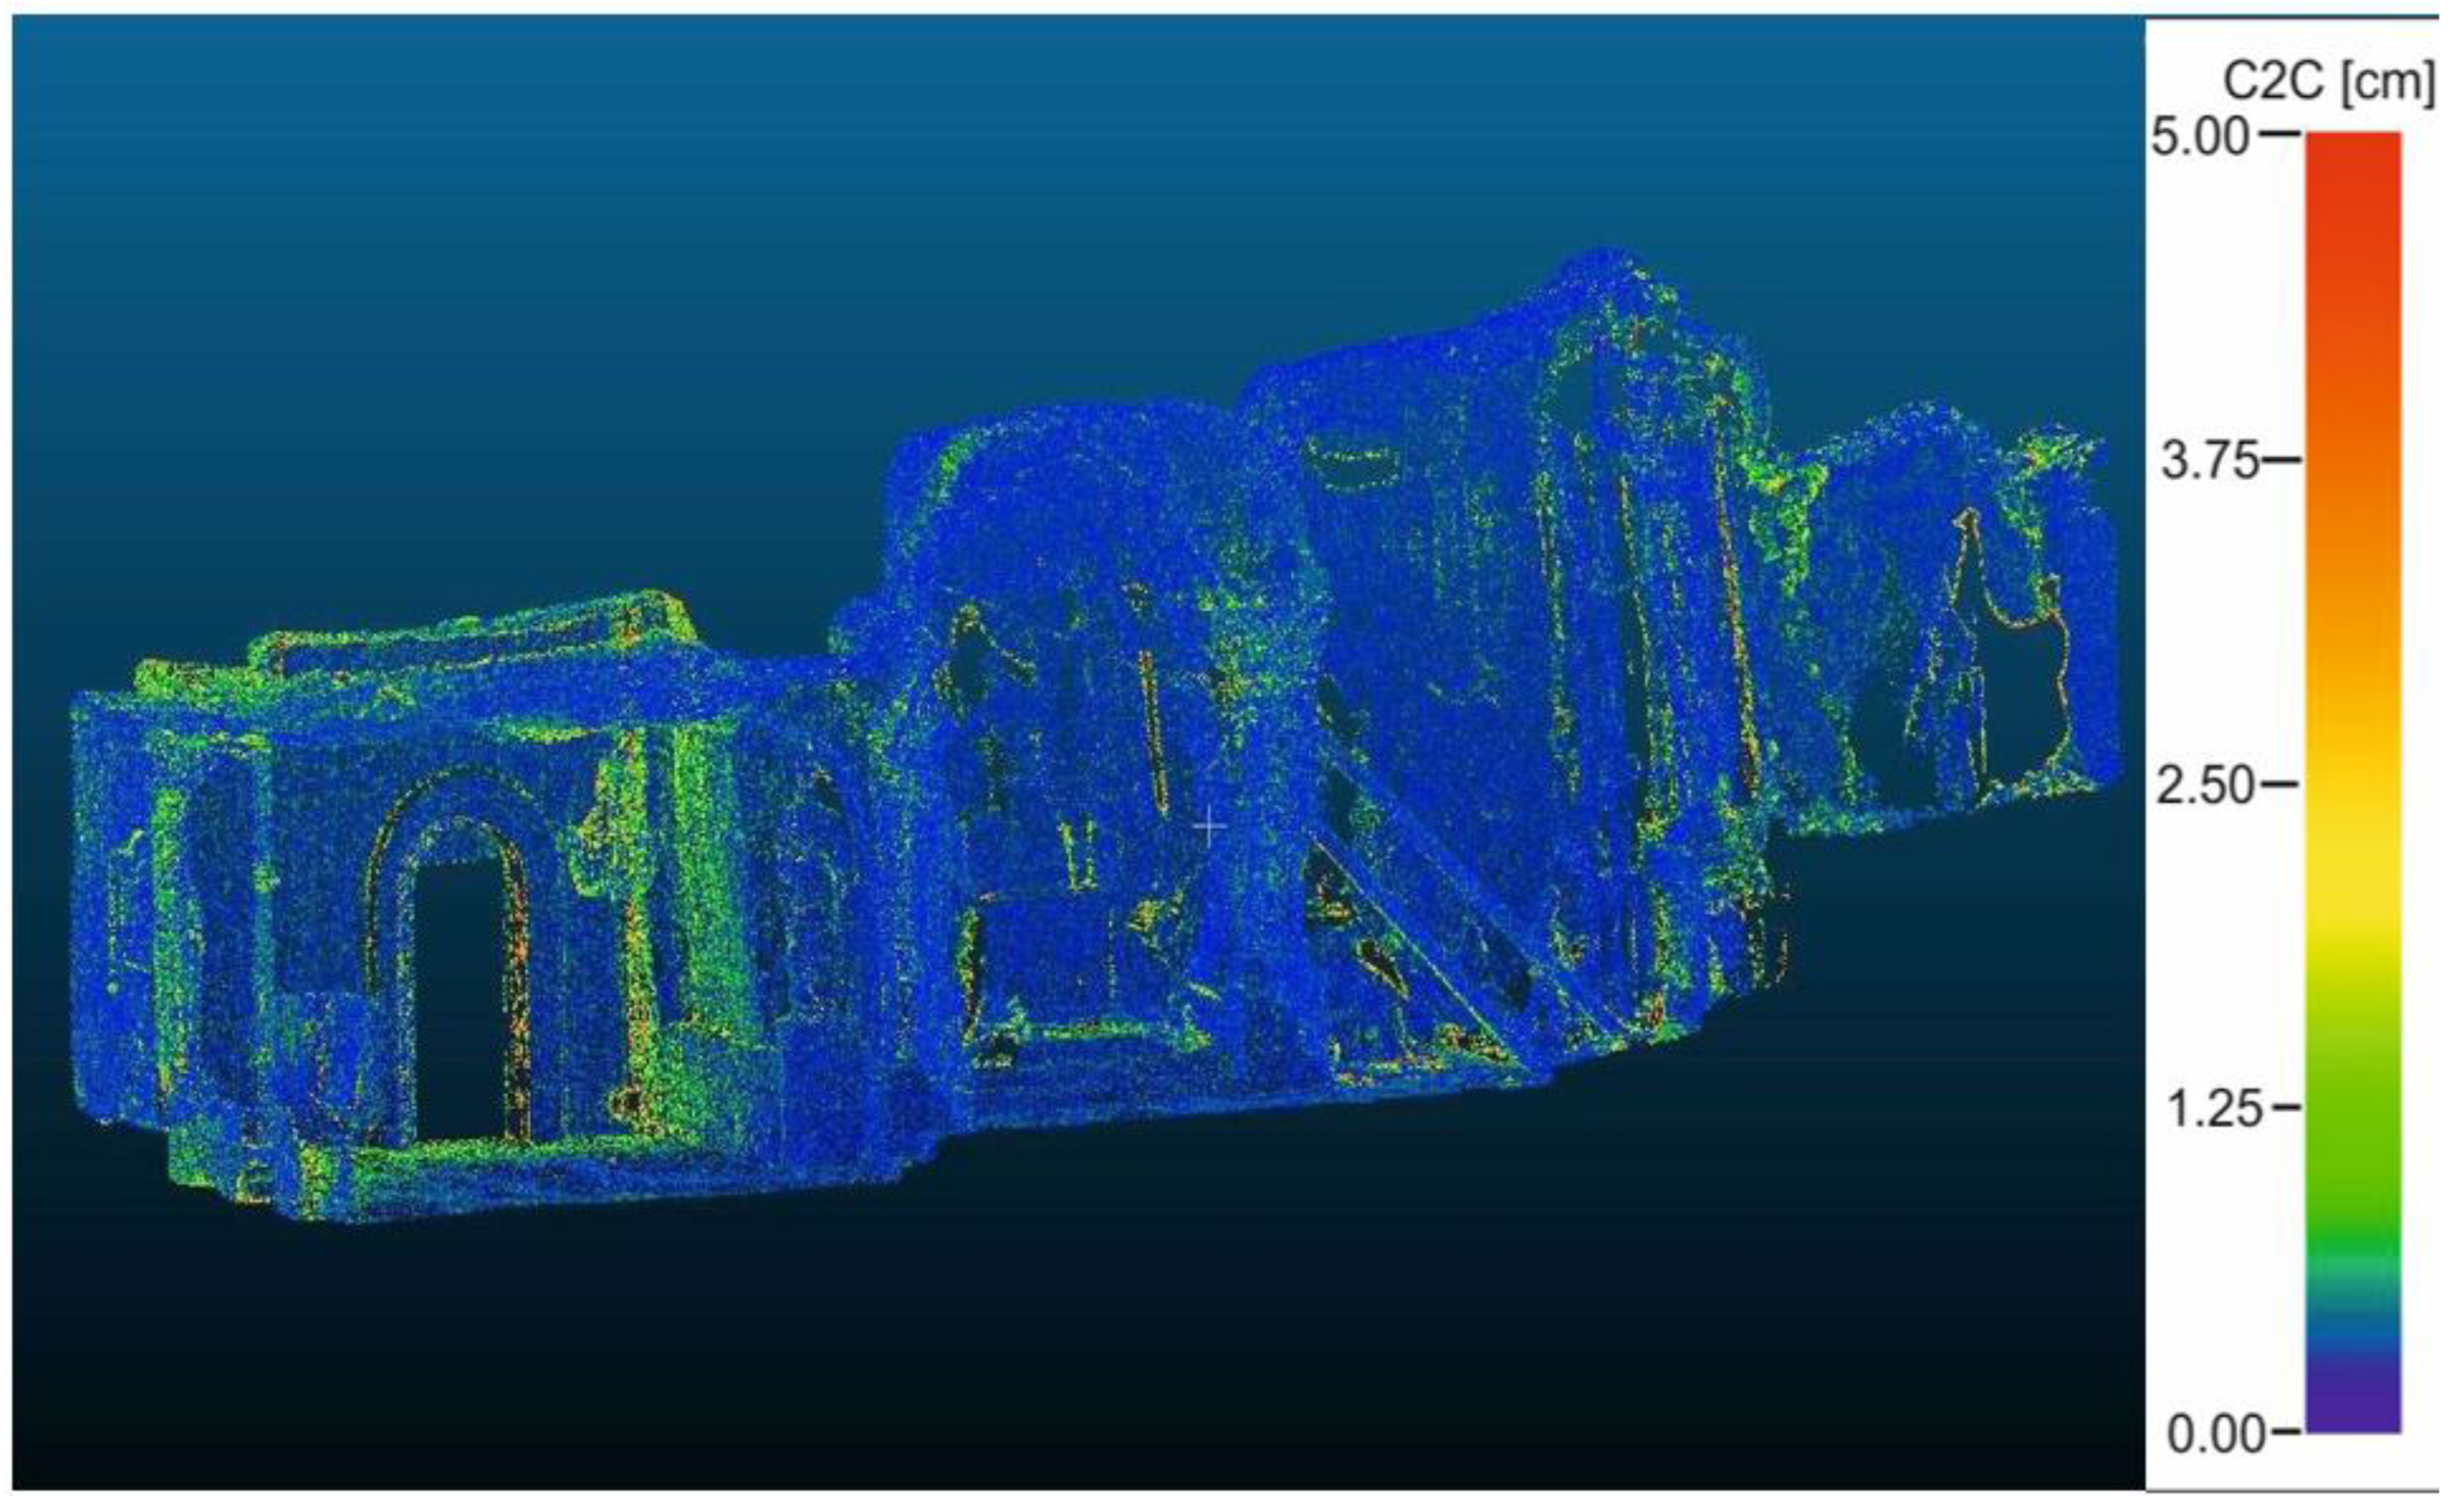
4.2. Differential Models from Point Clouds With and Without Georeferencing

Before the results from the differential models can be discussed, a presentation disclaimer is in order. Considering the amount of information and range of values, the authors follow the top–down approach. This way, the differences between the products and model accuracies can be depicted most effectively.
  • Differential model 2012–2021, no georeferencing
The quality of the 2021 dataset is relevant to the comparison. The point cloud from Leica BLK 360 demonstrated a much poorer quality compared to the other datasets, which was evident from the much higher noise level. The graphic representation of the changes includes changes from 0.7 to 43 mm (Figure 11), which is much more than for traditional measurements, where the mean difference for the period in question was approximately 10 mm. Moreover, the registration accuracy of nearly 24 mm has to be considered as well. In light of the resultant accuracy and registration uncertainty, the values are not fit for use. Therefore, the device used for the scan should not be employed again.
2.
Differential model 2012–2022. Cloud-to-cloud registration
The first thing clear about the next period is the much different value distribution (Figure 12). The changes are within the range expected for the traditional methods and could be considered correct (values within 0.6–20 mm).
Despite the potentially correct results, the registration accuracy of approximately 13 mm has to be considered as above. The comparison of the results of the model and registration could justify using TLS for convergence investigation. Still, it should not be the only method of observation due to the uncertainty of the results.
3.
Differential model 2012–2023. Cloud-to-cloud registration
The third differential model is slightly different than the second one. Its values are similar to those of its predecessor (Figure 13). This fact is even more intriguing considering the similar registration accuracy for both models. This suggests that the accuracy of post-processing—registration in this case—affects the accuracy of the final product. Just as before, the authors would be very cautious about using the results in analyses of changes in the excavation.
4.
Differential model 2012–2024. Cloud-to-cloud registration
The last model representing differences between two extreme scans offers values similar to those above. This confirms the negative impact of poor registration of point clouds on the values. The values for which the registration error is almost 13 mm are within 0.5 to 21 mm (Figure 14). This is not satisfactory for convergence investigation but could be used in rough analyses.
5.
Differential model 2022–2023, georeferenced
The next compared datasets were point clouds with the same coordinate system adjusted as described above (see Section 4.2). The impact of cloud-to-cloud georeferencing is easily seen thanks to much-reduced changes in the differential model. The resulting values range from 1 to 2 mm. Combined with the error of alignment to a common coordinate system of 5 mm, this makes the differential model a complete product for monitoring convergence changes in a chamber excavation. The results of the comparison of non-georeferenced point clouds were roughly the same as the registration error, which prevented unambiguous identification of locations of potential changes. Here, the results are different. Places with higher values can be easily identified, which justifies further analyses of the model. To visualize the changes and differences between the models with and without georeferencing, the authors performed a differentiation for the threshold value of 2 cm, as shown below (Figure 15).
6.
Differential model 2022–2024, georeferenced
Just as for the previous period with a common coordinate system, the values conform to the accuracy requirements. This once again demonstrates the importance of post-processing accuracy for obtaining the most realistic change values. The coordinate system adjustment error of ±2 mm and values within 2 mm yield complete and valuable information on the processes within the excavation. Such processed and configured data suggest that laser scanning may replace traditional measurements in terms of accuracy and further improve the volume of data provided. The differences between the methods of adjustment to coordinate systems are represented below (Figure 16).
The models shown above best visualize how registration affects the results. Registration of point clouds to a common coordinate system (georeferencing) is an important reducer in point cloud difference models. Thanks to the use of georeferencing, it is possible to show millimeter differences (from 5 mm upwards), which is already a satisfactory result in the context of salt mining research.
This article attempts to evaluate the applicability of terrestrial laser scanning to convergence and surface change monitoring in mining excavations, using a chamber in the Wieliczka Salt Mine as an example. The analysis involved comparing current methods with TLS, selecting the right post-processing method to ensure the required accuracy, and observing surface changes.
The data used in this study came from the Wieliczka Salt Mine Survey and Geology Department. The datasets included results of annual measurements with traditional methods since 2005 (one of first salt mine scanning attempts) and point clouds from terrestrial laser scanning completed in 2012, 2021, 2022, 2023, and 2024. Auxiliary sources included numerous graphic documents, such as geological maps and profiles.
This shows the importance of the final point cloud quality for studies on TLS applications. The problem is best illustrated by data from 2021 and 2022, which offer two extremes on the quality spectrum. Note here the substantial difficulty of unambiguously identifying points belonging to the stations in point clouds. The time it takes to pinpoint these locations is much longer than the time needed to perform a traditional measurement. This is why neither accuracy nor time can be improved if the traditional measurement of linear stations is replaced with TLS with the current configuration. Verification of point-to-point conformity of TLS data with traditionally obtained data and its results is only a rough process and has to be followed with 3D measurements. Three-dimensional data represent reality in an exhaustive rather than local manner.
The assessment of the terrestrial laser scanning’s potential for investigating changes in rock mass followed two approaches. The first one was to compare TLS with the traditional methods. The other involved differential TLS models and an analysis of potential changes within the excavation.
The first analysis aimed to determine whether TLS is capable of providing a similar level of accuracy and confidentiality as traditional measurement methods in the Wieliczka Salt Mine. Even though the analysis provided a simple comparison of a few values, its results support several relevant conclusions.
Considering the mean annual convergence changes in below 1 mm detected with the traditional methods over the entire period, the authors deemed the cloud-to-cloud registration method unacceptable due to poor accuracy. Values ranging from 10 to 30 mm are much above the expected analytical accuracy.
The differences represented by the models adjusted to a common coordinate system with an error of 5 mm can be considered correct and reflecting the actual changes in the excavation. These models can be deemed correctly built and applicable to excavation geometry monitoring.
Comparison of the classical and TLS approaches in determining convergence changes in salt mines also required the calculation of the effectiveness of these two approaches. The results of the analysis are presented in Table 2.

5. Conclusions

The results reported in this article are just part of the research on preserving the good condition of underground excavations at the Wieliczka Salt Mine, particularly in the museum zone, inscribed on the UNESCO World Heritage List in 1978. The research offers the following conclusions:
  • It is impossible to completely replace the traditional measurements with TLS if the same convergence monitoring method is used. The main reasons are the relatively poor repeatability and accuracy of indications from point clouds despite a high scanning resolution.
  • The differential models demonstrated that registration based on an entity’s geometry yields less accurate values, even though it is a much faster method of adjusting point clouds to a common coordinate system.
  • The differential models for the two registration methods can be used in mining engineering. The specific choice of method should hinge on the expected accuracy and degree of changes.
  • The variant selected for the investigated excavation in the Wieliczka Salt Mine, where convergence is approximately one millimeter, was point cloud registration based on common georeferencing. The observed changes were minute, similar to the results of traditional observations, which confirms the process was completed correctly and the method selection was effective.
Considering all the activities and comparisons, terrestrial laser scanning may, when combined with proper post-processing, be an absolutely viable alternative to the current monitoring methods. Therefore, the analyses demonstrate that TLS can be used to monitor convergence and surface changes.
Terrestrial laser scanning can be a real asset for mining engineering. Leaving aside the investigated problem, TLS offers better repeatability compared to traditional measurements, which significantly reduces human error. Fewer errors make TLS appropriate for surveying more complex engineering structures, like shaft reinforcement, headframes, or other excavation structures and equipment. Additionally, terrestrial laser scanning provides invaluable information for design, construction, and survey operations in places where all standards are strictly adhered to. Its another advantage is the potential to build a vast database of underground objects, refine traditional maps, or build models of underground excavations for virtual tours. The TLS advancements and integration with AI technologies could enhance future mining safety and monitoring efforts would add value. Holistic three-dimensional data are not only point measurements of the convergence of mining chambers but also 3D mapping of workings. Three-dimensional documentation of mining workings in the form of a cloud model is geometric data that completely describe the shape and dimensions of the workings. Thanks to them, it is possible to comprehensively analyze the behavior of the underground and three-dimensional prediction of access routes to individual points on the mine map. The 3D mapping of workings with TLS technology, therefore, has long-term relevance and benefits.
As a measurement technique, terrestrial laser scanning will undoubtedly grow more relevant to mining excavation geometry monitoring. The present results indicate that the technology will be used to investigate convergence and spatial changes. Additionally, in light of the rapid development of TLS and the possibilities artificial intelligence offers to such cultural heritage sites as the Wieliczka Salt Mine, it may become the primary tool for monitoring salt rock mass changes.

Author Contributions

Conceptualization, K.S. and P.G.; methodology, K.S., P.K. and P.G.; software, P.G., P.K. and K.S.; validation, P.G., P.K., K.S. and A.K.; formal analysis, P.G., P.K., K.S. and A.K.; investigation, P.G., P.K., K.S. and A.K.; resources, P.G., P.K., K.S. and A.K.; writing—original draft preparation, P.G., P.K., K.S. and A.K.; writing—review and editing, P.G., P.K., K.S. and A.K.; visualization, P.G., P.K., K.S. and A.K.; supervision, P.G. and A.K.; project administration, P.G. and A.K. All authors have read and agreed to the published version of the manuscript.

Funding

This research received no external funding.

Data Availability Statement

The raw data supporting the conclusions of this article will be made available by the authors on request.

Conflicts of Interest

The authors declare no conflicts of interest.

References

  1. Gawronek, P.; Kumosiński, W.; Kwinta, A.; Patykowski, G.; Zygmunt, M. Zastosowanie naziemnego skaningu laserowego w badaniu górniczych obiektów inżynierskich. Mies. Bezp. Pr. Ochr. Sr. Gór. 2016, 2, 14–22. (In Polish) [Google Scholar]
  2. Sălăgean, T.; Rusu, T.; Onose, D.; Farcaș, R.; Duda, B.; Sestraș, P. The use of laser scanning technology in land monitoring of mining areas. Carpathian J. Earth Environ. Sci. 2016, 11, 565–573. [Google Scholar]
  3. Kekeç, B.; Bilim, N.; Karakaya, E.; Ghiloufi, D. Applications of Terrestrial Laser Scanning (TLS) in Mining: A Review. Türk. Lidar Derg. 2021, 3, 31–38. [Google Scholar] [CrossRef]
  4. Salvini, R.; Francioni, M.; Riccucci, S.; Bonciani, F.; Callegari, I. Photogrammetry and laser scanning for analyzing slope stability and rock fall runout along the Domodossola?Iselle railway, the Italian Alps. Geomorphology 2013, 185, 110–122. [Google Scholar] [CrossRef]
  5. Zhang, J.-Y.; Li, H.-B.; Yang, X.-G.; Jiang, N.; Zhou, J.-W. Quantitative assessment of rockfall hazard in post-landslide high rock slope through terrestrial laser scanning. Bull. Eng. Geol. Environ. 2021, 80, 7315–7331. [Google Scholar] [CrossRef]
  6. Jones, E.; Beck, D. The use of three-dimensional laser scanning for deformation monitoring in underground mines. In Proceedings of the 13th AusIMM Underground Operators Conference: Paper No. 066, Gold Coast, Australia, 16–18 October 2017; pp. 267–270. [Google Scholar]
  7. Xu, J.; Wang, E.; Zhou, R. Real-time measuring and warning of surrounding rock dynamic deformation and failure in deep roadway based on machine vision method. Measurement 2020, 149, 107028. [Google Scholar] [CrossRef]
  8. Singh, S.K.; Banerjee, B.P.; Raval, S. Three-dimensional unique-identifier-based automated georeferencing and coregistration of point clouds in underground mines. Remote Sens. 2021, 13, 3145. [Google Scholar] [CrossRef]
  9. Wong, U.; Morris, A.; Lea, C.; Lee, J.; Whittaker, C.; Garney, B.; Whittaker, R. Comparative evaluation of range sensing technologies for underground void modeling. In Proceedings of the IEEE/RSJ International Conference on Intelligent Robots and Systems, San Francisco, CA, USA, 25–30 September 2011; IEEE: Piscataway, NJ, USA, 2011; pp. 3816–3823. [Google Scholar]
  10. Mukupa, W.; Roberts, G.W.; Hancock, C.M.; Al-Manasir, K. A review of the use of terrestrial laser scanning application for change detection and deformation monitoring of structures. Surv. Rev. 2017, 49, 99–116. [Google Scholar] [CrossRef]
  11. Singh, S.K.; Banerjee, B.P.; Raval, S. A review of laser scanning for geological and geotechnical applications in underground mining. Int. J. Min. Sci. Technol. 2023, 33, 133–154. [Google Scholar] [CrossRef]
  12. Matwij, W.; Gruszczyński, W.; Puniach, E.; Ćwiąkała, P. Determination of underground mining-induced displacement field using multi-temporal TLS point cloud registration. Measurement 2021, 180, 109482. [Google Scholar] [CrossRef]
  13. Wang, L.; Li, J.; Jiang, C.; Huang, J. Automatic deformation extraction method of buildings in mining areas based on TLS point clouds. IEEE Access 2021, 10, 127817–127824. [Google Scholar] [CrossRef]
  14. Szwarkowski, D.; Moskal, M. Assessment of deformations in mining areas using the Riegl VZ-400 terrestrial laser scanner. In E3S Web of Conferences; EDP Sciences: Les Ulis, France, 2018; Volume 36, p. 02009. [Google Scholar]
  15. Li, J.; Wang, L. Mining subsidence monitoring model based on BPM-EKTF and TLS and its application in building mining damage assessment. Environ. Earth Sci. 2021, 80, 396. [Google Scholar] [CrossRef]
  16. Janus, J.; Ostrogórski, P. Underground mine tunnel modelling using laser scan data in relation to manual geometry measurements. Energies 2022, 15, 2537. [Google Scholar] [CrossRef]
  17. Archives of the Survey and Geology Department of Kopalnia Soli Wieliczka SA. (In Polish)
  18. Malinowska, A.; Hejmanowski, R.; Guzy, A.; Kwinta, A.; Ulmaniec, P. The Sinkhole Occurrence Risk Mitigation in Urban Areas for the Historic Salt Mine. Int. J. Environ. Sci. Sustain. Dev. 2019, 4, 85–94. [Google Scholar] [CrossRef]
  19. Hejmanowski, R.; Malinowska, A.; Kwinta, A.; Ulmaniec, P. Rock-mass stability in salt mines—Risk factors. In 12 Geokinematischer Tag; Freiberg, Germany, 2011; pp. 296–302. [Google Scholar]
  20. Karasev, M.A.; Protosenya, A.G.; Katerov, A.M.; Petrushin, V.V. Analysis of shaft lining stress state in anhydrite-rock salt transition zone. Rud.-Geol.-Naft. Zb. 2022, 37, 151–162. [Google Scholar] [CrossRef]
  21. Rzyczniak, M.; Solecki, M.; Zeljaś, D.; Dubiel, S. The effect of pressure depression on the water inflow volume to wells which cover carbonate rocks in the Carpathian Foredeep basement, SE Poland. Rud.-Geol.-Naft. Zb. 2021, 36, 33–42. [Google Scholar] [CrossRef]
  22. Teodorescu, P.P. Treatise on Classical Elasticity. Theory and Related Problems; Springer: Dordrecht, The Netherlands, 2013; p. 802. [Google Scholar]
  23. Sadd, M.H. Elasticity: Theory, Applications, and Numerics, Chantilly; Elsevier: Amsterdam, The Netherlands, 2009; p. 533. [Google Scholar]
  24. Bieniasz, J.; Wojnar, W. Zarys historii pomiarów i wybrane wyniki obserwacji zjawiska konwergencji wyrobisk w pokładowych złożach soli. Gospod. Surowcami Miner. 2007, 23, 133–142. (In Polish) [Google Scholar]
  25. Poborska-Młynarska, K. Water disasters in salt mining worldwide—Causes, counter, measures, consequences. Prz. Gór. 2018, 6, 33–40. (In Polish) [Google Scholar]
  26. Kortas, G.; Maj, A. Circumstances and consequences of catastrophic water inflow into the Wapno salt mine. Notes to the events of August 1977. Salt Rev. 2014, 34, 101–106. (In Polish) [Google Scholar]
  27. Bieniasz, J.; Pietras, J. Wykonanie pomiarów konwergencji wyrobisk górniczych w strefie ochrony konserwatorskiej w Kopalni Soli „Wieliczka”. In Ośrodek Badawczo-Rozwojowy Górnictwa Surowców Chemicznych „CHEMKOP” Sp. Z o.o. na Zlecenie Kopalni Soli „Wieliczka”; 2020. (In Polish) [Google Scholar]
  28. Gawronek, P.; Noszczyk, T. Does more mean better? Remote-sensing data for monitoring sustainable redevelopment of a historical granary in Mydlniki, Kraków. Herit. Sci. 2023, 11, 23. [Google Scholar] [CrossRef]
Figure 1. Convergence of a cuboid.
Mining 05 00015 g001
Figure 2. Traditional convergence measurements. (a) Telescopic convergence indicator in the Michałowice Chamber of the Wieliczka Salt Mine; (b) rod convergence indicator with calipers [24].
Mining 05 00015 g002
Figure 3. Measuring linear convergence with a manual distance meter (own work based on [24]).
Mining 05 00015 g003
Figure 4. Geological draft of the part of the mine near the St Anthony Chapel [17].
Mining 05 00015 g004
Figure 5. Outcomes of scanning of the E. Barącz Chamber on level 2n in 2002 [17].
Mining 05 00015 g005
Figure 6. Fragment of the point cloud of the St Kinga Chapel collected with the Surfaizer scanner [17].
Mining 05 00015 g006
Figure 7. Fragment of the point cloud of the St Kinga Chapel collected with the Cyrax 2500 scanner [17].
Mining 05 00015 g007
Figure 8. Measurement with a Riegl pulse scanner [17].
Mining 05 00015 g008
Figure 9. Map of target positions with examples of target locations (viewed from within a point cloud) [17].
Mining 05 00015 g009
Figure 10. Location map of measurement bases H1, H2 (a) and V1 (b).
Mining 05 00015 g010
Figure 11. Visualization of the object as a differential model with cloud-to-cloud registration. Visibility range from 0 to 5 cm for 2012–2021.
Mining 05 00015 g011
Figure 12. Visualization of the object as a differential model with cloud-to-cloud registration. Visibility range from 0 to 5 cm for 2012–2022.
Mining 05 00015 g012
Figure 13. Visualization of the object as a differential model with cloud-to-cloud registration. Visibility range from 0 to 10 cm for 2012–2023.
Mining 05 00015 g013
Figure 14. Visualization of the object as a differential model with cloud-to-cloud registration. Visibility range from 0 to 5 cm for 2012–2024.
Mining 05 00015 g014
Figure 15. Visualization of the object as a differential model with cloud-to-cloud registration. Visibility range from 0 to 5 cm for 2022–2023.
Mining 05 00015 g015
Figure 16. Visualization of the object as a differential model with cloud-to-cloud registration. Visibility range from 0 to 5 cm for 2022–2024.
Mining 05 00015 g016
Table 1. Station lengths from various measurement techniques.
YearBaseClassical Measurement Length [m]TLS
Length [m]
Δd [mm]
2012H17.4447.4395
H215.49115.495−4
V12.9552.962−7
2021H17.4327.44−8
H215.48315.46320
V12.9382.92612
2022H17.4367.438−2
H215.48415.485−1
V12.9372.94−3
2023H17.4377.442−5
H215.48415.4795
V12.9342.94−6
2024H17.4367.439−3
H215.48215.486−4
V12.9362.9342
Table 2. Efficiency calculation of classical and TLS approaches in determining convergence changes in salt mines.
Traditional Convergence
Measurement
TLS Convergence
Measurement
measurement rangepunctualholistic
costlowhigh
time efficiencymeasurement—long
post-processing—fast
measurement—fast
post-processing—long
required
expertise
Highhigh
practical
usability
Averagehigh, additionally, documentation of mining excavations
Disclaimer/Publisher’s Note: The statements, opinions and data contained in all publications are solely those of the individual author(s) and contributor(s) and not of MDPI and/or the editor(s). MDPI and/or the editor(s) disclaim responsibility for any injury to people or property resulting from any ideas, methods, instructions or products referred to in the content.

