Abstract
ABAcard® HemaTrace® kits have been used for crime scene stains for confirmation of human blood for many years. However, when the stain is too small to allow for separate testing, confirmatory testing may be forgone to preference DNA analysis. This can lead to court challenges as to the biological source and therefore probative value of the DNA profile. This research aimed to develop a protocol for DNA analysis of a minute blood stain subsequent to HemaTrace® testing. Stains were collected and subjected to HemaTrace® testing. Swabs were then removed from the HemaTrace® buffer solution and processed. DNA yields and STR DNA profiles were analysed for both quantity and quality. Full profiles were reliably obtained from stains with diameters of 0.6 mm–0.7 mm, reflecting DNA concentrations between 0.0036 ng/μL and 0.007 ng/μL, varying according to substrate characteristics. However, stains below a diameter of 0.6 mm should proceed directly for DNA profiling. This protocol was also successfully performed on blood stains which had undergone UV irradiation, although use of the reporting peak height threshold (lower than the routine analytical threshold) was required to obtain useable profiles. We have been able to demonstrate a protocol which, with minor adjustments to crime scene procedures, allows for both the confirmation of the presence of human blood, together with the generation of useful DNA profiles.
1. Introduction
The discovery, subsequent testing and DNA typing of blood is vital for inferring the potential presence of a person or sequence of events at a crime scene. Currently, the standard blood collection protocols in our jurisdiction encourage suspected blood stains to undergo presumptive testing and confirmatory testing, followed by DNA analysis.
An issue encountered with confirmatory testing is that it requires a portion of the stain to be consumed. This is problematic for minute stains which may be too small to undergo both confirmatory testing and DNA profiling, resulting in the sample being submitted for DNA analysis only, thus bypassing confirmatory testing. This prevents the formation of source-level propositions in court reports which has the potential to diminish evidential value when cases proceed to trial. It is currently possible to obtain a DNA profile from trace DNA samples with as little as 6 pg/μL–30 pg/μL of DNA [1,2,3]. Under these conditions, source level attribution is very difficult, which limits the interpretation of circumstances leading to the deposition of the DNA within the context of the crime. As technological advances in laboratory operations have meant that the analysis of minute stains is now possible, it is important that field operating procedures are updated to complement these highly sensitive technologies.
Immunochromatographic cartridges are commonly employed for confirmatory testing of biological stains. They employ an antibody-antigen-antibody sandwich where the antigen is derived from the body fluid of interest (haemoglobin in blood, for example). The test device consists of a membrane with a control zone, a test zone and a sample well. An antibody raised against a specific antigen (from the body fluid of interest) is immobilised at the test zone and if the sample of interest contains the antigen of interest, an antibody-antigen compound is formed resulting in a pink line at the test site of the card [4,5,6,7,8,9]. A positive result is indicated by a developed line at the test zone and the control zone (as a result of bound labelled antibodies present at both sites) and is considered valid only if the line at the control zone is observed [4,5,6]. Many such assays are available including the Rapid Stain Identification Series [10], Hexagon OBTI Card (now Bluestar® OBTI) [11] and ABA Card® HemaTrace® for blood [12].
In 2008, DNA profiles suitable for inclusion in the UK National DNA database were extracted from the remaining buffer solution of the Hexagon OBTI immunochromatographic assay by extracting DNA from a range of blood stains across various dilutions applied to the assay using the Qiagen QIAamp DNA™ Minikit before amplifying it with the AmpFℓSTR SGMplus™ kit [13]. Samples with a dilution of 1 in 105 or greater were concentrated using YM-100 Centricon centrifugal filters. This method resulted in DNA profiles being obtained from samples from a dilution lower than the previously reported detection limit for the Hexagon assay.
Validation studies on the RSID™-Blood test in 2008 indicated that the sensitivity of the kit had been specifically adjusted in order for a positive result for the presence of human blood to be accompanied by a sufficient amount of biological material within the buffer solution to produce a forensic STR profile [14]. Unlike the HemaTrace® and Hexagon OBTI card systems which detect haemoglobin, RSID™-Blood is designed to detect traces of glycophorin A, an erythrocyte membrane antigen specific to humans.
DNA profiles suitable for uploading to the United States database were obtained from HemaTrace®, RSID™-Blood, RSID™-Saliva, and Hexagon OBTI card membranes by using Low Copy Number (LCN) DNA profiling following a storage period of up to three months in normal room temperature conditions [15]. LCN involved increasing the number of PCR amplification cycles (from 28 to 34) and applying this to replicate samples. LCN analysis is characterised by allele drop out and drop in [16] and for this reason it is not commonly used in Australia and hence was not considered for this study.
In 2013, researchers in Japan laid the stained fabric on top of the test well of the Hexagon OBTI card before applying several drops of the buffer fluid on top, allowing it to diffuse through the stain, into the card, and along the membrane towards the testing region [17]. They then performed direct PCR on the fabric itself, rather than any element of the kit. This method does not conform to the typical in-field testing method used at crime scenes in our jurisdiction and cannot be applied to stains on solid substrates such as wood. Further, there is potential for false negatives due to the “high-dose hook effect” in the event of a heavily saturated stain.
HemaTrace® assays were selected for use within our jurisdiction after in-house testing validated their sensitivity and robustness for use in field work. In 2012, unpublished internal research indicated that it was possible to obtain a forensic DNA profile from the HemaTrace® membrane by adjusting the extraction buffer immersion time prior to attempting extraction, and increasing the amount of buffer placed in the test well [18]. Further in-house studies indicated the membrane was not the most reliable source of DNA, and instead found there was greater success in extracting DNA directly from the sample collection swab, immersed in the buffer solution. (R. Driver, personal communication, 2 November 2015). Building on these in-house studies, the research described in this paper aimed to develop a protocol that utilises minute stains for both confirmatory testing and generation of a DNA profile from elements within the HemaTrace® testing kit. Experiments were designed to analyse various aspects of the protocol including establishing a stain size threshold for porous and non-porous substrates, determining the optimal swab for collection of stains from non-porous substrates, the efficacy of the protocol on degraded stains, and comparing sample loss when using the protocol compared to submitting the stain for DNA analysis without confirmatory testing. The ultimate aim was to make more efficient use of minute stains and increase their evidential value.
2. Experimental Section
2.1. Stain Deposition
Earlier in-house experiments had established that full DNA profiles could be obtained from blood stain sizes with a volume of 0.1 μL and this was used as our upper size limit. We found it difficult to consistently pipette volumes of blood smaller than 0.1 μL, therefore in order to create smaller stains we utilised four pieces of wire with diameters measuring 0.706 mm, 0.607 mm, 0.540 mm and 0.371 mm. All stain sizes were visible to the naked eye in order to replicate the minute stains that would typically be encountered in the field (Figure 1).
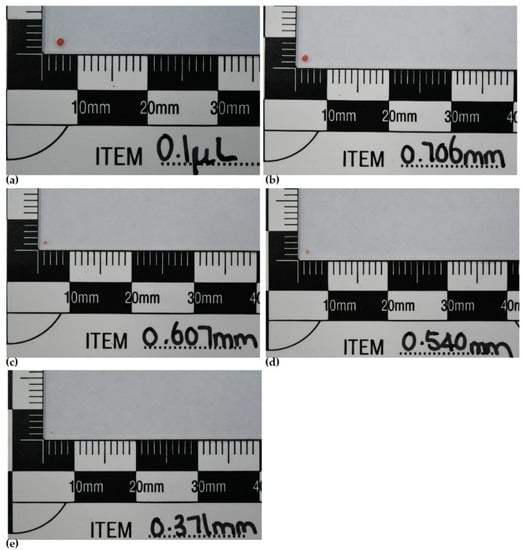
Figure 1.
Images of stain sizes (a) 0.1 μL stain, (b) stain produced with 0.706 mm wire, (c) stain produced with 0.607 mm wire, (d) stain produced with 0.540 mm wire, (e) stain produced with 0.371 mm wire.
For sample deposition, the flat end of the wire was dipped into a 30 μL aliquot of blood and “stamped” onto the relevant substrate. The end of the wire was treated with 10% bleach then 70% ethanol and allowed to dry prior to the next collection to ensure no carryover of excess blood or DNA product. This protocol was followed for every wire stain deposition.
2.2. HemaTrace® Testing
All relevant samples were collected and subjected to HemaTrace® testing (Abacus Diagnostics, Los Angeles, CA, USA) according to the protocol recommended by the manufacturer [7]. Following the appropriate incubation period, the substrate was removed from the HemaTrace® buffer solution and placed into an AutoLys tube for automated DNA analysis at the NSW Health Pathology, Forensic & Analytical Science Service (FASS). The control samples were not subjected to HemaTrace® testing and swabs were placed into AutoLys tubes immediately following stain collection.
2.3. Substrate Treatment
To ensure the substrates used in the study were DNA-free, the following treatment was applied unless stated otherwise; wiping with 10% bleach, followed by 70% ethanol before being exposed to UV treatment for 40 min using a Sanyo Denki® 254 nm UV-C G30T8 30W light bulb (Sanyo Denki, Torrance, CA, USA) in a laminar flow hood.
2.4. Sensitivity Testing
To establish a stain size threshold for the collection and analysis of stains on non-porous surfaces the following process was employed. Glass microscope slides (Livingstone International, Mascot, NSW, Australia) were rendered DNA free as previously described. Ten replicate bloodstains of five sizes (0.1 μL, 0.706 mm, 0.607 mm, 0.540 mm and 0.371 mm) were deposited onto the treated microscope slides and left to dry before being collected by swabbing the stains (n = 50). A single swab method was utilised whereby a small aliquot of sterile water was deposited on one side of the swab. The wet side of the swab was then rubbed against the stain to collect it. The swab was then rotated, and the dryer side of the swab was used to finish the collection. This method of swabbing was used for the collection of all swabbed stains.
2.5. Effect of Substrate
This experiment was designed to determine the impact of substrate on the sensitivity threshold established in the sensitivity study. The substrates selected are frequently encountered at crime scenes: two types of fabric (cotton and elastane), and one wooden substrate (H4 chemically treated pine, commonly found at outdoor crime scenes).
Fabric was placed into boiling water for 30 min, before being air dried and exposed to UV light for 40 min using a Sanyo Denki® 254 nm UV-C G30T8 30W light bulb (Sanyo Denki, Torrance, CA, USA) in a laminar flow hood. The fabric was cut into squares measuring approximately 5 mm × 5 mm prior to stain placement, thereby negating the need for excision of the stain.
The wood was scrubbed using a household detergent followed by the bleach, ethanol and UV treatment as described above.
Ten replicate bloodstains of two different diameters (0.706 mm and 0.607 mm) were deposited onto the substrates and left to dry. Stains on the wood substrate were collected by swabbing, while the swatches were placed whole in the HemaTrace® buffer (Abacus Diagnostics, Los Angeles, CA, USA) and remained whole for subsequent analyses (n = 20, for each substrate).
2.6. Swab Comparison
This experiment tested the hypothesis that the ethylene oxide (EO) treated rayon Dryswabs™ (Medical Wire & Equipment, Corsham, UK) used by the New South Wales (NSW) Police Force and FASS for most protocols might be equally as suitable as the cotton swabs provided with the Abacus ABAcard® HemaTrace® (Abacus Diagnostics, Los Angeles, CA, USA) “Crime Scene Kits”.
Three replicate bloodstains of three diameters (0.1 μL, 0.706 mm and 0.607 mm) were deposited onto DNA free microscope slides and left to dry before being collected with the two different swab types (n = 18).
2.7. DNA Loss Due to HemaTrace® Analysis
The DNA obtained from samples collected and sent directly for DNA analysis (i.e., control samples) was compared with the quantity obtained from samples that underwent HemaTrace® treatment prior to DNA extraction.
For each variable, three replicate bloodstains of three diameters (0.1 μL, 0.706 mm and 0.607 mm) were deposited onto UV treated microscope slides (Sail Brand, Shanghai, China) and left to dry before collection (n = 36).
2.8. Effect of UV Irradiation
This study investigated the effectiveness of the HemaTrace® protocol on stains which had been exposed to UV irradiation. The intention was to mimic crime scene stains which had been aged or weathered by sunlight.
Ten replicate bloodstains of two diameters (0.706 mm and 0.607 mm) were deposited onto treated microscope slides and left to dry before being exposed to UV light, 13 cm away from a Sanyo Denki 254 nm UV-C G30T8 30W light bulb in a laminar flow hood for periods of 15, 30 and 45 min prior to collection (n = 60).
2.9. DNA Analysis
2.9.1. DNA Extraction
Lysis of samples was completed using the MicroLab® AutoLys STAR robotic workstation (Hamilton Company, Reno, NV, USA), using the lysis buffer provided with the Applied Biosystems™ PrepFiler® Automated Forensic DNA Extraction Kit (Thermo Fisher Scientific, Waltham, MA, USA). Following lysis, DNA extraction (purification) was completed using the remaining components of the PrepFiler® Automated Forensic DNA Extraction Kit according to the manufacturer’s recommended protocol [19]. This kit utilises magnetic particle-based chemistry to capture and purify DNA and was completed on the Freedom EVO® 150 robotic workstation (Tecan Australia, Port Melbourne, VIC, Australia).
The DNA extracts were quantified using the Applied Biosystems Quantifiler® Trio DNA Quantification Kit (Thermo Fisher Scientific, Waltham, MA, USA) according to the manufacturer’s recommended protocol. PCR set up was also performed on a Freedom EVO® 150 workstation (Tecan Australia, AUS). Real time PCR was undertaken using an Applied Biosystems 7500 Real Time PCR instrument (Thermo Fisher Scientific, Waltham, MA, USA) according to the manufacturer’s recommended protocol [20].
2.9.2. DNA Amplification and Capillary Electrophoresis
A subset of samples from each experiment was selected for amplification and genotyping. To obtain a representative range of samples, the samples were selected based on the DNA quantity, from a range of quantification values, to observe DNA profile quality across a range of DNA quantities.
Using a Freedom EVO® 150 workstation (Tecan Austraila, Port Melbourne, VIC, Australia), the PowerPlex® 21 Amplification System (Promega Corporation, Madison, WI, USA) was employed according to the manufacturer’s recommended protocol [21], with the exception that 29 cycles and a template input of 0.7 ng, rather than the manufacturer recommendation of 30 cycles and 0.5 ng input, was used. Amplification was performed in a GeneAmp® PCR System 9700 Thermal Cycler (Thermo Fisher Scientific, Waltham, MA, USA) using the following protocol: initial PCR activation for 1 min at 96 °C; 29 cycles of denaturation for 10 s at 94 °C, annealing for 1 min at 59 °C and extension for 30 s at 72 °C; and a final extension of 10 min at 60 °C [22].
The amplified product was prepared for capillary electrophoresis using a Freedom EVO® 150 workstation (Tecan Australia, Port Melbourne, VIC, Australia). The manufacturer’s protocol [21] was followed with the exception that for automated set up, double the reaction volume was used, with 2 μL of amplified product and 0.75 μL of internal lane standard per sample. Capillary electrophoresis was performed on an Applied Biosystems 3500xL Genetic Analyzer (Thermo Fisher Scientific, Waltham, MA, USA).
2.9.3. Genotyping
Profiles were analysed using Applied Biosystems™ Gene Mapper® ID-X Software using either version 1.5 or 1.6 (Thermo Fisher Scientific, Waltham, MA, USA) with: peak height ratio minimum threshold of 0.60; homozygous peak height threshold of 700 relative fluorescence units (RFU); and heterozygous peak analysis threshold of 175 RFU (in the first instance). Following initial analysis, if it appeared there may be further data below this threshold, the profiles were reanalysed at the validated FASS reporting threshold of 80 RFU.
Profiles were determined to be suitable if they were deemed “uploadable” profiles. In our jurisdiction “uploadable results” are defined as profiles containing greater than or equal to 12 reportable alleles, the threshold to be uploaded to our DNA database.
3. Results
3.1. Sensitivity
Determining the sensitivity of the method was a two-step process. First, we compared the relationship between DNA quantity and “uploadable results” to determine the minimum DNA concentration to consistently produce useable profiles. This minimum concentration was equated with a minimum stain size. This not only assisted in determining a threshold, but also made it easier to translate these findings into useful information for crime scene examiners who will be visually assessing stains for size suitability.
Full profiles were reliably obtained from samples down to 0.005 ng/μL of DNA, representing a DNA template input of 0.075 ng per PCR. Samples with this concentration also consistently exceeded the peak height threshold of 175 RFU for heterozygote alleles and 700 RFU for homozygote allele designation.
When comparing this DNA concentration to stain sizes, Figure 2 shows that stains of 0.1 μL and those produced using the 0.706 mm wire exceeded the 0.005 ng/μL threshold. Stains of this size also consistently resulted in full profiles (42 reportable alleles), while those produced with the smaller wire sizes had inconsistent numbers of reportable alleles.
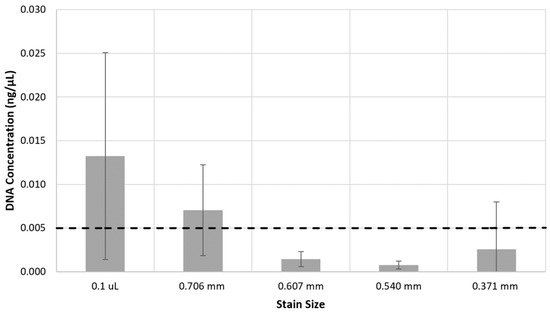
Figure 2.
Stain size versus DNA concentration across ten replicates. The dashed line represents the 0.005 ng/μL concentration threshold observed to produce full STR profiles in this dataset. Error bars represent standard deviations.
3.2. Effect of Substrate
Table 1 provides a summary of the recommended stain threshold sizes for each substrate.

Table 1.
Summary of all threshold DNA concentrations to obtain a useful DNA profile, with accompanying PCR template DNA volumes and stain size equivalencies.
All cotton samples selected for amplification provided full profiles. The lowest DNA concentration was 0.0036 ng/μL, representing a DNA template input of 0.054 ng.
Both stain sizes of 0.706 mm and 0.607 mm for cotton exceeded the requirements for a useable profile, and resulted in full profiles.
Uploadable profiles were often (but not always) obtained from elastane samples with a DNA concentration of 0.005 ng/μL or more, representing a DNA template input of 0.075 ng. Samples with this concentration also consistently exceeded the required peak height thresholds. Stains from the 0.607 mm diameter wire had a larger variation in peak heights between samples, with some exceeding the usable profile thresholds, and others failing to pass all thresholds. However, the stains produced with the 0.706 mm diameter wire resulted in more consistent profiles with less variation in peak heights (Figure 3).
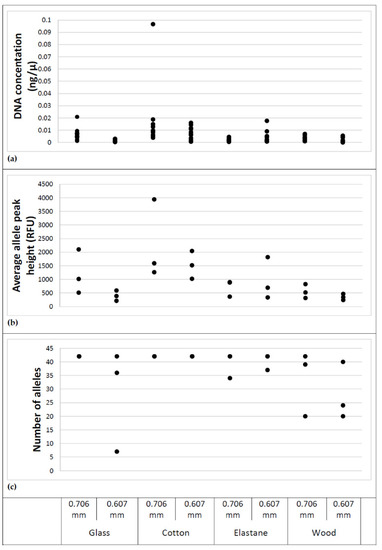
Figure 3.
Comparison of; (a) DNA concentration, (b) average allele peak height and (c) number of reportable alleles for stain sizes and substrate.
A full profile was obtained from only one wood sample which had a DNA concentration of 0.007 ng/μL (0.105 ng of DNA template), with peak heights from samples below 0.007 ng/μL consistently falling below the 700 RFU threshold for homozygote designation. On average, neither stain size resulted in a concentration consistently above 0.007 ng/μL, however the stains produced by the 0.706 mm diameter wire had a higher average concentration, and the only full profile came from a stain produced with the 0.706 mm wire. Stains from the 0.706 mm wire also generated profiles which more frequently exceeded the 700 RFU homozygote threshold. These results indicate that for unsealed wooden (semi-porous) substrates, stains produced with the 0.607 mm diameter wire are an appropriate minimum size threshold for useable profiles. Figure 3 provides a comparison between each substrate and stain sizes, detailing the differences in peak height and allele count for each.
3.3. Swab Comparison
A comparison of DNA concentrations yielded from both HemaTrace® and EO treated rayon Dryswab™ swabs is shown in Figure 4.
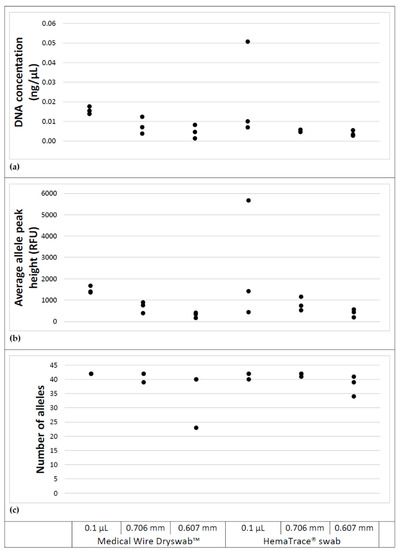
Figure 4.
Comparison of; (a) DNA concentration, (b) average allele peak height and (c) number of reportable alleles for stain sizes and swab type.
Analysis using a two-way ANOVA shows the differences in the DNA yield between the two swabs across all three stain sizes were not statistically significant (p = 0.70).
Both swab types performed comparatively with respect to profile completeness, recovering similar numbers of alleles, meeting the requirement for uploadable profiles for all stain sizes.
3.4. DNA Loss Due to HemaTrace® Analysis
Figure 5 provides a comparison between DNA recovered from blood stains not subject to HemaTrace® and blood stains processed using the HemaTrace® protocol.
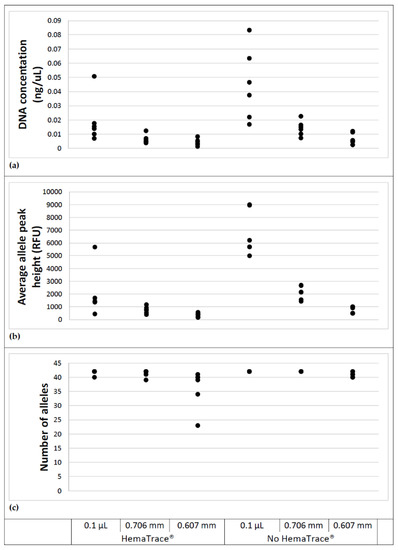
Figure 5.
Comparison of; (a) DNA concentration, (b) average allele peak height and (c) number of reportable alleles (bottom) for stain sizes and whether or not HemaTrace® processing occurred prior to DNA analysis.
For stains of 0.1 μL and those produced using the 0.706 mm wire, there is a noticeable drop in DNA concentration for samples subject to HemaTrace®. A Shapiro–Wilk test showed that the DNA concentration data were not normally distributed for the case of HemaTrace® applied to 0.1 µL stains (p = 0.012). A Kruskal–Wallis test revealed significant differences between treatments (p = 0.019) and amongst stain sizes (p < 0.001). The data were log transformed and a subsequent Shapiro–Wilk test demonstrated a normal distribution for all cases. An ANOVA was applied to the log transformed data which demonstrated there was no significant interaction between treatment (HemaTrace® or not) and stain size (p = 0.605). It also indicated significant differences between treatments (p < 0.001) and amongst stain sizes (p < 0.001), supporting the Kruskal–Wallis test on untransformed data.
Similarly, there is a loss in peak height for samples subject to HemaTrace®. A Shapiro–Wilk test showed that the peak height data were not normally distributed for the case of HemaTrace® applied to 0.1 µL stains (p = 0.006) and no HemaTrace® applied to 0.607 mm stains (p = 0.027). Log transformation did not normalise the data for the case of no HemaTrace® applied to 0.607 mm stains (p = 0.023). A Kruskal–Wallis test demonstrated significant differences between treatments (p = 0.019) and amongst stain sizes (p < 0.001). These results support those obtained for the DNA concentration data, with uploadable profiles obtained for all samples regardless of whether the sampled underwent HemaTrace® processing.
3.5. Effect of UV Irradiation
None of the UV irradiated samples exceeded the 0.005 ng/μL concentration threshold observed in the sensitivity study to produce useable STR profiles. Larger stains contained a higher average concentration of DNA, as expected. Stains produced with the 0.607 mm diameter wire and degraded for 45 min, yielded no DNA.
When analysed using the standard analysis threshold of 175 RFU, only one sample exceeded the minimum requirement of 12 reportable alleles. After reanalysing the profiles using the lower reporting threshold of 80 RFU, the number of uploadable profiles increased to five samples, ranging in concentration from 0.0005 ng/μL to 0.0017 ng/μL. Table 2 provides a comparison of samples which provided uploadable profiles following reanalysis at 80 RFU.
Table 2.
Reportable alleles for the samples exposed to UV irradiation analysed with 175 RFU and 80 RFU thresholds.
4. Discussion
4.1. Sensitivity
Our results demonstrate the feasibility of obtaining reportable DNA profiles from swabs of minute blood stains that have been subjected to HemaTrace® analysis. Consistently high numbers of reportable alleles were obtained down to 0.005 ng/μL of DNA, or 0.075 ng of template DNA per PCR reaction, with allele peak heights exceeding the laboratory RFU thresholds at this concentration. This concentration of 0.005 ng/μL was consistently observed in blood stains from 0.1 μL blood volumes and those produced with the 0.706 mm diameter wires.
Conversely, stains from smaller wires resulted in partial, yet still often uploadable, STR profiles. In some samples, concentrations down to 0.0007 ng/μL resulted in partial profiles of 29 alleles or more, however at this concentration homozygous alleles were observed to fail the 700 RFU threshold required for homozygous designation and were thus only counted as one allele.
4.2. Effect of Substrate
Our analysis of the effect of substrate on DNA recovery aligns with previous research which found that substrates (such as calico, flannelette and cotton) soaked in the HemaTrace® buffer yielded a higher quantity of DNA than surfaces which required swabbing to collect the blood first (such as wood or plastic), concluding that swabbing introduced another process through which DNA could be lost or left behind [23].
The differences observed between our cotton and elastane sensitivity threshold concentrations may be explained by earlier research which observed that a looser weave fabric, such as cotton, may absorb and then subsequently release a greater amount of DNA into its surrounding solution when compared to a tighter weave, such as elastane [24].
While the higher blood stain volume required for amplification of samples collected from wood may be explained by the mechanism of swabbing and the loss of cells into a porous and uneven substrate surface, this mechanism does not explain the higher DNA concentration required in order to obtain full profiles from the wood substrate samples. It is possible that the wood substrate may be causing PCR inhibition. Compounds within wood, such as phenolic compounds of the lignin metabolite, can inhibit PCR [25,26]. Additionally, chemicals used in the treatment of our specific wood substrate are known inhibitors. H4 treated timber undergoes chemical treatment which allows it to be resistant to decay and termites, making it suitable for use outside and in-ground. This treatment process involves exposure to three types of preservatives; alkaline copper quaternary (ACQ), copper azole (CA) and copper chrome and arsenic (CCA) [27]. A key element in each of these treatment types is copper, a metal ion which has been found to cause inhibition in the PCR process [28,29], along with arsenic which has also been shown to potentially inhibit the efficacy of PCR [30]. However, none of the profiles from the wood samples displayed signs of inhibition, and successful amplification of the internal PCR control (IPC) in each qPCR performed on the substrate samples indicated that no wood substrate sample from this investigation experienced inhibition. A similar effect was observed in a study seeking to recover trace DNA from fired cartridge cases (ammunition). DNA recovery was far less from fired cartridge cases which were brass (containing copper), than from those that were nickel, in spite of the absence of any inhibition as indicated by the IPC [31].
There was much greater variation in allele peak heights between loci for wood than for cotton. This may indicate that the DNA collected from wood is more degraded, although the mechanism of this degradation is unknown (it may be facilitated by copper). This is supported by degradation index values for samples collected from the wood substrate frequently nearing or exceeding a value of 1.0, which indicates slight to moderate DNA degradation (data not shown) [20].
The requirement for a larger volume of blood stain for a useable profile should be kept in mind when processing stains which have been collected from wood samples treated with chemicals, particularly those which enable the preservation of these timbers in outdoor environments.
4.3. DNA Loss Due to HemaTrace® Analysis
The DNA loss (in terms of both quantity and peak heights) from HemaTrace® analysis is not entirely surprising. It is expected that when a substrate containing a sample undergoes more processes and tube transfers, the DNA remaining in the substrate will be reduced. This loss can be attributed to the time spent in the HemaTrace® buffer and is supported by our in-house experiment results which indicate that the buffer does contain some DNA post incubation. It is because of these losses that this protocol has a recommended stain size sensitivity of approximately 0.7 mm, with any stain size below this being sent straight for DNA analysis to maximise the potential for a useable DNA profile.
4.4. Effect of UV Irradiation
Blood stains deposited in outdoor environments and exposed to UV irradiation will result in fewer useable DNA profiles after HemaTrace® processing but our results demonstrate that it is possible to develop a partial profile from DNA quantities as low as 0.0005 ng/μL using the lower reporting threshold (80 RFU). However, with little data available as to the concentration of DNA found in stains which have undergone natural degradation, rather than artificial degradation, such as in our study, it is difficult to determine at what level of exposure this protocol will cease to become suitable for use. Given that the lamp used in this investigation is intended for germicidal treatment of a laminar flow hood using UV-C rays [32], it is likely that it degrades DNA more than might occur in sunlight, which primarily consists of lower energy UV-A or UV-B rays [33].
Additional research (data not shown) indicated that swabs/swatches containing 1 µL blood stains may be able to be stored in the HemaTrace® buffer solution for an extended period of time (up to 3 months) and still elicit an uploadable profile. It would be beneficial for further studies to be undertaken to replicate these storage studies with varying stain sizes more in line with those used in the sensitivity testing. Similarly, other in-house experiments (data not shown) indicated that this method has potential to be used on diluted blood (up to 1:300 dilution factor), and from alternative substrates such as concrete or tiles, however, further studies are required to accurately determine thresholds.
5. Conclusions
This study investigated factors impacting on DNA recovery from swabs and swatches which had first been subjected to HemaTrace® testing to confirm the presence of human blood, with a particular focus on minute stains which might otherwise not be subjected to confirmatory testing. The best results were obtained from swabs when DNA concentrations were above 0.005 ng/μL for stains that were collected from non-porous surfaces such as glass. This is equivalent to 0.075 ng (or 75 pg) of template DNA in the PCR, and corresponds to a stain size threshold of approximately 0.7 mm. The substrate from which the stain was collected impacted the recoverability of the sample; cotton fabric was found to have a stain size threshold of 0.6 mm for successful DNA recovery, and elastane 0.7 mm. Samples from wood resulted in partial profiles at a 0.7 mm stain size, with larger stain sizes recommended to achieve full profiles from this substrate.
Stains produced using the 0.607 mm wire resulted in partial profiles from glass, elastane and wooden substrates and would still be useful in casework for exclusionary purposes. Stains smaller than this should be collected and sent for DNA analysis without confirmatory testing as results indicate that DNA loss is suffered when stains of this size are subjected to HemaTrace® testing prior to DNA analysis.
There was no statistically significant difference in DNA recovery between cotton or rayon swabs when collecting stains from non-porous surfaces. However, in-house testing is recommended for other swabs if they differ from those used in the present study.
Analysis of the stains with an 80 RFU peak height threshold for capillary electrophoresis resulted in partial profiles from degraded stains with as little as 0.001 ng/μL of DNA (equivalent to 0.015 ng (or 15 pg) of template DNA in the PCR).
With respect to processing exhibits or scenes for the presence of blood, general protocols suggest that any search should proceed in a sequence from least destructive to most destructive. This should ideally include the use of white light and UV/415nm light searching, followed by presumptive and confirmatory testing. It is anticipated that stains the size of those used in this study would likely preclude presumptive testing due to the risk of their consumption (e.g., Hemastix® or orthotolidine), or dilution of the stain due to the application of additional chemical mixtures (e.g., luminol). The use of a non-destructive presumptive test (such as light sources) prior to HemaTrace® testing would provide a useful indicator of the presence of blood without risking the integrity of the sample.
In instances where caseworkers encounter minute blood stains and where the source level link between a confirmed blood sample and a DNA profile is imperative in case reporting, the authors further recommend:
- A preference to bypass presumptive testing which may result in the consumption of part of the stain.
- Consideration of stain size and whether it is suitable for HemaTrace® testing prior to DNA analysis, noting that the swatch or swab used for the collection and subsequent HemaTrace® testing of the blood stain can later be used to develop a DNA profile for stains of 0.6 mm–0.7 mm or greater.
- Consideration of substrate type, recognizing that non-porous substrates require a larger stain size (greater than 0.7mm) to achieve a useable DNA profile using this technique.
- Consideration of other inhibitory factors of the substrate itself.
Author Contributions
Conceptualization, L.W. and D.M.; Data curation, L.W. and D.M.; Formal analysis, L.W. and D.M.; Funding acquisition, C.H. and J.R.; Investigation, L.W.; Methodology, L.W., C.H., D.M. and J.R.; Project administration, D.M.; Resources, C.H. and J.R.; Software, C.H. and D.M.; Supervision, C.H., D.M. and J.R.; Validation, L.W.; Visualization, L.W.; Writing—original draft, L.W.; Writing—review and editing, C.H., D.M. and J.R. All authors have read and agreed to the published version of the manuscript.
Funding
This research was funded by the NSW Police Force and in-kind support was provided by the NSW Health Pathology, Forensic & Analytical Science Service.
Institutional Review Board Statement
The study was conducted according to the guidelines of the Declaration of Helsinki, and approved by the Institutional Ethics Committee of University of Technology Sydney (UTS HREC approval # ETH18-2232 and 2018).
Informed Consent Statement
Informed consent was obtained from all subjects involved in the study.
Data Availability Statement
The data presented in this study are available on request from the corresponding author. The data are not publicly available due to restrictions.
Acknowledgments
Acknowledgements are given to Peter Gunn for the support provided in establishing the initial project prior to his retirement. Acknowledgements are also given to Renee Driver, Edie Lee Wilkinson and Catherine Evans for their earlier work in this research area.
Conflicts of Interest
The authors declare no conflict of interest.
References
- Mapes, A.A.; Kloosterman, A.D.; van Marion, V.; de Poot, C.J. Knowledge on DNA Success Rates to Optimize the DNA Analysis Process: From Crime Scene to Laboratory. J. Forensic Sci. 2016, 61, 1055–1061. [Google Scholar] [CrossRef] [PubMed]
- Daly, D.J.; Murphy, C.; McDermott, S.D. The transfer of touch DNA from hands to glass, fabric and wood. Forensic Sci. Int. Genet. 2012, 6, 41–46. [Google Scholar] [CrossRef] [PubMed]
- van Oorschot, R.A.; Szkuta, B.; Meakin, G.E.; Kokshoorn, B.; Goray, M. DNA transfer in forensic science: A review. Forensic Sci. Int. Genet. 2019, 38, 140–166. [Google Scholar] [CrossRef] [PubMed]
- Old, J.B.; Schweers, B.A.; Boonlayangoor, P.W.; Reich, K.A. Developmental validation of RSID™-saliva: A lateral flow immunochromatographic strip test for the forensic detection of saliva. J. Forensic Sci. 2009, 54, 866–873. [Google Scholar] [CrossRef] [PubMed]
- Old, J.; Schweers, B.A.; Boonlayangoor, P.W.; Fischer, B.; Miller, K.W.; Reich, K. Developmental validation of RSID™-Semen: A lateral flow immunochromatographic strip test for the forensic detection of human semen. J. Forensic Sci. 2012, 57, 489–499. [Google Scholar] [CrossRef] [PubMed]
- Casey, D.G.; Price, J. The sensitivity and specificity of the RSID™-saliva kit for the detection of human salivary amylase in the Forensic Science Laboratory, Dublin, Ireland. Forensic Sci. Int. 2010, 194, 67–71. [Google Scholar] [CrossRef] [PubMed]
- Abacus Diagnostics Inc. ABAcard® HemaTrace® For The Forensic Identification of Human Blood at Crime Scenes-Technical Information Sheet; Abacus Diagnostics Inc.: Canoga Park, CA, USA, 2001. [Google Scholar]
- Reynolds, M. A Confirmatory Identification of Human Blood Located at Crime Scenes. Int. Assoc. Bloodstain Pattern Anal. Newsl. 2004, 20, 4–10. [Google Scholar]
- An, J.-H.; Shin, K.-J.; Yang, W.-I.; Lee, H.-Y. Body fluid identification in forensics. BMB Rep. 2012, 45, 545–553. [Google Scholar] [CrossRef] [PubMed]
- Independent Forensics. RSID™. Available online: https://ifi-test.com/rsid/ (accessed on 31 May 2021).
- Bluestar Forensic. OBTI®. Available online: https://www.bluestar-forensic.com/products/bluestar-obti/ (accessed on 31 May 2021).
- Abacus Diagnostics. Abacus Diagnostics, Dramatically Improving Crime Scene Investigation, HemaTrace. Available online: https://www.abacusdiagnostics.com/hematrace.htm (accessed on 31 May 2021).
- Johnston, E.; Ames, C.E.; Dagnall, K.E.; Foster, J.; Daniel, B.E. Comparison of presumptive blood test kits including hexagon OBTI. J. Forensic. Sci. 2008, 53, 687–689. [Google Scholar] [CrossRef] [PubMed]
- Turrina, S.; Filippini, G.; Atzei, R.; Zaglia, E.; De Leo, D. Validation studies of rapid stain identification-blood (RSID-blood) kit in forensic caseworks. Forensic Sci. Int. Genet. Suppl. Ser. 2008, 1, 74–75. [Google Scholar] [CrossRef]
- Ho, T.T.; Roy, R. Generating DNA profiles from immunochromatographic cards using LCN methodology. Forensic Sci. Int. Genet 2011, 5, 210–215. [Google Scholar] [CrossRef] [PubMed]
- Gill, P.; Whitaker, J.; Flaxman, C.; Brown, N.; Buckleton, J. An investigation of the rigor of interpretation rules for STRs derived from less than 100 pg of DNA. Forensic Sci. Int. 2000, 112, 17–40. [Google Scholar] [CrossRef]
- Uchigasaki, S.; Tie, J.; Isahai, I.; Iwakami, E.; Isobe, E. Direct PCR Amplification of STR Loci Using Samples That Have Undergone Human Hemoglobin Identification Test. Int. Med. J. 2013, 20, 226–228. [Google Scholar]
- Williams, R.; McManus, K.; Bruce, D. Potential Use of ABAcard HemaTrace Test Kits for Downstream Forensic DNA Analysis. In 21st International Symposium on the Forensic Sciences: ‘Convicts to Criminalistics: Past, Present and Future’; Australian and New Zealand Forensic Science Society (ANZFSS): Hobart, TAS, Australia, 2012. [Google Scholar]
- Applied Biosystems. PrepFiler® Automated Forensic DNA Extraction Kit; Life Technologies: Carlsbad, CA, USA, 2011. [Google Scholar]
- Applied Biosystems. Quantifiler™ HP and Trio DNA Quantification Kits; Thermo Fisher Scientific Inc.: Waltham, MA, USA, 2017; Available online: http://tools.thermofisher.com/content/sfs/manuals/4485354.pdf (accessed on 27 September 2021).
- Promega. Technical Manual, PowerPlex® 21 System for Use on the Applied Biosystems® Genetic Analyzers; Promega: Madison, WI, USA, 2017. [Google Scholar]
- NSW Health Pathology, Forensic & Analytical Science Service. Automated PowerPlex® 21 Amplification Set Up Protocol; NSW Health Pathology, Forensic & Analytical Science Service: Lidcombe, NSW, Australia, 2018. [Google Scholar]
- Verdon, T.J.; Mitchell, R.J.; van Oorschot, R.A.H. The influence of substrate on DNA transfer and extraction efficiency. Forensic Sci. Int. Genet. 2013, 7, 167–175. [Google Scholar] [CrossRef] [PubMed]
- Bruijns, B.B.; Tiggelaar, R.M.; Gardeniers, H. The Extraction and Recovery Efficiency of Pure DNA for Different Types of Swabs. J. Forensic Sci. 2018, 63, 1492–1499. [Google Scholar] [CrossRef] [PubMed]
- Deguilloux, M.; Pemonge, M.; Petit, R. Novel perspectives in wood certification and forensics: Dry wood as a source of DNA. Proc. R. Soc. Lond. B Biol. Sci. 2002, 269, 1039–1046. [Google Scholar] [CrossRef] [PubMed]
- Kües, U. Wood Production, Wood Technology, and Biotechnological Impacts; Universitätsverlag Göttingen: Göttingen, Germany, 2008. [Google Scholar]
- NSW Environment Protection Authority (EPA). Hazard Level and Treatment Types Chart. Available online: https://www.epa.nsw.gov.au/-/media/epa/corporate-site/resources/household-building-and-renovation/treated-timber-chart.pdf (accessed on 24 January 2019).
- Combs, L.G.; Warren, J.E.; Huynh, V.; Castaneda, J.; Golden, T.D.; Roby, R.K. The effects of metal ion PCR inhibitors on results obtained with the Quantifiler® Human DNA Quantification Kit. Forensic Sci. Int. Genet. 2015, 19, 180–189. [Google Scholar] [CrossRef] [PubMed]
- Moreno, L.I.; McCord, B.R. Understanding metal inhibition: The effect of copper (Cu2+) on DNA containing samples. Forensic Chem. 2017, 4, 89–95. [Google Scholar] [CrossRef]
- Töpfer, T.; Gamauf, A.; Haring, E. Utility of arsenic-treated bird skins for DNA extraction. BMC Res. Notes 2011, 4, 197. [Google Scholar] [CrossRef] [PubMed][Green Version]
- Prasad, E.; Barash, M.; Hitchcock, C.; van Oorschot, R.A.; Raymond, J.; McNevin, D.; Gunn, P. Evaluation of soaking to recover trace DNA from fired cartridge cases. Aust. J. Forensic Sci. 2020, 53, 1–11. [Google Scholar]
- Sankyo Denki. UV-C LAMPS. Available online: https://www.sankyo-denki.co.jp/en-uv-c-lamps (accessed on 24 January 2019).
- Center for Devices and Radiological Health. Tanning—Ultraviolet (UV) Radiation. Available online: https://www.fda.gov/radiation-emittingproducts/radiationemittingproductsandprocedures/tanning/ucm116425.htm (accessed on 24 January 2019).


Publisher’s Note: MDPI stays neutral with regard to jurisdictional claims in published maps and institutional affiliations. |
© 2021 by the authors. Licensee MDPI, Basel, Switzerland. This article is an open access article distributed under the terms and conditions of the Creative Commons Attribution (CC BY) license (https://creativecommons.org/licenses/by/4.0/).