Article

Novel Portable Device for Post Mortem Interval Estimation Using Vitreous Humor Analysis

by
Louise Lijcklama à Nijeholt
1,2,3,*,†,
Michael Fleermann
3,†,
Micky Breukers
3,
Jaap Knotter
1,2,
Steven Staal
4 and
Brigitte Bruijns
1,2,5
1
Technologies for Criminal Investigations, Saxion University of Applied Sciences, M.H. Tromplaan 28, 7513 AB Enschede, The Netherlands
2
Police Academy, Arnhemseweg 348, 7334 AC Apeldoorn, The Netherlands
3
Faculty Life Science Engineering and Design (LED), Saxion University of Applied Sciences, M.H. Tromplaan 28, 7513 AB Enschede, The Netherlands
4
Fisic BV, High Tech Factory, De Veldmaat 17, 7522 NM Enschede, The Netherlands
5
CLHC, Amsterdam Center for Forensic Science and Medicine, University of Amsterdam, 1090 GD Amsterdam, The Netherlands
*
Author to whom correspondence should be addressed.
These authors contributed equally to this work.
Forensic Sci. 2025, 5(2), 18; https://doi.org/10.3390/forensicsci5020018
Submission received: 29 October 2024 / Revised: 20 February 2025 / Accepted: 13 March 2025 / Published: 23 April 2025

Abstract

:
Background: Accurately determining the post mortem interval (PMI) is critical in forensic investigations to reconstruct the sequence of events leading up to and following death. Traditional methods (e.g., observing livor mortis, rigor mortis, and using temperature-based models) have limitations due to their empirical nature and susceptibility to environmental variables. The objective of this study was to assess the potential of a novel portable device, the Fisic Medimate™ system, for estimating PMI through the analysis of the potassium/sodium (K+/Na+) ratio in vitreous humor. Method: Vitreous humor samples were collected from pigs at various intervals up to 44.5 hours post-mortem. These samples were analyzed using the Fisic Medimate™ system to determine the K+/Na+ ratio. The analysis was conducted at different time points to establish a relationship between the K+/Na+ ratio and PMI. Results: The results indicated a log-linear relationship between the K+/Na+ ratio and PMI for periods up to 31 hours, with normal residuals. This relationship was observed across all samples, suggesting that the method provides reliable and consistent data. Conclusions: This method offers a rapid and portable solution for PMI determination, providing valuable data within minutes directly at the crime scene. While these findings suggest potential for on-site forensic applications, further validation under real-world conditions is required to confirm its broader applicability.

1. Introduction

Precise estimation of the time since death, or the post mortem interval (PMI), continues to be challenging in forensic investigations. Estimating the PMI is crucial for forensic scientists, as a precise PMI can offer significant insights into the circumstances of death and aids in reconstructing timelines, which further facilitate the identification process [1].
Various methodologies exist for estimating the PMI. Current methods include the observation of livor mortis, rigor mortis and applying a temperature-based nomogram (e.g., Henssge’s nomogram) [2,3,4]. Post mortem lividity becomes visible about 20–30 min after death. Lividity can give information regarding the position of the body post mortem, therefore giving insight into the circumstances surrounding the death [2,4]. Rigor mortis starts 2–4 h after death and develops fully by 6–12 h [5]. Both livor and rigor mortis are a subjective description of post mortem changes. The use of these methods is based on subjective empirical estimation rather than on statistically evaluated refence values [4]. Moreover, they are influenced by, among other factors, body weight, clothing, the temperature of the environment, medication and humidity [6]. Another widely used temperature-based method is the use of Henssge’s nomogram [7,8,9]. Henssge’s nomogram remains a cornerstone in the estimation of the PMI during the initial 24–36 h after death, a critical period that overlaps with the timeframe examined in this study. The method operates on the principle that rectal temperature decreases in a predictable manner towards ambient temperature, provided external factors such as extreme heat are not in play [7]. However, its applicability is not universal; conditions like direct sunlight or cases of hyperthermia can significantly alter the cooling process [6]. Furthermore, variables such as environmental temperature, humidity, clothing and body size also modulate the rate of post mortem cooling [10]. Although Henssge’s approach is widely recognized, the inherent variability in these influencing factors can result in broad PMI estimates. This variability underscores the need for complementary or alternative methods that can address the limitations of existing models and provide greater precision in forensic investigations. Overall, the current methods used for estimating PMI yield large post mortem windows and can even contradict each other [3].
Another method for estimating the PMI is measuring the potassium concentration in the vitreous humor, which increases post mortem. This method is well established and has been extensively described in the literature [2,8,11,12,13,14,15]. Ortmann et al. mentioned that other methods (e.g., body cooling) work well in the first 24 h post mortem and that, therefore, measuring the concentration of vitreous potassium is of limited value. However, after 24 h, other methods are not reliable anymore and the potassium concentration becomes useful. They also compared five different regression equations derived in previous studies to estimate the PMI. It is concluded that for different climate zones, different regression equations give better results [16]. It must be noted that the slope increases with increasing ambient temperature, and that the increase in potassium is dependent on temperature, (chronic) illness, urea retention, etc. [4,17]. While potassium levels increase post mortem, the concentration of sodium and chloride decreases in vitreous humor. On an individual level, these markers are not reliable enough to be used to estimate the PMI and are influenced by hydration status, (chronic) illness, kidney function, etc. [3,4].
To quantify the potassium level, three methods are widely used: (1) an ion selective electrode method [18,19], (2) flame photometry [20,21] and (3) capillary electrophoresis (CE). The first two are non-separation techniques; the latter, CE, is a chromatographic separation method [15,22,23,24,25,26].
Acquiring valuable information early in a forensic investigation assists in formulating credible scenarios. Hence, there is an interest in portable devices and methods for analyzing evidence directly at the crime scene. Portable analysis techniques, with the use of disposable components, mitigate contamination risks, thereby strengthening the evidentiary value.
The Fisic Medimate™ system is a handheld read-out device with a disposable prefilled ready-to-use microfluidic chip (Figure 1). The chips contain closed electrode reservoirs and a single sample inlet [27]. The system was originally designed for the determination of the lithium level in whole blood [28]. However, the system is also suitable for the detection of sodium in urine, and of calcium and magnesium in bovine blood [29]. Moreover, creatinine levels in human serum can be measured with the Fisic Medimate™ system [30].
Accurately estimating the PMI remains a critical but complex aspect of forensic science, with current methods often producing wide windows and sometimes conflicting results. Portable devices like the Fisic Medimate™ system show promise for on-site analysis, which will potentially enhance PMI estimation by providing immediate, reliable data directly at the crime scene. The primary advantage of the Fisic Medimate™ system lies in its portability, enabling immediate, on-site analysis of forensic samples, which enhances the efficiency of investigations at the crime scene. In this proof-of-concept study, its use for potassium/sodium (K+/Na+) ratio determination in vitreous humor under controlled laboratory conditions is explored, offering initial insights into its potential for forensic PMI estimation.

2. Materials and Methods

2.1. Sample Collection

Since pigs share many similarities with humans and have been proven to be suitable for vitreous humor post mortem interval (PMI) studies [31,32,33,34]. Pig eyes were used in this study. While human samples would have been the preferred medium for this research, ethical considerations led us to choose pigs for this preliminary study. Pigs were selected to evaluate the feasibility of using this system for PMI estimation, as they share many physiological similarities with humans, particularly in terms of eye anatomy. This allowed us to conduct a controlled investigation without the ethical concerns associated with human samples at this stage. To increase the resemblance to a real crime scene, we utilized half pig heads (n = 27) rather than only the eyes. This approach allowed us to consider the influence of surrounding dying cells on the potassium and sodium concentrations in the vitreous humor.
The pig heads were obtained from a local slaughterhouse as waste material from the food industry, ensuring the animals were healthy at the time of slaughter. The pigs used in the research were originally intended for slaughter and consumption, and their deaths were not specifically carried out for the purposes of this research. Therefore, the ethical committee deemed that this research does not constitute as animal testing, as the killing of the pigs was unrelated to the study. Due to the sourcing of pig heads from standard slaughterhouse practices, detailed information on sex, age and breed was not available, and homogeneity in these factors could not be ensured. Despite this variability, all cadavers were of approximately the same weight and size. The procedure used to ensure death followed standard practices in the Netherlands and was as follows: an electrical shock to the head followed by a knife to the heart, causing immediate death.
The heads were delivered as halves due to the slaughterhouse’s product handling processes. This turned out to be advantageous, as the halves fit more easily into the climate chamber (Binder BF 115 Avantgarde Line), which was set to 20 °C and 70% humidity for the study. The dataset consisted of both halves from the same pig, providing consistency in the analysis. After slaughter and sampling, the heads were directly transported to the Saxion University lab in a plastic bag (except for the time zero measurements). Upon arrival, they were immediately placed into the climate chamber to preserve the conditions for analysis.
The Fisic Medimate™ system utilizes CE to detect and quantify ions, specifically potassium (K+) and sodium (Na+), in fluids. The CE technique separates ions based on their charge and mobility under an electric field, providing rapid and accurate results in under 10 min. This methodology supports the calculation of the K+/Na+ ratio for post mortem interval estimation in a forensic context.
The potassium-to-sodium (K+/Na+) ratio was measured at specific time intervals of 0, 3.5, 7, 10.5, 20, 24, 27.5, 31 and 44.5 h post mortem. These intervals were carefully chosen based on logistical constraints related to the availability of the climate chamber and the laboratory facilities where the experiments were conducted.
The initial measurement at time zero was conducted at the slaughterhouse immediately at the moment of death, ensuring that the baseline K+/Na+ ratio was accurately recorded. Following this, the severed heads were transported under controlled conditions to the laboratory at Saxion University, where the subsequent measurements were carried out. This setup allowed the study to maintain consistency in environmental conditions and data collection while accommodating the operational limitations of the facilities.
A different eye was used for each measurement to ensure that previous sampling does not impact subsequent readings. The eye used was chosen randomly, without distinctions based on sex, left or right eye, or age. To ease sample collection, the eye was kept open with clamps. The vitreous humor was collected by puncturing 1 cm through the sclera with a 1.2 mm gauge injection needle (BD Microlance 18G 1 1/2″ (1.2 × 40 mm)) with an angle of 45°, after pushing the tissue in the inner corner of the eye away with the needle. The volume of vitreous humor that can be obtained decreases as the PMI increases. As only 5 μL is required as input for the microfluidic chip, the decreasing volume was not a problem.

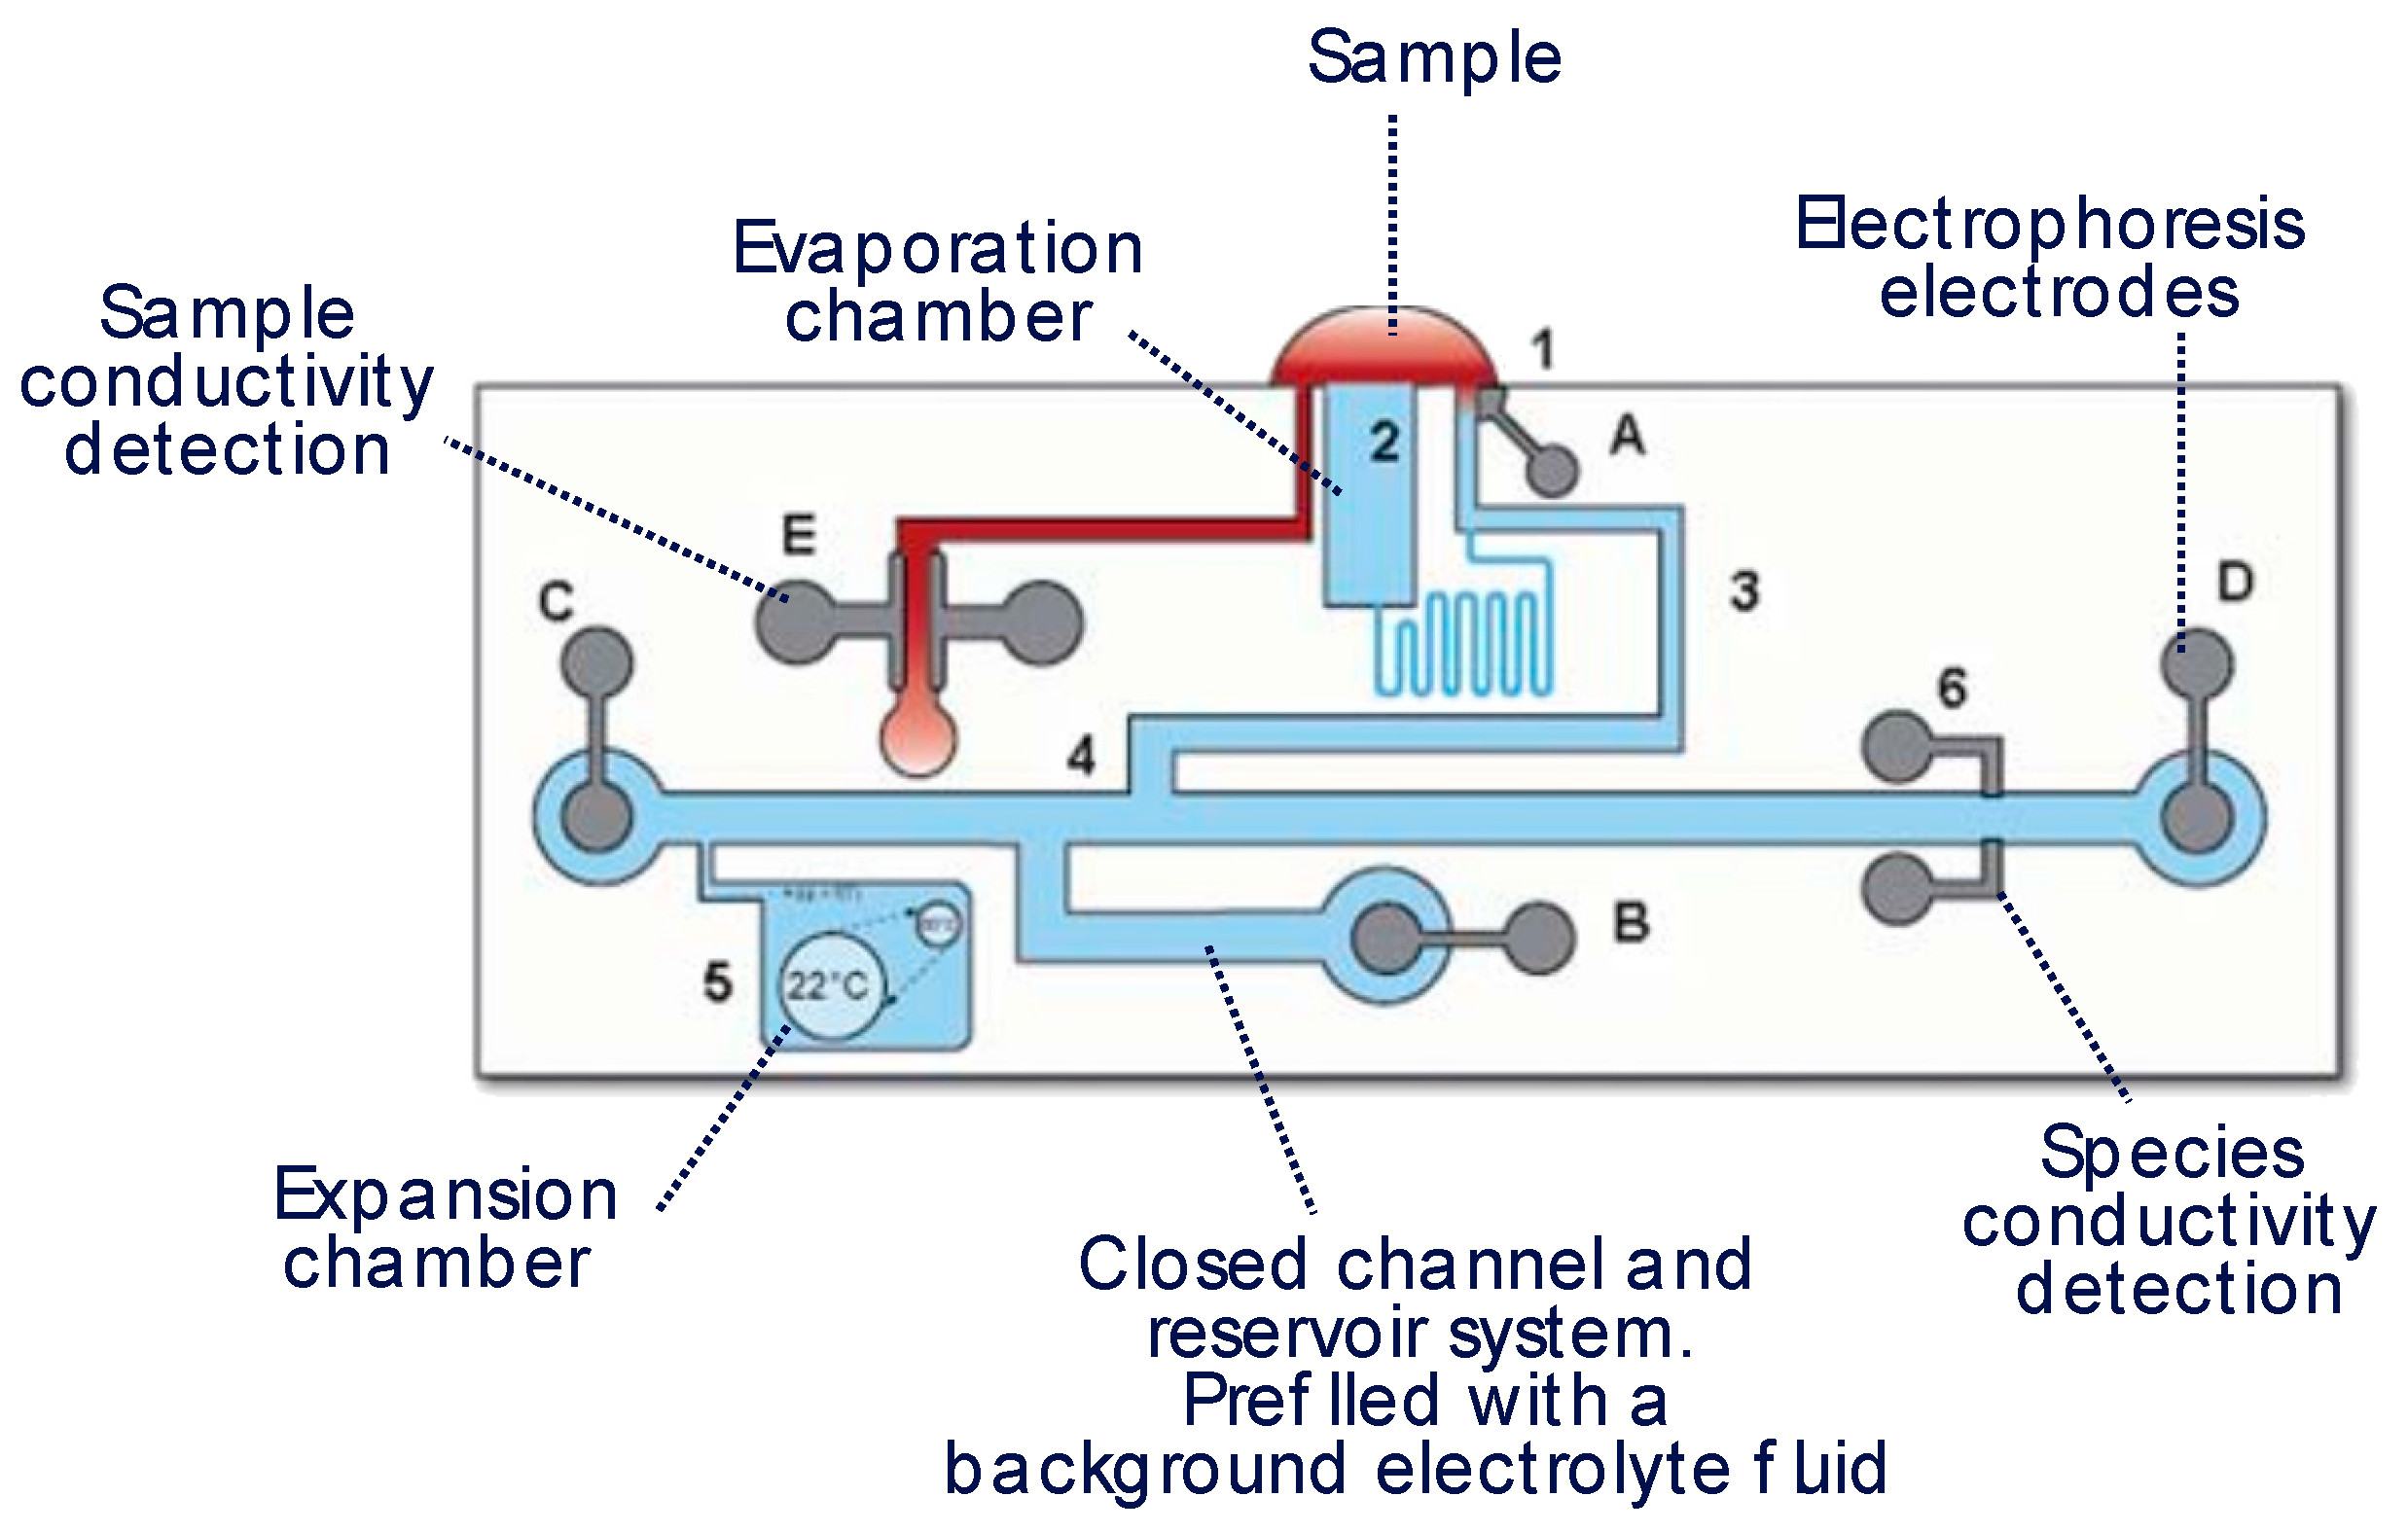
2.2. Fisic Medimate™ System and Data Acquisition

The Fisic Medimate™ system consists of so-called Fisic Medimate™ LabChips (Figure 2) and a handheld read-out device for conductivity detection. The microfluidic chip is prefilled with a buffer solution with a pH around 3. Further details on the microfluidic chip and reader can be found in previous publications [27,29,30]. A drop of sample (i.e., vitreous humor) is placed in the middle of the microfluidic chip after the seal is removed from the inlet. Subsequently, the cartridge is closed and inserted into the reader, after which the measurement is started. Measurements were performed by sample application directly after obtaining the sample without sample alterations, and each PMI was measured in triplicate. Since the ratios of the potassium and sodium peaks were used for subsequent analysis, there was no need to determine the exact potassium and sodium concentrations.
After approximately 9 min, the results can be read out and the areas under the sodium and potassium curves can be determined. The areas are calculated in Octave by in-house developed software scripts from the Fisic company. The area of the sodium peak is subsequently divided by area of the potassium peak to determine the ratio. Jamovi (version 2.6.26) was used to tabulate, visualize and analyze the results. Jamovi is an open-source software application for statistical analyses, built upon the programming language R.

2.3. Explorative and Inferential Statistical Analysis

At nine different points in time, 3 measurements were made, amounting to 27 measurements in total. We refer the reader to Table A1 below. All these measurements were used in subsequent analysis and modeling.
The measured concentrations of sodium and potassium in vitreous humor were analyzed to investigate how these levels change with the progression of the post mortem interval. Based on this explorative analysis, a log-linear regression model is postulated for the sodium/potassium ratio. It has the following structure:
l n y i = a x i + b + ε i for i = 1 , , 27
Here, l n denotes the natural logarithm, y i is the sodium/potassium ratio of measurement i in Table 1, x i is the PMI of measurement i and ε i is the random error term of measurement i . Further, a and b are true but unknown model parameters that are estimated by calculating the best linear fit (in the least squared errors sense) between the observations x i and l n y i . Based on visual scatter plot analysis, it seemed promising to also analyze the above model (1) after restricting it to the first eight points in time, namely for observations i = 1 , ,   24 . In all our statistical analyses, we compare model (1) with this time-restricted model.
The random errors, ε i , of model (1) are not observable and contain all influences on the measurement of the log-sodium/potassium ratio that are not caused by the post mortem interval. For instance, the random error contains random fluctuations caused by the measurement device.
The log-linear model class was chosen over a possible (inverse) polynomial model because many biochemical decay processes are of exponential form, making a log-linear model a natural choice. Moreover, the statistical procedure allows one to identify any exponential decay process which may be generating the data. In contrast, modeling the progression of the sodium/potassium ratio as (inverse) polynomial in time can only verify a model fit up to the specified polynomial order.
To ensure internal validity of the log-linear model, we performed several statistical analyses, especially pertaining to the random errors. While these random errors cannot be observed directly, their role in linear regression analysis is fundamental. In fact, inferential regression analyses are only valid if the error terms have certain probabilistic properties. Therefore, their estimated realizations—called residuals—were analyzed in depth in our study. Statistical inference is highly reliable if residuals are independent and homoscedastic, which means that they do not follow a discernible pattern, and they all have the same variance. These properties will be checked in a residual diagram. Further, for statistical inference to be valid in a small sample regime such as in our study, residuals must be normally distributed. This property will be checked with help of a QQ plot. In addition, Shapiro–Wilk normality tests will be performed.
In our analysis, we use the performance measure R 2 to determine the quality of our fit in the absolute sense for each model individually, as well as in the relative sense to compare the model performance of model (1) with the time-restricted model where i = 1 , , 24 .

3. Results

After presenting the measurements for sodium, potassium and their ratio, descriptive linear regression models are postulated, based on visual inspection. The main model is a log-linear model for the sodium/potassium ratio, which will subsequently be estimated and validated.

3.1. Vitreous Humor Measurements

The obtained electropherograms show distinct peaks corresponding to various ions present in the vitreous humor, including potassium and sodium, in addition to creatinine, magnesium and lithium. The peak height and area reflect the concentration of these ions. A typical electropherogram is shown in Figure 3. Sodium levels tend to decrease slightly or remain relatively stable after death (as discussed further in Section 3.2). The electropherogram shows a significant peak for potassium (as discussed further in Section 3.3), which becomes more pronounced as time progresses post mortem.
To create calibration curves, vitreous humor samples were collected at various known intervals post mortem, and the potassium and sodium levels were measured using the Fisic Medimate™ system. The peak area values of sodium and potassium as well as the ratios of both ions are given in Table A1.

3.2. Sodium Peak Analysis

Analyzing solely the sodium peak area (Figure 4), the sodium level does not have a significant linear decrease. In fact, we have R 2 = 0.095 and a p value of the slope of 0.117. Even the Kendall’s tau B statistic, which tests for an arbitrary monotone relationship instead of just a linear one, is not significantly different from 0 at 5% significance (p = 0.065) While many studies do report a clear decrease in sodium concentration [33,35,36], others report a very slight decrease or no change at all [34,37,38,39,40,41,42,43,44]. It must be noted that vitreous sodium decreases slowly post mortem, especially in the early post mortem interval where only a marginal decrease is observed [41,45,46].

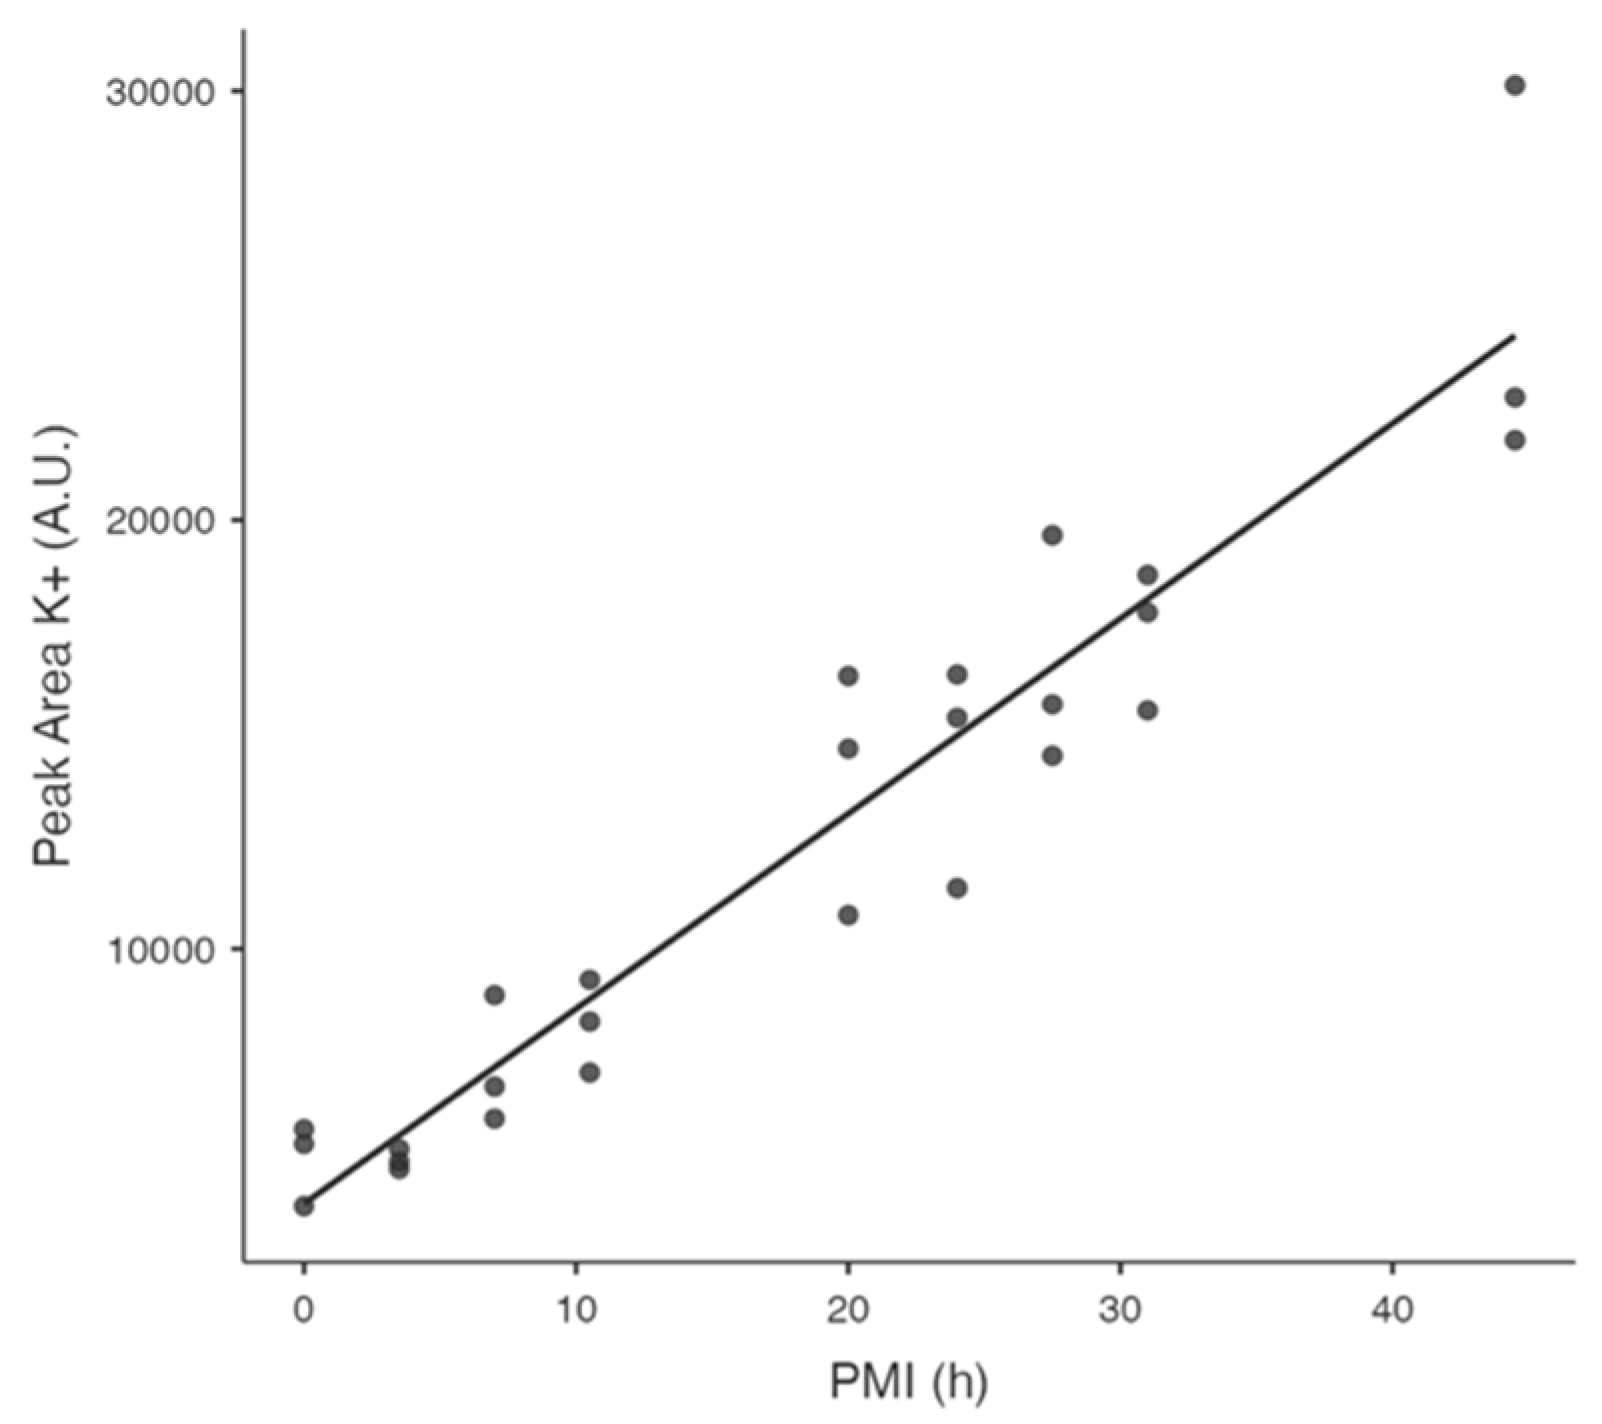
3.3. Potassium Peak Analysis

The potassium peak area increases significantly as the PMI becomes higher (Figure 5). In fact, for the linear fit we have R 2 = 0.905 and a p-value lower than 0.001 for the slope, implying that even at 0.001 significance, the slope is different from 0. This is in accordance with previous reports that also revealed a linear relationship between the PMI and potassium level in the vitreous humor [12,13,17,19,23,45], although Gadzuric et al. claim that after 25 h post mortem the concentration does not rise any further [44].
Coe evaluated the use of potassium as a measure for the PMI. An increase for at least 100 h after death was observed for vitreous potassium, with the most rapid rise in the first few hours (~6 h) post mortem. It was concluded that potassium can be of value, as long as a proper evaluation has been conducted. In particular, the environmental temperature can influence the vitreous potassium levels [13,42].
Ortmann et al. investigated the precision of estimating the PMI by applying five different regression equations derived in previous studies to new data. They focused on which values to use for the intercept and, especially, the slope for extrapolating the PMI in the linear regression model. Values of 0.17–0.19 mmol L−1 h−1 for the slope and an intercept of 5.88 mmol/L gave the best results for the climate zone of central Europe, while for other climate regions, different parameters work better [16]. However, Lange et al. re-analyzed the data from 790 cases and concluded that linearity and constant variance concerning the potassium levels are not supported by the data. Therefore, they advocate using a LOESS smooth curve, which is a type of a local regression model, and which increased the reliability of the estimated PMI [47].

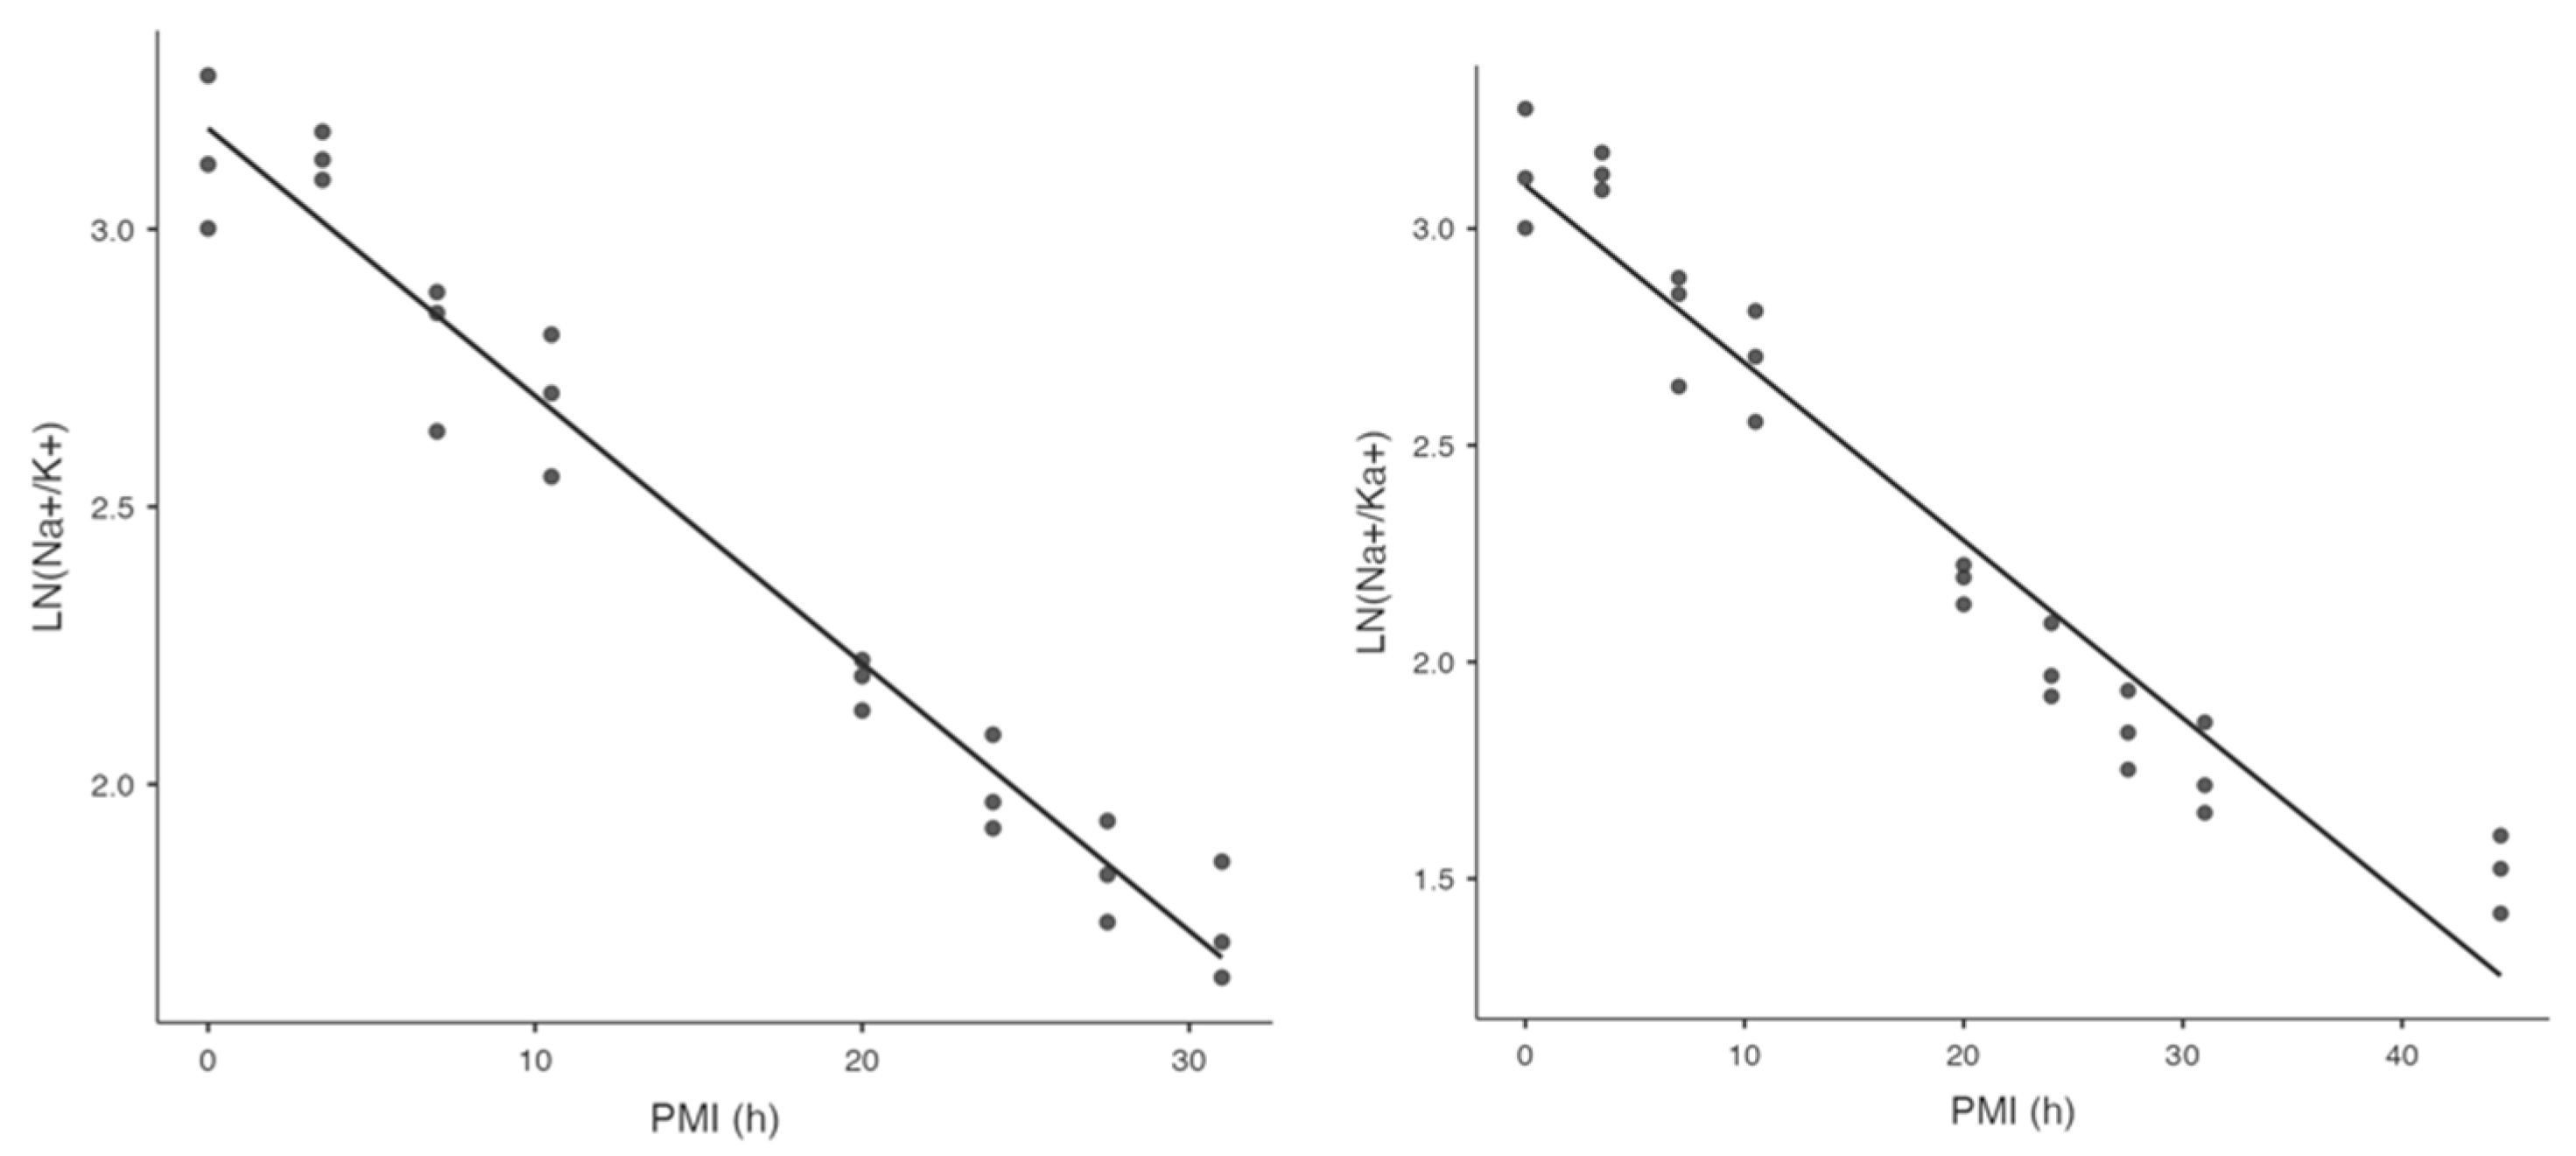
3.4. Sodium/Potassium Ratio

The exact concentration of electrolytes in vitreous humor is, among other factors, (slightly) dependent on the ambient temperature and humidity [16,17,19,48,49]. Temperature variations can also cause differences in migration time and a baseline shift in the electropherogram [29]. By using the sodium/potassium ratio, the effects of these external factors are mitigated. Moreover, the need for an internal standard is eliminated. Therefore, this study is focused on the analysis of how the PMI influences the sodium/potassium ratio. However, when the sodium/potassium ratio is plotted against the PMI, a non-linear relationship can be observed (Figure 6).

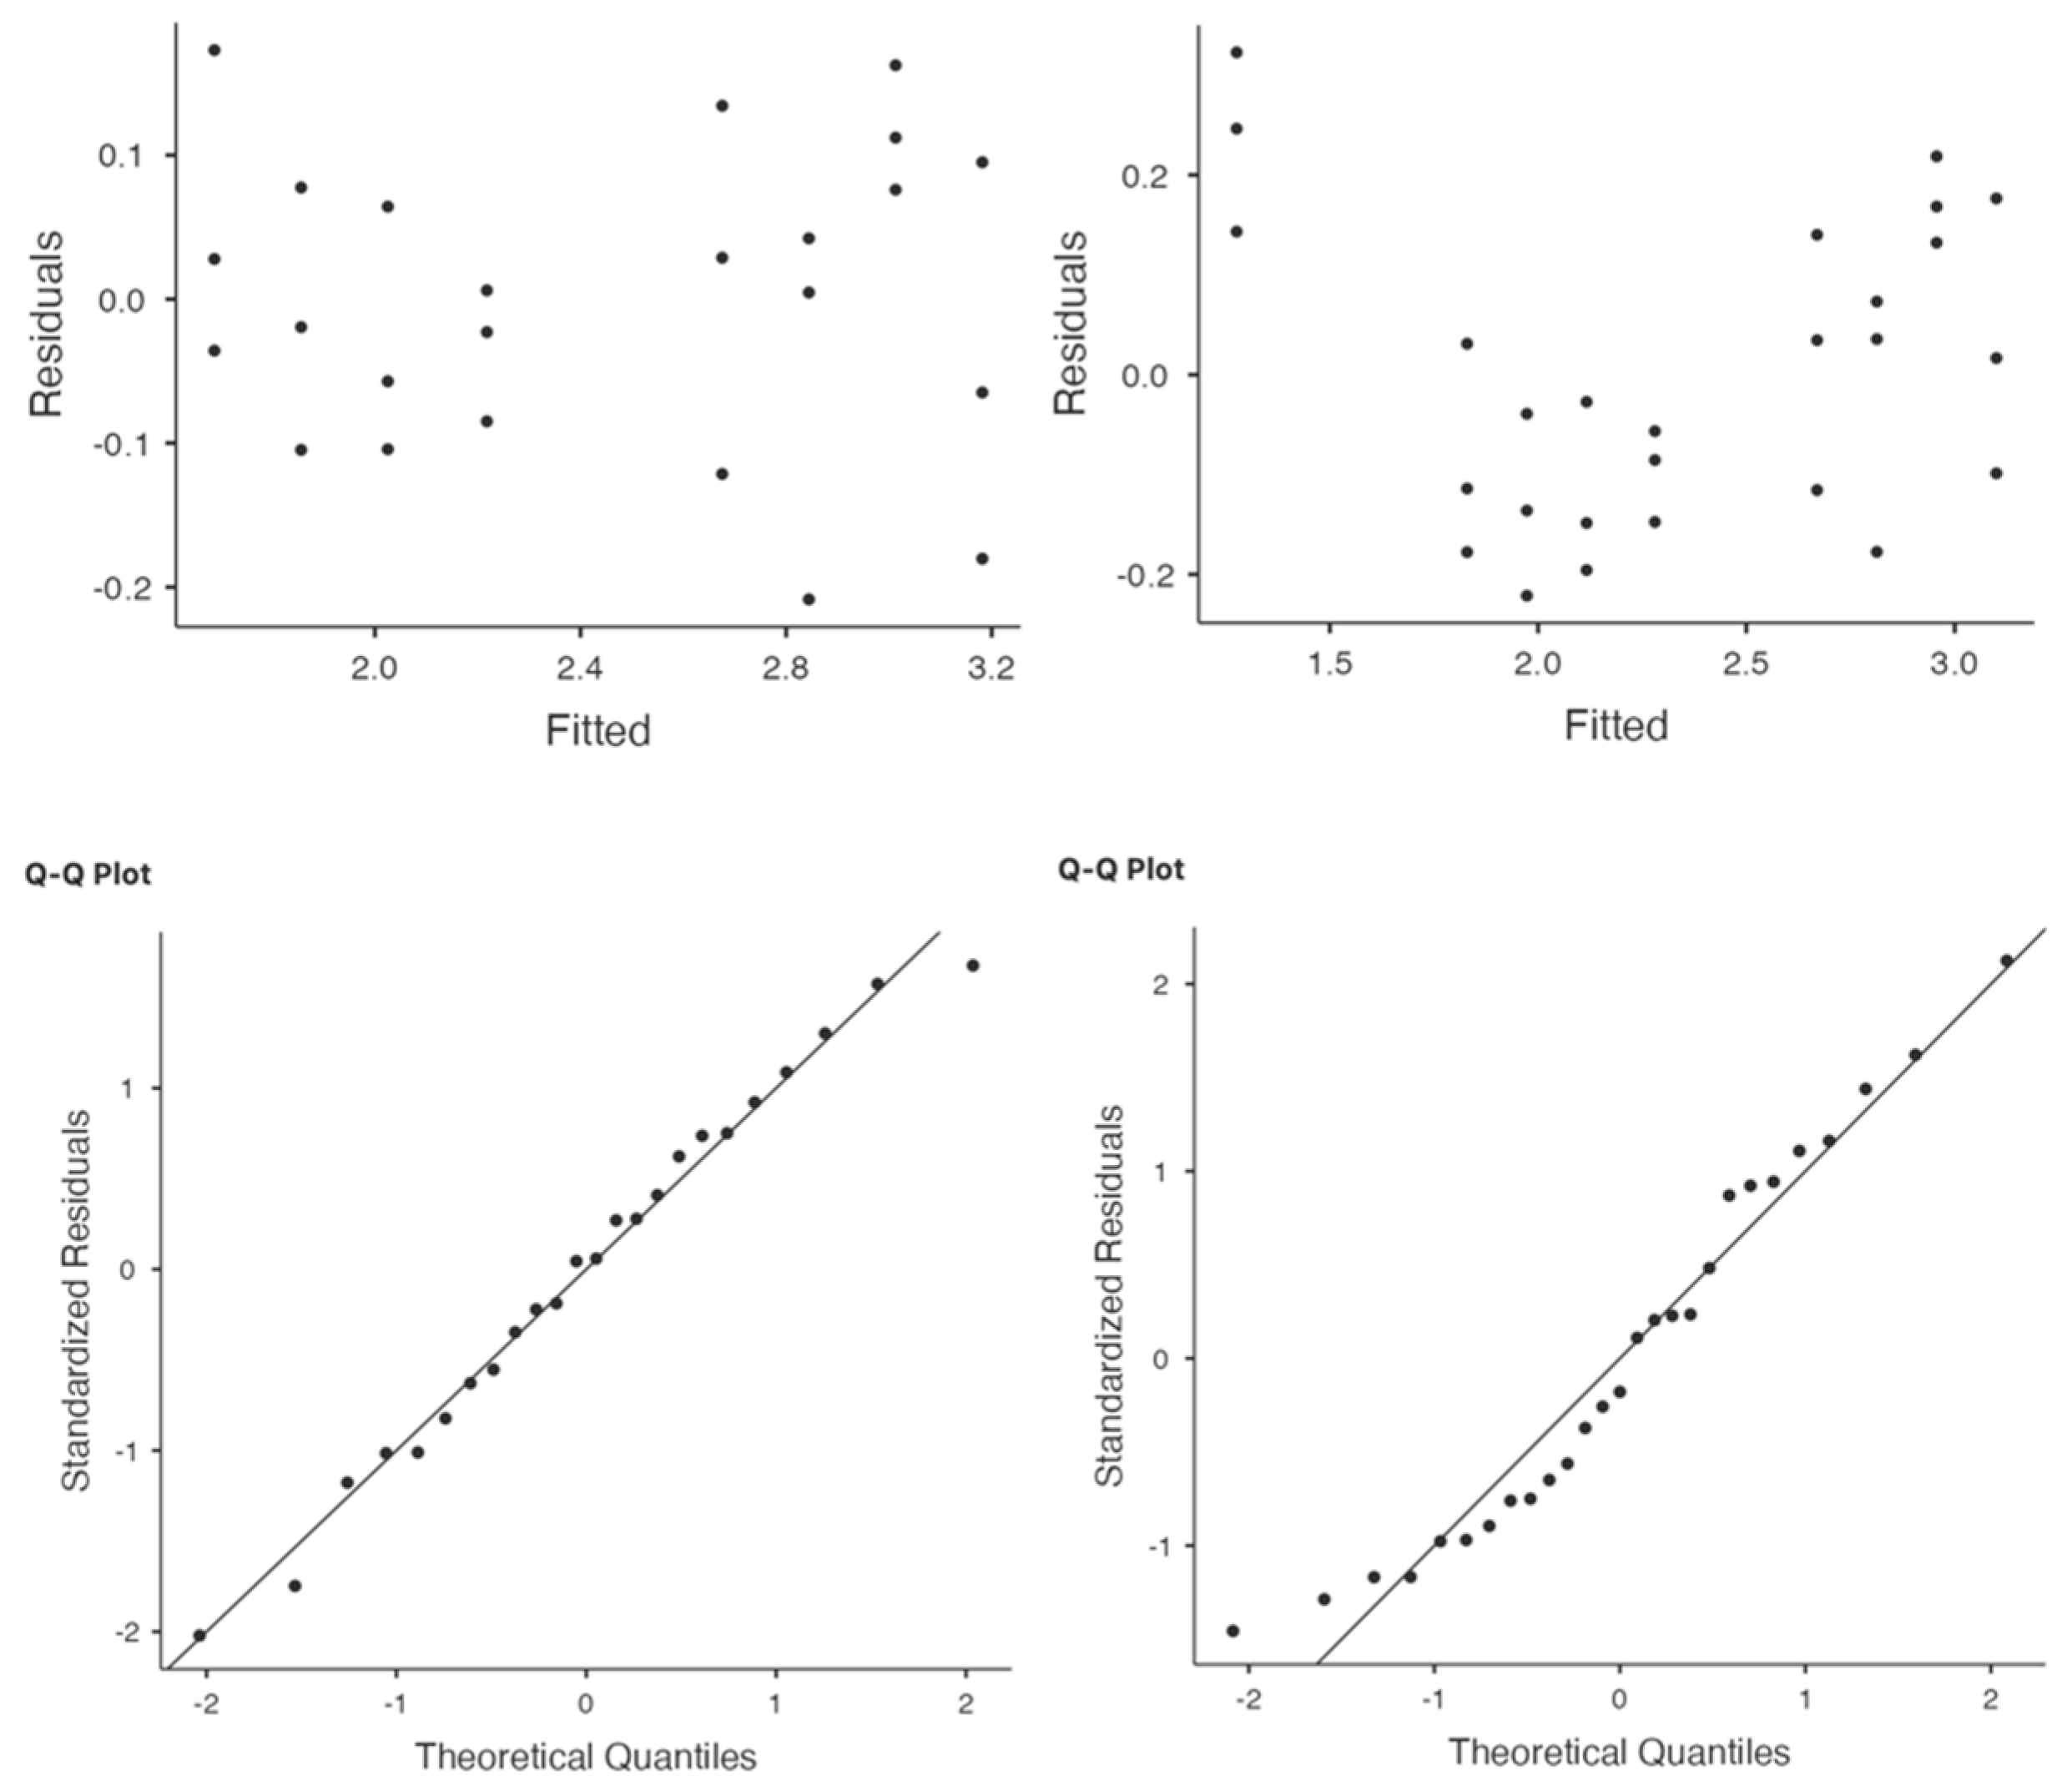
3.5. Inferential Regression Analysis

As can be observed in Figure 6, the relationship between the PMI and the sodium/potassium ratio is not linear. This motivated the log-linear model (1) as described in the Materials and Methods Section. In what follows, model (1) will be analyzed for the timespans 0–31 h and 0–44.5 h, resp. ( i = 1 , 24 and i = 1 , , 27 , resp.).
In the 31 h model (as shown in Figure 7), a clean linear relationship can also be observed at the margins of the domain. In the 44.5 h model, the relationship need not be of a linear nature, especially on the right margin. The following regression outputs will support these findings numerically.
It is visible that the 31 h model outperforms the 44.5 h model in terms of the model fit measures R and R 2 . Further, the estimated models and the associated confidence intervals (CIs) are listed in the following table.
To interpret such a confidence interval, we can conclude that our point estimate for the true but unknown slope in the 31 h model is 0.048 , and that we are 95% confident that the true but unknown slope is larger than 0.052 but smaller than 0.044 . This gives crucial information about the precision of our estimates. Therefore, the intercept can be estimated at a greater precision in the 31 h model since the confidence interval is narrower than in the 44.5 h model. This observation is not true for the estimation of the slope.
Next, the error terms (residuals) of the two models will be analyzed. To this end, the two residual plots in the top row of Figure 8 show that the residuals in the 31 h model are homoscedastic and independent, whereas in the 44.5 h model, a pattern of a standard parabola is visible, speaking against independence. Further, the two QQ plots in the bottom row of Figure 8 show that the residuals of the 31 h model match a normal distribution nicely, whereas the residuals of the 44.5 h model deviate from the normal distribution. The normality property has also been inspected with help of a Shapiro–Wilk normality test: In the 31 h model, the p-value is 92.5%; in the 44.5 h model, the p-value is 21.4%. To conclude, the data are much more in line with a normality assumption in the 31 h model than in the 44.5 h model. In total, this analysis shows that the statistical quality of the residuals (independence, homoscedasticity and normality) is remarkably high in the 31 h model, but less perfect in the 44.5 model. This also has direct implications for all estimations (for example, the confidence intervals above): these are much more trustworthy in the 31 h setting than in the 44.5 h setting.
As suggested by one of the reviewers of this manuscript, we also conducted a regression analysis for an inverse relationship, leading to a similar R 2 value, but inferior residual behavior. In our small sample regime, proper residual behavior is the only way to argue for the validity of our statistical results. We therefore leave out the analysis of the inverse model.

4. Discussion

Various other research groups also investigated the sodium/potassium ratio to estimate the PMI. Gadzuric et al. used the linear least squares model followed by artificial neural network procedures to optimize the PMI determination. They applied their method on 174 real forensic cases and found an R 2 value of 0.96 [44].
It was concluded by Jashanani et al. that there is little change in the sodium concentration up to 50 h post mortem in humans, but that there is a linear relationship between the vitreous potassium level and an inverse correlation between the ratio of sodium and potassium in relation to the PMI [38].
Querido investigated the sodium/potassium ratio in the plasma of 40 rats for 6–96 h after death. An inverse linear relationship was found between the logarithm of the ratio and the logarithm of the PMI. It was also concluded that the sodium levels do not change much up to 6 h after death, while the concentration rapidly decreases 6–12 h post mortem. During the first 24 h after death, the potassium concentration showed a rapid increase. Therefore, the ratio also decreased rapidly 24 h after death [21].
The ratio of serum sodium and potassium in Wistar rats was determined by Singh et al. for 3 to 58 h after death. A linear relationship between the sodium/potassium ratio and the PMI was observed on a double logarithmic scale. It must be noted that the environmental temperature can have a strong influence on the results [50]. Later, Singh et al. also investigated the electrolyte levels in the pericardial fluid of humans. They observed a strong increase in the potassium level in the first 12 h post mortem and a decrease in the sodium level, although the latter was at a more unpredictable rate. On a double logarithmic scale, a linear relationship could be observed for the potassium concentration, the sodium/potassium ratio and for the phosphorus concentration [36].
Potassium and ammonium levels in the vitreous humor were measured by Palacio et al. They noticed that there was a small increase in the correlation coefficient by using the logarithm of the potassium concentration [26]. Cordeiro et al. used the logarithm of the PMI to obtain a better fit for the potassium, hypoxanthine and urea levels in vitreous humor [14].
Comparing our findings with those of previous studies highlights the enhanced predictive accuracy and adaptability of our approach across varying environmental conditions, addressing the limitations noted in existing methodologies.
Moreover, the results show a clear correlation between the natural logarithm of the sodium/potassium ratio and the time since death, and in our inferential analysis, the quality of this correlation depends on the time span under investigation, highlighting the potential of the Fisic Medimate™ system as a portable tool for on-site forensic analysis. While similar (mostly descriptive) correlation results have been published, this is the first time the results were obtained with a handheld capillary electrophoresis system (the Fisic Medimate™ system). With this system, results can be obtained within 9 min (and after optimization the time-to-result can even lower to 3 min), making information about the PMI directly available at the crime scene.
In this study, only potassium and sodium levels were analyzed. This decision was based on two key factors. First, the Fisic Medimate™ system already includes an internal standard for sodium, which made it practical and efficient to measure these ions with high reliability. Second, previous research has demonstrated the stability and forensic relevance of potassium and sodium levels in vitreous humor, which aligns with our primary focus on post mortem interval (PMI) estimation. Although our analysis focused solely on potassium and sodium, it is important to note that the Fisic Medimate™ system is capable of measuring other ions in the vitreous humor, such as chloride, magnesium and lactate. These ions also hold potential for PMI estimation, as supported by other studies [32,37,41,43]. Future research could explore these additional parameters to further enhance the accuracy and applicability of the system for forensic investigations. Gadzuric et al. concluded, by using linear least squares model and artificial neural network modeling, that the sodium and potassium concentration in the vitreous humor of humans is independent of cause of death (violent vs. clinic), eye (right vs. left) and sex (male vs. female) [44]. This was also confirmed in other studies [37,38]. Some researchers claim that the age is influences the electrolyte concentrations [13,17], while others conclude that there is no significant correlation [14,37,38]. To eliminate the influence of age, eyes from adult pigs of approximately the same age were selected.
It must be noted that the regression parameters (especially the slope) are dependent on several factors. The age of the victim (a steeper slope is observed in infants than in adults), blood alcohol levels and the duration of the terminal episode can all have an influence on the regression parameters. In particular, the ambient/environmental temperature can have a great influence and should therefore be monitored carefully [13,16,48]. As mentioned in Section 3.4, by using the sodium/potassium ratio the effects of these factors are mitigated, and there is no need for an internal standard. However, a disadvantage of not using an internal standard is that the peak areas cannot be directly translated into an exact concentration. As long as the internal standard is not integrated, this is a trade-off between the quantification and the ease of use.
Although the study utilized pig vitreous humor as a model for human post mortem changes, these limitations must be acknowledged. Future research should aim to validate these findings in human subjects and investigate the influence of various factors, such as ambient temperature, age and cause of death, on the accuracy of post mortem interval estimation using the sodium/potassium ratio. This validation using human post mortem samples or forensic case data is a crucial next step in fully establishing the method’s relevance and translational value. It will ensure that the findings are applicable to human forensic cases and enhance the method’s practical utility in real-world forensic investigations.
Furthermore, all samples were taken by a single researcher to maintain consistency and minimize potential variability in the sample collection process. However, this approach does not address potential challenges such as intra- or inter-examiner variability, which could arise in a field setting where multiple individuals might handle the device or collect samples. Future research should account for these factors by including multiple operators in field trials to assess the system’s performance under diverse conditions. This would provide insights into how user variability and external factors, such as contamination risks, might affect the accuracy and reliability of the system in forensic applications. Additionally, conducting field trials under various environmental conditions will be essential to evaluate the robustness of the device and ensure its practical usability in real-world forensic investigations. While pigs serve as a suitable substitute for humans in post mortem studies, determining the exact time of death remains somewhat unreliable. After slaughtering the pigs, the heads were removed, leading to an interval difference of approximately 30 min. Additionally, transportation contributed to an average delay of 60 min between slaughter and the placement of the half head in the climate chamber.
Additionally, the 0 h post mortem measurements were challenging. Although these measurements were taken on-site at the slaughterhouse, there was an approximate 5 to 15 min gap between the actual slaughter and the sampling and measurement. An additional factor, not present in human bodies, was the electrical shock that pigs undergo in the slaughterhouse. Before slaughter, pigs are anesthetized using an electric shock. It is unknown whether this electrical stunning affects the sodium/potassium ratio in the vitreous humor. Given that sodium and potassium are charged particles, an electric shock could potentially impact them.
This research focused on the influence of temperature and humidity on electrolyte stability in vitreous humor, which are critical factors in PMI estimation. However, while temperature and humidity were the primary variables tested, other environmental factors, such as atmospheric pressure and fluctuating climatic conditions, could also impact electrolyte stability. These factors may vary significantly in real-world forensic scenarios.
Given the limitations of the current lab setup, it was not possible to test these additional variables. Future research should expand the analysis to include atmospheric pressure and other environmental conditions to better understand their influence on the method’s performance.

5. Conclusions

This proof-of-concept study demonstrates a significant correlation between the natural logarithm of the sodium/potassium ratio in vitreous humor and the post mortem interval (PMI). The introduction of the handheld Fisic Medimate™ system marks a notable advancement in forensic technology, providing rapid and on-site analysis of vitreous humor to estimate PMI. This capability enhances the accuracy and efficiency of forensic investigations by delivering immediate insights at crime scenes.
This study successfully established a reliable method for estimating post mortem interval (PMI) using the sodium/potassium ratio in vitreous humor. Potassium levels showed a clear linear increase post mortem, while sodium remained relatively stable. A log-linear regression model was developed, with the 31 h model providing the best fit and statistical reliability. The linear relationship observed in our study, particularly when plotted on a logarithmic scale, reinforces the applicability of this method for PMI estimation beyond the first 24 h. The sodium/potassium ratio also helped mitigate external factors like temperature. Overall, this research demonstrates the utility of potassium and the sodium/potassium ratio for PMI estimation, providing a solid foundation for further validation and application in forensic studies.
The Fisic Medimate™ system offers a promising tool for forensic investigators and is capable of providing quick and reliable PMI estimates directly at the scene. This innovation represents a significant step forward in forensic science, enhancing the precision and timeliness of death investigations. While these findings highlight its promise as a forensic tool, further research is needed to validate its performance under real-world conditions.

Author Contributions

Conceptualization, L.L.à.N. and M.B.; experimental setup, L.L.à.N. and M.B.; statistics, M.F.; data analysis, M.B., S.S. and M.F.; writing—original draft preparation, B.B., L.L.à.N. and M.F.; writing—review and editing, S.S. and J.K.; supervision, B.B. and J.K.; funding acquisition, L.L.à.N. and J.K. All authors have read and agreed to the published version of the manuscript.

Funding

This research was funded by TechForFuture, grant number 990.

Institutional Review Board Statement

Ethical review and approval were waived for this study due to the fact that the pigs used in this research were originally intended for slaughter and consumption, and their deaths were not specifically carried out for the purposes of this research. Therefore, the ethical committee deemed that this research does not constitute as animal testing, as the killing of the pigs was unrelated to the study.

Informed Consent Statement

Not applicable.

Data Availability Statement

The data that support the findings of this study are not publicly available due to privacy and security considerations. The data are stored internally within a secured environment. Access to the data may be granted upon reasonable request to the corresponding author, subject to privacy regulations and institutional approval.

Acknowledgments

We would like to express our sincere gratitude to all the individuals and organizations that contributed to the publication of this research paper. First and foremost, we thank Fisic for their valuable time, input and expertise throughout this project. Our appreciation also goes to Eric Hammacher for his insights on post mortem changes and his practical contributions to the applicability of the research. Lastly, we extend heartfelt thanks to all the interns and innovation students for their dedicated research efforts.

Conflicts of Interest

In this research, Fisic functioned as a commercial partner, supporting the project by providing materials and conducting analyses.

Appendix A

Table A1. The peak areas in Arbitrary Unites (A.U.) of sodium and potassium as measured with the Fisic Medimate™ system and their ratios.
PMI (h)Peak Area Na+ (A.U.)Peak Area K+ (A.U.)Na+/K+ Ratio
0123,178545722.57
116,670580120.11
106,079400526.49
3.5120,607503923.93
121,385533322.76
106,976487321.95
7.0124,510892313.95
117,320679417.27
108,404604617.93
10.5137,982830816.61
119,362928112.86
106,390711914.94
20.0146,92516,3628.98
123,81314,6708.44
99,72810,7899.24
24.0117,33616,3967.16
105,06515,3906.83
92,26011,4198.08
27.598,57415,7026.28
113,24119,6445.76
100,31114,5036.92
31.0100,03715,5626.43
104,08218,7195.56
93,07817,8405.22
44.5124,63330,1334.14
113,13422,8584.95
100,24021,8624.59

References

  1. Simmons, T. Post-Mortem Interval Estimation: An Overview of Techniques. Taphon. Hum. Remain. Forensic Anal. Dead Depos. Environ. 2017, 134–142. [Google Scholar] [CrossRef]
  2. Madea, B.; Ortmann, J.; Doberentz, E. Estimation of the Time since Death—Even Methods with a Low Precision May Be Helpful in Forensic Casework. Forensic Sci. Int. 2019, 302, 109879. [Google Scholar] [CrossRef]
  3. Donaldson, A.E.; Lamont, I.L. Estimation of Post-Mortem Interval Using Biochemical Markers. Aust. J. Forensic Sci. 2014, 46, 8–26. [Google Scholar] [CrossRef]
  4. Madea, B. Methods for Determining Time of Death. Forensic Sci. Med. Pathol. 2016, 12, 451–485. [Google Scholar] [CrossRef]
  5. Bashir, S.; Walia, D. Role of Rigor Mortis in Assessment of Time Since Death. Indian J. Forensic Med. Toxicol. 2020, 14, 626–631. [Google Scholar]
  6. Stigter, H.; Krap, T.; Duijst, W.L.J.M. Estimation of the Post-Mortem Interval; Added Value of Mechanical Excitability of Human Skeletal Muscle. J. Forensic Leg. Med. 2024, 103, 102664. [Google Scholar] [CrossRef]
  7. Otatsume, M.; Shinkawa, N.; Tachibana, M.; Kuroki, H.; Ro, A.; Sonoda, A.; Kakizaki, E.; Yukawa, N. Technical Note: Excel Spreadsheet Calculation of the Henssge Equation as an Aid to Estimating Postmortem Interval. J. Forensic Leg. Med. 2024, 101, 102634. [Google Scholar] [CrossRef] [PubMed]
  8. Gelderman, T.; Stigter, E.; Krap, T.; Amendt, J.; Duijst, W. The Time of Death in Dutch Court; Using the Daubert Criteria to Evaluate Methods to Estimate the PMI Used in Court. Leg. Med. 2021, 53, 101970. [Google Scholar] [CrossRef]
  9. Henßge, C.; Madea, B. Estimation of the Time since Death in the Early Post-Mortem Period. Forensic Sci. Int. 2004, 144, 167–175. [Google Scholar] [CrossRef]
  10. Yadav, P.K.; Singh, R.R.; Tripathi, S.K. Integrating Temperature Data with Other Forensic Methods for Time Since Death Estimation. Indian J. Forensic Med. Toxicol. 2024, 18, 92–96. [Google Scholar] [CrossRef]
  11. Madea, B.; Herrmann, N.; Henbge, C. Precision of Estimating the Time since Death by Vitreous Potassium—Comparison of Two Different Equations. Forensic Sci. Int. 1990, 46, 277–284. [Google Scholar] [CrossRef] [PubMed]
  12. Hughes, W.M.H. Levels of Potassium in the Vitreous Humour after Death. Med. Sci. Law 1965, 5, 150–156. [Google Scholar] [CrossRef] [PubMed]
  13. Coe, J.I. Vitreous Potassium as a Measure of the Postmortem Interval: An Historical Review and Critical Evaluation. Forensic Sci. Int. 1989, 42, 201–213. [Google Scholar] [CrossRef]
  14. Cordeiro, C.; Ordóñez-Mayán, L.; Lendoiro, E.; Febrero-Bande, M.; Vieira, D.N.; Muñoz-Barús, J.I. A Reliable Method for Estimating the Postmortem Interval from the Biochemistry of the Vitreous Humor, Temperature and Body Weight. Forensic Sci. Int. 2019, 295, 157–168. [Google Scholar] [CrossRef] [PubMed]
  15. Bortolotti, F.; Pascali, J.P.; Davis, G.G.; Smith, F.P.; Brissie, R.M.; Tagliaro, F. Study of Vitreous Potassium Correlation with Time since Death in the Postmortem Range from 2 to 110 Hours Using Capillary Ion Analysis. Med. Sci. Law 2011, 51 (Suppl. S1), 20–23. [Google Scholar] [CrossRef]
  16. Ortmann, J.; Markwerth, P.; Madea, B. Precision of Estimating the Time since Death by Vitreous Potassium—Comparison of 5 Different Equations. Forensic Sci. Int. 2016, 269, 1–7. [Google Scholar] [CrossRef]
  17. Zilg, B.; Bernard, S.; Alkass, K.; Berg, S.; Druid, H. A New Model for the Estimation of Time of Death from Vitreous Potassium Levels Corrected for Age and Temperature. Forensic Sci. Int. 2015, 254, 158–166. [Google Scholar] [CrossRef]
  18. Zięba, S.; Wiergowski, M.; Cieślik, B.M.; Anand, J.S.; Krzyżanowska, M. Uncertainty of Postmortem Time Estimation Based on Potassium Ion Determination in Vitreous Humor Using Potentiometric Ion-Selective Electrode and Microwave-Induced Plasma with Optical Emission Spectrometry Methods. Separations 2023, 10, 201. [Google Scholar] [CrossRef]
  19. Madea, B.; Henssge, C.; Hönig, W.; Gerbracht, A. References for Determining the Time of Death by Potassium in Vitreous Humor. Forensic Sci. Int. 1989, 40, 231–243. [Google Scholar] [CrossRef]
  20. Yadav, J.; Deshpande, A.; Arora, A.; Athawal, B.K.; Dubey, B.P. Estimation of Time since Death from CSF Electrolyte Concentration in Bhopal Region of Central India. Leg. Med. 2007, 9, 309–313. [Google Scholar] [CrossRef]
  21. Querido, D. Double Logarithmic, Linear Relationship between Plasma Sodium/Potassium Concentration Ratio and Postmortem Interval during the 6–96-h Postmortem Period in Rats. Forensic Sci. Int. 1990, 44, 125–134. [Google Scholar] [CrossRef] [PubMed]
  22. Gottardo, R.; Palacio, C.; Shestakova, K.M.; Moskaleva, N.E.; Bortolotti, F.; Tagliaro, F. A New Method for the Determination of Ammonium in the Vitreous Humour Based on Capillary Electrophoresis and Its Preliminary Application in Thanatochemistry. Clin. Chem. Lab. Med. 2019, 57, 504–509. [Google Scholar] [CrossRef]
  23. Locci, E.; Stocchero, M.; Gottardo, R.; Chighine, A.; De-Giorgio, F.; Ferino, G.; Nioi, M.; Demontis, R.; Tagliaro, F.; d’Aloja, E. PMI Estimation through Metabolomics and Potassium Analysis on Animal Vitreous Humour. Int. J. Legal Med. 2023, 137, 887–895. [Google Scholar] [CrossRef] [PubMed]
  24. Tagliaro, F.; Manetto, G.; Cittadini, F.; Marchetti, D.; Bortolotti, F.; Marigo, M. Capillary Zone Electrophoresis of Potassium in Human Vitreous Humour: Validation of a New Method. J. Chromatogr. B Biomed. Sci. Appl. 1999, 733, 273–279. [Google Scholar] [CrossRef]
  25. Tagliaro, F.; Bortolotti, F.; Manetto, G.; Cittadini, F.; Pascali, V.L.; Marigo, M. Potassium Concentration Differences in the Vitreous Humour from the Two Eyes Revisited by Microanalysis with Capillary Electrophoresis. J. Chromatogr. A 2001, 924, 493–498. [Google Scholar] [CrossRef]
  26. Palacio, C.; Gottardo, R.; Cirielli, V.; Musile, G.; Agard, Y.; Bortolotti, F.; Tagliaro, F. Simultaneous Analysis of Potassium and Ammonium Ions in the Vitreous Humour by Capillary Electrophoresis and Their Integrated Use to Infer the Postmortem Interval (PMI). Med. Sci. Law 2020, 61, 96–104. [Google Scholar] [CrossRef] [PubMed]
  27. Floris, A.; Staal, S.; Lenk, S.; Staijen, E.; Kohlheyer, D.; Eijkel, J.; Van Den Berg, A. A Prefilled, Ready-to-Use Electrophoresis Based Lab-on-a-Chip Device for Monitoring Lithium in Blood. Lab Chip 2010, 10, 1799–1806. [Google Scholar] [CrossRef]
  28. Kohlheyer, D.; Eijkel, J.; Lenk, S.; Floris, A.; Staal, S.; Van Den Berg, A. Point-of-Care Lithium Monitoring in Whole Blood Using a Disposable, Prefilled and Ready-to-Use Capillary Electrophoresis Microchip. In Proceedings of the 13th International Conference on Miniaturized Systems for Chemistry and Life Sciences, µTAS 2009, Jeju, Republic of Korea, 1–5 November 2009. [Google Scholar]
  29. Staal, S.; Ungerer, M.; Floris, A.; Ten Brinke, H.W.; Helmhout, R.; Tellegen, M.; Janssen, K.; Karstens, E.; van Arragon, C.; Lenk, S.; et al. A Versatile Electrophoresis-Based Self-Test Platform. Electrophoresis 2015, 36, 712–721. [Google Scholar] [CrossRef]
  30. Ávila, M.; Floris, A.; Staal, S.; Ríos, Á.; Eijkel, J.; van den Berg, A. Point of Care Creatinine Measurement for Diagnosis of Renal Disease Using a Disposable Microchip. Electrophoresis 2013, 34, 2956–2961. [Google Scholar] [CrossRef]
  31. Brzeziński, P.M.; Godlewski, A. Assessment of Potassium and Sodium Ion Concentrations in the Vitreous Humour of Swine Isolated Eyeballs after Organism Death. Rocz. Akad. Med. Białymstoku 2004, 49 (Suppl. S1), 161–163. [Google Scholar]
  32. Ojo, O.M.; Ajayi, O.B.; Musa, M.J. Comparison of Anions (Bicarbonate and Chloride) Concentration in Caprine and Porcine Vitreous Humour at Postmortem Interval. Ann. Biomed. Sci. 2020, 19, 14–25. [Google Scholar]
  33. Palic, M.P.; Šoštari’c, I.-C.; Zuckermann, Š.; Džaja, P.; Beer, B.; Ljubi’c, L.; Severin, K. A Biochemical and Histolog-ical Assessment of Postmortem Changes to the Eyes of Domestic Pigs: A Preliminary Study. Animals 2024, 14, 1190. [Google Scholar] [CrossRef] [PubMed]
  34. Drolet, R.; D’Allaire, S.; Chagnon, M. The Evaluation of Postmortem Ocular Fluid Analysis as a Diagnostic Aid in Sows. J. Vet. Diagn. Investig. 1990, 2, 9–13. [Google Scholar] [CrossRef]
  35. Zilg, B.; Alkass, K.; Berg, S.; Druid, H. Interpretation of Postmortem Vitreous Concentrations of Sodium and Chloride. Forensic Sci. Int. 2016, 263, 107–113. [Google Scholar] [CrossRef] [PubMed]
  36. Singh, D.; Prashad, R.; Sharma, S.K.; Pandey, A.N. Estimation of Postmortem Interval from Human Pericardial Fluid Electrolytes Concentrations in Chandigarh Zone of India: Log Transformed Linear Regression Model. Leg. Med. 2006, 8, 279–287. [Google Scholar] [CrossRef]
  37. Chandrakanth, H.V.; Kanchan, T.; Balaraj, B.M.; Virupaksha, H.S.; Chandrashekar, T.N. Postmortem Vitreous Chemistry—An Evaluation of Sodium, Potassium and Chloride Levels in Estimation of Time since Death (during the First 36 h after Death). J. Forensic Leg. Med. 2013, 20, 211–216. [Google Scholar] [CrossRef]
  38. Jashnani, K.D.; Kale, S.A.; Rupani, A.B. Vitreous Humor: Biochemical Constituents in Estimation of Postmortem Interval. J. Forensic Sci. 2010, 55, 1523–1527. [Google Scholar] [CrossRef]
  39. Prieto-Bonete, G.; Legaz, I.; Pérez-Martínez, C.; Pérez-Cárceles, M.D.; Luna, A. Biochemical Correction Factors to Estimation of Post-Mortem Interval in Vitreous Humor. Rom. J. Leg. Med. 2017, 25, 201–204. [Google Scholar] [CrossRef]
  40. Ingham, A.I.; Byard, R.W. The Potential Significance of Elevated Vitreous Sodium Levels at Autopsy. J. Forensic Leg. Med. 2009, 16, 437–440. [Google Scholar] [CrossRef]
  41. Palmiere, C.; Mangin, P. Postmortem Chemistry Update Part I. Int. J. Legal Med. 2012, 126, 187–198. [Google Scholar] [CrossRef]
  42. Coe, J.I. Postmortem Chemistries on Human Vitreous Humor. Am. J. Clin. Pathol. 1969, 51, 741–750. [Google Scholar] [CrossRef] [PubMed]
  43. Farmer, J.G.; Benomran, F.; Watson, A.A.; Harland, W.A. Magnesium, Potassium, Sodium and Calcium in Post-Mortem Vitreous Humour from Humans. Forensic Sci. Int. 1985, 27, 1–13. [Google Scholar] [CrossRef] [PubMed]
  44. Gadzuric, S.B.; Podunavac Kuzmanovic, S.O.; Jokic, A.I.; Vranes, M.B.; Ajdukovic, N.; Kovacevic, S.Z. Chemometric Estimation of Post-Mortem Interval Based on Na+ and K+ Concentrations from Human Vitreous Humour by Linear Least Squares and Artificial Neural Networks Modelling. Aust. J. Forensic Sci. 2014, 46, 166–179. [Google Scholar] [CrossRef]
  45. Pigaiani, N.; Bertaso, A.; De Palo, E.F.; Bortolotti, F.; Tagliaro, F. Vitreous Humor Endogenous Compounds Analysis for Post-Mortem Forensic Investigation. Forensic Sci. Int. 2020, 310, 110235. [Google Scholar] [CrossRef]
  46. Li, W.; Chang, Y.; Cheng, Z.; Ling, J.; Han, L.; Li, X.; Ding, Y. Vitreous Humor: A Review of Biochemical Constituents in Postmortem Interval Estimation. J. Forensic Sci. Med. 2018, 4, 85–90. [Google Scholar] [CrossRef]
  47. Lange, N.; Swearer, S.; Sturner, W.Q. Human Postmortem Interval Estimation from Vitreous Potassium: An Analysis of Original Data from Six Different Studies. Forensic Sci. Int. 1994, 66, 159–174. [Google Scholar] [CrossRef]
  48. Yang, M.; Li, H.; Yang, T.; Ding, Z.; Wu, S.; Qiu, X.; Liu, Q. A Study on the Estimation of Postmortem Interval Based on Environmental Temperature and Concentrations of Substance in Vitreous Humor. J. Forensic Sci. 2018, 63, 745–751. [Google Scholar] [CrossRef]
  49. Rognum, T.O.; Hauge, S.; Øyasaeter, S.; Saugstad, O.D. A New Biochemical Method for Estimation of Postmortem Time. Forensic Sci. Int. 1991, 51, 139–146. [Google Scholar] [CrossRef]
  50. Singh, D.; Prashad, R.; Parkash, C.; Bansal, Y.S.; Sharma, S.K.; Pandey, A.N. Linearization of the Relationship between Serum Sodium, Potassium Concentration, Their Ratio and Time since Death in Chandigarh Zone of North-West India. Forensic Sci. Int. 2002, 130, 1–7. [Google Scholar] [CrossRef]
Figure 1. The portable Fisic Medimate™ system, including the reader and the disposable microfluidic chip.
Forensicsci 05 00018 g001
Figure 2. A schematic design of the prefilled microfluidic chip. Microfluidic Electrophoresis System for Sample Separation and Conductivity Detection. The system consists of a closed channel and reservoir network prefilled with a background electrolyte fluid. The sample is introduced at position 1 into the evaporation chamber (2), after which electrophoresis occurs in the separation channel (3) using electrodes placed at region A. The separated species move through the flow path (4) towards the species conductivity detection zone (6), while the sample conductivity is initially detected at electrode E. The system also includes an expansion chamber (5) and a temperature-controlled reservoir (C) maintained at 22 °C. Background electrolyte reservoirs are located at B, and species conductivity detection electrodes are placed at D. This setup enables both sample and species conductivity detection during the electrophoresis process.
Forensicsci 05 00018 g002
Figure 3. A typical electropherogram with ion peaks from potassium, sodium and other ions, as measured with the Fisic Medimate™ system.
Forensicsci 05 00018 g003
Figure 4. Sodium peak area levels in Arbitrary Units (A.U).
Forensicsci 05 00018 g004
Figure 5. Potassium peak area levels in Arbitrary Units (A.U.).
Forensicsci 05 00018 g005
Figure 6. Sodium/potassium ratio; data from Table 2.
Forensicsci 05 00018 g006
Figure 7. Scatterplots of the observations related to the model (1). (Left): PMI up to 31 h. (Right): PMI up to 44.5 h. The least squares regression line is added.
Forensicsci 05 00018 g007
Figure 8. Residuals of the 31 h regression model (left) and the 44.5 h regression model (right).
Forensicsci 05 00018 g008
Table 1. Regression outputs for model (1). Left: PMI up to 31 h. Right: PMI up to 44.5 h.
Model Fit MeasuresModel Fit Measures
ModelRR2 ModelRR2
10.9820.965 10.9670.935
Model Coefficients—LN(Na+/K+)Model Coefficients—LN(Na+/K+)
PredictorEstimateSEtpPredictorEstimateSEtp
Intercept3.1820.03785.481<0.001Intercept3.1000.05061.723<0.001
PMI (h)−0.0480.002−24.499<0.001PMI (h)−0.0410.002−18.932<0.001
Table 2. Estimations for model (1) at different time spans.
Time SpanEstimated Model95% CI Slope95% CI Intercept
31 h l n y i = 0.048 x i + 3.182 0.052 , 0.044 3.104 , 3.259
44.5 h l n y i = 0.041 x i + 3.1 0.045 , 0.037 2.997 , 3.203
Disclaimer/Publisher’s Note: The statements, opinions and data contained in all publications are solely those of the individual author(s) and contributor(s) and not of MDPI and/or the editor(s). MDPI and/or the editor(s) disclaim responsibility for any injury to people or property resulting from any ideas, methods, instructions or products referred to in the content.

