
Peculiarities of Hematite Reduction Using Waste Activated Sludge (WAS) Carbonization Products

 ,
,
Abstract

1. Introduction
2. Materials and Methods
2.1. Precursors and Starting Materials
2.2. Preparation Method
2.3. Characterization
3. Results and Discussion
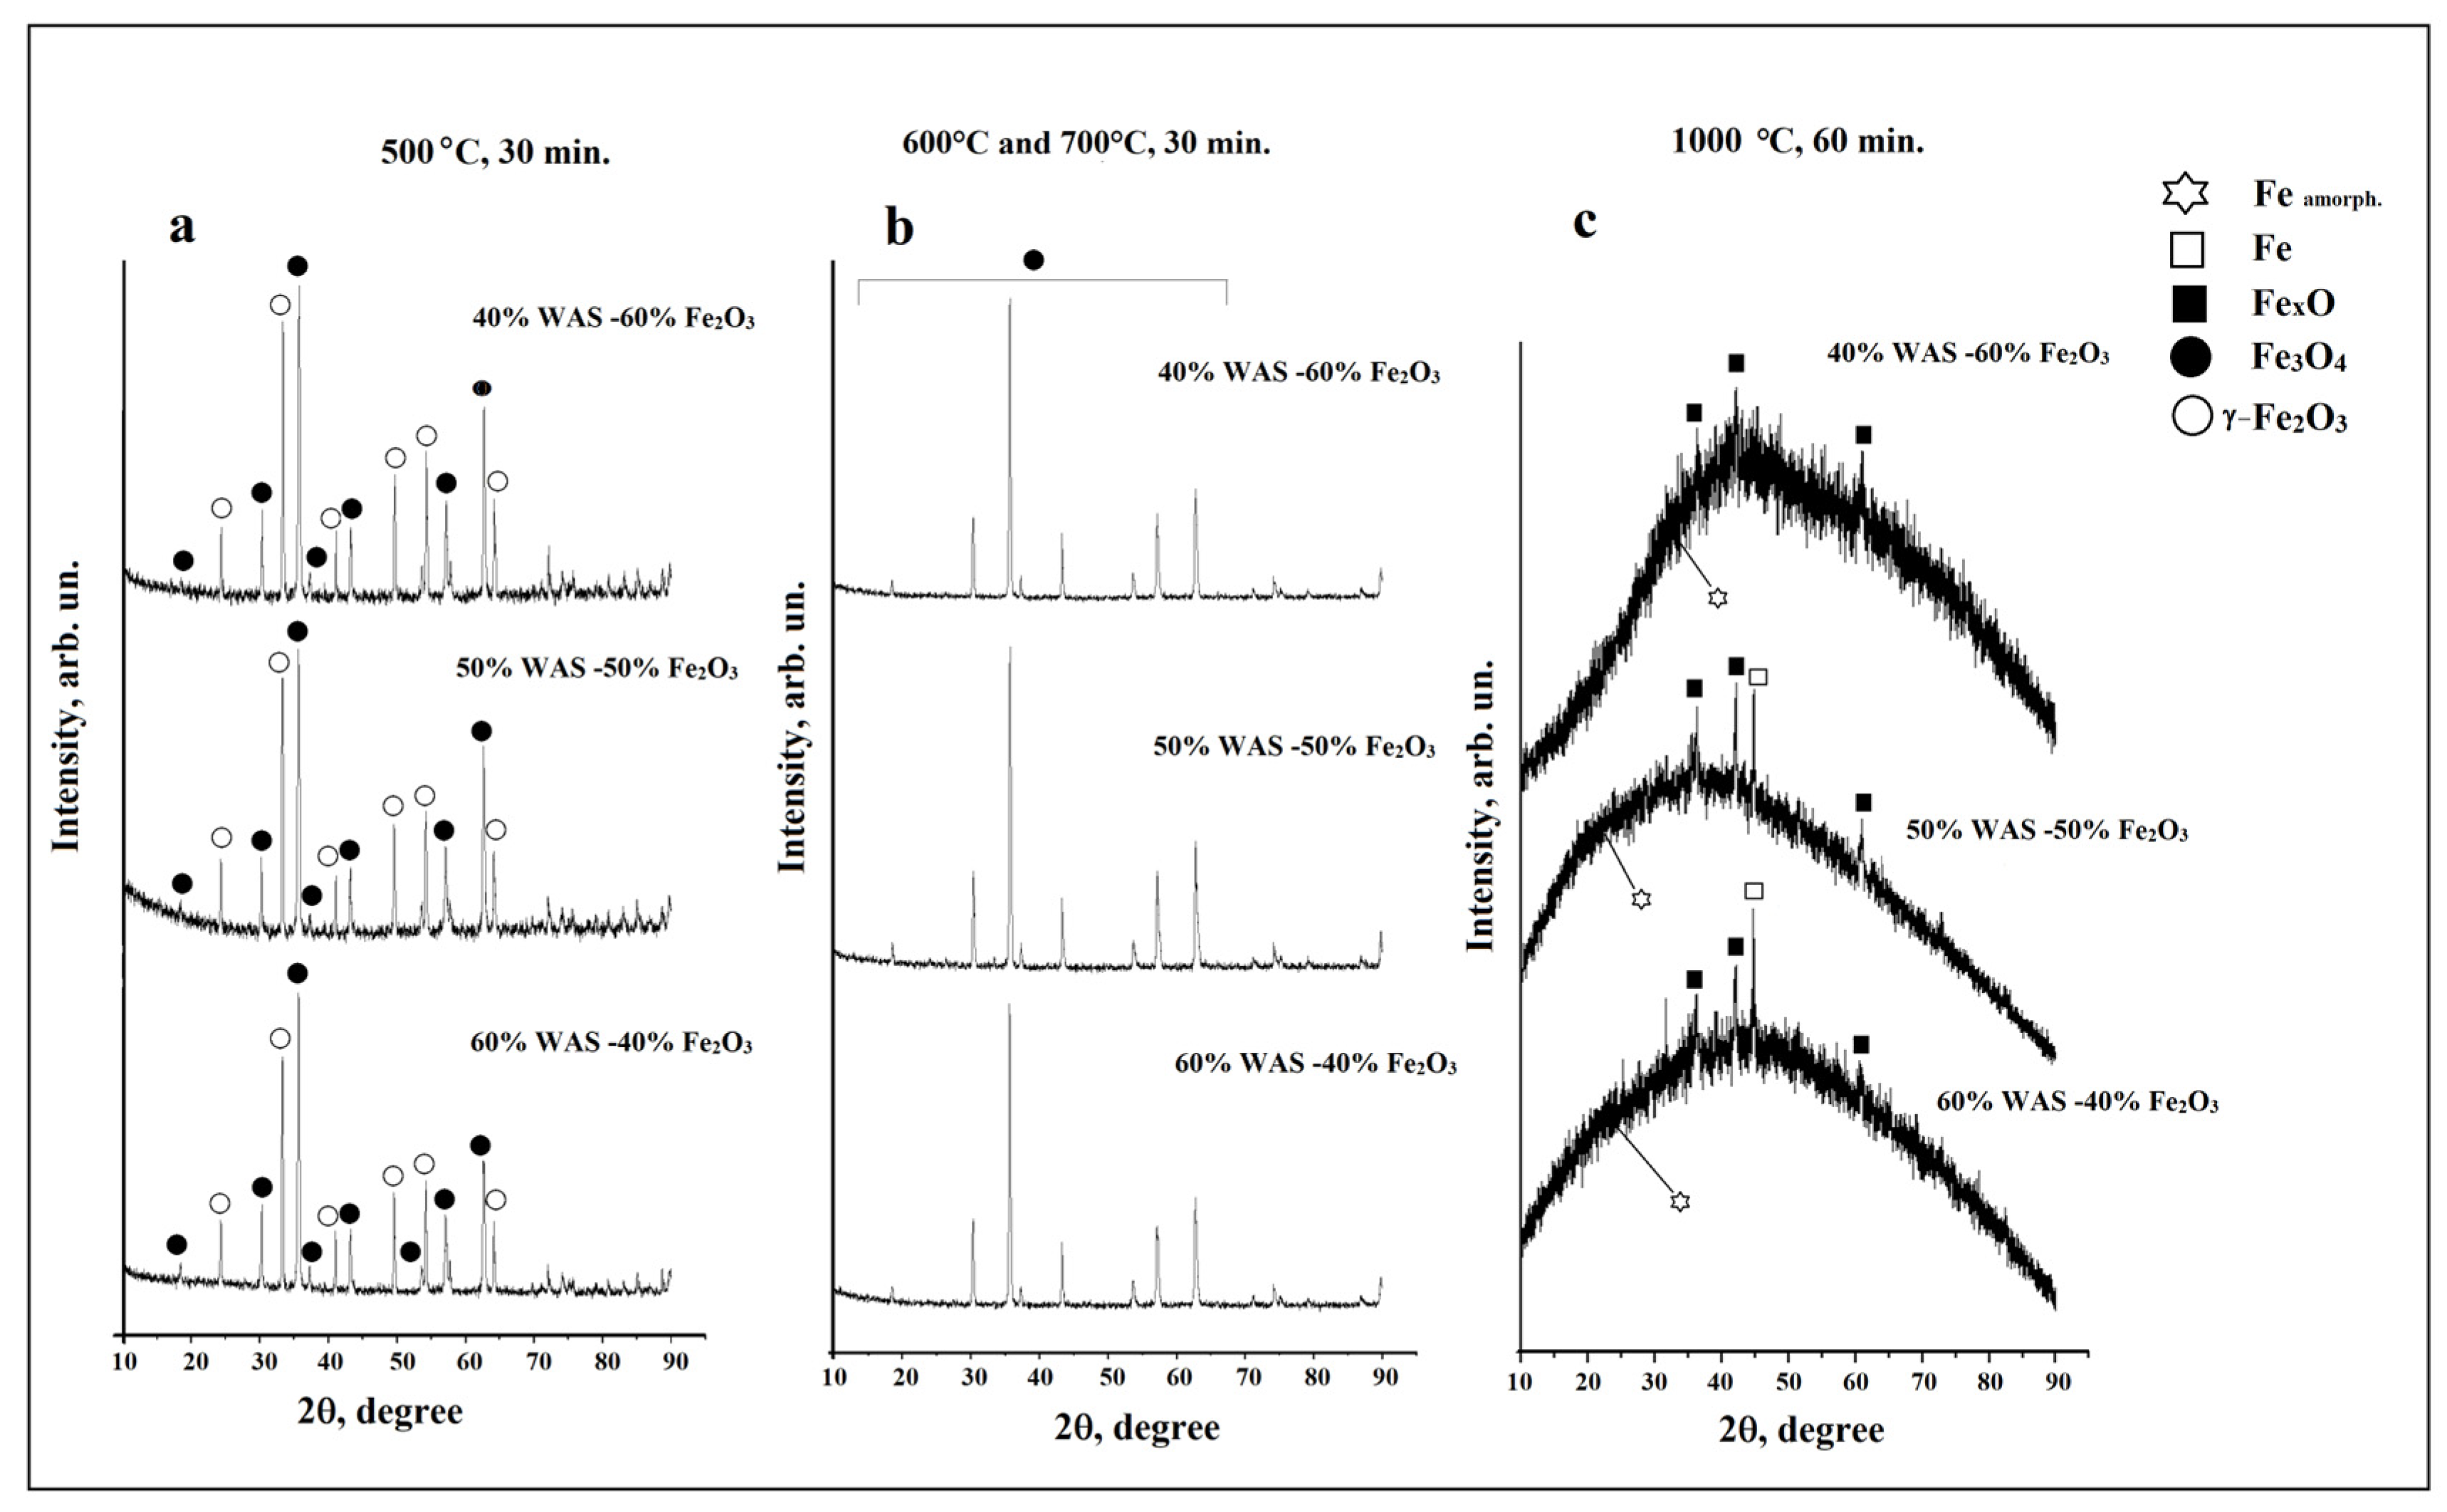
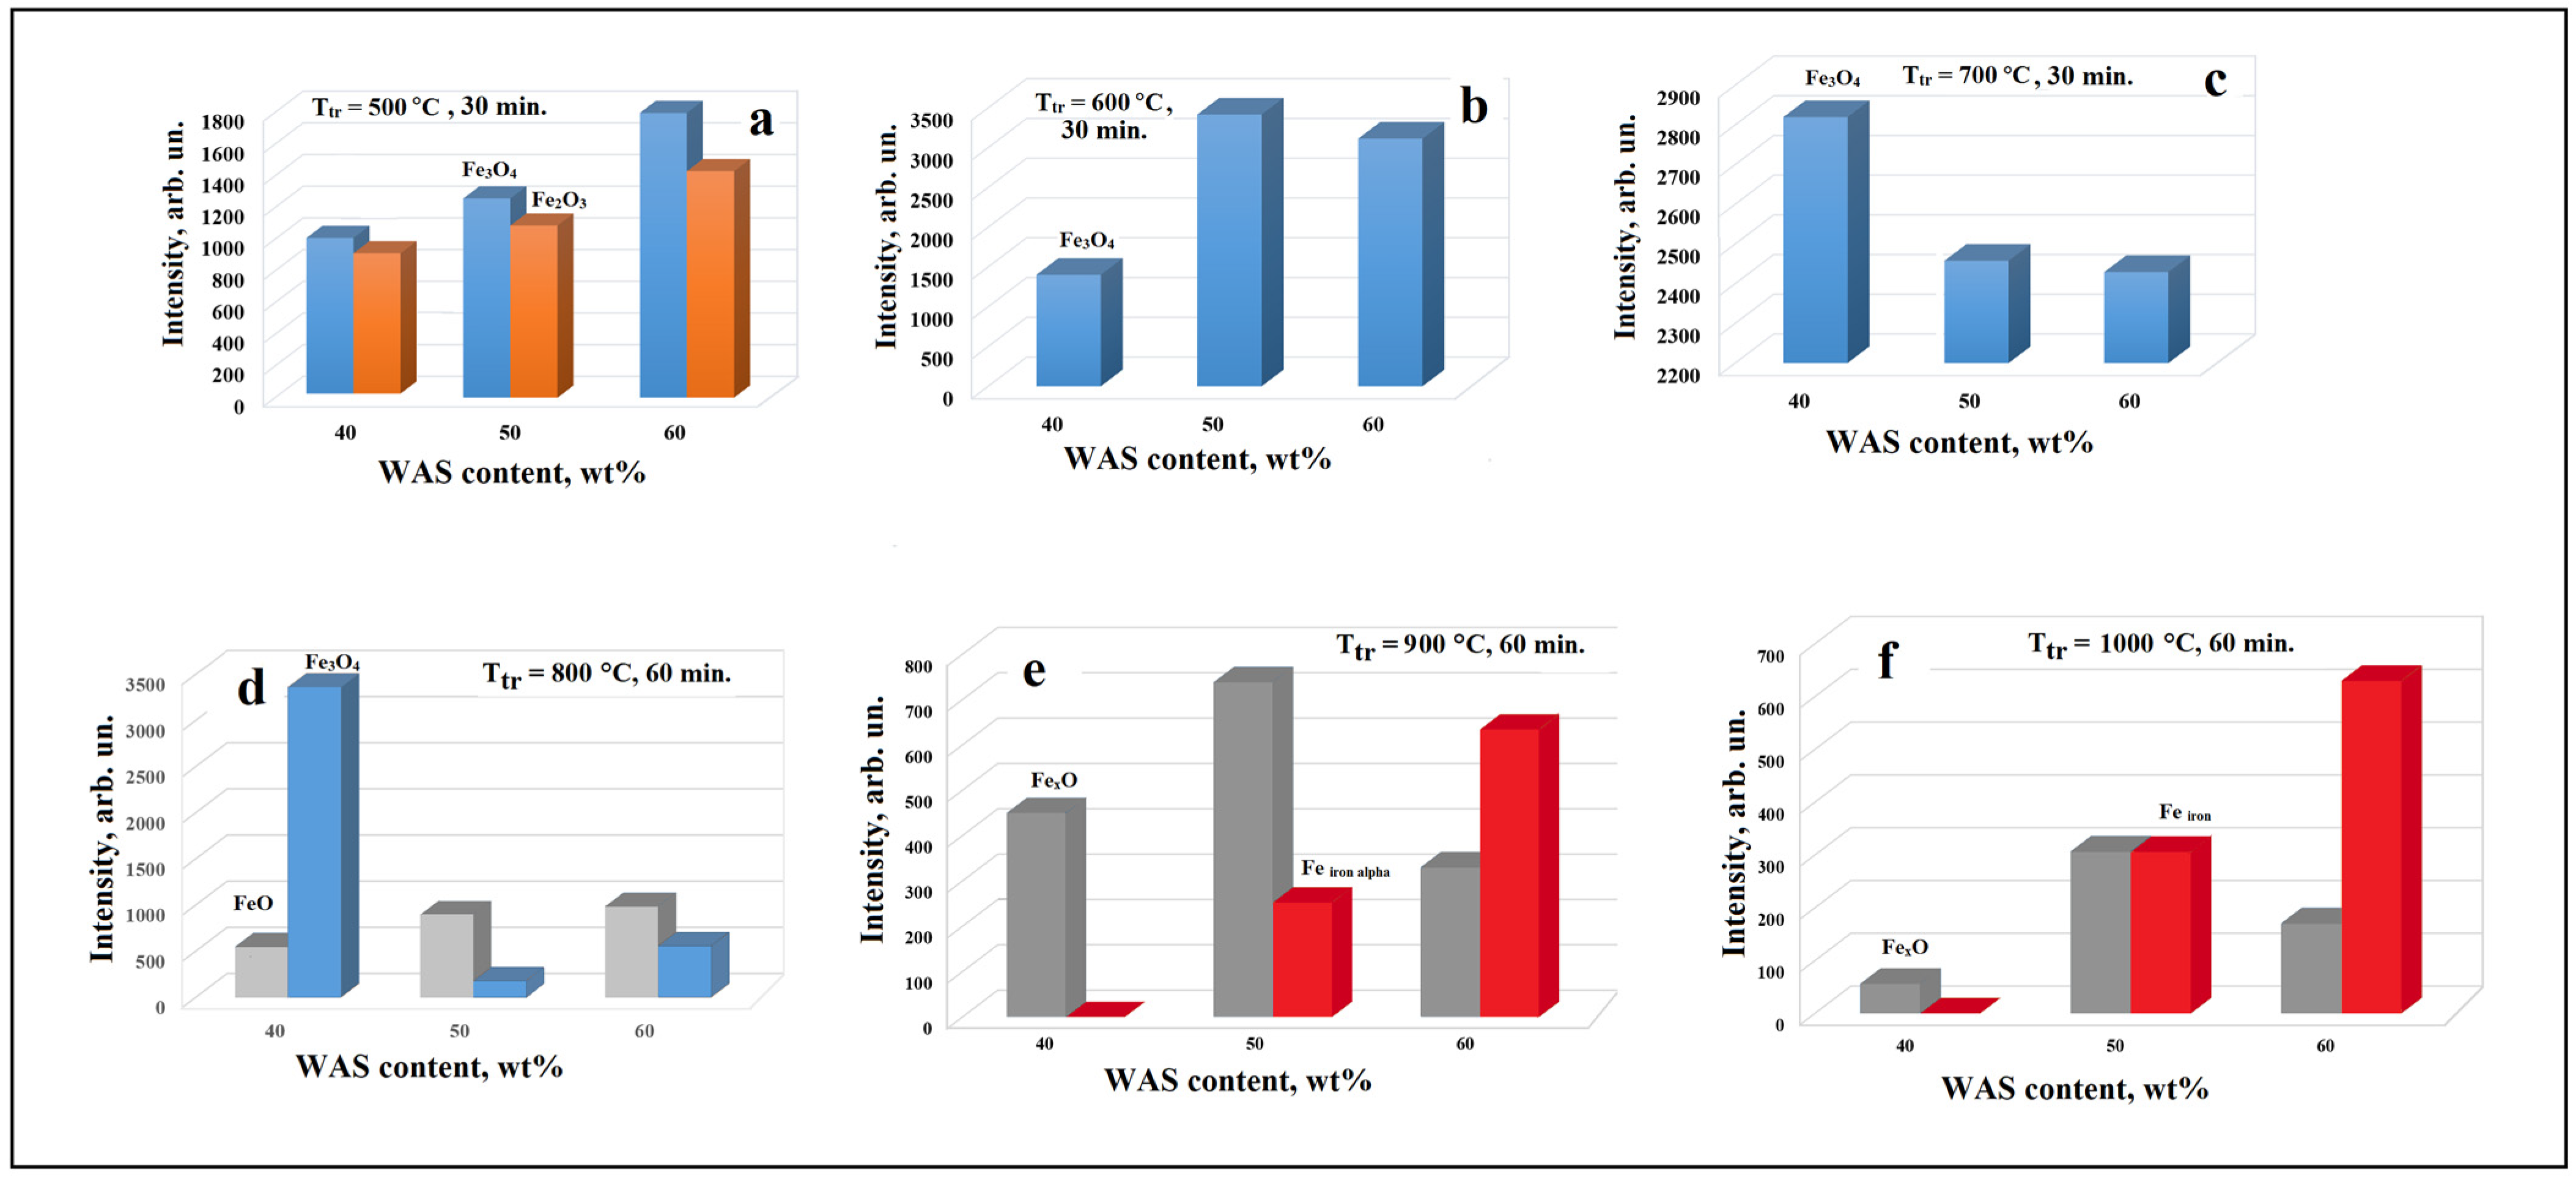
3.1. X-ray Data
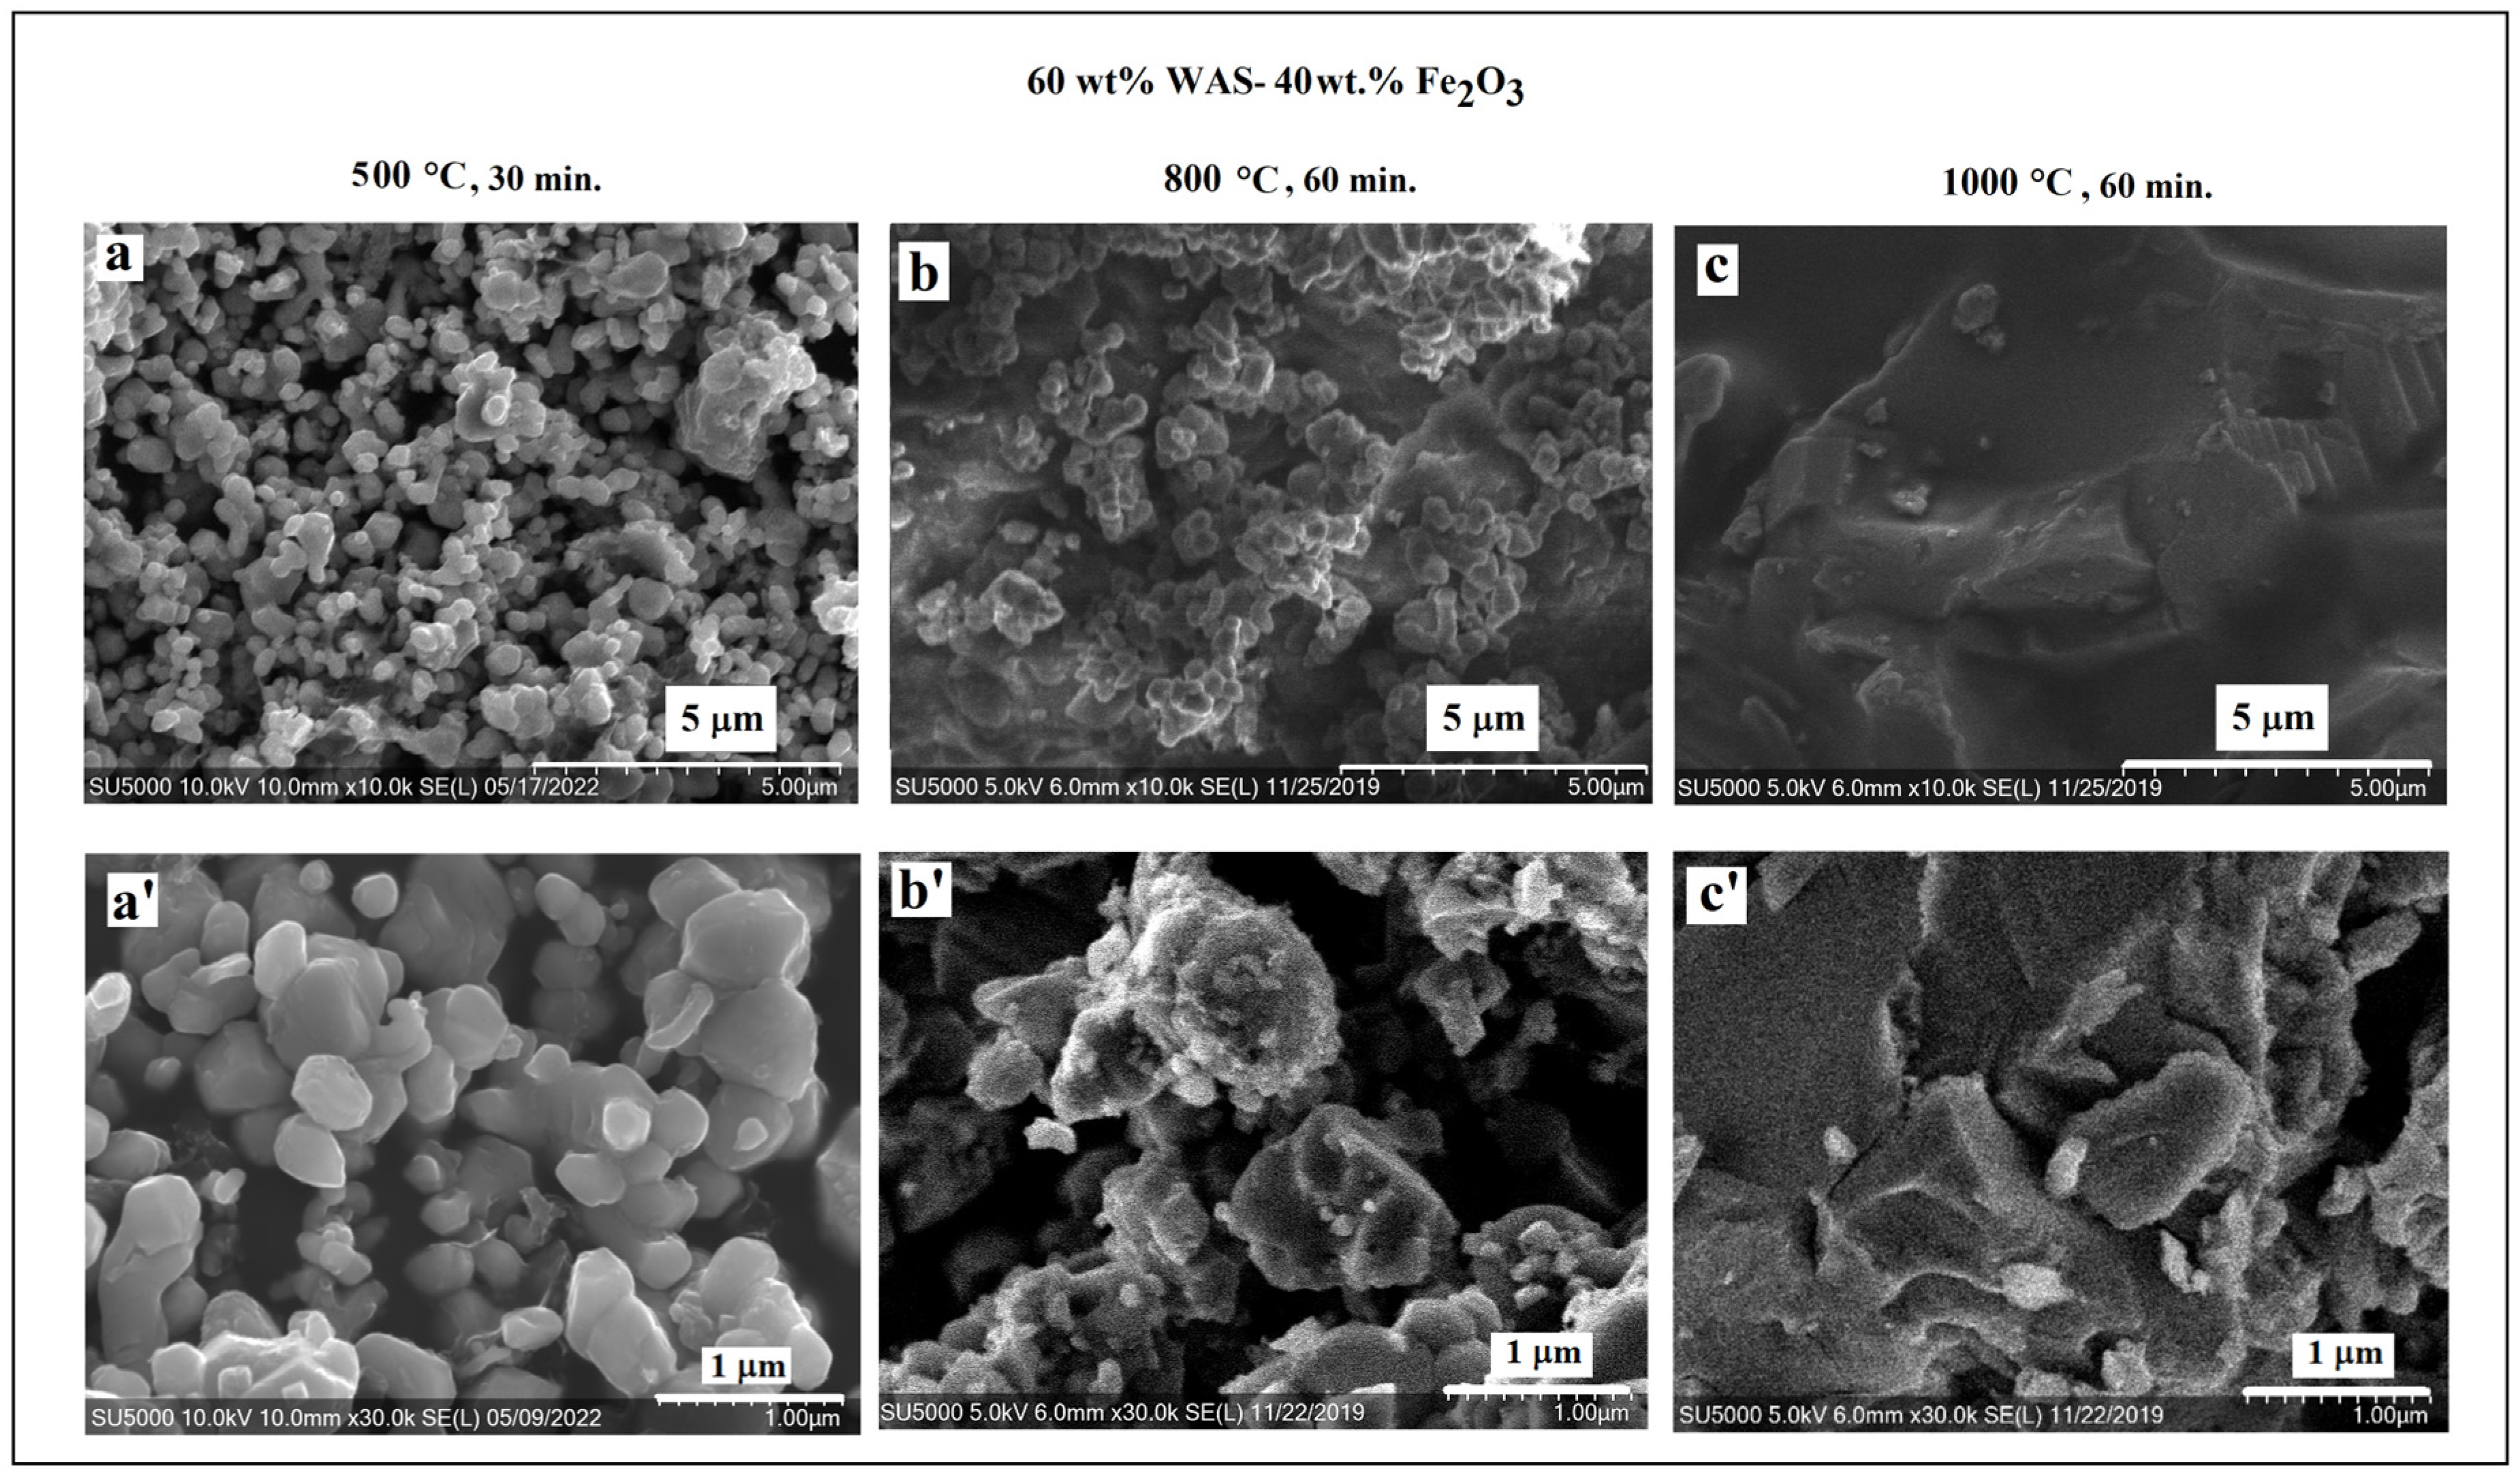
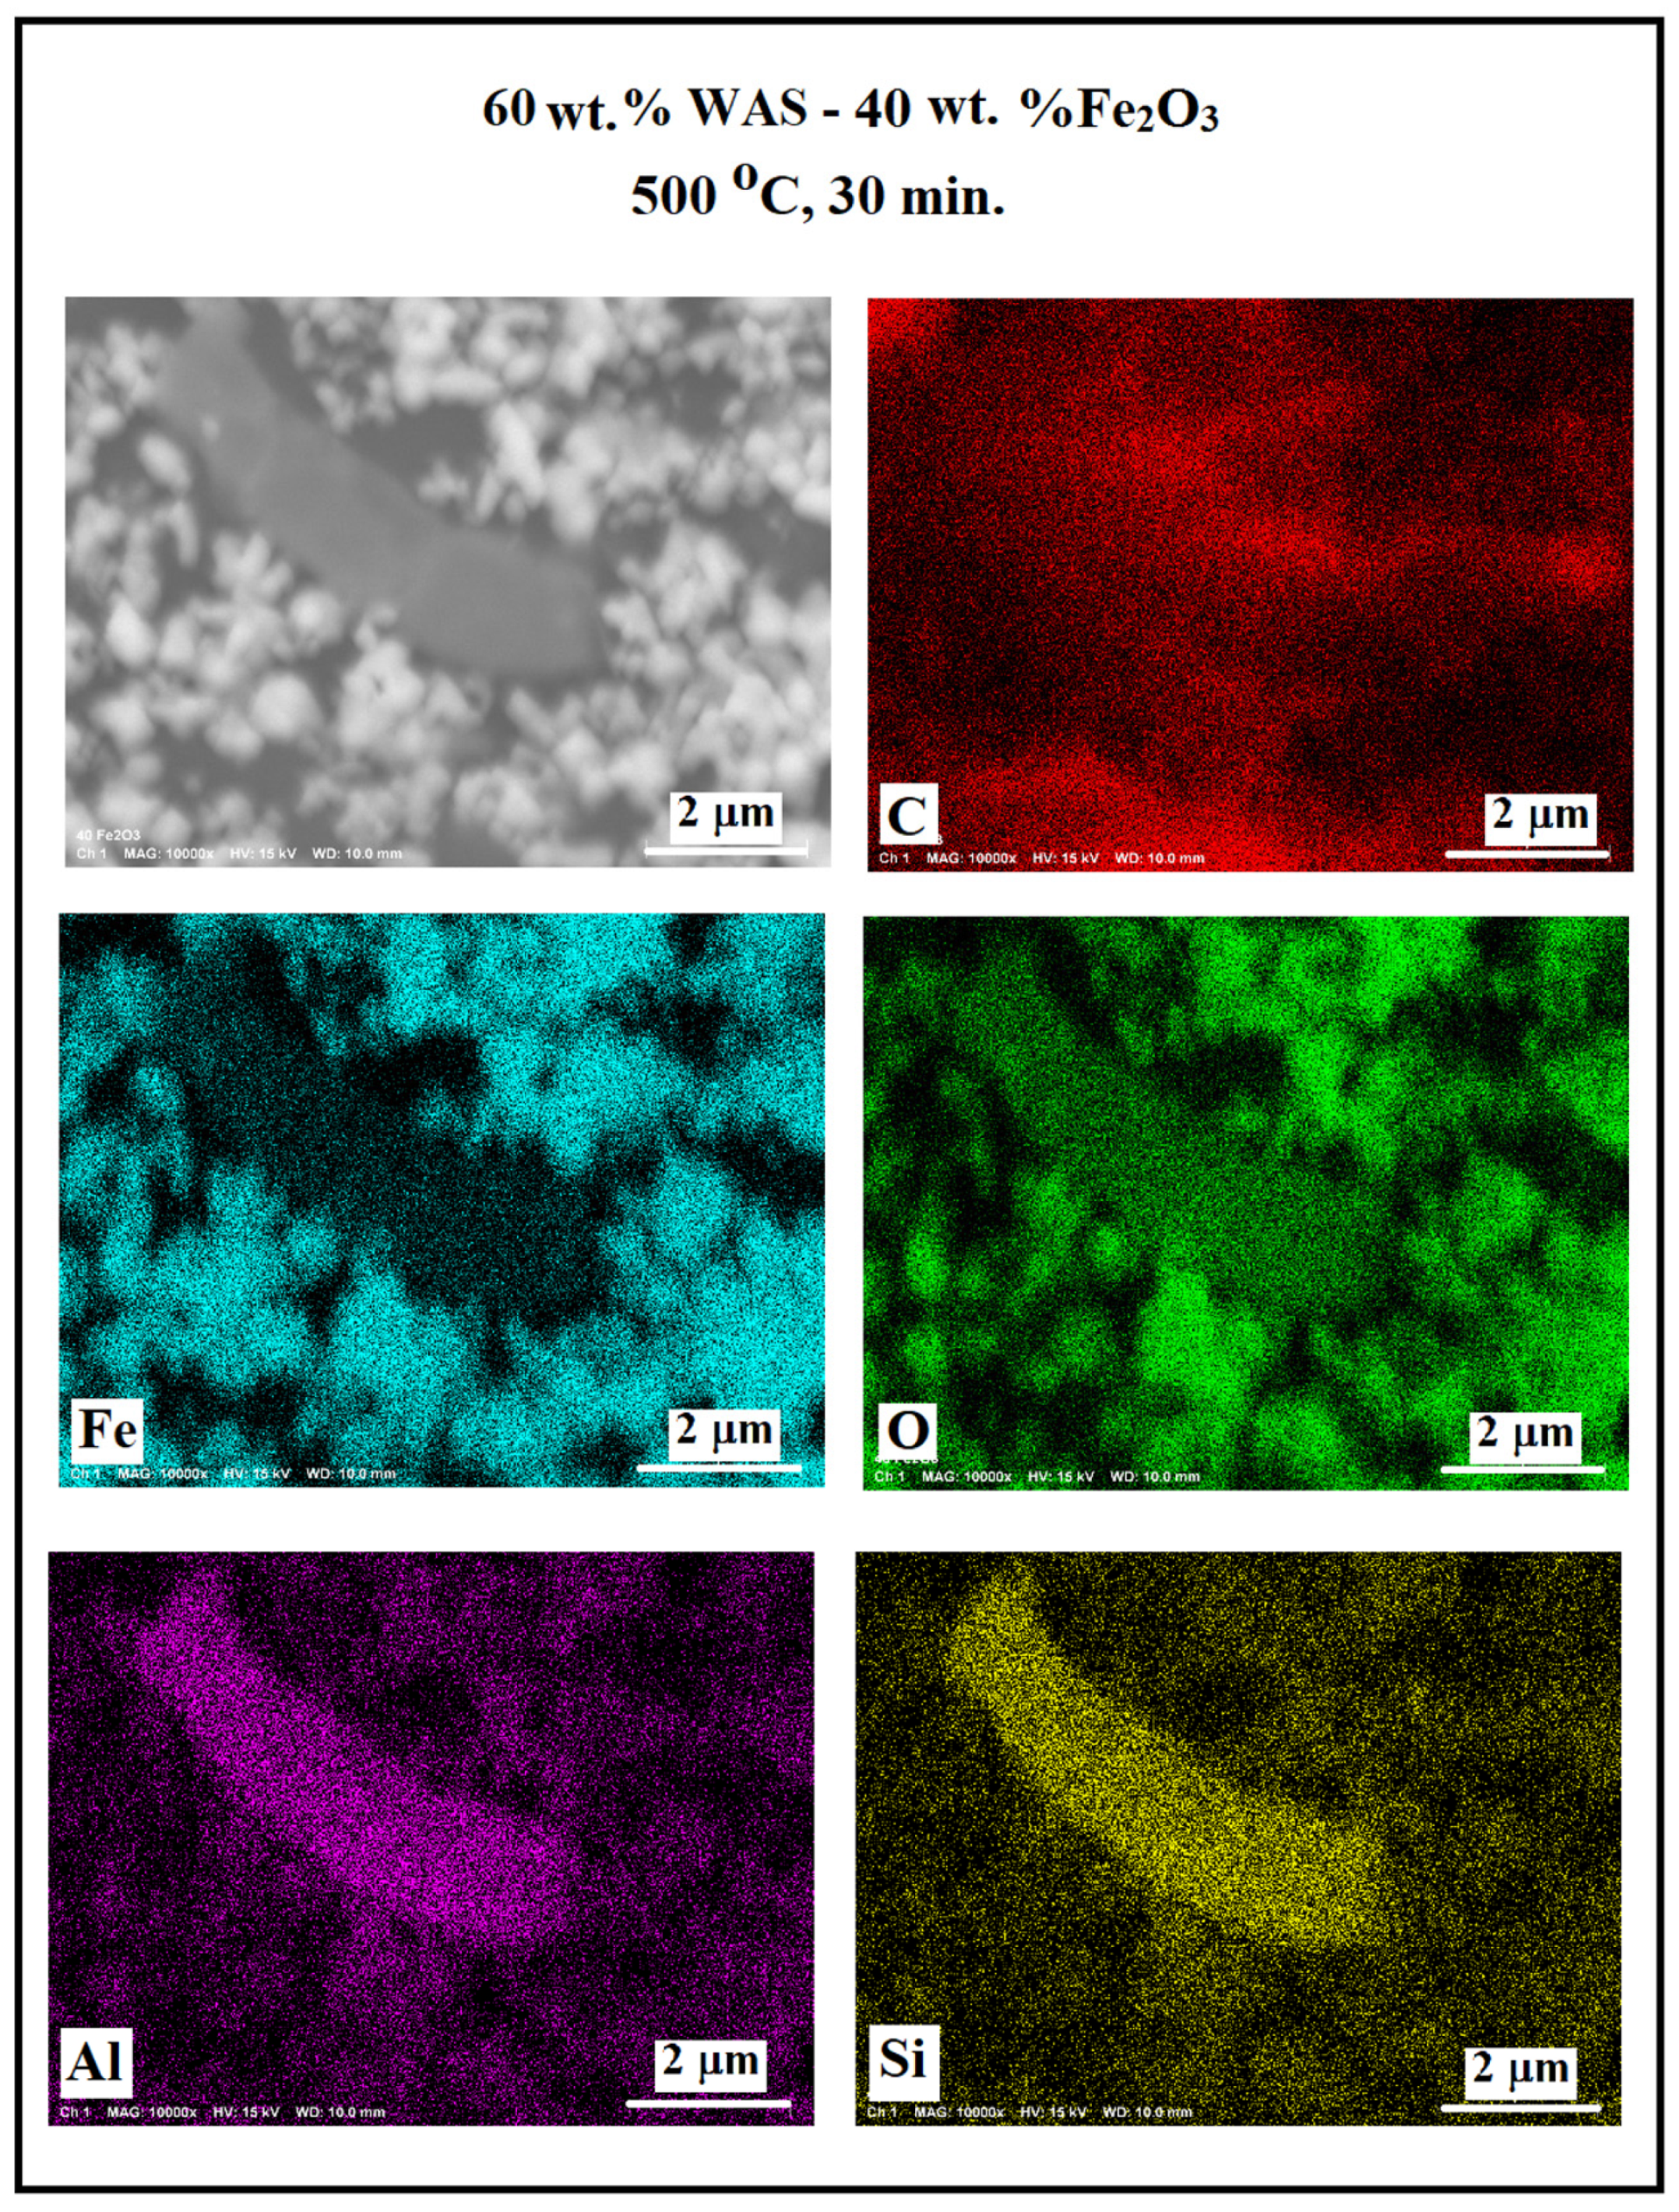
3.2. SEM/EDS Data
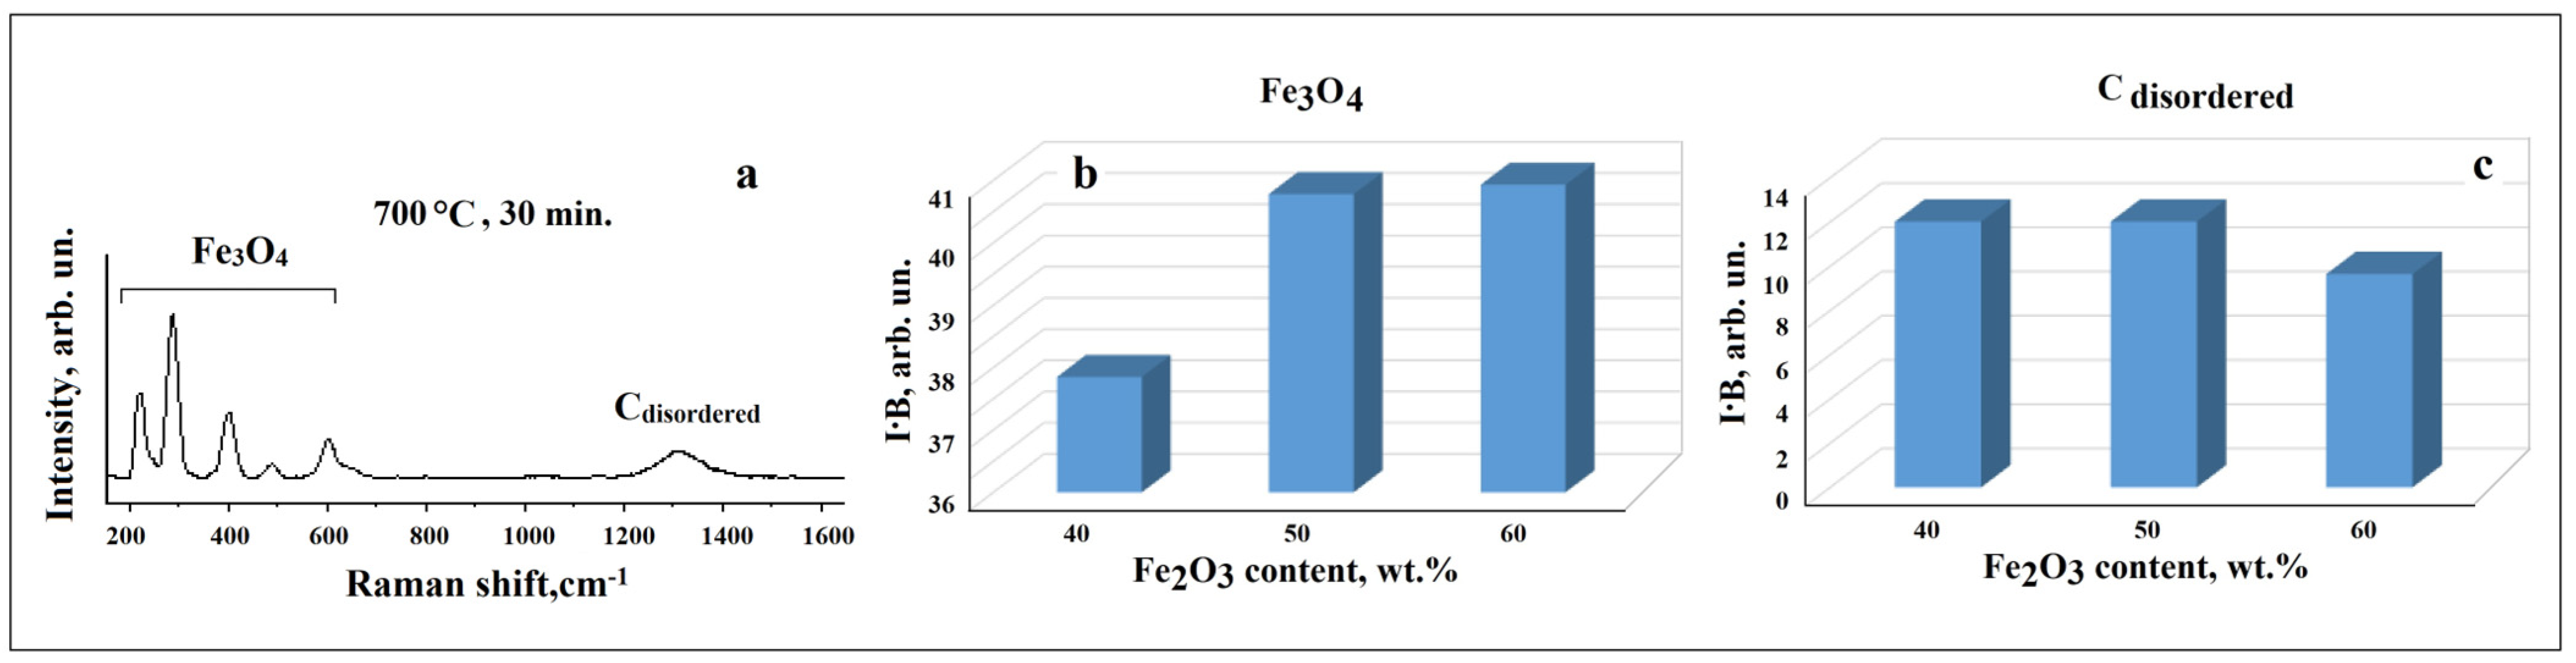
3.3. Raman Study
3.4. Electron Magnetic Resonance Study
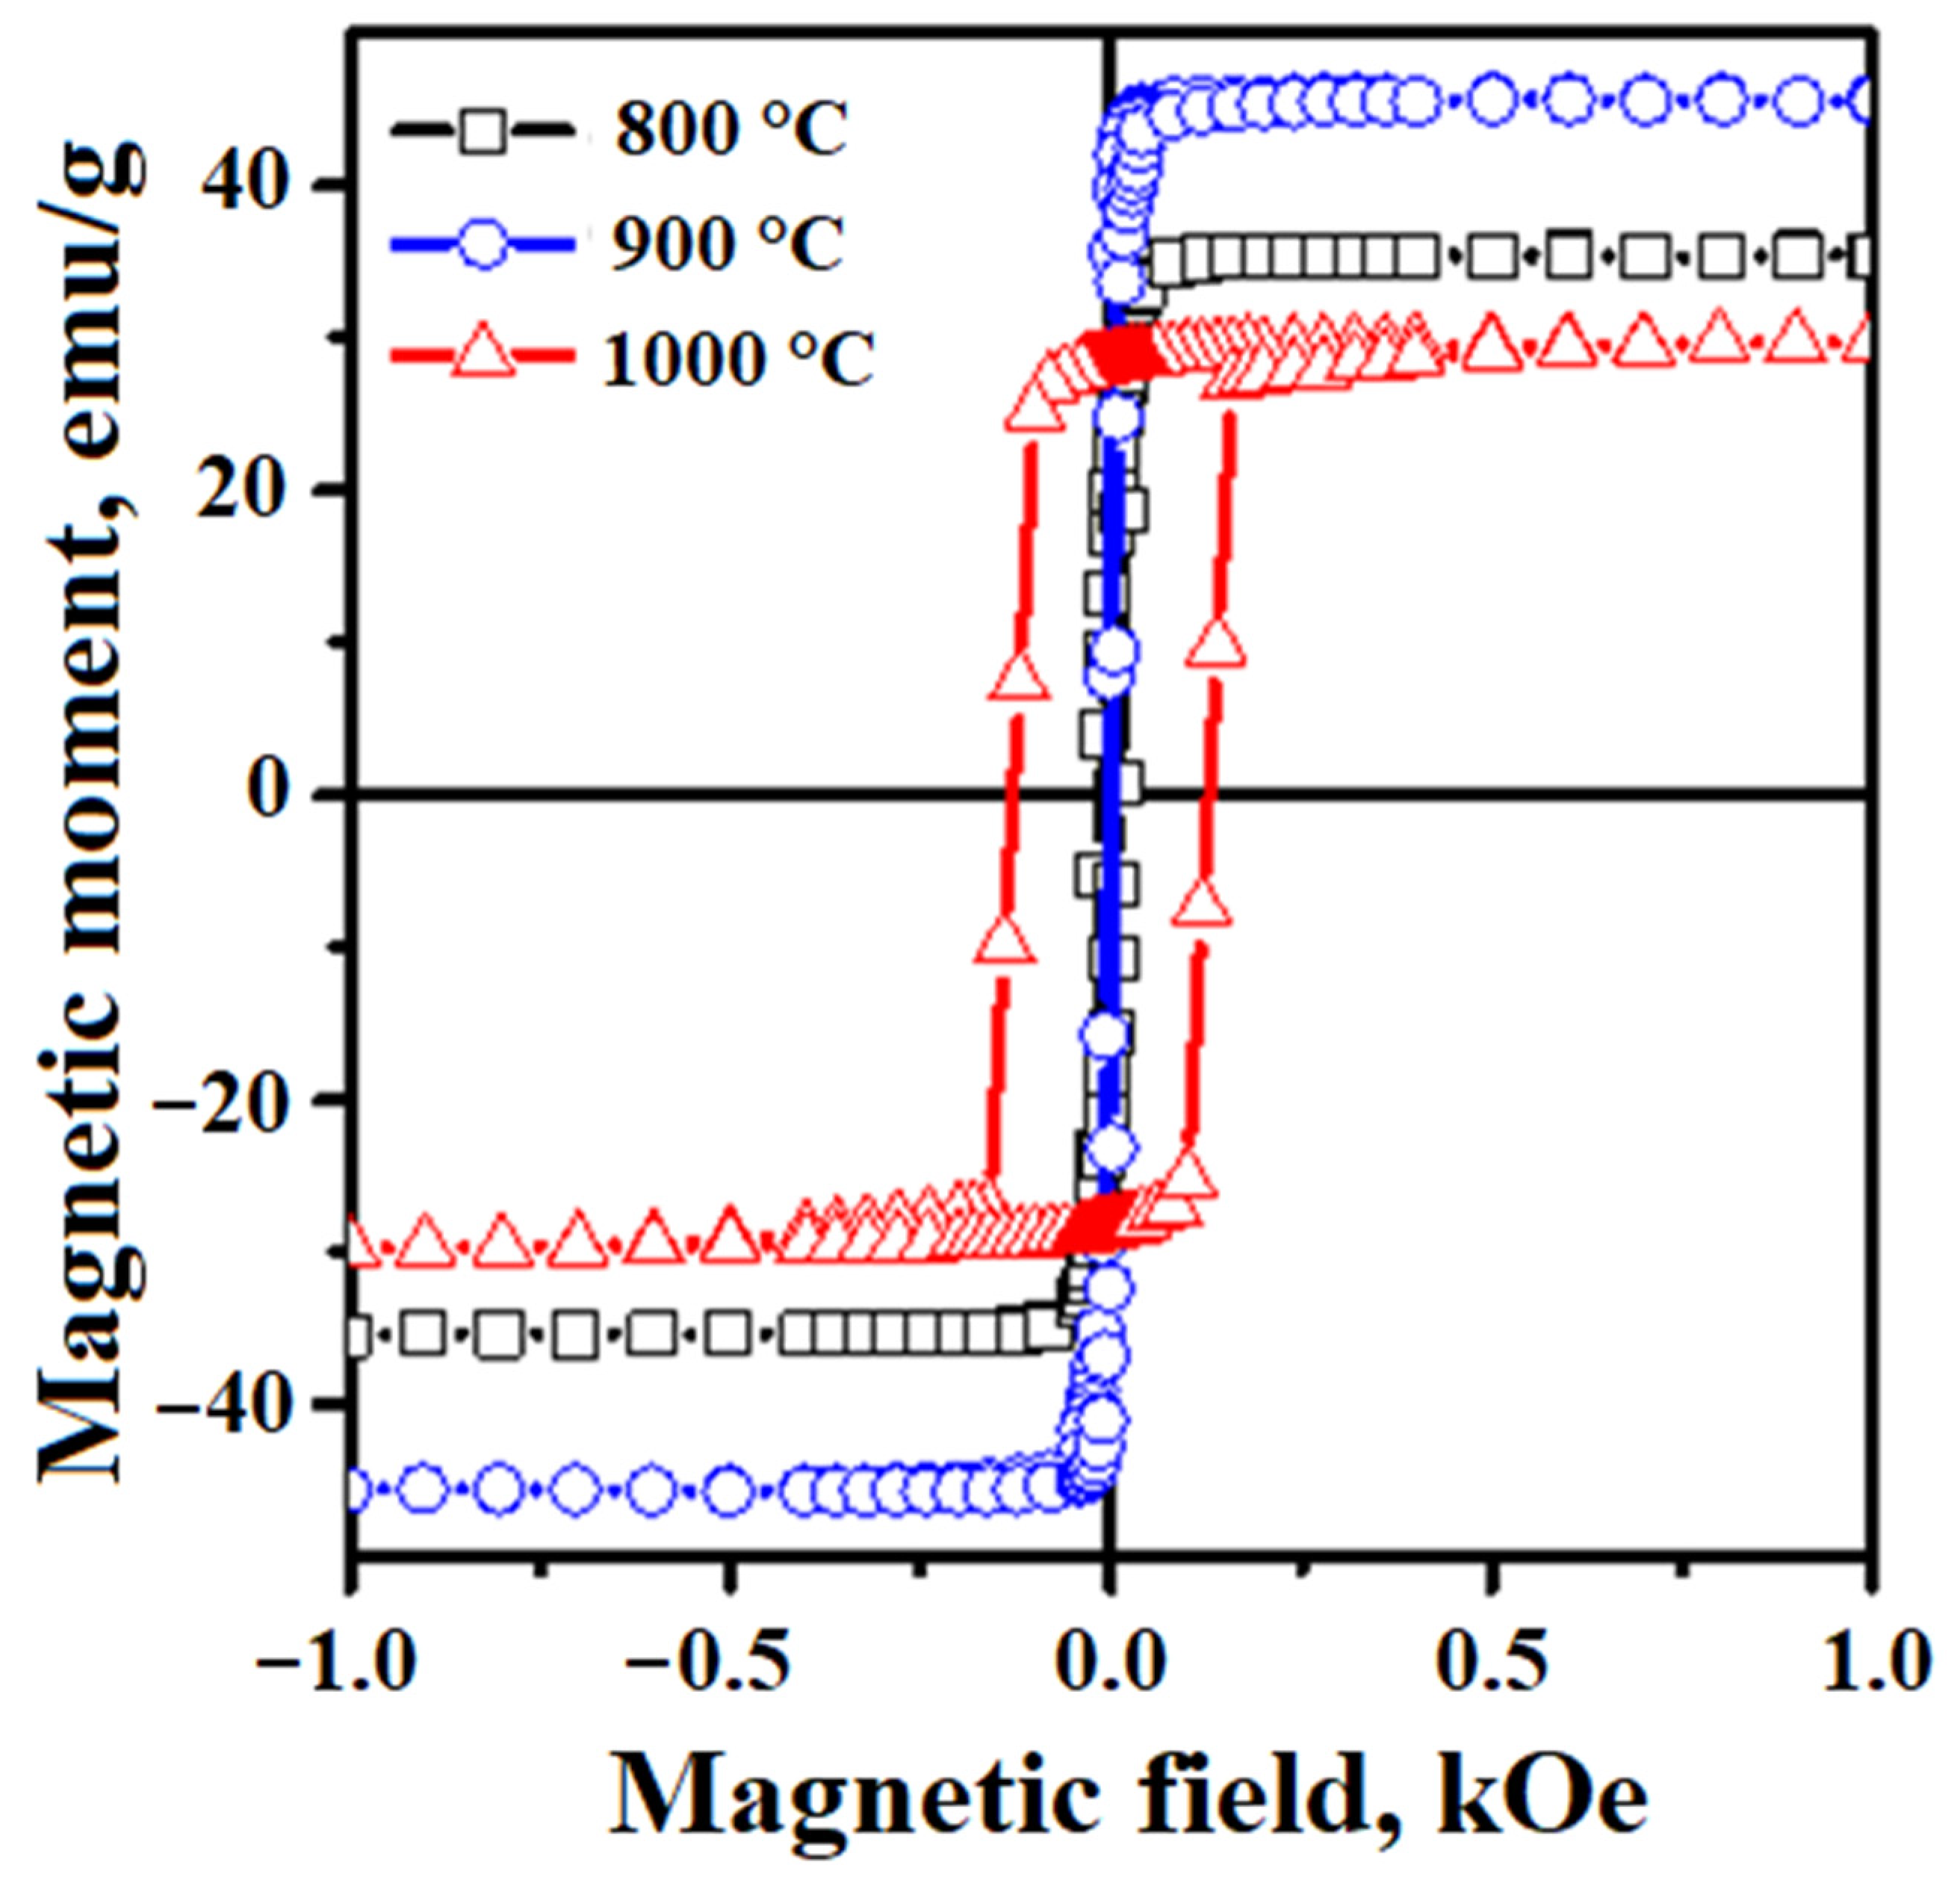
3.5. Study of Magnetic Properties
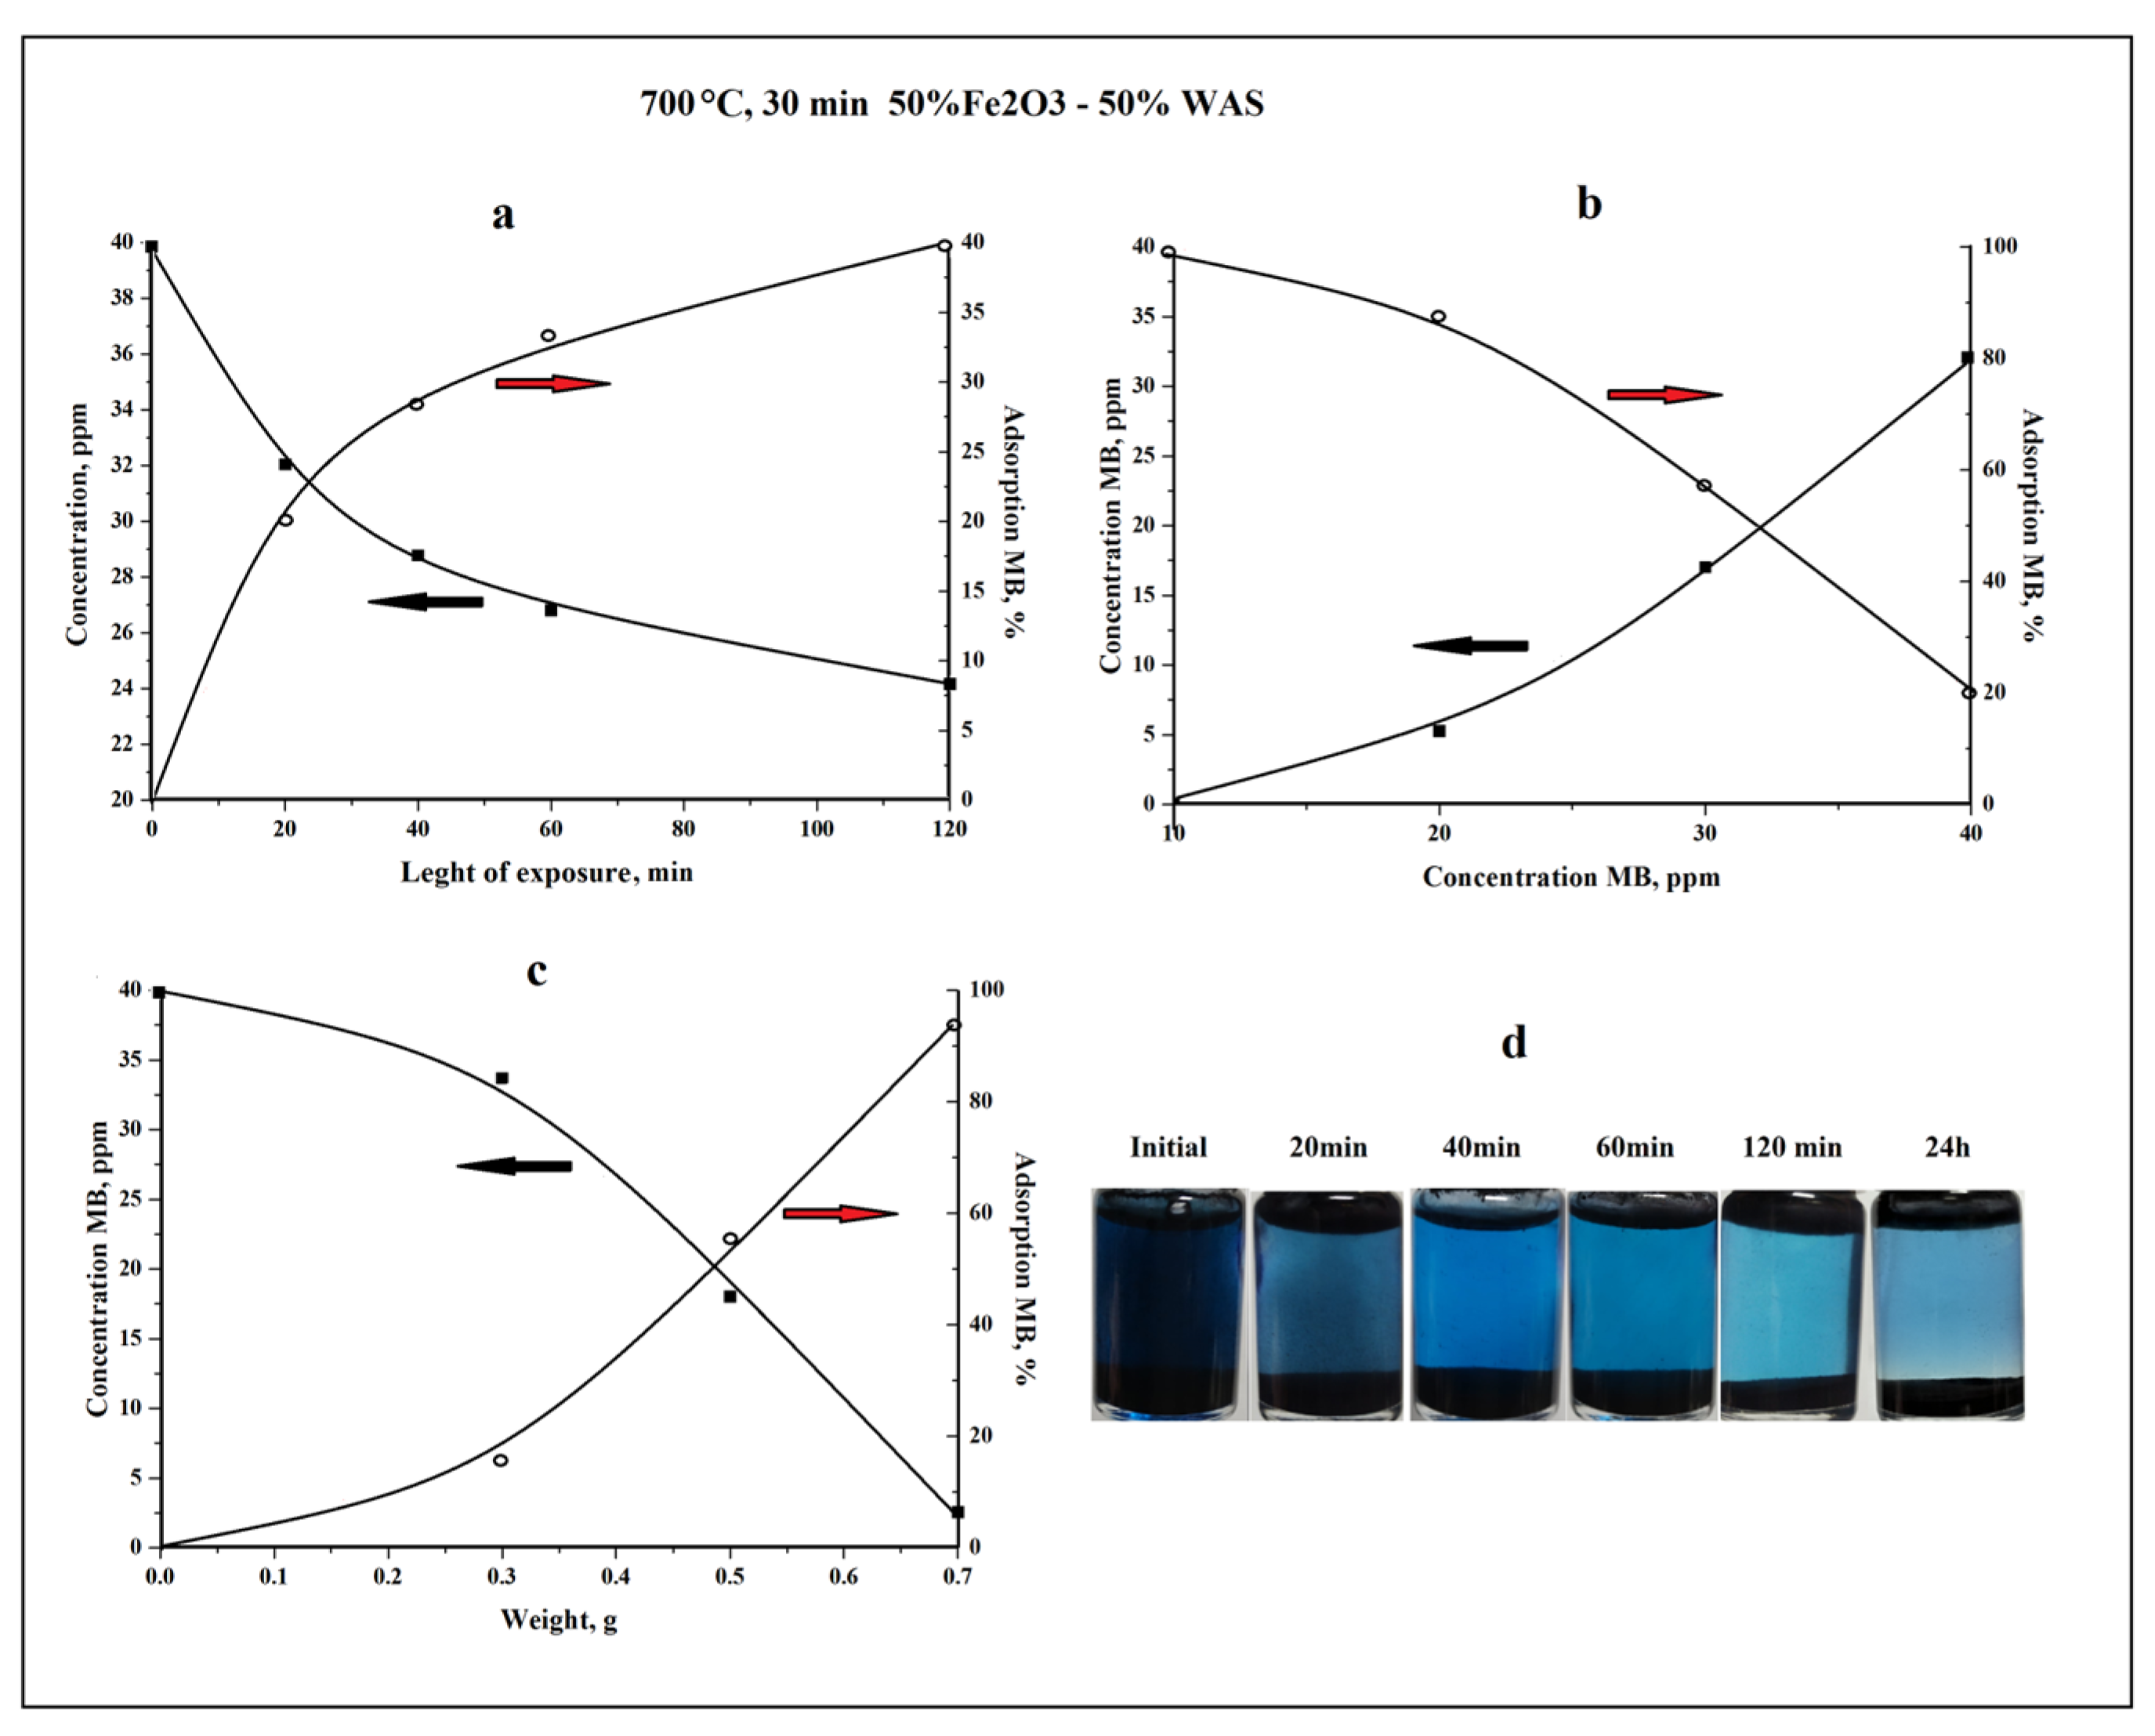
3.6. Adsorption Properties
4. Conclusions
5. Patents
Author Contributions
Funding
Data Availability Statement
Conflicts of Interest
References
- Richardson, F.D. Physical Chemistry of Melts in Metallurgy; Academic Press: London, UK, 1974. [Google Scholar]
- Kubaschewski, O.; Alcock, C.B. Metallurgical Thermochemistry, 5th ed.; Pergamon Press: Oxford, UK, 1979. [Google Scholar]
- Turkdogan, E.T. Physical Chemistry of High Temperature Technology; Academic Press: New York, NY, USA, 1980. [Google Scholar]
- Fukagawa, S. Studies on Metallurgical Processes Using Coal for Iron- and Gas-Production. Doctoral Thesis, The Royal Inst. of Tech, Stockholm, Sweden, 1983. [Google Scholar]
- Yusfin, Y.S.; Pashkov, N.F. Metallurgy of Iron: Textbook for High Schools; IKTs <<Akademkniga>>: Moscow, Russia, 2007; p. 464. (In Russia) [Google Scholar]
- Nokhrina, O.I.; Rozhihina, I.D.; Hodosov, I.E. The use of coal in a solid phase reduction of iron oxide. IOP Conf. Ser. Mater. Sci. Eng. 2015, 91, 012045. [Google Scholar] [CrossRef]
- Sun, Y.; Han, Y.; Gao, P.; Wei, X.; Li, G. Thermogravimetric study of coal-based reduction of oolitic iron ore: Kinetics and mechanisms. Int. J. Miner. Process. 2015, 143, 87–97. [Google Scholar] [CrossRef]
- Seaton, C.E.; Foster, J.S.; Velasco, J. Reduction Kinetics of Hematite and Magnetite Pellets Containing Coal Char. Trans. Iron Steel Inst. Jpn. 1983, 23, 490–496. [Google Scholar] [CrossRef]
- Dinelt, V.M.; Anikin, A.E.; Strakhov, V.M. Reduction of iron ore by means of lignite semicoke. Coke Chem. 2011, 54, 165–168. [Google Scholar] [CrossRef]
- Wang, H.; Hu, P.; Pan, D.; Tian, J.; Zhang, S.; Volinsky, A.A. Carbothermal Reduction Method for Fe3O4 Powder Synthesis. J. Alloys Compd. 2010, 502, 338–340. [Google Scholar] [CrossRef]
- Abu Tahari, M.N.; Salleh, F.; Tengku, S.; Dzakaria, N.; Samsuri, A.; Wahab, M.; Yarmo, M. Influence of hydrogen and various carbon monoxide concentrations on reduction behavior of iron oxide at low temperature. Int. J. Hydrogen Energy 2018, 44, 20751–20759. [Google Scholar] [CrossRef]
- Jozwiak, W.K.; Kaczmarek, E.; Maniecki, T.P.; Ignaczak, W.; Maniukiewicz, W. Reduction behavior of iron oxides in hydrogen and carbon monoxide atmospheres. Appl. Catal. A Gen. 2007, 326, 17–27. [Google Scholar] [CrossRef]
- Mondal, K.; Lorethova, H.; Hippo, E.; Wiltowski, T.; Lalvani, S.B. Reduction of iron oxide in carbon monoxide atmosphere-reaction controlled kinetics. Fuel Process. Technol. 2004, 86, 33–47. [Google Scholar] [CrossRef]
- Richard, M.A.; Soled, S.L.; Fiato, R.A.; DeRites, B.A. The behavior of iron oxides in reducing atmospheres. Mater. Res. Bull. 1983, 18, 829–833. [Google Scholar] [CrossRef]
- Monazam, E.R.; Breault, R.W.; Siriwardane, R.; Richards, G.; Carpenter, S. Kinetics of the reduction of hematite (Fe2O3) by methane (CH4) during chemical looping combustion: A global mechanism. Chem. Eng. J. 2013, 232, 478–487. [Google Scholar] [CrossRef]
- Hernández-Morelos, J.L.; Vlasova, M.; Márquez-Aguilar, P.A.; Parra-Parra, A. Peculiarities of the iron amorphous state stabilization during the reduction of Fe2O3 with waste activated sludge (WAS). MRS Adv. 2022, 7, 1011–1016. [Google Scholar] [CrossRef]
- Vlasova, M.; Márquez-Aguilar, P.A.; Hernández-Morelos, J.L.; Parra-Parra, A.; Guardian-Tapia, R.; Reséndiz-González, M.C. Obtaining of Electroheating Elements on the Basis of Products of Carbothermal Reduction of Fe2O3 by Waste Activated Slag (WAS). Waste Biomass Valor. 2022, 14, 1319–1332. [Google Scholar] [CrossRef]
- Vlasova, M.; Márquez-Aguilar, P.A.; Hernández-Morelos, J.L.; Parra-Parra, A.; Serrano, M.; Reséndiz-González, M.C.; Guardian-Tapia, R. Formation of the amorphous multicomponent iron-based alloy during carbothermal reduction of Fe2O3 by waste activated sludge. J. Non-Cryst. Solids X. 2022, 16, 100122. [Google Scholar]
- Vlasova, M.; Parra-Parra, A.; Márquez-Aguilar, P.A.; Trujillo-Estrada, A.; González-Molina, V.; Kakazey, M.; Tomila, T.; Gómez-Vidales, V. Closed Cycle of Recycling of Waste Activated Sludge. Waste Manag. 2018, 71, 320–333. [Google Scholar] [CrossRef]
- ECCACIV, La Planta Tratadora de Aguas Residuales Más Moderna de Latinoamérica. Available online: https://www.procivac.com/ECCACIV.htm (accessed on 22 September 2013).
- Belenkov, E.A.; Greshnyakov, V.A. Classification of structural varieties of carbon. Phys. Solid State. 2013, 55, 1754–1764. [Google Scholar] [CrossRef]
- Takeda, M.; Onishi, T.; Nakakubo, S.; Fujimoto, S. Physical properties of iron-oxide scales on Si-containing steels at high temperature. Mater. Trans. 2009, 50.9, 2242–2246. [Google Scholar] [CrossRef]
- Bursal, E.; Turkan, F.; Buldurun, K.; Turan, N.; Aras, A.; Çolak, N.; Murahari, M.; Yergeri, M.C. Transition metal complexes of a multidentate Schiff base ligand containing pyridine: Synthesis, characterization, enzyme inhibitions, antioxidant properties, and molecular docking studies. Biometals 2021, 34, 393–406. [Google Scholar] [CrossRef]
- Panta, P.; Bergmann, P.C. Raman Spectroscopy of Iron Oxide of Nanoparticles (Fe3O4). J. Mater. Sci. Eng. 2015, 5:1, 1000217. [Google Scholar]
- Merlen, A.; Buijnsters, J.G.; Pardanaud, C. A Guide to and Review of the Use of Multiwavelength Raman Spectroscopy for Characterizing Defective Aromatic Carbon Solids: From Graphene to Amorphous Carbons. Coatings 2017, 7, 153. [Google Scholar] [CrossRef]
- Sparavigna, A.C. Raman Spectroscopy of the Iron Oxides in the Form of Minerals, Particles and Nanoparticles. ChemRxiv 2023. [Google Scholar] [CrossRef]
- Koksharov, Y. Electronic magnetic resonance in inhomogeneous systems with reduced dimensions. Ph.D. Dissertation, Moscow State University, Moscow, Russia, 2013. [Google Scholar]
- Hamed, M.H.; Mueller, D.N.; Müller, M.J. Thermal phase design of ultrathin magnetic iron oxide films: From Fe3O4 to γ-Fe2O3 and FeO. J. Mater. Chem. C. 2020, 8, 1335–1343. [Google Scholar] [CrossRef]
- Jahagirdar, A.A.; Dhananjaya, N.; Monika, D.L.; Kesavulu, C.R.; Nagabhushana, H.; Sharma, S.C.; Nagabhushana, B.M.; Shivakumara, C.; Rao, J.L.; Chakradhar, R.P.S. Structural, EPR, optical and magnetic properties of α-Fe2O3 nanoparticles. Spectrochim. Acta. A Mol. Biomol. Spectrosc. 2013, 104, 512–518. [Google Scholar] [CrossRef] [PubMed]
- Yurkov, G.; Popkov, O.; Koksharov, Y.; Baranov, D.; Gubin, S. Fe-Containing Nanoparticles on the Surface of Silica Microgranules. Inorg. Mater. 2006, 42, 877–882. [Google Scholar] [CrossRef]
- Parry, L.G. Magnetic properties of dispersed magnetite powders. Philos. Mag. J. Theor. Appl. Phys. 2006, 11, 303–312. [Google Scholar] [CrossRef]
- Herzer, G. Modern soft magnets: Amorphous and nanocrystalline materials. Acta Mater. 2013, 61, 718–734. [Google Scholar] [CrossRef]
- Kong, F.L.; Chang, C.T.; Inoue, A.; Shalaan, E.; Al-Marzouki, F. Fe-based amorphous soft magnetic alloys with high saturation magnetization and good bending ductility. J. Alloys Compd. 2014, 615, 163–166. [Google Scholar] [CrossRef]
- Grinstaff, M.W.; Salamon, M.B.; Suslick, K.S. Magnetic properties of amorphous iron. Phys. Rev. B 1993, 48, 269–273. [Google Scholar] [CrossRef]
- Rashed, M.N. Adsorption Technique for the Removal of Organic Pollutants from Water and Wastewater. In Organic Pollutants-Monitoring: Risk and Treatment; IntechOpen: Rijeka, Croatia, 2013. [Google Scholar]
- Derbyshire, F.; Jagtoyen, M.; Andrews, R.; Rao, A.; Martin-Guillon, I.; Grulke, E.A. Carbon Materials in Environmental Applications. Chem. Phys. Carbon. 2000, 27, 1–66. [Google Scholar]
- Moreno-Castilla, C. Adsorption of organic molecules from aqueous solutions on carbon materials. Carbon 2004, 42, 83–94. [Google Scholar] [CrossRef]
- Frissel, M.J. The Adsorption of Some Organic Compounds, Especially Herbicides, on Clay Minerals; Centrum voor Landbouwpublikaties en Landbouwdocumentatie: Wageningen, The Nederland, 1961; 67p. [Google Scholar]
- Marouf, R.; Dali, N.; Budouara, N.; Ouadjenia, F.; Zahaf, F. Study of Adsorption Properties of Bentonite Clay. In Montmorillonite Clay; Uddin, F., Ed.; IntechOpen: London, UK, 2021. [Google Scholar]
- Phouthavong, V.; Yan, R.; Nijpanich, S.; Hagio, T.; Ichino, R.; Kong, L.; Li, L. Magnetic Adsorbents for Wastewater Treatment: Advancements in Their Synthesis Methods. Materials 2022, 15, 1053. [Google Scholar] [CrossRef]
- De Gisi, S.; Lofrano, G.; Grassi, M.; Notarnicola, M. Characteristics and adsorption capacities of low-cost sorbents for wastewater treatment: A review. Sustain. Mater. Technol. 2016, 9, 10–40. [Google Scholar] [CrossRef]
- Crini, G. Non-conventional low-cost adsorbents for dye removal: A review. Bioresour. Technol. 2005, 9, 1061–1085. [Google Scholar] [CrossRef] [PubMed]
- Zaman, S.; Yeasmin, S.; Inatsu, Y.; Ananchaipattana, C.; Latiful Bari, M. Low-Cost Sustainable Technologies for the Production of Clean Drinking Water—A Review. J. Environ. Prot. 2014, 5, 42–53. [Google Scholar] [CrossRef]
- Malavipathirana, S.; Wimalasiri, S.; Priyantha, N.; Wickramasooriya, S.; Welagedara, A.; Renman, G. Value Addition to Waste Material Supported by Removal of Available Phosphate from Simulated Brackish Water—A Low-Cost Approach. J. Geosci. Environ. Prot. 2013, 1, 7–12. [Google Scholar] [CrossRef]
- Gebrekidan, A.; Teferi, M.; Asmelash, T.; Gebrehiwet, K.; Hadera, A.; Amare, K.; Deckers, J.; Van Der Bruggen, B. Acacia etbaica as a Potential Low-Cost Adsorbent for Removal of Organochlorine Pesticides from Water. J. Water Resour. Prot. 2015, 7, 278–291. [Google Scholar] [CrossRef]
- El Ouardi, M.; Qourzal, S.; Alahiane, S.; Assabbane, A.; Douch, J. Effective Removal of Nitrates Ions from Aqueous Solution Using New Clay as Potential Low-Cost Adsorbent. J. Encapsulation Adsorpt. Sci. 2015, 5, 178–190. [Google Scholar] [CrossRef]
- Abagale, F.K. Seasonal Variation and Removal of Organic Pollutants in Wastewater Using Low-Cost Treatment Technologies in Tamale Metropolis, Ghana. J. Water Resour. Prot. 2021, 13, 271–282. [Google Scholar] [CrossRef]
- Shukla, A.; Zhang, Y.H.; Dubey, P.; Margrave, J.L.; Shukla, S.S. The role of sawdust in the removal of unwanted materials from water. J. Hazard. Mater. 2002, 95, 137–152. [Google Scholar] [CrossRef]
- Mohammed Ali, N.S.; Alalwan, H.A.; Alminshid, A.H.; Mohammed, M.M. Synthesis and Characterization of Fe3O4- SiO2 Nanoparticles as Adsorbent Material for Methyl Blue Dye Removal from Aqueous Solutions. Pollution 2022, 8, 295–302. [Google Scholar]
- Wang, C.; Zhong, H.; Wu, W.; Pam, C.; Wei, X.; Zhou, G.; Yang, F. Fe3O4@C Core–Shell Carbon Hybrid Materials as Magnetically Separable Adsorbents for the Removal of Dibenzothiophene in Fuels. ACS Omega 2019, 4, 1652–1661. [Google Scholar] [CrossRef]
- Ivanova, O.S.; Edelman, I.S.; Sokolov, A.E.; Svetlistsky, E.S.; Zharkov, S.M.; Sukhachev, A.L.; Lin, C.R.; Chen, Y.Z. Adsorption of Organic Dyes by Fe3O4@C, Fe3O4@C@C, and Fe3O4@SiO2 Magnetic Nanoparticles. Bull. Russ. Acad. Sci. Phys. 2023, 87, 338–342. [Google Scholar] [CrossRef]
- Saboniana, M.; Mahanpoor, K. Photocatalytic Degradation of Dye Pollutant in Synthetic Wastewater by Nano-Fe3O4 Based on Clinoptilolite Zeolite. Arch. Hyg. Sci. 2021, 10, 1–10. [Google Scholar] [CrossRef]
- Mollahosseini, A.; Toghroli, M. Synthesis and Identification of Fe3O4/Clinoptilolite Magnetic Nanocomposite. J. Asian Sci. Res. 2015, 5, 120–125. [Google Scholar] [CrossRef]
- Lau, Y.Y.; Wong, Y.S.; Teng, T.T.; Morad, N.; Rafatullah, M.; Ong, S.A. Degradation of cationic and anionic dyes in coagulation–flocculation process using bi-functionalized silica hybrid with aluminum-ferric as auxiliary agent. RSC Adv. 2015, 5, 34206–34215. [Google Scholar] [CrossRef]
- Biswal, S. Application of Iron Oxide Nanoparticles for Removal of Heavy Metals from Waste Water—A Review. Inglomayor C 2018, 14, 25–38. [Google Scholar]
- Ahmadpour, A.; Do, D.D. The preparation of active carbons from coal by chemical and physical activation. Carbon 1996, 34, 471–479. [Google Scholar] [CrossRef]
- Xiang, H.; Ren, G.; Zhong, Y.; Xu, D.; Zhang, Z.; Wang, X.; Yang, X. Fe3O4@C Nanoparticles Synthesized by In Situ Solid-Phase Method for Removal of Methylene Blue. Nanomaterials 2021, 11, 330. [Google Scholar] [CrossRef]
- Shen, Y.; Guan, C.; Huang, Y.; Zhang, P.; Lai, X.; Du, H.; Xu, X.; Li, J.; Zhang, W.; Qiu, K.; et al. Preparation of a Fe3O4@C magnetic materials with high adsorption capacity of methylene blue. Ferroelectrics 2020, 566, 94–103. [Google Scholar] [CrossRef]
- Bastami., T.R.; Enterazi, M. Activated carbon from carrot dross combined with magnetite nanoparticles for the efficient removal of p-nitrophenol from aqueous solution. Chem. Eng. J. 2012, 210, 510–519. [Google Scholar] [CrossRef]
- Rivera-Utrilla, J.; Sánchez-Polo, M.; Gómez-Serrano, V.; Alvarez, P.M.; Alvim-Ferraz, M.C.M.; Dias, J.M. Activated carbon modifications to enhance its water treatment applications. An overview. J. Hazard. Mater. 2011, 187, 1–23. [Google Scholar] [CrossRef]


| Elements | Content, % |
|---|---|
| Organic material | 80.20 |
| clay + sand | 19.80 |
| type of WAS | organic sludge in wastewater |
| texture | steaming slimy sand |
| Formula | C | SiO2 | CaO | Al2O3 | Fe2O3 | ZnO | K2O | TiO2 | CuO | Σ |
|---|---|---|---|---|---|---|---|---|---|---|
| WAS after treatment | 98.65% | 0.66% | 0.12% | 0.17% | 0.15% | 0.035% | 0.02% | 0.02% | 0.06% | 0.115 |
| Type of Mixture, wt.% | Ttr, °C; ttr, Min. | Content of Elements, wt.% | ||||
|---|---|---|---|---|---|---|
| Fe | C | O | Si | Al | ||
| 40 WAS-60 Fe2O3 | 500; 30 600; 30 800; 60 1000; 60 | 46.51 44.00 66.22 91.64 | 21.64 20.00 6.09 2.63 | 31.00 30.05 27.07 4.97 | 0.23 0.13 0.2 0.14 | 0.62 0.39 0.41 0.61 |
| 50 WAS-50 Fe2O3 | 500; 30 600; 30 800; 60 1000; 60 | 48.43 37.00 58.02 92.9 | 17.57 28.00 19.82 2.65 | 33.33 28.80 20.18 1.61 | 0.59 1.99 1.02 1.31 | 0.12 0.58 0.96 2.34 |
| 60 WAS-40 Fe2O3 | 500; 30 600; 30 800; 60 1000; 60 | 55.61 34.99 49.14 86.11 | 14.37 32.00 15.00 3.08 | 29.23 25.50 30.95 9.70 | 0.09 0.72 3.76 0.35 | 0.7 1.28 1.15 0.86 |
| Reduction Conditions | Composition of Mixtures, wt.% | |||||
|---|---|---|---|---|---|---|
| 60 Fe2O3-40 WAS | 50 Fe2O3-50 WAS | 40 Fe2O3-60 WAS | ||||
| Ms, emu/g | Hc, Oe | Ms, emu/g | Hc, Oe | Ms, emu/g | Hc, Oe | |
| 600 °C, 30 min | 76.17 | 40.8 | 78.2 | 107 | 77.3 | 80.4 |
| 700 °C, 30 min | 74.32 | 95 | 76.98 | 125 | 74.15 | 105 |
| 800 °C, 60 min | 35 | 25 | ||||
| 900 °C, 60 min | 44 | 24 | ||||
| 1000 °C, 60 min | 40 | 150 | ||||
Disclaimer/Publisher’s Note: The statements, opinions and data contained in all publications are solely those of the individual author(s) and contributor(s) and not of MDPI and/or the editor(s). MDPI and/or the editor(s) disclaim responsibility for any injury to people or property resulting from any ideas, methods, instructions or products referred to in the content. |
© 2024 by the authors. Licensee MDPI, Basel, Switzerland. This article is an open access article distributed under the terms and conditions of the Creative Commons Attribution (CC BY) license (https://creativecommons.org/licenses/by/4.0/).
Share and Cite
Parra Parra, A.; Vlasova, M.; Aguilar, P.A.M.; Morelos, J.L.H.; Nava, M.E.S. Peculiarities of Hematite Reduction Using Waste Activated Sludge (WAS) Carbonization Products. Compounds 2024, 4, 548-561. https://doi.org/10.3390/compounds4030033
Parra Parra A, Vlasova M, Aguilar PAM, Morelos JLH, Nava MES. Peculiarities of Hematite Reduction Using Waste Activated Sludge (WAS) Carbonization Products. Compounds. 2024; 4(3):548-561. https://doi.org/10.3390/compounds4030033
Chicago/Turabian StyleParra Parra, Abigail, Marina Vlasova, Pedro Antonio Márquez Aguilar, Jorge Luis Hernández Morelos, and Manuel Eduardo Serrano Nava. 2024. "Peculiarities of Hematite Reduction Using Waste Activated Sludge (WAS) Carbonization Products" Compounds 4, no. 3: 548-561. https://doi.org/10.3390/compounds4030033
APA StyleParra Parra, A., Vlasova, M., Aguilar, P. A. M., Morelos, J. L. H., & Nava, M. E. S. (2024). Peculiarities of Hematite Reduction Using Waste Activated Sludge (WAS) Carbonization Products. Compounds, 4(3), 548-561. https://doi.org/10.3390/compounds4030033