Article

Influence of Water on Aging Phenomena of Calendric Stored and Cycled Li-Ion Batteries

1
Materials Research Institute (IMFAA), Aalen University, Beethovenstr. 1, 73430 Aalen, Germany
2
CARISSMA Institute of Electric, Connected and Secure Mobility (C-ECOS), Technische Hochschule Ingolstadt (THI), Esplanade 10, 85049 Ingolstadt, Germany
3
Hiden Analytical GmbH, Kaiserswerther Straße 215, 40474 Düsseldorf, Germany
*
Author to whom correspondence should be addressed.
Nanoenergy Adv. 2024, 4(2), 174-195; https://doi.org/10.3390/nanoenergyadv4020011
Submission received: 14 December 2023 / Revised: 10 March 2024 / Accepted: 23 May 2024 / Published: 19 June 2024

Abstract

:
We examine the impact of water (160 ± 41 ppm of reference) on the anode, cathode, separator and electrolyte in two aging scenarios: calendric aging (60 °C, 80 days, charged state), resulting in a triggered current interrupt device (CID), and cycling 1680 times (charge/discharge with 1C, 2.75–4.2 V, 20 ± 2 °C), resulting in 24.5% residual capacity. We applied computer tomography (CT), scanning electron microscopy (SEM), energy dispersive spectroscopy (EDS) and secondary ion mass spectrometry (SIMS) to understand the capacity loss. The aged NMC/LCO–graphite cells were compared to a reference cell in pristine state. Both aging scenarios showed (a) thick depositions on the anode and cathode consisting mainly of oxygen, fluorine and phosphorous, (b) reduced separator pore sizes, (c) the deposition of Mn, Co and Ni on top of the anode and (d) the decomposition of the conductive salt LiPF6 accompanied by HF formation and a loss of active lithium. Calendric aging consumes the water content and additionally leads to (e) the decomposition of the organic solvent followed by CO2 gas formation. Cyclic aging increases the water content and additionally results in (f) the consumption of the additive fluoroethylene carbonate (FEC). These findings show how water affects aging phenomena and results in a capacity decrease in the cell.

1. Introduction

The increasing use of electric cars, bicycles and scooters makes the development and production of long-life batteries very important. Many efforts have already been made to understand the aging processes, and the resulting knowledge has been used to develop new active materials as well as to improve and optimize existing products.
The aging process changes the morphology and chemical composition of the anode, cathode and electrolyte. In addition, it changes the “solid electrolyte interface” (SEI) formed between the anode and electrolyte and the “cathode electrolyte interface” (CEI) formed between the cathode and electrolyte. The chemical changes in SEI and CEI can be very complex.
The first charging process initiates the formation of the solidelectrolyte interface (SEI), which covers the surface completely after two cycles. It has an average thickness of about 25 nm [1]. On the one hand, the SEI has to guarantee lithium ion transport and prevent electron transport. It also has to adjust to changes in volume due to lithium de/intercalation [2]. On the other hand, the SEI changes due to cycling and thermal storage. The SEI grows and increases internal resistance. Salt degradation products (inorganic depositions) and reduction products of the solvent of the electrolyte (organic depositions) are precipitated. Peled et al. (2017) assume that the inner area is dominated by inorganic products and the outer area is dominated by organic products and that there is a smooth transition from dissolved to precipitated products [3,4]. Due to the different types of active materials, binder composition and electrolyte, the deposition products can be different [4,5,6,7,8]. Free, cyclable lithium is fixed in the deposition products and leads to capacity loss in the cell.
The cathode electrolyte interface (CEI) is built as a reaction interface between the cathode and electrolyte. In contrast to the anode, the CEI has no function within the properly working cell [8]. The composition of the CEI can be correlated directly to the aging mechanism. The structural degradation of the cathode leads to phase transition (a layered–spinel–rock salt structure) [9] and migration of Ni, Mn and Co into the electrolyte. This enriches Ni, Mn and Co at the cathode surface, e.g., if manganese III+ is disproportionated into Mn II+ and Mn IV+, Mn II+ migrates into the electrolyte, whereas Mn IV+ is precipitated on top of the cathode surface [10]. Oxygen is released through lattice transformation to a rock salt structure [11] or through thermic degradation [10]. The release of oxygen can lead to reactions with the electrolyte and to the formation of CO2 [11,12]. Edström et al. (2004) reveal that organic and inorganic chemical compounds can be detected [8]. Both depend on the electrolyte composition, the oxide type of the cathode active material and the additives, e.g., the additive FEC stabilizes a thin CEI [8,13,14,15]. The organic product content increases with high temperatures. Aging through cycling or storage at elevated temperatures enriches the phosphor content of the CEI [8]. Zheng et al. (2012) assume that only the SEI is decisive for capacity loss [8,16].
The investigation of the SEI and CEI with ex situ methods leads to several changes: (a) soluble and volatile elements are removed due to the opening and washing process of the cell, (b) the surface oxidizes with residual gas in a high-vacuum [17] or argon atmosphere [18] and (c) the surface may be contaminated with Na, K or H [19,20]. The changed SEI and CEI are visible as depositions on top of the anode and cathode, respectively. Peled et al. (2017) define two terms: compact SEI for the functional, properly working SEI and secondary SEI for electrolyte reduction products which might suppress the mass transport of ions [4].
Water contamination is a well-known problem in the battery production process [21]. Electrolyte solutions normally contain water in the ppm range [21,22,23,24]. Inadequate drying of all other battery components can also be a source of water contamination [24]. Transportation or storage in high-humidity conditions may result in reabsorption of water even after adequate drying [24].
Several authors [25,26,27,28,29,30,31] have stored the electrolyte at high temperatures and detected the decomposition of the electrolyte. Different decomposition products, e.g., (volatile) organic aging products and organophosphates, were separated and chemically analyzed according to the pristine electrolyte composition, storage temperature, pristine (residual) water content and measurement method used [25,26,27,28,29,30,31].
Waldmann et al. (2014) reveal that cycling at low and high temperatures leads to different aging mechanisms. High temperatures (>25 °C) lead to SEI growth and manganese dissolution, while low temperatures (<17 °C) lead to lithium plating [32]. Cell aging consists of multiple processes that can overlap and happen simultaneously. At this time, the aging of the cell is not completely understood. Several aging phenomena can be found in the cell and show that different processes are induced due to the nature of aging. The change in the chemical composition reveals connections between them. We assume that water influences the calendric and cyclic aging and causes different aging phenomena on the individual cell components. We try to relate it with the capacity decrease in the cell.
We analyze two cycled and two stored cells with drastically reduced capacity. All aged cells are compared to two pristine cells. Several methods are used to show the macroscopic and microscopic changes as well as changes in the chemical composition of the cell. Computer tomography (CT) reveals macroscopic changes, and microscopic changes are visualized by using scanning electron microscopy (SEM). Energy dispersive spectroscopy is used to measure qualitative and quantitative changes in the chemical composition of the anode and cathode. Secondary ion mass spectrometry allows us to measure all elements including the light elements (Li and H) qualitatively. The electrolyte changes have been measured by using gas chromatography and ion chromatography. This combination of methods allows us to detect morphological changes in each cell component and to analyze the changes chemically. In the presented studies, the presence of water plays a key role in the aging process in the calendric and cyclic aged cells.

2. Materials and Methods

2.1. Cell System

The NMC/graphite system is one of the most commonly used cell systems in the electromobility sector. The investigations were performed on six commercially available NMC/graphite 18,650 cells (ICR 18650-26F, Samsung SDI Co., Ltd., Yongin-si, Korea). The anode consists of a copper current collector coated with graphite anode material on each side. Between the anode and cathode is the electrically insulating separator, which is made of polyvinylidene fluoride (PVdF). The active cathode material was calculated on the basis of the EDS results of the reference cathode (measurement details in Section 2.6). The high cobalt content indicated the active material LCO. The NMC active material was determined by using the manganese-to-nickel ratio. Accordingly, the amount of Ni was held constant and the amount of Mn was calculated for the different commercial active materials. NMC 532 is the most similar commercial active material. The best fit can be achieved for NMC 32X which is not a commercial active material. The ratio between LCO and NMC 532 is 64%:36%. The composition of the electrolyte has also been measured (measurement details in Section 2.5). It consists of lithium hexafluorophosphate (LiPF6) and a mixture of ethyl methyl carbonate (EMC), ethylene carbonate (EC), dimethyl carbonate (DMC) (ratio 1:1.5:3.0) and the additives fluoroethylene carbonate (FEC), succinonitrile and adiponitrile (Table 1). Both nitrile compounds improve the capacity retention and performance rate [33,34]. Traces (<0.3 ma %) of dimethyl 2,5-dioxahexan dicarboxylate (DMDOHC), diethyl 2,5-dioxahexan dicarboxylate (DEDOHC) and ethylmethyl 2,5-dioxahexan dicarboxylate (EMDOHC) can also be detected. These compounds can be formed in small amounts during the first cycle after cell assembly [35]. The nominal capacity of the cell is 2.6 Ah. The manufacturer recommends using the cell in the voltage range of 2.75–4.2 V and charging at max. 2.6 A (1C) and discharging at max. 5.2 A (2C). This investigation used two reference, two calendric and two cyclic aged cells. One of each was used for the electrolyte study.

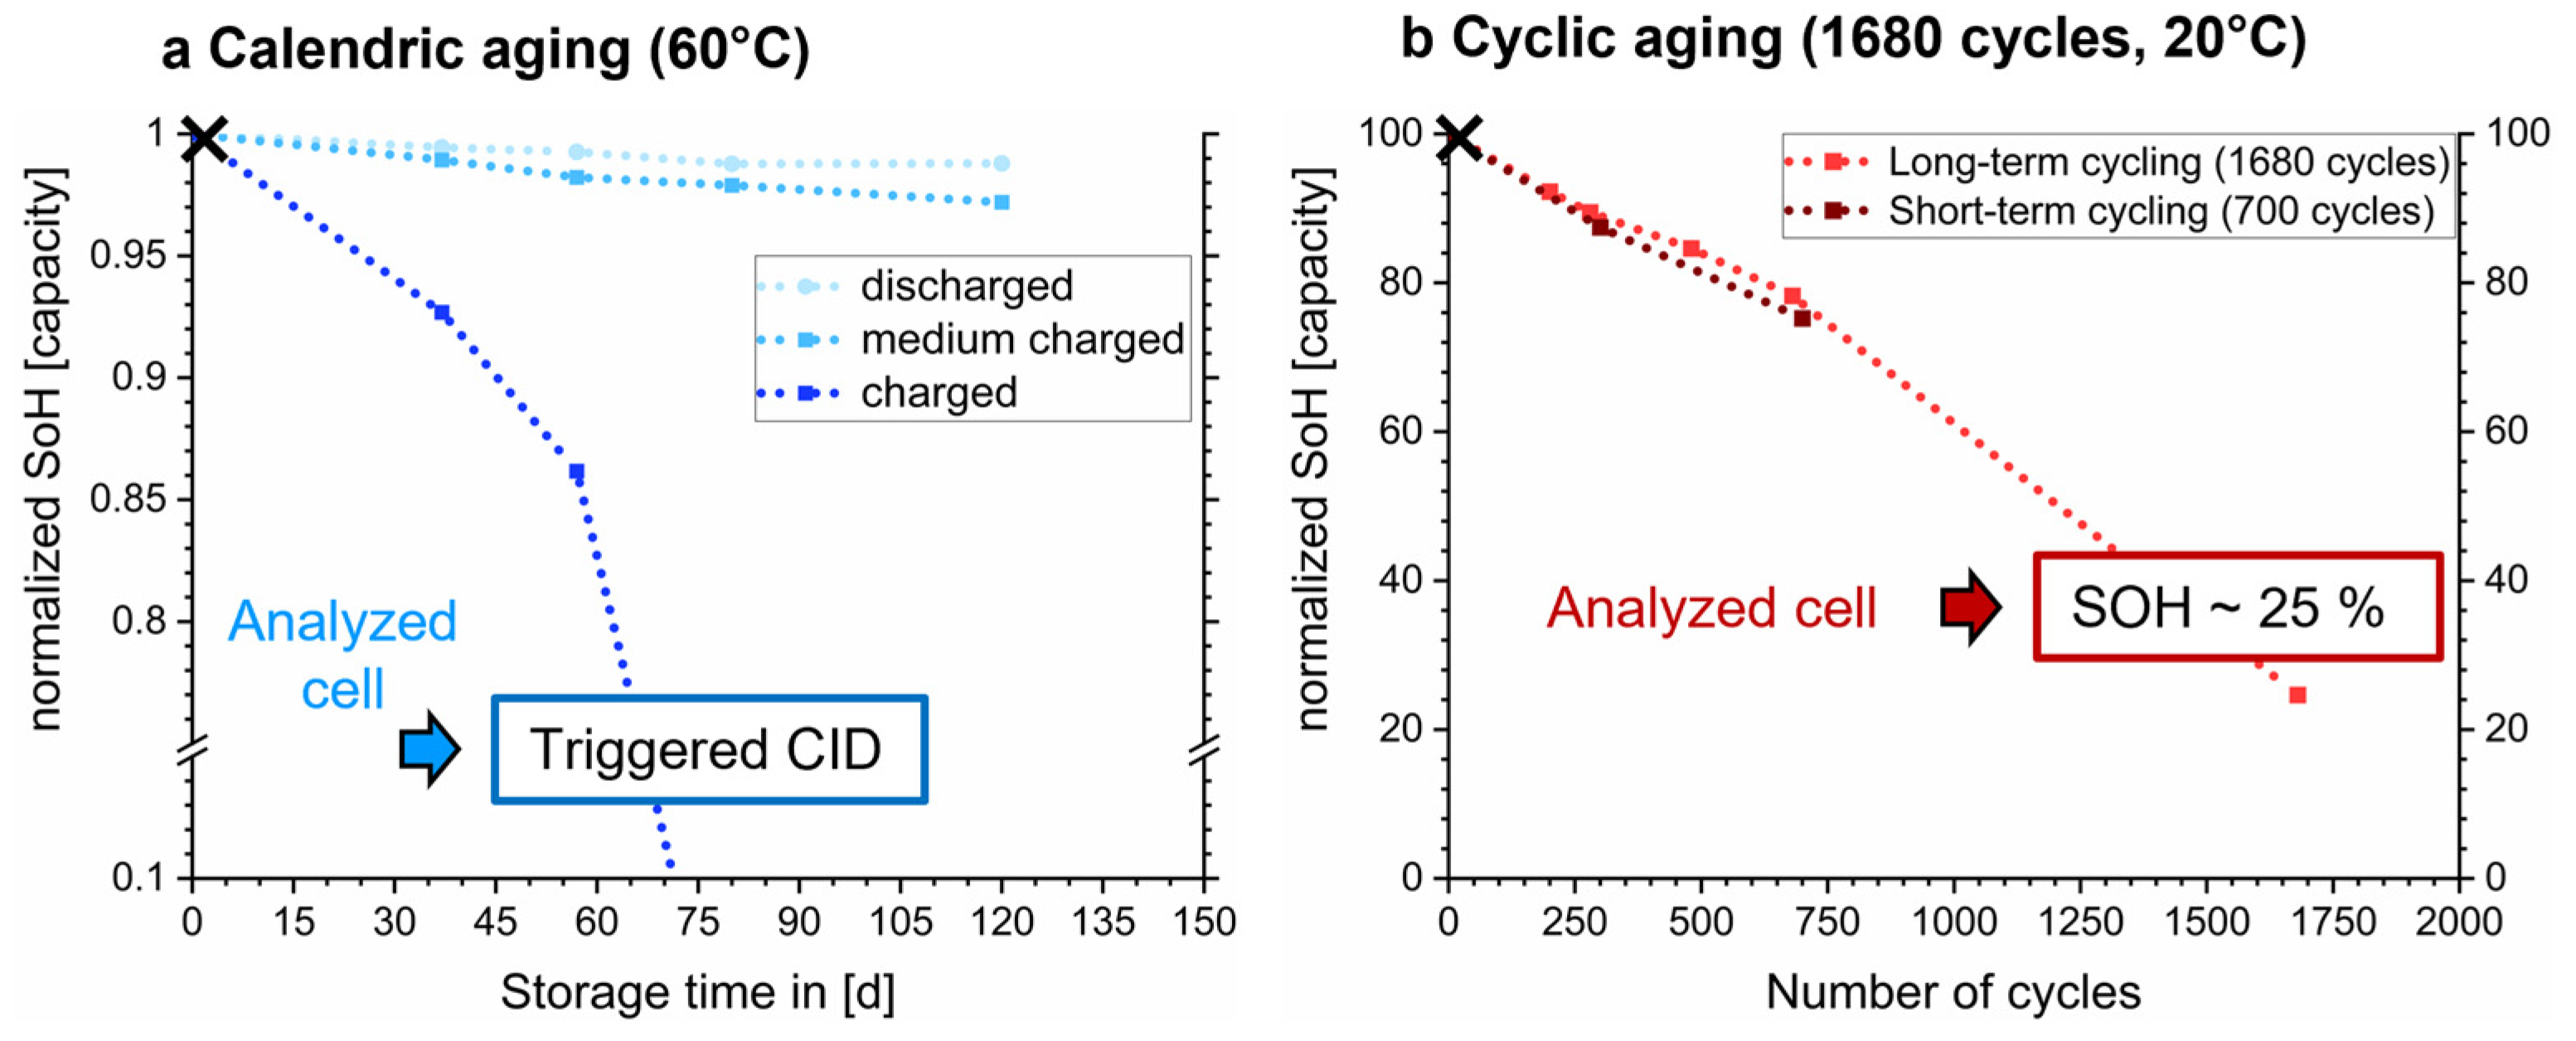
2.2. Aging Scenarios

Two aging scenarios have been chosen for this investigation. Figure 1a shows the calendric aging scenario: the cells were stored in a temperature chamber (Vötsch, Weiss Technik GmbH, Reiskirchen, Germany) at 60 °C in a charged, medium charged and discharged state as described in the previous work of Geisbauer et al. (2021) [36]. A capacity check and a pulse profile have been performed in order to validate the internal resistance before the aging procedure started [36]. The charged cell showed increased capacity loss until the second checkup in comparison to the discharged and medium charged cell. We used the state of health (SOH) which is defined as the percentage of the current capacity compared to the initial capacity to describe the capacity loss. Geisbauer et al. (2021) describe rapid capacity loss down to about 10% state of health (SOH) between the second and third checkup. This corresponds to a timeframe of 57–80 days. The third checkup showed no open circuit voltage (OCV) for the NMC cells [36].
The second aging scenario (Figure 1b) cycles cells with the same properties under laboratory conditions (20 ± 2 °C) (battery tester Neware BTS 4008-5V6A, Shenzhen, China). The charge and discharge steps were carried out with a current of 2.6 A (1C). The charge step consisted of a constant-current–constant-voltage (CCCV) phase with a cutoff current of 0.1 A up to the upper voltage of 4.2 V. The cell was discharged to 2.75 V, as specified by the manufacturer (2.75–4.2 V). Between each charge/discharge phase, a break of ten minutes was included. The state of health (SOH) decreased over 700 cycles to 75.2% and over 1680 cycles to 24.6%. The analyzed cell showed a continuous decrease in capacity.
The aged cells of the two aging scenarios were compared to a reference cell in pristine state. The reference cell is marked with a black cross in Figure 1a,b.

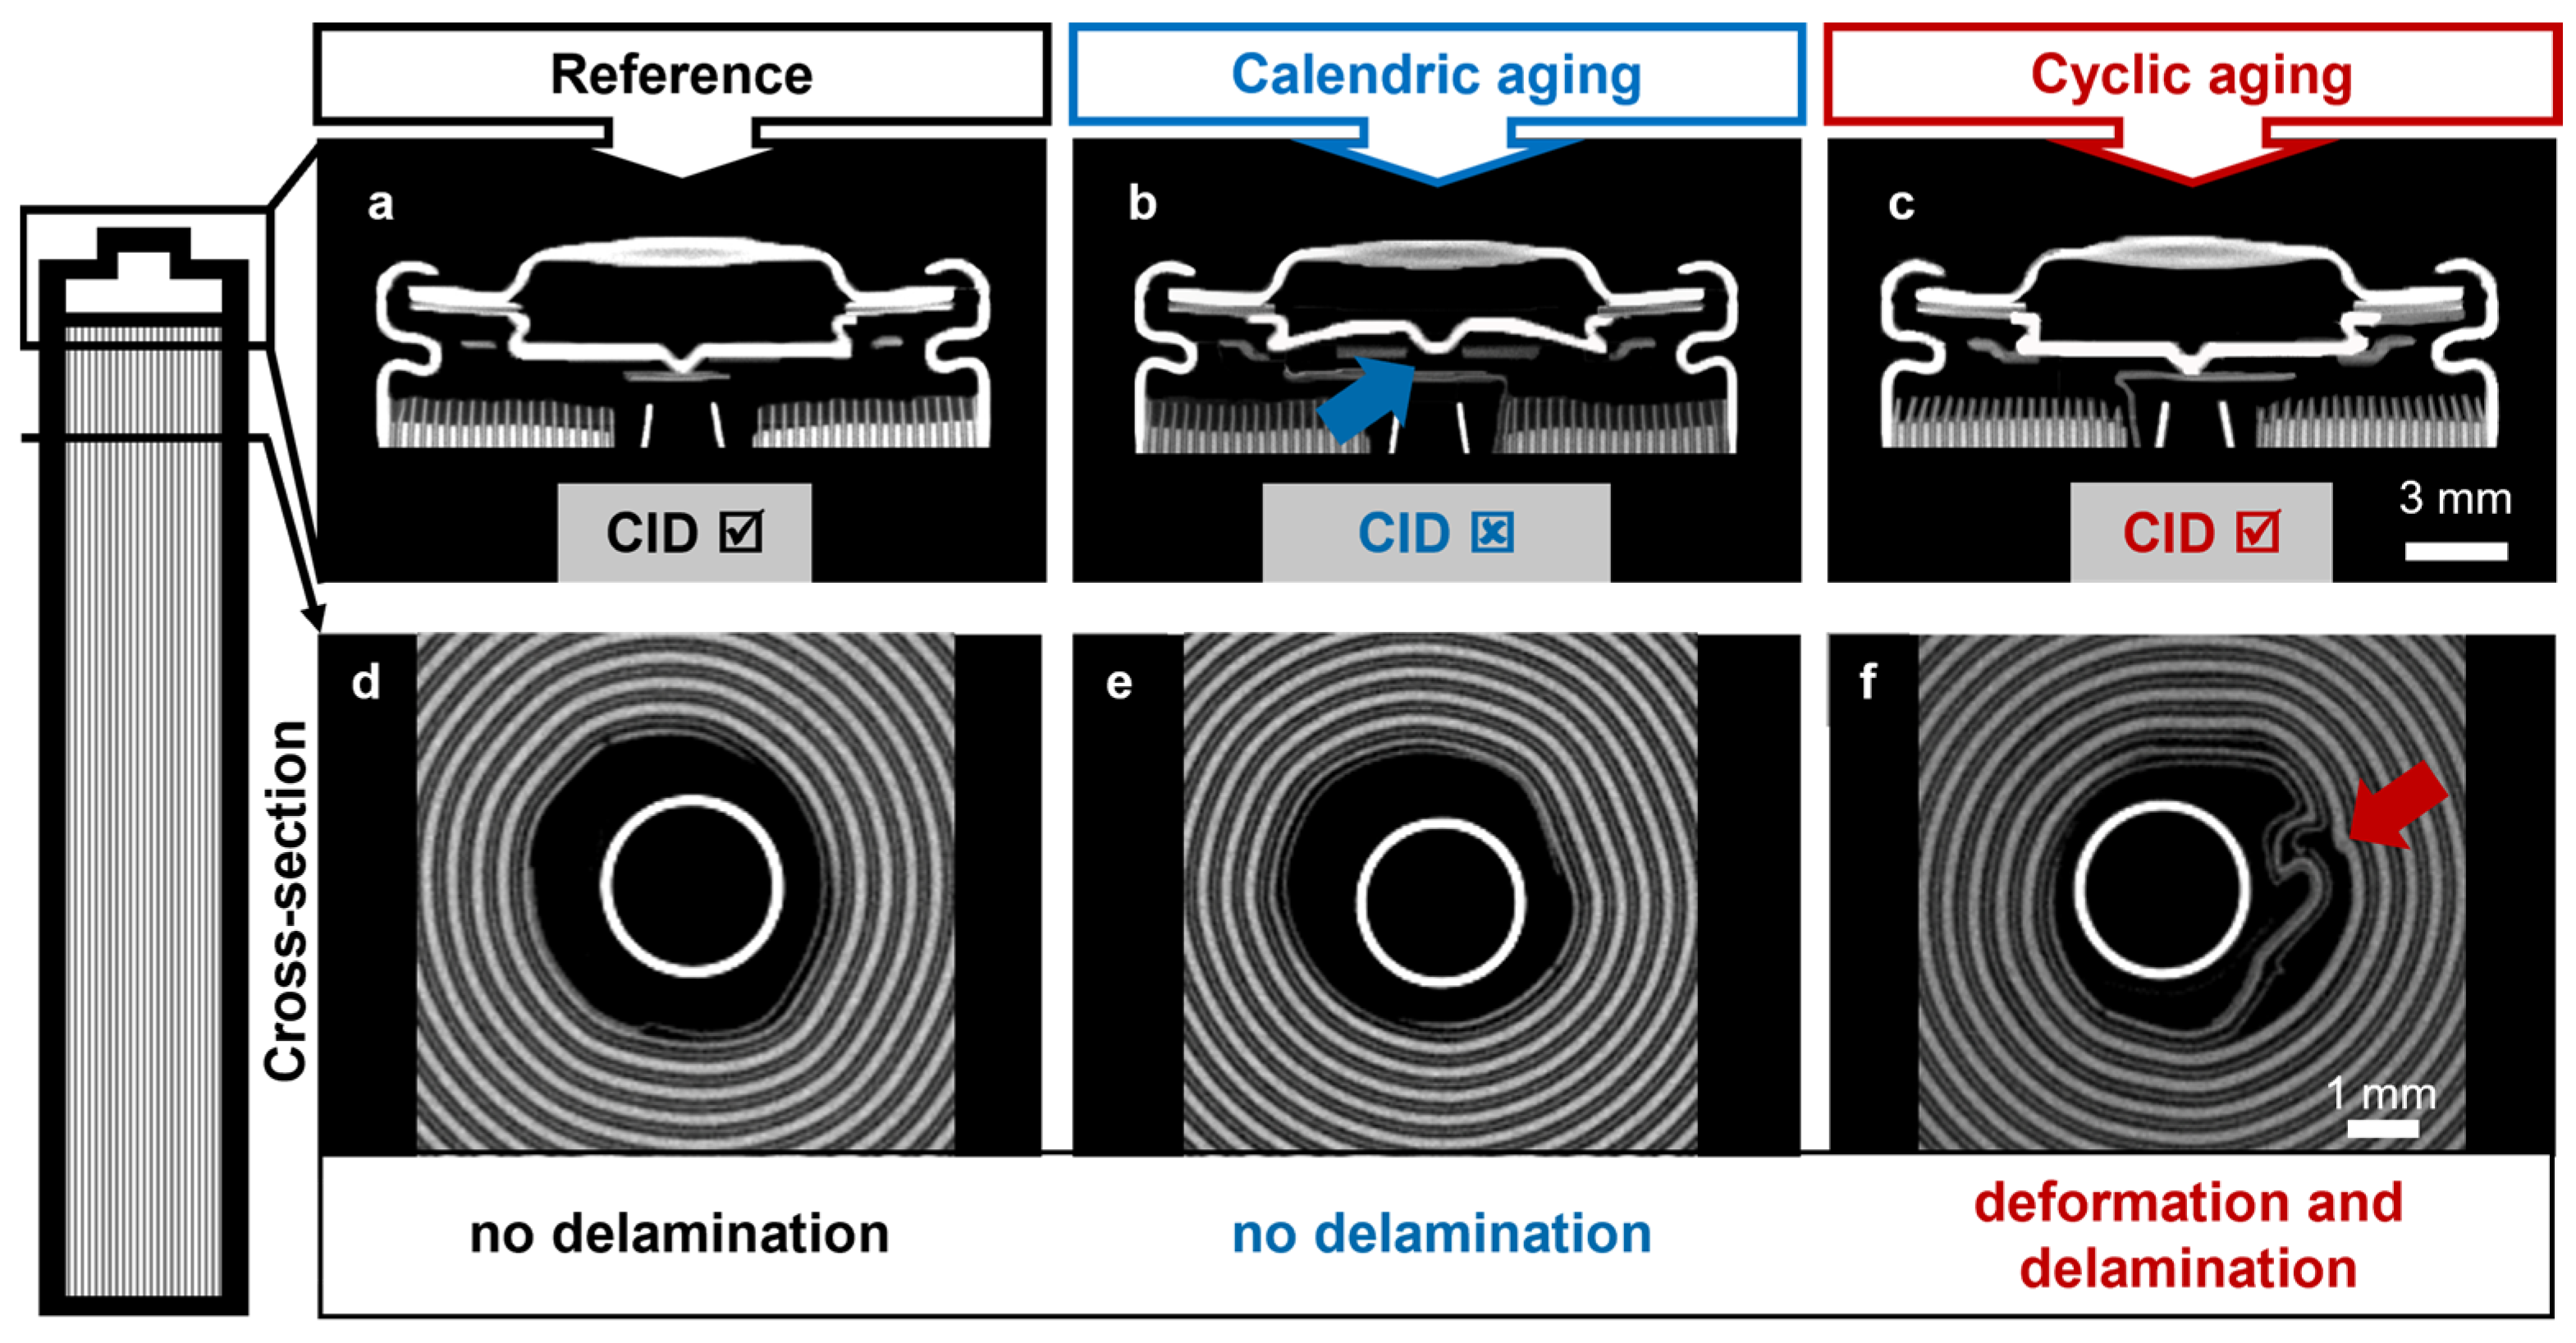
2.3. Computer Tomography (CT)

Computer tomography (CT) enables a nondestructive investigation of the cell before and after cell aging. The comparison of reference and aged cells delivers accurate information about macroscopic aging-related changes:
  • Foil protrusion [37];
  • Deformation of the active material layer (buckling) [38,39,40];
  • Delamination;
  • Changes in the active material layer thickness [4,8];
  • Control of the current interrupt device (CID) [36].
The studies were performed using a Phoenix V/tome/X S (Phoenix X-Ray, Wunstorf, Germany) (microfocus tube) with a voltage of 120 kV, a current of 100 μA, an exposure time of 200 ms and a voxel size of 22 μm (resolution).

2.4. Sample Preparation

The reference and cycled cells were discharged to 2.7 V before the opening and preparation process. The calendric aged cell could not be discharged due to the triggered CID (Section 3.1). The positive terminal was carefully removed mechanically to expose the thin metal band that connects the jelly roll to the CID. The thin metal band was then contacted with an incandescent lamp to discharge the jelly roll and allow for safe opening. However, the anode foil of the calendric cell showed a golden color indicating a charged state. The anode, cathode and separator were separated from each other and washed with DMC to avoid electrolyte residuals. The anode and cathode were examined on the surface facing the separator. This surface is also the contact surface to the electrolyte where the SEI forms on the anode and the CEI forms on the cathode. We define the (a) “top anode surface” and (b) “top cathode surface” for the described contact area between the anode and electrolyte/separator and the cathode and electrolyte/separator, respectively. Representative small pieces of the sample were fixed on top of an SEM alumina stub with a conductive carbon paste and the SEM alumina stubs were mounted on the SEM sample holder. The opening and preparation process was performed in a glovebox (GS Glovebox Systemtechnik, Malsch, Germany) in argon atmosphere (<1.0 ppm O2 and <1.0 ppm H2O). However, the SEI and CEI can be affected by the minimum residual gas content. The SEM, EDS and SIMS investigations took place by using the scanning electron microscope. The sample holder with the prepared electrodes was transported in a transport box under argon atmosphere to the SEM instrument. There, the lock to the vacuum chamber was opened, the sample holder was placed in the lock of the SEM instrument and the lock was immediately evacuated. The total exposure time of the samples to air was less than 1 min. The cells for the electrolyte analysis were also opened in a glovebox in argon atmosphere and were centrifuged at 8500 rpm to obtain the electrolyte.

2.5. Electrolyte Analysis

The electrolyte analysis enables us to detect age-related concentration changes. In this investigation, the electrolyte has been analyzed for one reference, one calendric and one cyclic cell. The analysis was performed with two different measurement methods: gas chromatography with flame ionization detector (GC-FID, Shimadzu, Kyōto, Japan) for the determination of volatile components, and ion chromatography (IC, Metrohm, Zofingen, Switzerland) with a conductivity detector for the determination of ionic components.

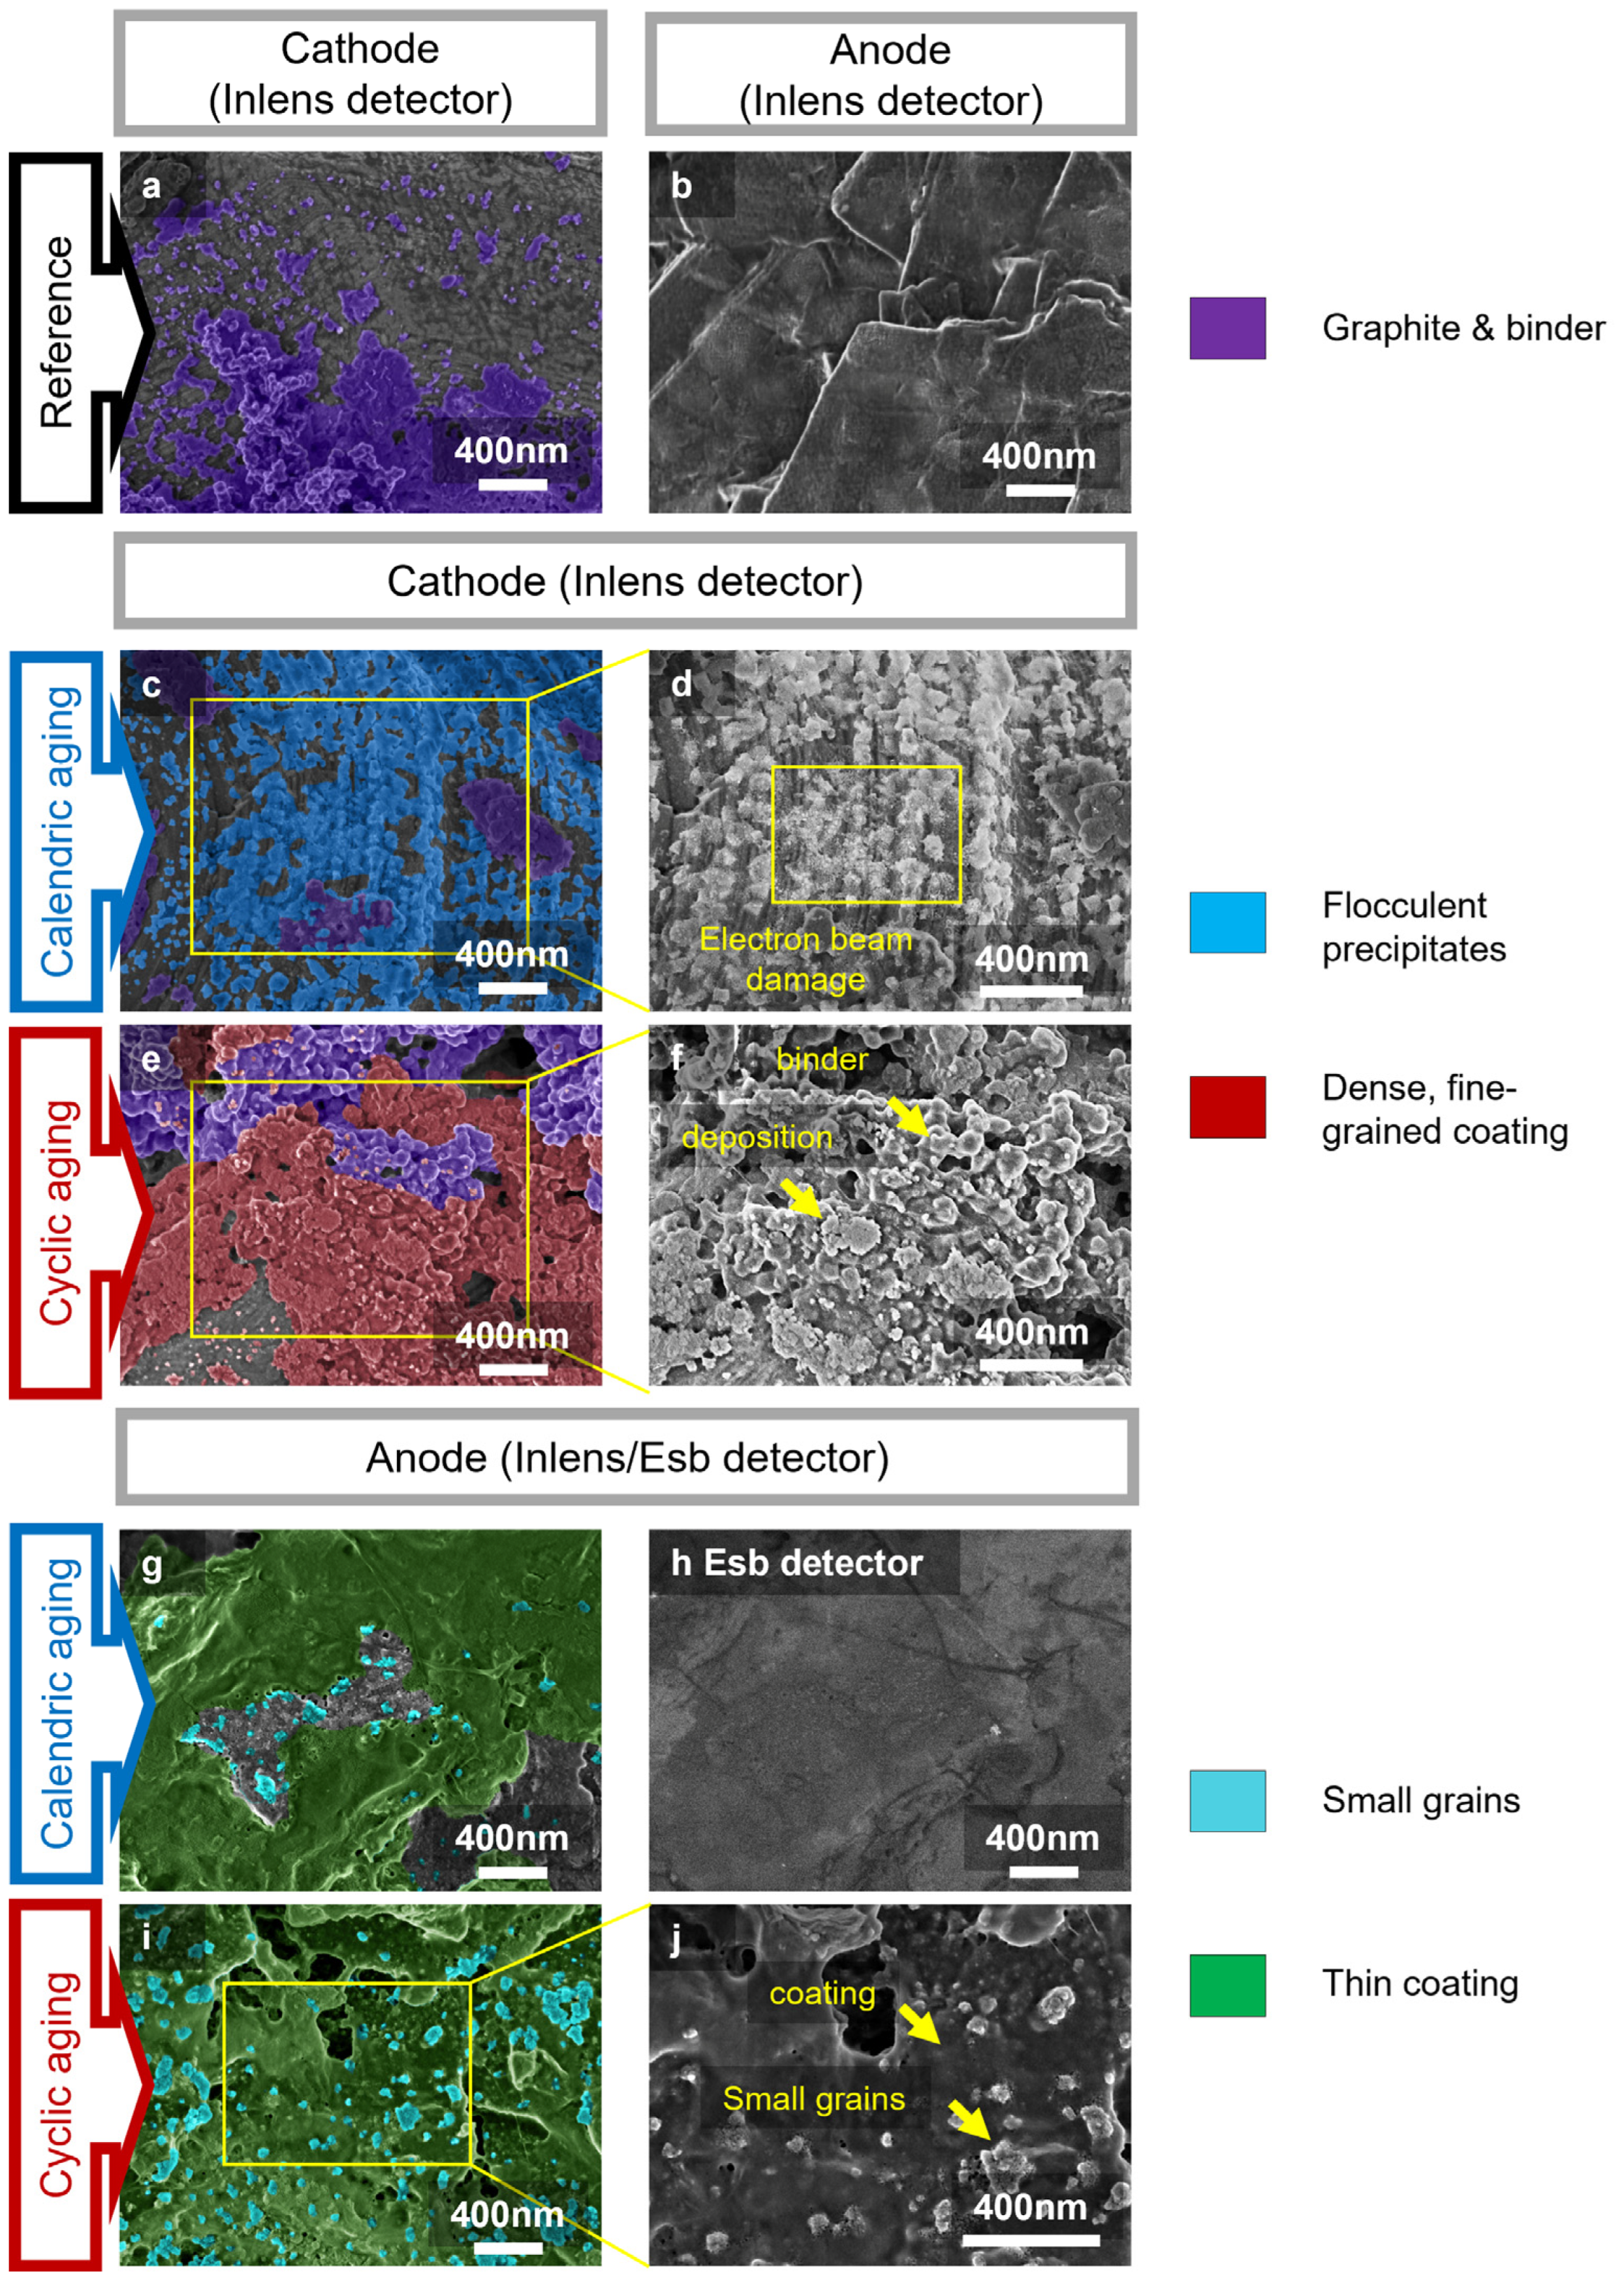
2.6. Scanning Electron Microscopy (SEM) and Energy Dispersive X-ray Spectroscopy (EDS)

The following investigations were performed with a ZEISS Crossbeam 540 (Zeiss, Oberkochen, Germany), which is equipped with a Gemini II column, a Schottky field emission electron gun, an Everhart-Thornley detector (ETD), a backscattered electron (BSE) 4-quadrant semiconductor detector, two Inlens detectors and a ZEISS Capella focused ion beam (FIB). The lower Inlens detector (INLENS) and the ETD detector are used for topographic information. Compositional information can be obtained with the upper Inlens detector (EsB) and the BSE detector. The latter has to be used with acceleration voltages above 3 kV, whereas the first one was optimized for the acceleration voltage range of 0.5–5 kV [41,42]. The images were recorded with an accelerating voltage of 1 kV and an electron current of 67 pA using “High Resolution Mode”. The working distance lay between 2.5 and 3.0 mm to optimize image resolution and compositional information. The ZEISS Capella focused ion beam (FIB) has a gallium liquid metal ion source and can be used with currents between 50 pA and 100 nA and voltages between 1 and 30 kV. The FIB can remove material evenly in any shape, such as a rectangle, spiral or circle. A HIDEN secondary ion mass spectrometer was attached to the Zeiss crossbeam and used the FIB as a primary ion beam.
The SEM was additionally equipped with the OXFORD Ultime Extreme EDS detector (Oxford instruments NanoAnalysis, High Wycombe, United Kingdom). The detection of X-rays allows for a qualitative and quantitative chemical analysis. The measurement parameters can be seen in Table 2.
Pore size analysis was performed on 45 images each of the reference, calendric and cyclic separator surfaces. A total of 15 images were taken at magnifications of 20,000, 40,000 and 60,000, respectively. The 15 images with magnification 40,000 were used to evaluate the separator pore size. The pore size was measured as maximum ferret diameter (feretmax). Pore size distribution is shown area-weighted. Zeiss software ZEN Core 3.4 was used for the evaluation. The magnification 40,000 corresponds to an area of 6.23 square micrometers. A total of 15 images of 6.23 square micrometers each correspond to a total area of 93.5 square micrometers.

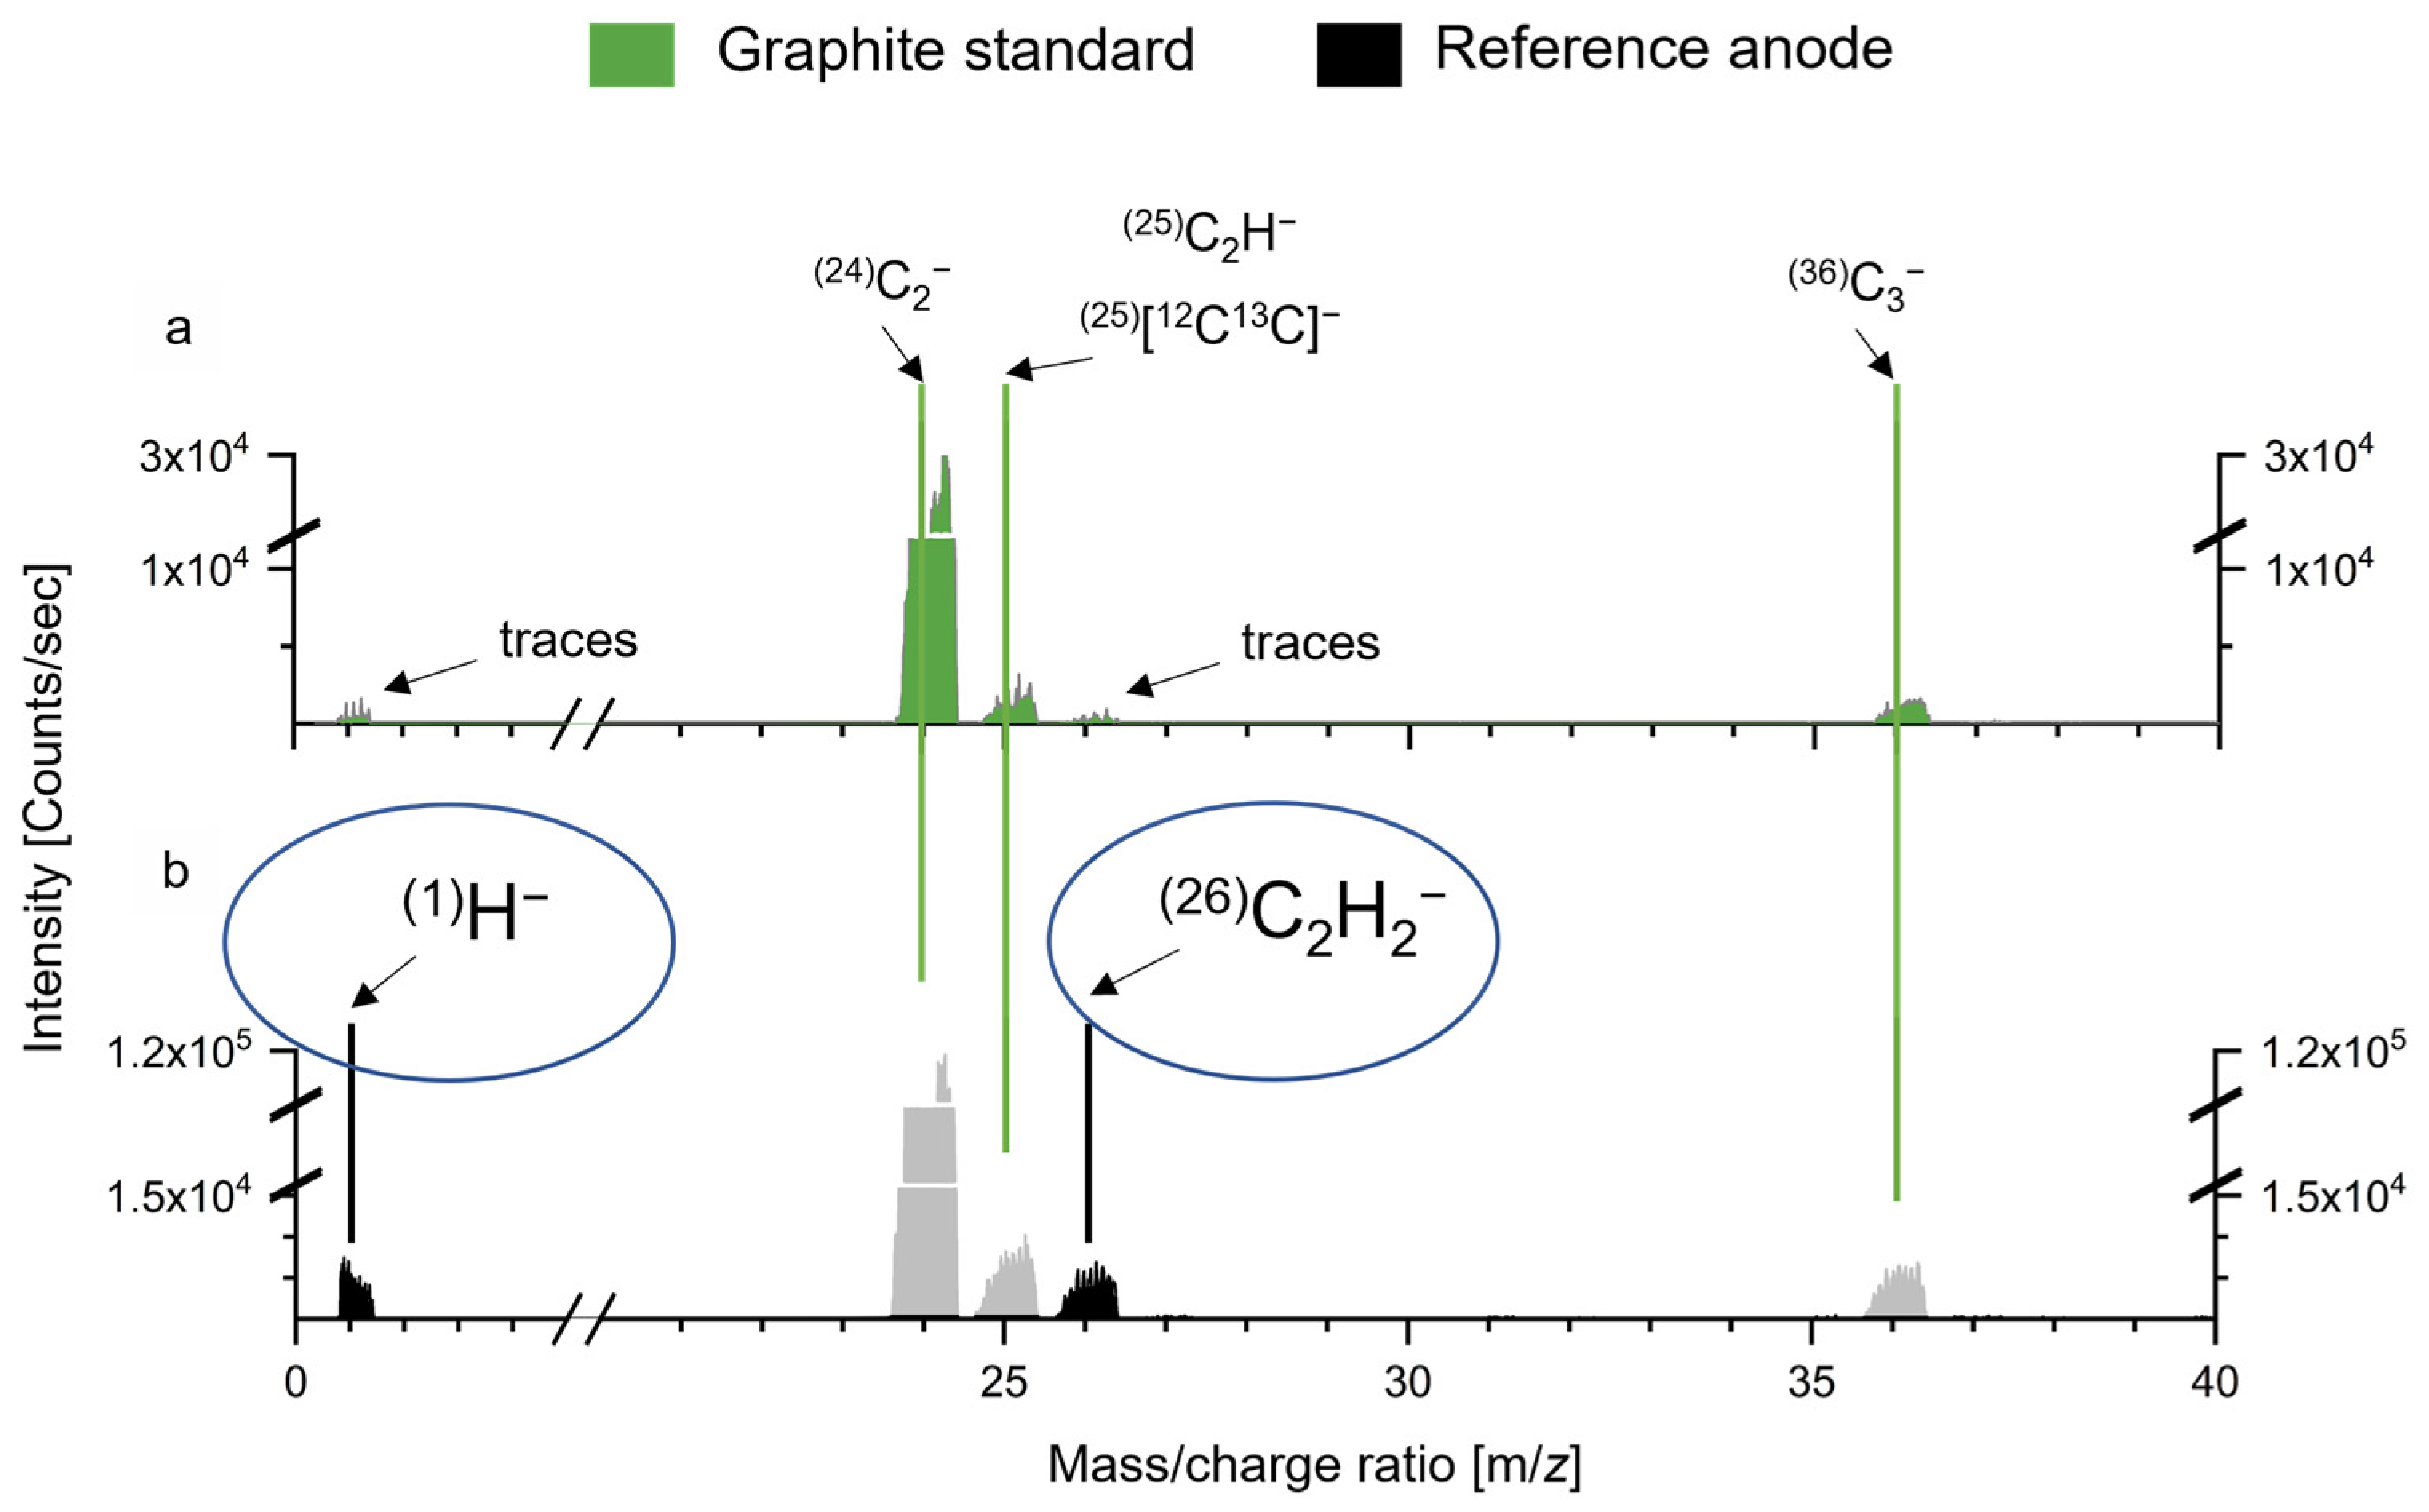
2.7. Secondary Ion Mass Spectrometry (SIMS)

Secondary ion mass spectrometry (SIMS) offers a qualitative chemical analysis of the surface. This is realized in the combination of a Zeiss scanning electron microscope (SEM) with a HIDEN secondary ion mass spectrometry (Hiden Analytical, Warrington, United Kingdom) detector. The focused ion beam (FIB) works with gallium ions and is used as a primary ion beam to sputter surface atoms, which can be analyzed through the quadrupole detector. This detector type offers high sensitivity but solely serial collection of the mass spectrum by changing from mass to mass [43,44].
The best results were obtained with an acceleration voltage of 30 kV, a gallium ion beam current of 300 pA and a magnification of 5000. Each measurement consists of five cumulatively added scans of the complete mass spectrum and was repeated on three representable sample fields. This optimizes the signal-to-noise ratio, reproduces the mass spectrum and allows us to recognize measurement artefacts. The anode has been measured with positive and negative ions. Data acquisition and evaluation were performed with HIDEN’s MASsoft 7 software.
We used mechanically prepared industrial graphite (IGS-895, Nippon Carbon Co., Ltd., Tokyo, Japan) to detect the baseline of carbon. The graphite is pressed isostatic, has a total porosity of 11.3% and a density of ρ = 2.15 g/cm3. SEM and EDS were used to observe the polish and purity of the surface.

2.8. Karl Fischer Titration

Karl Fischer titration was used to determine the water content in the anode foils. We used a Metrohm 774 oven sample processor (Metrohm, Filderstadt, Germany) which allows for a coulometric analysis for water contents between 1 ppm and 1%. Three samples of each (reference, calendric and cyclic anode) were prepared in the glove box and the sample vials were sealed under argon atmosphere. After locking out, the samples were measured directly. Three blank values (empty sample vials under argon atmosphere) were measured before and after the anode samples. The mean blank value is 5 ± 1 µg. The results may be biased due to prolonged storage of the samples in the glove box prior to the measurement.

3. Results

3.1. Macroscopic and Microscopic Changes

The investigation started with the detection of macroscopic changes inside the cell using computer tomography (CT). The nondestructive investigation enabled us to detect important changes before the opening process. Figure 2a–c compare the positive pole of the reference (black) cell with the calendric (blue) and cyclic (red) cell from a side view. The current interrupt device (CID) is designed to ensure safe use of the cell. If gas is formed, it will be released. This will break all or part of the connection between the inner jelly roll and the outer positive terminal. This means that little or no capacity can be measured, even though the jelly roll may have significantly more capacity. Only for the calendrically aged cell could a triggered CID be detected (blue arrow in Figure 2b). Below the CID, the upper part of the jelly roll can be seen. Figure 2d–f compare cross-sections of the reference with the calendric and cyclic cell. These CT images have been recorded in the upper part of the cell. The light sequence represents the cupper current collector with the anode active material and the dark sequence represents the aluminum current collector with the cathode active material. The cyclic cell shows deformation and delamination in the middle of the jelly roll (red arrow in Figure 2f). The calendric and the reference cell show no delamination of the inner jelly roll.
Next, we studied microscopic changes on the anode and cathode surfaces, as shown in Figure 3. We used the Inlens detector with a low-acceleration voltage (1 kV), a low current (67 pA) and the high-resolution mode to receive highly resolved surface topography images without electron beam damage. The morphology of the deposition products was used to define different categories: flocculent precipitates and a dense, fine-grained coating for the cathode and small grains and a thin coating for the anode. The reference cathode (Figure 3a) presents a smooth surface of the active material particles. The fine-grained graphite binder material (purple-colored) partially covers the surface. The calendric and cyclic cathode (Figure 3c–f) show depositions on top. The depositions of the calendric cathode (Figure 3c) can be identified as individual flocculent precipitates regularly distributed over the surface of the active material (blue-colored). They appear brighter, indicating the onset of charging of the top cathode surface through interaction with the electron beam. They are very sensitive to the electron beam which causes electron beam damage even at low currents and low-acceleration voltages (Figure 3d). The depositions of the cyclic cathode (Figure 3e) appear more granular (red-colored) and completely cover the active material particle surface. They can also be found on the fine-grained graphite binder material. It is difficult to distinguish between them because they do not appear brighter. Two yellow arrows show the binder material and the deposition product (Figure 3f). The material contrast shows no significant difference. The reference anode (Figure 3b) consists of graphite plates with clearly visible edges. Both aged anode surfaces (Figure 3g–j) are covered with two different depositions: First, there are fine-grained depositions (cyan) inhomogeneously distributed over the surface. Second, a thin film (green) covers large areas of the surface. The thin film dominates the surface of the calendric anode. The material contrast with the EsB detector shows areas with brighter gray values, indicating elements with a higher atomic number than graphite. The fine-grained deposits are larger and more frequent for the cyclic anode. The thin coating and the fine-grained deposits are marked with two yellow arrows for the cyclic anode (Figure 3j). The material contrast on the cyclic anode shows no significant difference.
The reference separator consists of PVdF fibers in the range from 10 nm to about 300 nm in thickness. The electrolyte-filled pores between the fibers enable the transport of lithium ions and prevent the passage of electrons. Figure 4 compares the pores of the (a) reference (purple-colored), (b) calendric (blue-colored) and (c) cyclic (red-colored) separator on the anode side by using SEM. The porosity of the top view was measured for the reference (black) as 16.1%, for the calendric (blue) as 7.4% and for the cyclic (red) as 4.7% (Figure 4d). Figure 4e shows the area-weighted pore size distribution as a function of the maximum ferret diameter (Feretmax). The large pore sizes decrease and the small pore sizes increase significantly for the calendric (blue) and cyclic (red) separator in comparison to the reference (black). The D50 value reduces from 92.1 nm in pore size for the reference to 70.7 nm in pore size for the calendric and 44.2 nm in pore size for the cyclic separator.

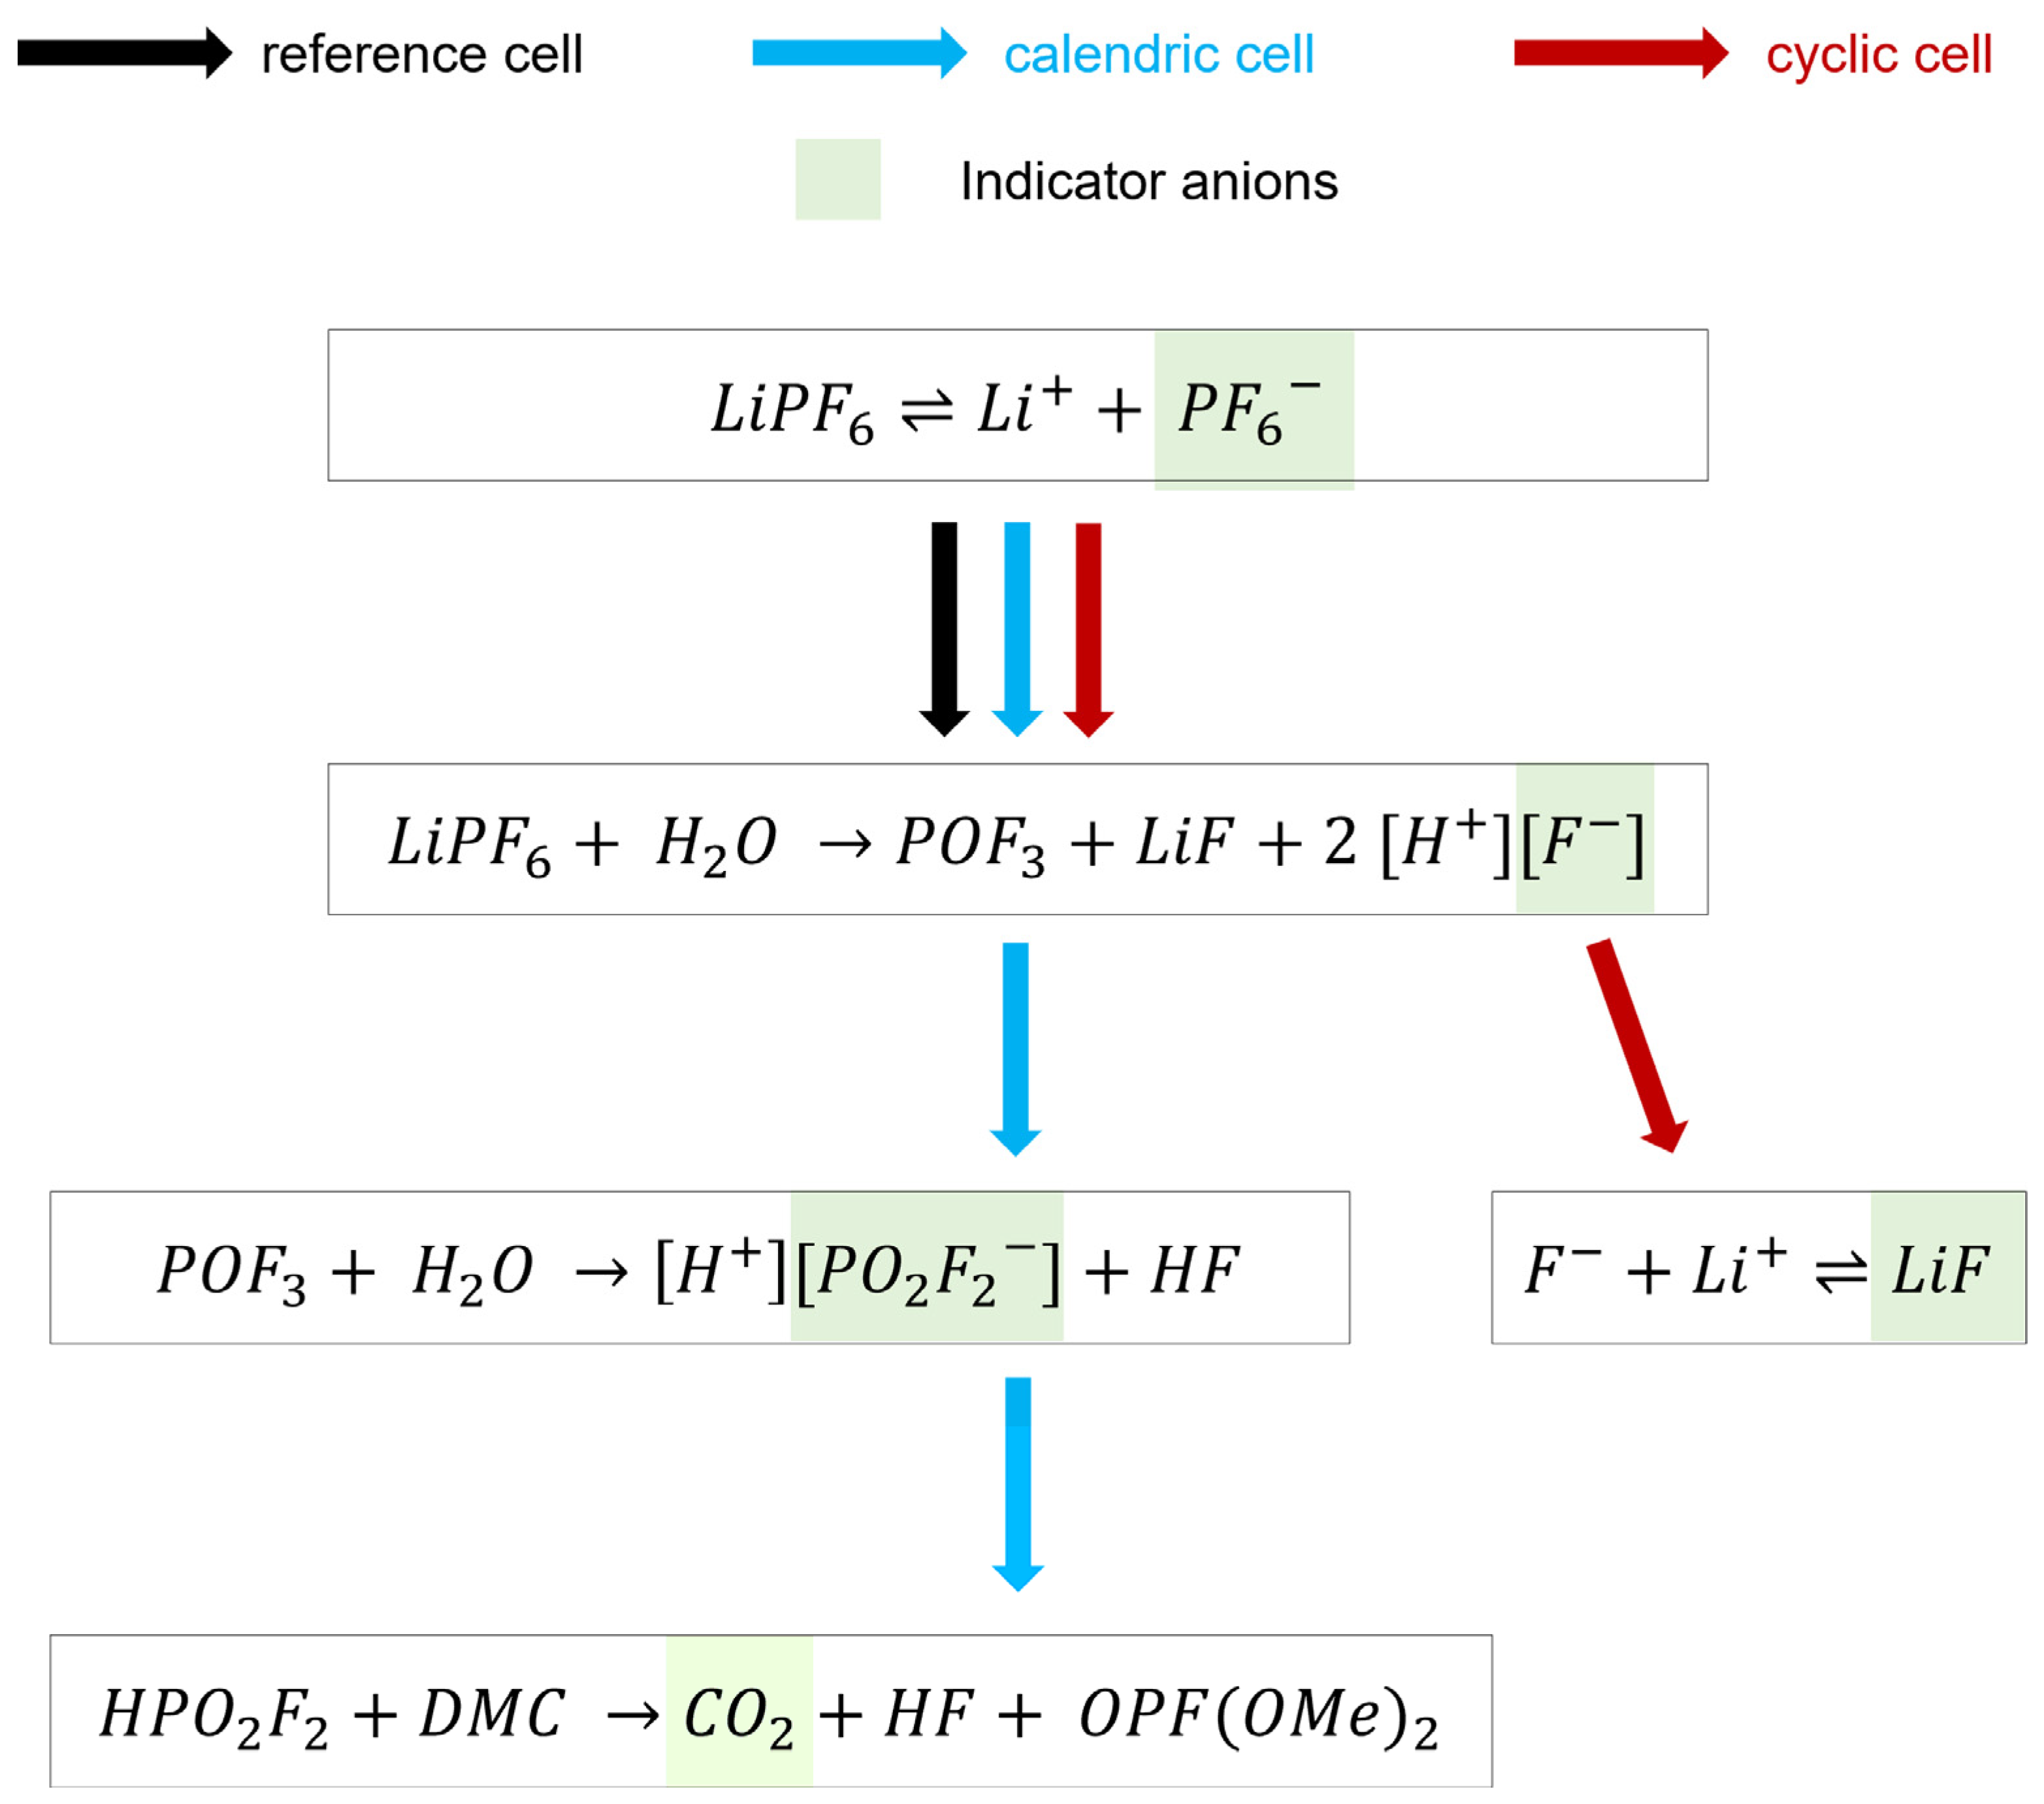
3.2. Presence of Water Causes Electrolyte Degradation

The analysis of macroscopic and microscopic morphological changes on the anode, cathode and separator surface is followed by the chemical surface analysis. The anode surface consisting of graphite is investigated with secondary ion mass spectrometry (SIMS). In order to establish the baseline values and detect any deviations, the reference anode is compared to a graphite standard. Figure 5 presents the results of the analysis detecting negative ions. The SIMS measurement of the graphite standard (Figure 5a, green-colored) shows three distinct peaks: mass/charge ratio 24, mass/charge ratio 25 and mass/charge ratio 36. The mass/charge ratio 24 corresponds to (24)C2; the mass/charge ratio 36 corresponds to (36)C3. The mass/charge ratio 25 can be interpreted in two ways: a combination of different carbon isotopes and a combination of carbon and hydrogen. The second could be an artifact of mechanical preparation or the normal background contamination. Traces of the mass/charge ratio 1 and 26 can be detected. We assume that these traces correspond to the residual background contamination which has been investigated by Lévy et al. (2019) [19].
The SIMS analysis of the reference anode surface (Figure 5b, black-colored) shows four additional peaks: m/z 1, 16, 19 and 26. In addition to carbon, the elements oxygen (m/z 16) and fluorine (m/z 19) are also detectable on the surface. Oxygen and fluorine are deposited by the initial cycling which forms the first SEI [1]. Hydrogen is part of three mass/charge ratios (1, 25, 26) and indicates the presence of water. In comparison to the graphite standard, the m/z 1 and 26 are clearly visible for the reference anode and prove the presence of water for the reference anode.
The water content in the anode foils has been determined by using Karl Fischer titration. The reference anode has a water content of 160 ± 41 ppm, the calendric anode has a water content of 13 ± 12 ppm and the cyclic anode has a water content of 347 ± 29 ppm. The water content of the cyclic and calendric anodes reveals the following differences (in comparison to the reference anode): the water content of the cyclic anode is significantly increased and the water content of the calendric anode is significantly decreased.
In the next step, we investigated electrolyte changes due to calendric and cyclic aging. The conductive salt LiPF6 can disproportionate to Li+ and PF6 and can decompose, forming HF and difluorophosphate [24,30]. The volatile components were measured by using gas chromatography; the ionic components were measured by using ion chromatography. As can be seen from Figure 3, the analysis shows the following differences: The fluoride anion can only be detected for the reference cell. The anion hexafluorophosphate is increased for the calendric and cyclic aged cell and the anion difluorophosphate can only be detected for the calendric aged cell. The additive fluoroethylene carbonate (FEC) has been consumed in the cyclic aged cell. The additives succinonitrile and adiponitrile can only be detected for the reference cell.

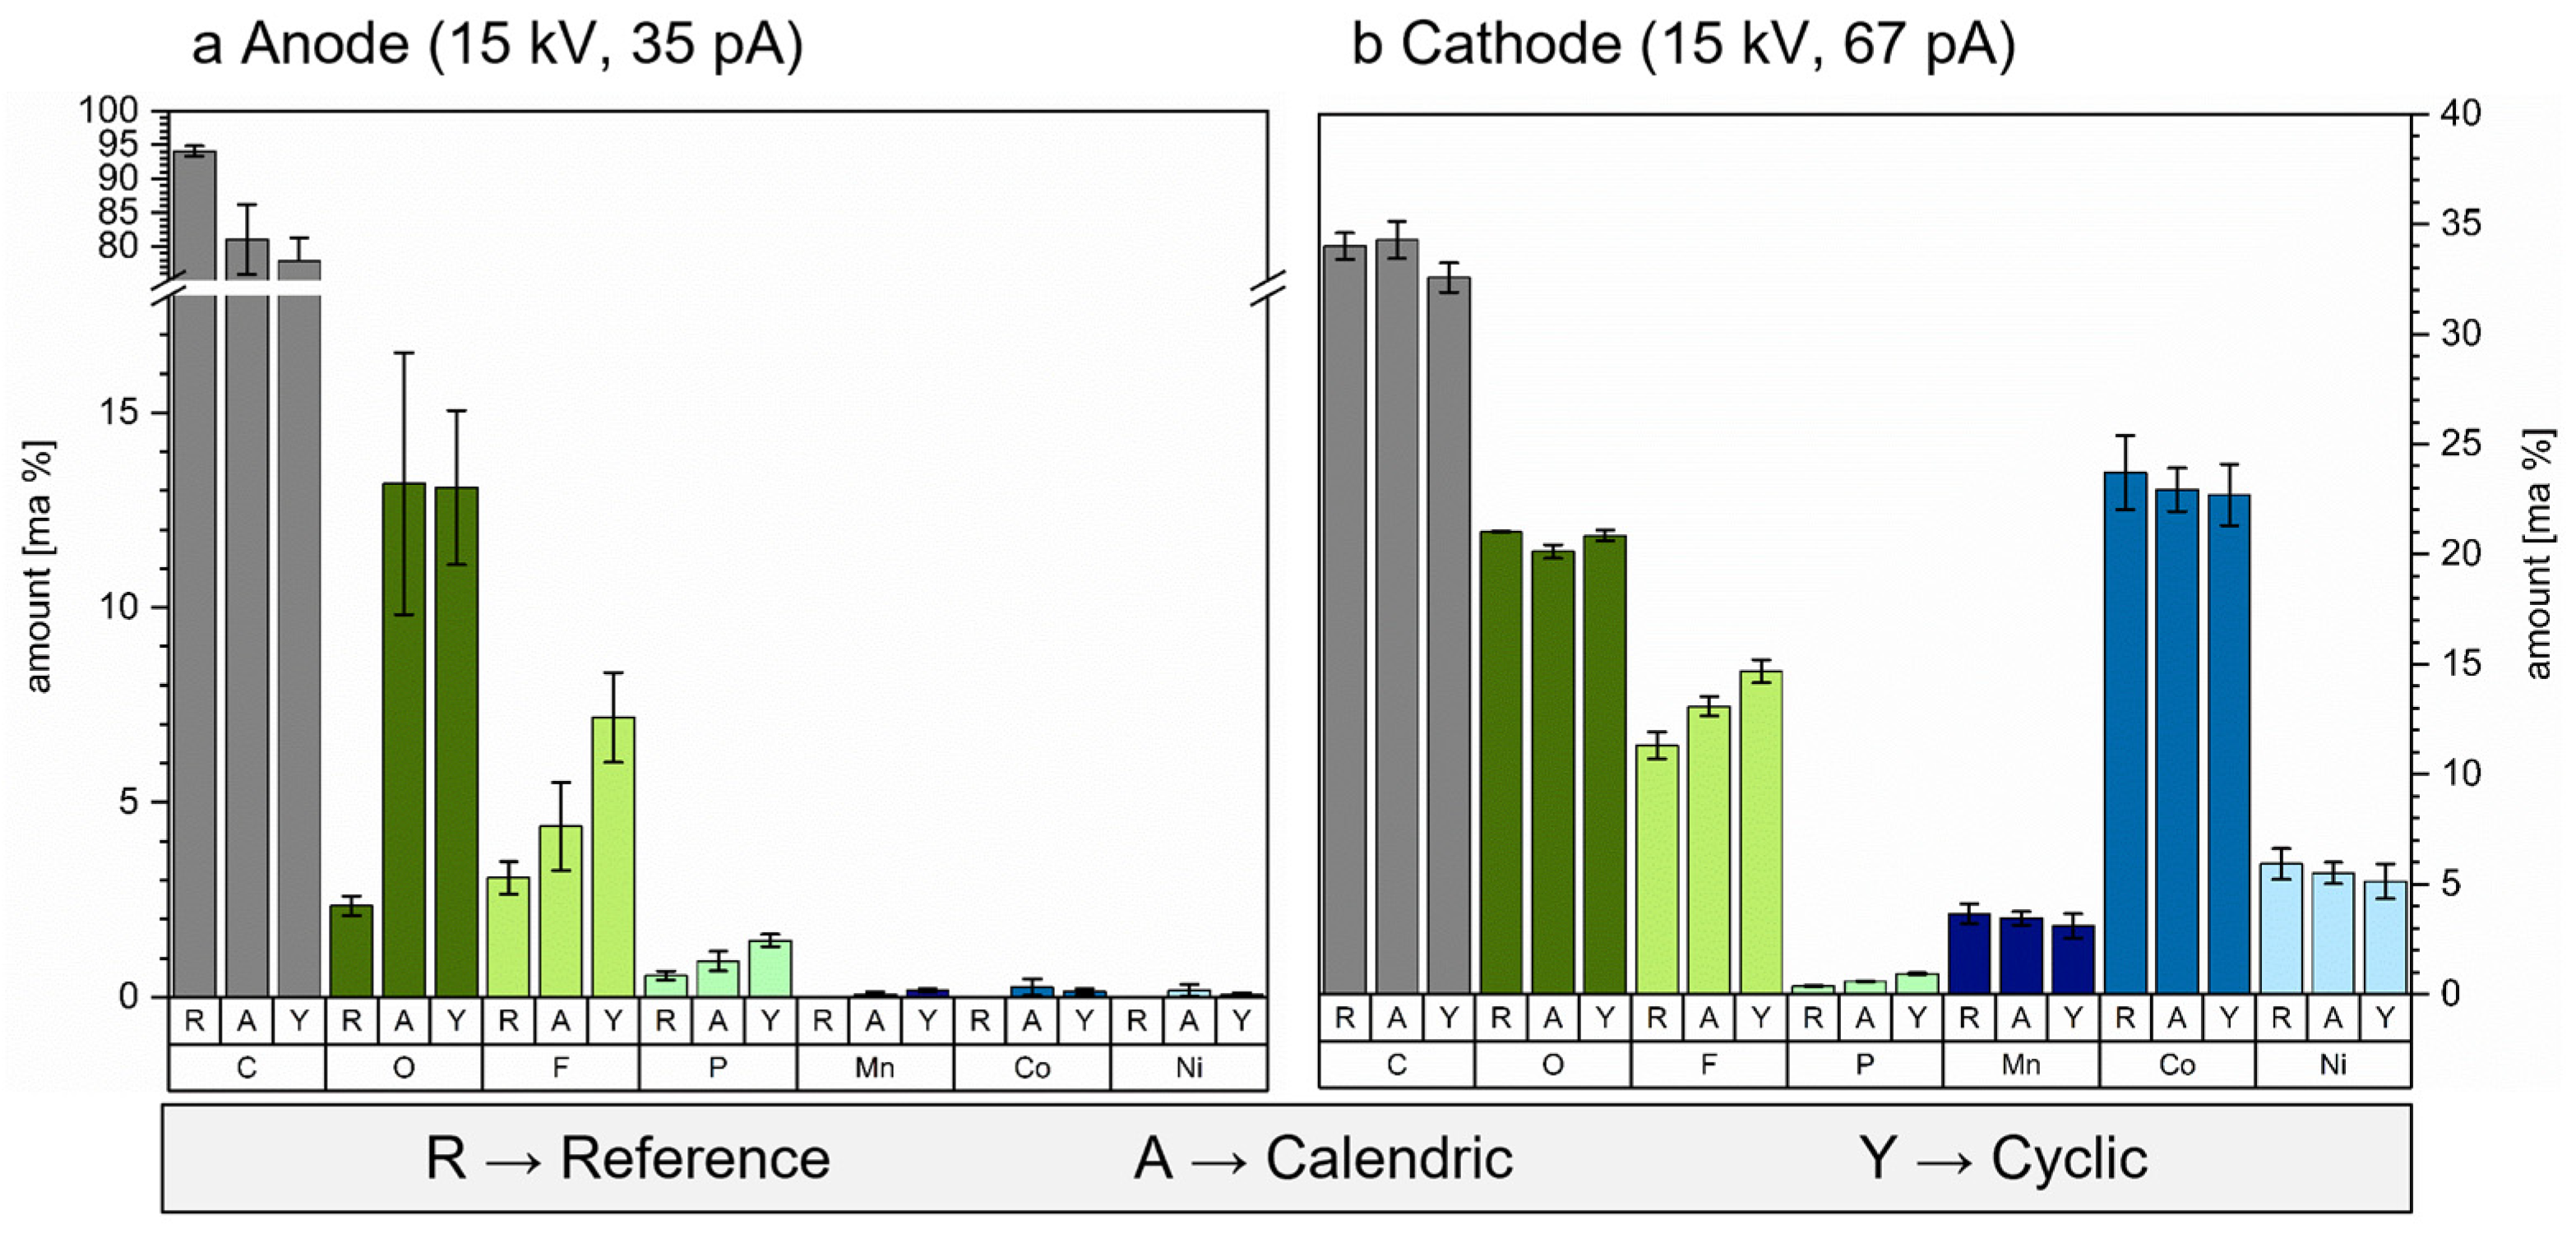
3.3. Water Accelerates Anode and Cathode Degradation

Next, we asked if the calendric and cyclic aging scenario with water could produce chemical differences on top of the anode. The reference (black), calendric (blue) and cyclic (red) aged anode were measured by using secondary ion mass spectrometry (SIMS) with positive ions, as shown in Figure 6a–c. This method is particularly suitable to measure the light elements, e.g., hydrogen and lithium. The measurement of the reference anode (Figure 6a) gives five peaks which can be correlated to the lithium isotopes 6 and 7 and the ions (14)Li2+, (19)F+, (23)LiO+ and (33)Li2F+. These molecules represent the elements of lithium, oxygen and fluorine on top of the reference and reflect the compositions of the first SEI. These molecules can also be found for the cyclic and calendric aged cell (marked by black vertical lines). The cyclic aged anode (Figure 6b) has six additional peaks which are also found in the calendric aged anode (marked by red vertical lines). These peaks can be correlated with the molecules (30)Li2O+, (31)Li2OH+ and (32)Li2F+ and the ions (55)Mn+ and (59)Co+. The first three peaks represent the same elements we saw on top of the reference anode. Normally, the amount of these elements is increased through calendric aging. Maybe this results in the formation of more different peaks. The presence of manganese and cobalt indicates the decomposition of the cathode. The calendric aged anode (Figure 6c) shows nine more peaks which could not be detected for the reference and cyclic cells (marked by blue vertical lines). These peaks can be correlated with the following ions and molecules: (12)C+, (13)CH+, (16)O+, (17)OH+, (24)C2+, (25)C2H+, (26)C2H2+, (39)LiO2+ and (40)LiO2H+. The peaks are combinations of the elements carbon, hydrogen, lithium and oxygen. We expect that the precipitations on top of the calendric aged anode contain hydrocarbon compounds. Comparing the reference, cyclic and calendric aged anode, large differences in chemical composition have been found.
Quantitative chemical changes in the anode (Figure 7a) and cathode (Figure 7b) surface composition (without lithium) were measured by using energy dispersive spectroscopy (EDS). Oxygen (dark green), fluorine (light green) and phosphorous (turquoise) have been significantly enriched on top of the anode for the calendric and cyclic cells. Similarly, traces of manganese (dark blue), nickel (light blue) and cobalt (middle blue) could be detected. The EDS results of the cathode surface show a significant increase in the fluorine and phosphorous values for the calendric and cyclic cells. These indicate precipitation products which cover the cathode surface. The oxygen value is lower for the calendric cell and as high as that of the reference for the cyclic cell. The values of manganese, nickel and cobalt are slightly decreased for the calendric and cyclic cells.

4. Discussion

The microscopic investigation using SEM and EDS of the anode and cathode surface shows thick depositions consisting mainly of oxygen, fluorine and phosphorous (Figure 3 and Figure 7). In particular, the oxygen content is highly increased for both aging scenarios and shows a high standard deviation for the calendric anode (Figure 7a). Bessette et al. (2019) investigated the oxidation of pure lithium under the high vacuum of a scanning electron microscope. The oxide layer was completely restored within 30 min [17]. SIMS detects lithium on top of the anode for both aging scenarios as well as for the reference anode (Figure 6). Typical lithium compounds are LiF and Li2CO3 that increase the lithium, oxygen and fluorine concentration on top of the anode [5,45,46,47]. The mass spectrometry peak m/z 33 could result from LiF enriched with another lithium ion during the excitation process. We assume that the lithium content has been increased due to aging on top of the anode. In particular, the cyclic anode shows additional lithium-related peaks (Figure 6b) probably resulting from different bonding partners. The total oxygen content might be partially increased through reactions of lithium with residual oxygen in the glovebox or a high-vacuum chamber.
The morphology on the anode surface is a thin coating with small grains that are inhomogeneously distributed (Figure 3g,i,j). Several authors have studied the morphology of aged anode surfaces. Both morphologies on top of the anode surface can be correlated well with the findings in the literature [48,49,50,51,52,53].
The thickness of the SEI has also been studied by several authors. The results vary depending on the measurement method, morphology of the graphite active material, aging scenario and state of health (SOH). Alliata et al. (2000) use atomic force microscopy (AFM) and describe that the SEI completely covers the anode surface after two cycles with a thickness of 25 nm [1]. Zhang et al. (2005) analyze it with FIB cross-sections and describe the initial SEI film with a thickness from 450 to 980 nm. After 24 cycles, they find obvious cracks and an average thickness of 1600 nm [7]. Peled et al. (2017) define two SEI categories: the initial compact SEI and the secondary SEI resulting from deposition products of electrolyte reduction [4]. If lithium ions de/intercalate into the anode, they have to cross both SEI categories. Peled et al. (2017) investigate the way in which lithium ions cross the compact SEI. The authors divide this process into three steps: first, electron transfer at the electrode/SEI interface; second, cation migration through the SEI; third, ion transfer at the SEI/electrolyte interface. They find out that step two is the rate-determining step [4]. If the growth of the compact SEI is already a significant contributor to capacity loss, then the effect of the secondary SEI can be expected to be equal or greater. Aging processes can cause thicker depositions on top of the anode, e.g., through the deposition of Mn [52,54]. These aging products do not perform the role of a properly working SEI and we define them as secondary products. Our results show a thin coating and small grains on top of the anode (Figure 3g–j). We assume that both morphologies are part of the secondary products. The CT investigation detects the delamination and deformation of the inner jelly roll for the cyclic cell. Waldmann et al. (2014) and Gorse et al. (2014) also detect this phenomenon but only for high-rate cycled 18,650 cells [39,55]. The authors propose thermally induced stress through the high discharging C-rates [55]. Combining what Peled et al. (2017) [4] and Gorse et al. (2014) [55] found, we arrive at the following consideration: depositions on top of the anode slow down the movement of the lithium ions and might cause thermally induced stress, resulting in the deformation and delamination of the inner jelly roll. The thicker the coating, the lower the C-rate required to cause deformation and delamination. This means that delamination will only occur for cycled cells, which is consistent with our results.
Börger et al. (2017) detect a swelling of the cell mainly due to the increased thickness of the negative electrode. During the opening process, they find large areas of anode active material sticking together with the separator foil. The authors anticipate that the electrolyte decomposition products act as a binder between the separator and anode surface [56]. In our case, we detect thick depositions on top of the anode and cathode foil and reduced pore sizes of the separator on the anode side (Figure 3 and Figure 4). In an unopened cell, the anode, separator and cathode foils are close together, while the interstices are wetted with electrolyte. We assume that electrolyte decomposition products occur initially on the anode/cathode surfaces, but, with aging, also in the open pores of the separator, reducing their size. This leads to further capacity reduction due to slower lithium transport. If we measure the reference anode with SIMS, we can detect two mass-to-charge ratios indicating the presence of hydrogen (m/z 1 and m/z 26). Lévy et al. (2019) define a procedure to measure H isotope ratios on FIB sections by using SIMS. It can be measured as H, H+ or OH if the hydrogen is bonded to oxygen. The difference between the three ions is the intensity of their appearance in the mass spectrum [19]. We detected H, nearly no OH (m/z 17) and no H+ for the graphite standard and the reference anode. This indicates low oxygen contamination as OH occurs normally with high intensity. Lévy et al. (2019) estimate that the residual background contamination measured using SIMS is around 200 ppm [19]. The mean water content of the reference anode is below 200 ppm (Section 3.2). However, the hydrogen peak is much more pronounced for the reference anode than for the graphite standard. The hydrogen detection of the graphite standard might be correlated with such a background contamination and the hydrogen peak of the reference anode might be more pronounced because the actual water content is added to the usual contamination. Additionally, we found a third peak, which indicates hydrogen presence ((26)C2H2) and can be detected for the reference anode. The SIMS measurement could be influenced by contamination during cell opening and preparation in the glovebox. The usual argon atmosphere in gloveboxes contains residual gases such as oxygen, water, nitrogen and carbon dioxide. In particular, the high reactive lithium on top of the reference anode (Figure 6a) could cause contamination with water. Otto et al. (2021) investigate the passivation layer on commercial lithium foils which have been stored in a glovebox [18]. Hydroxide, carbonate and oxygen fractions could be detected by using ToF-SIMS. The hydroxide fraction has been measured using the negative ion LiO2H2 [18]. However, this ion is not detectable on the reference anode. Therefore, we assume that we have no water contamination through the reaction between lithium and gaseous water inside the glovebox.
Water influences electrolyte decomposition: in water-rich LiB electrolytes, the dissociation equilibrium of the conductive salt LiPF6 shifts to Li+ and PF6 [30]. Stich (2018) describes the hydrolysis of LiPF6 with four steps, ending with the formation of phosphoric acid [24]. Equation (1) shows the overall equation [24].
LiPF6 + 4 H2O → LiF + H3PO4 + 5 HF
LiPF6 + H2O → LiF + POF3 + 2 HF
POF3 + H2O → HPO2F2 + HF
HPO2F2 + H2O → H2PO3F + HF
Step one (Equation (2) [24,30]) and two (Equation (3) [24,30]) show fast reaction kinetics in the LiB electrolyte, while step three (Equation (4) [24]) is a very slow process. The anions F, PO2F2 and PO3F2− can be used as indicators for the reaction of step one, two and three, respectively. F can react with Li+ and form LiF which is not detectable with ion chromatography. Yang et al. (2006) compare the thermal stability of neat lithium hexafluorophosphate (LiPF6) without and with 300 ppm water in the carrier gas. Without water, thermal decomposition starts at 107 °C. Using 300 ppm water in the carrier gas, thermal decomposition starts at 87 °C, forming HF and phosphoryltrifluoride (POF3) [31]. This can be correlated to step one of Stich (2018) [24]. Wiemers-Meyer et al. (2016) compare three electrolyte samples: with no water, little water and 1000 ppm water. These samples are stored at 60 °C and are subsequently measured by using NMR [30]. The authors describe the decomposition with initially high water and consistently low water. The decomposition path with initially high water forms HF and difluorophosphoric acid [30]. This can be correlated to step two of Stich (2018) [30]. Instead of step three, HPO2F2 can react with the organic solvent DMC, forming the gas CO2 and HF [30]. Jayawardana et al. (2022) also detect step two, the formation of difluorophosphoric acid [57]. In this case, the acid is formed through cycling between 4.2 V and 4.6 V on the cathode surface. The authors correlate this acid with the SEI thickening and increasing fluorophosphate content of the SEI [57]. Ion chromatography, which has been used for analysis, can detect the acid anions (PF6, F and PO2F2) in the electrolyte solution, but cannot detect the chemical compound POF3 of step one [24].
Figure 8 shows an overview of the decomposition reactions of the conductive salt LiPF6 which took place in the reference (black), calendric (blue) and cyclic (red) electrolytes through the influence of water. The reactions have been published from Wiemers-Meyer et al. (2016) [30]. The electrolytes of all three cells contain the anion PF6. The dissociation of LiPF6 enables the ionic conductivity of the electrolyte [58]. In water-rich LiB electrolytes, the dissociation equilibrium of the conductive salt LiPF6 shifts to Li+ and PF6 [30]. PF6 can also be enriched in the solution when Li+ reacts with F and forms LiF. The anions F, PO2F2 and PO3F2− are used as indicators (colored green) for step one, two and three [24], respectively. F can also be generated through the decomposition of FEC [59,60]. FEC could not be detected for the cycled cell (Table 3). The reference cell has a high fluoride concentration and difluorophosphate (PO2F2) cannot be detected (Table 3), indicating that step one has probably occurred. For the cyclic cell, no fluoride and no difluorophosphate could be detected. Instead, the anode shows a significantly increased water content (Section 3.2). Three cases are possible: First, no reaction between water and LiPF6 took place. Second, step one occurred but fluoride has been dropped out as LiF which cannot be detected by using ion chromatography. We assume that LiF has been built because the mass spectrometry investigation showed an increased number of peaks that can be correlated to lithium compounds (Figure 6). Third, no reaction between water and LiPF6 took place and the increased number of lithium compounds originate from FEC decomposition. The increased water content of the cyclic anode indicates a reaction that produces water. For the calendric cell, no fluoride but a small amount of difluorophosphate could be detected indicating that step two has occurred. The water content of the calendric anode is significantly decreased, meaning that water might be consumed by the reactions. Normally, fluoride should also be detected as a reaction product of step one and two. Since this is not the case, we assume that fluoride has reacted with lithium, forming LiF. The calendric cell originates from an experiment set-up with charged, medium charged and discharged cells. Only the charged cell showed severe aging (Figure 1). When the cell is charged, the lithium ions are intercalated into the anode active material, which means that lithium is abundant at the anode. This can lead to reactions between fluoride anions and lithium ions. In step one and two, water is consumed and the chemical compound HF is formed. As the fluoride anion could not be detected for the calendric cell, we estimate that all available fluorine has been used to form LiF. Step one and step two have fast reaction kinetics [24]. If fluorine reacts with lithium to form LiF, PO2F2 will be relatively enriched because step three has slow reaction kinetics. This can also lead to a reaction between PO2F2 and DMC. If fluorine could not react with lithium to form LiF, there would be an equilibrium for step one and two that would stop the ongoing reaction. This might be the case for a medium charged or discharged cell. The CT investigation revealed a triggered CID only for the calendric cell. This safety feature assumes severe gas evolution and prevents a run-away effect of the cell. Wiemers-Meyer et al. (2016) describe that instead of step three, HPO2F2 can react with the organic solvent DMC, forming the gas CO2, HF and a hydrocarbon compound (OPFOMeOH or OPF(OMe)2) [30]. The calendrical anode measured by using SIMS showed additional peaks for molecules consisting of hydrogen, carbon and oxygen. These peaks could only be detected for the calendric aged anode. There are still some other ways that gas could be produced: O2 occurs through cathode phase-transition reactions due to cycling or high temperatures [61]. The gases CO and CO2 occur if O2 reacts with the electrolyte [11] through the decomposition of lithium carbonate [12] or through the decomposition of EC [12,62]. H2 is produced through water reduction at the anode [12]. The combination of H2 and O2 causes explosion danger, and the formation of CO poses potential health hazards. However, the cell was aged at 60 °C in the presence of water, which reduces the thermal stability of LiPF6 [31], and secondly, we were able to measure both a gas and a hydrocarbon compound. Therefore, we assume that the reaction described by Wiemers-Meyer et al. (2016) [30] took place. It is interesting that this aging pathway could only be detected for the calendric cell and this result underlines the importance of the aging scenario.
Qian et al. (2016) investigate the influence of FEC on CEI formation. They have found out that FEC passivates the cathode surface and prevents lithium loss through immobilization at the cathode [14]. In the analyzed cyclic cell, the FEC amount is decreased to <LOD (limit of detection) during 1680 cycles with 1C. We assume that the reaction with water causes this rapid decrease and leads to intensified cathode degradation. In fact, the cyclic cell reaches the 80% state of health after around 600 cycles which is quite early. This leads to the conclusion that water also accelerates cyclic cell aging.
Electrolyte decomposition in presence of water causes severe cell aging: The decomposition of the conductive salt LiPF6 leads to a loss of active lithium, reducing the capacity of the cell. The formation of HF can lead to further aging, e.g., through corrosion of the cupper current collector [63] or through a reaction with the cathode active material, resulting in the formation of more water [64]. This reaction could have increased the water content for the cyclic cell. In the case of calendric aging, the formation of gas leads to the risk of explosion. In the case of cyclic aging, the rapid consumption of FEC enables the formation of a thick CEI combined with a further aging reaction at the cathode, leading to capacity decrease.
We used secondary ion mass spectrometry (SIMS) to compare the chemical composition of the reference, calendric and cyclic anode surfaces. For both aging scenarios, we could prove the presence of manganese, cobalt and nickel on top of the anode surfaces (Figure 6 and Figure 7). This indicates that all three elements have been migrated into the electrolyte during aging and have been precipitated on top of the anode. The charged state of the calendric cell during aging might have facilitated the release of manganese, cobalt and nickel at the cathode. This effect is well known and results from reorganization and disproportionation processes at the cathode [10,65]. If cracks appear, diffusion can take place more easily [66]. Xiao et al. (2014) investigate the reduction of manganese ions to metallic α-Mn particles which are deposited directly on the anode surface before the SEI is formed. On top of the SEI, manganese ions are reduced to MnF2, which can be correlated with SEI thickening [67]. Meunier et al. (2022) show that nickel can be incorporated in the SEI which leads to lithium loss as well as destabilization of the SEI. This effect occurs especially for high temperatures [68].
The cathode active material consists of a mixture of NMC 532 and LCO. The EDS results are an average of both materials. In both materials, crystallographic restructuring may have occurred. However, it is also possible that one material is more severely affected. Börner et al. (2016) describe superficial phase transitions of NMC 532 through local inhomogeneity in the state of charge (SOC) and C-rates which leads to the dissolution of metal ions. This could be demonstrated for a state of health (SOH) of 80% [10]. Cycling with a high C-rate leads to increased particle cracking and high cutoff potentials which accelerate electrolyte decomposition [10]. Xu et al. (2017) and Jung et al. (2014) both explain that NMC 532 transforms superficially due to high cutoff potentials [69,70].
LCO can also undergo phase transformations from a layered to spinel to rock salt structure. Cobalt changes its valence state and oxygen is released [71,72,73,74]. Sharify-Asl et al. (2017) show that this process starts superficially at the crystal facets [012] and [104] and also depends on the edge-to-plane ratio [74]. The phase transformation could be achieved through overcharging [73] and thermal treatment over 100 °C [71].
The aging conditions of this study do not include high C-rates, high cutoff potentials, overcharging or thermal treatment over 100 °C. Nevertheless, the three transition metals can be detected on the anode. In the case of calendric aging, the thermal treatment might be sufficient to produce cathode phase transformation. In the case of cyclic aging, the following reactions might have accelerated the phase transformation and dissolution of transition metals even for low C-rates: (a) local inhomogeneities in the state of charge, as described by Börner et al. (2016) [10], (b) the consumption of FEC (Table 3) or (c) the reaction between HF and the cathode active material resulting in the formation of water [64]. The effect of water presence on the CEI can be investigated in further studies.

5. Conclusions

This investigation aims to analyze the impact of water on the individual cell components for calendric and cyclic aging and to correlate it with the capacity decrease in the cell. We used commercially available 18650 cells that contain an unknown amount of residual water from the manufacturing process. Karl Fischer titration on the reference anode revealed a 160 ± 41 ppm water content. The calendric and cyclic aging strategies showed different aging mechanisms which will be summarized in the following:
Calendric aging at 60 °C in the presence of water produces thick deposition products consisting of fluorine, phosphorous and oxygen on the top of the anode and cathode. The pore sizes of the separator are significantly reduced and hinder lithium-ion migration. The de/intercalation process might also be slowed down due to the deposition products. The calendric anode has a water content of 13 ± 12 ppm. The results of the analysis suggest that the conducting salt LiPF6 of the electrolyte decomposes and forms difluorophosphate and HF, consuming water. In a second step, difluorophosphate reacts with DMC to produce a hydrocarbon compound, HF and the gas CO2. Gas formation triggers the current interrupt device (CID) and separates the inner jelly roll of the positive terminal. This causes the drastic decrease in the capacity measurement (~85% to ~10%), even though the jelly roll can have a significantly greater capacity. Electrolyte decomposition leads to a loss of active lithium, the formation of HF and a risk of explosion. HF might dissolve nickel, manganese and cobalt from the cathode active material. These elements have been detected on top of the anode. It is also possible that the thermal treatment at 60 °C induces a structural phase transformation of the cathode. The capacity decrease in the calendric cell is first characterized by slowed processes due to thick deposits, separator pore size reduction, HF formation and incipient conductive salt decomposition. Second, electrolyte decomposition accelerates until gas formation triggers the CID, which prevents a thermal run-away.
Cyclic aging took place between the potentials 2.75 and 4.2 V with 1 C at 20 °C until the state of health (SOH) of ~25% had been reached. This scenario avoids the aging parameters which typically lead to cathode degradation [10,69,71,73,74]. Nevertheless, the elements nickel, manganese and cobalt can be detected on top of the anode and indicate cathode degradation with phase transition. The separator pore size is significantly reduced and the thick depositions on top of the anode and cathode consist of fluorine, phosphorous and oxygen. By using SIMS, several additional peaks containing lithium have been measured on top of the anode. Therefore, we can assume that the amount of lithium on the anode has been increased. The additive FEC should normally prevent electrolyte decomposition forming at the cathode–electrolyte interface (CEI) and could not be detected anymore. The thick depositions on top of the anode and cathode as well as the slow de/intercalation processes might cause thermomechanical stress, which leads to the deformation and delamination of the inner jelly roll. These processes are not unknown. However, they are atypical and surprising for the chosen cyclization and aging parameters. The water content of the cyclic anode (347 ± 29 ppm) was significantly increased in comparison to the reference anode. Therefore, we assume that processes producing more water have taken place, e.g., the reaction of HF with the cathode active material resulting in the formation of water [64]. We estimate that water accelerates the already known aging mechanisms during cycling. The capacity decrease might be dominated through three key factors: cathode degradation, irreversible lithium loss and slow lithium migration and de/intercalation through thick deposits.
This study shows that water affects aging in very different ways. The severe aging phenomena emphasize that water-free production is of paramount importance for a long life and safe use of the lithium-ion battery.

Author Contributions

Conceptualization, G.S.; methodology, G.W., U.G.-S., K.W. and C.G.; software, G.C.; validation, U.G.-S. and C.G.; formal analysis, G.W., K.W. and C.G.; investigation, G.W., K.W. and C.G.; writing—original draft preparation, G.W. and C.G.; writing—review and editing, U.G.-S., G.C., T.B., H.-G.S. and G.S.; visualization, G.W. and C.G.; supervision, G.S.; project administration, T.B. and G.S.; funding acquisition, G.S. and T.B. All authors have read and agreed to the published version of the manuscript.

Funding

The project SmartPro with the subprojects LiMaProMet (Grant no. 13FH4I02IA) and Smart-BAT (Grant no. 13FH4I07IA) were funded by the German Federal Ministry of Education and Research (BMBF) within the “FH-Impuls” program. The project SUSTAIN was funded by the German Federal Ministry for Economics and Energy (BMWi) (KFZ 16BZF320C).

Data Availability Statement

The original contributions presented in the study are included in the article, further inquiries can be directed to the corresponding author.

Acknowledgments

The authors gratefully acknowledge Hiden Analytical GmbH for giving us the opportunity to use the secondary ion mass spectrometer.

Conflicts of Interest

The author Graham Cooke is employed by the company “Hiden Analytical GmbH”. The remaining authors declare that the research was conducted in the absence of any commercial or financial relationships that could be construed as a potential conflict of interest.

References

  1. Alliata, D.; Kötz, R.; Novak, P.; Siegenthaler, H. Electrochemical SPM investigation of the solid electrolyte interphase film formed on HOPG electrodes. Electrochem. Commun. 2000, 2, 436–440. [Google Scholar] [CrossRef]
  2. Peled, E.; Tow, D.B.; Merson, A.; Gladkich, A.; Burstein, L.; Golodnitsky, D. Composition, depth profiles and lateral distribution of materials in the SEI built on HOPG-TOF SIMS and XPS studies. J. Power Sources 2001, 97–98, 52–57. [Google Scholar] [CrossRef]
  3. Verma, P.; Maire, P.; Novák, P. A review of the features and analyses of the solid electrolyte interphase in Li-ion batteries. Electrochim. Acta 2010, 55, 6332–6341. [Google Scholar] [CrossRef]
  4. Peled, E.; Menkin, S. Review-SEI: Past, Present and Future. Electrochem. Soc. 2017, 164, A1703–A1719. [Google Scholar] [CrossRef]
  5. Aurbach, D.; Levi, M.D.; Levi, E.; Schechter, A. Failure and Stabilization Mechanisms of Graphite Electrodes. J. Phys. Chem. B 1997, 101, 2195–2206. [Google Scholar] [CrossRef]
  6. Shi, S.; Lu, P.; Liu, Z.; Qi, Y.; Hector, L.G.; Li, H.; Harris, S.J. Direct calculation of Li-ion transport in the solid electrolyte interphase. J. Am. Chem. Soc. 2012, 134, 15476–15487. [Google Scholar] [CrossRef]
  7. Zhang, H.-L.; Li, F.; Liu, C.; Tan, J.; Cheng, H.-M. New insight into the solid electrolyte interphase with use of a focused ion beam. J. Phys. Chem. B 2005, 109, 22205–22211. [Google Scholar] [CrossRef]
  8. Edström, K.; Gustafsson, T.; Thomas, J.O. The cathode–electrolyte interface in the Li-ion battery. Electrochim. Acta 2004, 50, 397–403. [Google Scholar] [CrossRef]
  9. Ceder, G.; Ven, A. Phase diagrams of lithium transition metal oxides: Investigations from first principles. Electrochim. Acta 1999, 45, 131–150. [Google Scholar] [CrossRef]
  10. Börner, M.; Horsthemke, F.; Kollmer, F.; Haseloff, S.; Friesen, A.; Niehoff, P.; Nowak, S.; Winter, M.; Schappacher, F.M. Degradation effects on the surface of commercial LiNi0.5Co0.2Mn0.3O2 electrodes. J. Power Sources 2016, 335, 45–55. [Google Scholar] [CrossRef]
  11. Li, T.; Yuan, X.-Z.; Zhang, L.; Song, D.; Shi, K.; Bock, C. Degradation Mechanisms and Mitigation Strategies of Nickel-Rich NMC-Based Lithium-Ion Batteries. Electrochem. Energ. Rev. 2020, 3, 43–80. [Google Scholar] [CrossRef]
  12. Rowden, B.; Garcia-Araez, N. A review of gas evolution in lithium ion batteries. Energy Rep. 2020, 6, 10–18. [Google Scholar] [CrossRef]
  13. Liu, Y.-M.; G Nicolau, B.; Esbenshade, J.L.; Gewirth, A.A. Characterization of the Cathode Electrolyte Interface in Lithium Ion Batteries by Desorption Electrospray Ionization Mass Spectrometry. Anal. Chem. 2016, 88, 7171–7177. [Google Scholar] [CrossRef]
  14. Qian, Y.; Niehoff, P.; Börner, M.; Grützke, M.; Mönnighoff, X.; Behrends, P.; Nowak, S.; Winter, M.; Schappacher, F.M. Influence of electrolyte additives on the cathode electrolyte interphase (CEI) formation on LiNi1/3Mn1/3Co1/3O2 in half cells with Li metal counter electrode. J. Power Sources 2016, 329, 31–40. [Google Scholar] [CrossRef]
  15. Würsig, A.; Buqa, H.; Holzapfel, M.; Krumeich, F.; Novák, P. Film Formation at Positive Electrodes in Lithium-Ion Batteries. Electrochem. Solid-State Lett. 2005, 8, A34–A37. [Google Scholar] [CrossRef]
  16. Zheng, H.; Sun, Q.; Liu, G.; Song, X.; Battaglia, V.S. Correlation between dissolution behavior and electrochemical cycling performance for LiNi1/3Co1/3Mn1/3O2-based cells. J. Power Sources 2012, 207, 134–140. [Google Scholar] [CrossRef]
  17. Bessette, S.; Hovington, P.; Demers, H.; Golozar, M.; Bouchard, P.; Gauvin, R.; Zaghib, K. In-Situ Characterization of Lithium Native Passivation Layer in A High Vacuum Scanning Electron Microscope. Microsc. Microanal. 2019, 25, 866–873. [Google Scholar] [CrossRef]
  18. Otto, S.-K.; Fuchs, T.; Moryson, Y.; Lerch, C.; Mogwitz, B.; Sann, J.; Janek, J.; Henss, A. Storage of Lithium Metal: The Role of the Native Passivation Layer for the Anode Interface Resistance in Solid State Batteries. Appl. Energy Mater. 2021, 4, 12798–12807. [Google Scholar] [CrossRef]
  19. Lévy, D.; Aléon, J.; Aléon-Toppani, A.; Troadec, D.; Duhamel, R.; Gonzalez-Cano, A.; Bureau, H.; Khodja, H. NanoSIMS Imaging of D/H Ratios on FIB Sections. Anal. Chem. 2019, 91, 13763–13771. [Google Scholar] [CrossRef]
  20. Lamperti, A.; Bottani, C.E.; Ossi, P.M.; Levi-Setti, R. Focused ion beam-secondary ion mass spectrometry analyses of nanostructured thin films. Surf. Coat. Technol. 2004, 180–181, 323–330. [Google Scholar] [CrossRef]
  21. Aurbach, D.; Weissmann, I.; Zaban, A.; Dan, P. On the role of water contamination in rechargeable Li batteries. Electrochim. Acta 1999, 45, 1135–1140. [Google Scholar] [CrossRef]
  22. Dubouis, N.; Serva, A.; Salager, E.; Deschamps, M.; Salanne, M.; Grimaud, A. The Fate of Water at the Electrochemical Interfaces: Electrochemical Behavior of Free Water Versus Coordinating Water. J. Phys. Chem. Lett. 2018, 9, 6683–6688. [Google Scholar] [CrossRef]
  23. Kitz, P.G.; Novák, P.; Berg, E.J. Influence of Water Contamination on the SEI Formation in Li-Ion Cells: An Operando EQCM-D Study. ACS Appl. Mater. Interfaces 2020, 12, 15934–15942. [Google Scholar] [CrossRef]
  24. Stich, M. Wasserverunreinigungen in Lithium-Ionen-Batterien. Ph.D. Thesis, Technische Universität Ilmenau, Ilmenau, Germany, 2018. [Google Scholar]
  25. Grützke, M.; Weber, W.; Winter, M.; Nowak, S. Structure determination of organic aging products in lithium-ion battery electrolytes with gas chromatography chemical ionization mass spectrometry (GC-CI-MS). RSC Adv. 2016, 6, 57253–57260. [Google Scholar] [CrossRef]
  26. Henschel, J.; Schwarz, J.L.; Glorius, F.; Winter, M.; Nowak, S. Further Insights into Structural Diversity of Phosphorus-Based Decomposition Products in Lithium Ion Battery Electrolytes via Liquid Chromatographic Techniques Hyphenated to Ion Trap-Time-of-Flight Mass Spectrometry. Anal. Chem. 2019, 91, 3980–3988. [Google Scholar] [CrossRef]
  27. Mönnighoff, X.; Friesen, A.; Konersmann, B.; Horsthemke, F.; Grützke, M.; Winter, M.; Nowak, S. Supercritical carbon dioxide extraction of electrolyte from spent lithium ion batteries and its characterization by gas chromatography with chemical ionization. J. Power Sources 2017, 352, 56–63. [Google Scholar] [CrossRef]
  28. Schultz, C.; Vedder, S.; Streipert, B.; Winter, M.; Nowak, S. Quantitative investigation of the decomposition of organic lithium ion battery electrolytes with LC-MS/MS. RSC Adv. 2017, 7, 27853–27862. [Google Scholar] [CrossRef]
  29. Stenzel, Y.P.; Wiemers-Meyer, S.; Edel, J.; Winter, M.; Nowak, S. Analysis of acidic organo(fluoro)phosphates as decomposition product of lithium ion battery electrolytes via derivatization gas chromatography-mass spectrometry. J. Chromatogr. A 2019, 1592, 188–191. [Google Scholar] [CrossRef]
  30. Wiemers-Meyer, S.; Winter, M.; Nowak, S. Mechanistic insights into lithium ion battery electrolyte degradation—A quantitative NMR study. Phys. Chem. Chem. Phys. 2016, 18, 26595–26601. [Google Scholar] [CrossRef]
  31. Yang, H.; Zhuang, G.V.; Ross, P.N. Thermal stability of LiPF6 salt and Li-ion battery electrolytes containing LiPF6. J. Power Sources 2006, 161, 573–579. [Google Scholar] [CrossRef]
  32. Waldmann, T.; Wilka, M.; Kasper, M.; Fleischhammer, M.; Wohlfahrt-Mehrens, M. Temperature dependent ageing mechanisms in Lithium-ion batteries—A Post-Mortem study. J. Power Sources 2014, 262, 129–135. [Google Scholar] [CrossRef]
  33. Chen, R.; Liu, F.; Chen, Y.; Ye, Y.; Huang, Y.; Wu, F.; Li, L. An investigation of functionalized electrolyte using succinonitrile additive for high voltage lithium-ion batteries. J. Power Sources 2016, 306, 70–77. [Google Scholar] [CrossRef]
  34. Wang, X.; Xue, W.-D.; Hu, K.; Li, Y.; Huang, R.-Y. Adiponitrile as Lithium-ion battery electrolyte additive: A positive and peculiar effect on high-voltage system. ACS Appl. Energy Mater. 2018, 1, 5347–5354. [Google Scholar] [CrossRef]
  35. Wiemers-Meyer, S.; Winter, M.; Novak, S. Battery Cell for In Situ NMR Measurements of Liquid Electrolytes. Phys. Chem. Chem. Phys. 2017, 19, 4962–4966. [Google Scholar] [CrossRef]
  36. Geisbauer, C.; Wöhrl, K.; Koch, D.; Wilhelm, G.; Schneider, G.; Schweiger, H.-G. Comparative Study on the Calendar Aging Behavior of Six Different Lithium-Ion Cell Chemistries in Terms of Parameter Variation. Energies 2021, 14, 3358. [Google Scholar] [CrossRef]
  37. Niedermeier, J.; Kopp, A.; Schmidt, J.; Schmidt, P.; Bernthaler, T.; Schneider, G. Metrologische Computertomografie zur seriennahen Anwendung an großformatigen Batteriezellen zur Qualitäts- und Funktionsbewertung. In Proceedings of the DGZfP-Jahrestagung, Leipzig, Germany, 7–9 May 2018. [Google Scholar]
  38. Kermani, G.; Keshavarzi, M.M.; Sahraei, E. Deformation of lithium-ion batteries under axial loading: Analytical model and Representative Volume Element. Energy Rep. 2021, 7, 2849–2861. [Google Scholar] [CrossRef]
  39. Waldmann, T.; Gorse, S.; Samtleben, T.; Schneider, G.; Knoblauch, V.; Wohlfahrt-Mehrens, M. A Mechanical Aging Mechanism in Lithium-Ion Batteries. J. Electrochem. Soc. 2014, 161, A1742–A1747. [Google Scholar] [CrossRef]
  40. Zhu, J.; Koch, M.M.; Lian, J.; Li, W.; Wierzbicki, T. Mechanical Deformation of Lithium-Ion Pouch Cells under In-Plane Loads—Part I: Experimental Investigation. J. Electrochem. Soc. 2020, 167, 90533. [Google Scholar] [CrossRef]
  41. Garitagoitia Cid, A.; Rosenkranz, R.; Zschech, E. Optimization of the SEM Working Conditions: EsB Detector at Low Voltage. Adv. Eng. Mater. 2016, 18, 185–193. [Google Scholar] [CrossRef]
  42. Steigerwald, M.D.G.; Arnold, R.; Bihr, J.; Drexel, V.; Jaksch, H.; Preikszas, D.; Vermeulen, J.P. New Detection System for GEMINI. Microsc Microanal 2004, 10, 1372–1373. [Google Scholar] [CrossRef]
  43. Vickerman, J.C.; Gilmore, I.S. Molecular Surface Mass Spectrometry by SIMS: The Principal Techniques, 2nd ed.; Wiley: Chichester, UK, 2009; ISBN 978-0-470-01763-0. [Google Scholar]
  44. De Hoffmann, E. Analytical Methods: Mass spectrometry. ECT 2005, 2, 586–683. [Google Scholar]
  45. Jung, E.Y.; Park, C.-S.; Lee, J.C.; Park, J.-B.; Suh, K.J.; Hong, T.E.; Lee, D.H.; Chien, S.-I.; Tae, H.-S. Influences of graphite electrode on degradation induced by accelerated charging-discharging cycling in lithium-ion battery. Mol. Cryst. Liq. Cryst. 2018, 663, 90–98. [Google Scholar] [CrossRef]
  46. An, S.J.; Li, J.; Daniel, C.; Mohanty, D.; Nagpure, S.; Wood, D.L. The state of understanding of the lithium-ion-battery graphite solid electrolyte interphase (SEI) and its relationship to formation cycling. Carbon 2016, 105, 52–76. [Google Scholar] [CrossRef]
  47. Friesen, A.; Mönnighoff, X.; Börner, M.; Haetge, J.; Schappacher, F.M.; Winter, M. Influence of temperature on the aging behavior of 18650-type lithium ion cells: A comprehensive approach combining electrochemical characterization and post-mortem analysis. J. Power Sources 2017, 342, 88–97. [Google Scholar] [CrossRef]
  48. Golla-Schindler, U.; Zeibig, D.; Prickler, L.; Behn, S.; Bernthaler, T.; Schneider, G. Characterization of degeneration phenomena in lithium-ion batteries by combined microscopic techniques. Micron 2018, 113, 10–19. [Google Scholar] [CrossRef]
  49. Marchesini, S.; Reed, B.P.; Jones, H.; Matjacic, L.; Rosser, T.E.; Zhou, Y.; Brennan, B.; Tiddia, M.; Jervis, R.; Loveridge, M.J.; et al. Surface Analysis of Pristine and Cycled NMC/Graphite Lithium-Ion Battery Electrodes: Addressing the Measurement Challenges. ACS Appl. Mater. Interfaces 2022, 14, 52779–52793. [Google Scholar] [CrossRef]
  50. Schuster, S.F.; Bach, T.; Fleder, E.; Müller, J.; Brand, M.; Sextl, G.; Jossen, A. Nonlinear aging characteristics of lithium-ion cells under different operational conditions. J. Energy Storage 2015, 1, 44–53. [Google Scholar] [CrossRef]
  51. Stockhausen, R.; Gehrlein, L.; Müller, M.; Bergfeldt, T.; Hofmann, A.; Müller, F.J.; Maibach, J.; Ehrenberg, H.; Smith, A. Investigating the dominant decomposition mechanisms in lithium-ion battery cells responsible for capacity loss in different stages of electrochemical aging. J. Power Sources 2022, 543, 231842. [Google Scholar] [CrossRef]
  52. Weisenberger, C.; Meir, B.; Röhler, S.; Harrison, D.K.; Knoblauch, V. A post-mortem study of commercial 18650 lithium-ion cells with LiNi0.5Co0.2Mn0.3O2//Graphite chemistry after prolonged cycling (> 7000 cycles) with low C-rates. Electrochim. Acta 2021, 379, 138145. [Google Scholar] [CrossRef]
  53. Lu, P.; Li, C.; Schneider, E.W.; Harris, S.J. Chemistry, Impedance, and Morphology Evolution in Solid Electrolyte Interphase Films during Formation in Lithium Ion Batteries. J. Phys. Chem. C 2014, 118, 896–903. [Google Scholar] [CrossRef]
  54. Björklund, E.; Xu, C.; Dose, W.M.; Sole, C.G.; Thakur, P.K.; Lee, T.-L.; de Volder, M.F.L.; Grey, C.P.; Weatherup, R.S. Cycle-Induced Interfacial Degradation and Transition-Metal Cross-Over in LiNi0.8Mn0.1Co0.1O2-Graphite Cells. Chem. Mater. 2022, 34, 2034–2048. [Google Scholar] [CrossRef]
  55. Gorse, S.; Kugler, B.; Schneider, G.; Knoblauch, V.; Samtleben, T.; Waldmann, T.; Wohlfahrt-Mehrens, M. An Explanation of the Ageing Mechanism of Li-Ion Batteries by Metallographic and Material Analysis. Pract. Metallogr. 2014, 51, 829. [Google Scholar] [CrossRef]
  56. Börger, E.M.; Jochler, E.; Kaufmann, J.; Ramme, R.; Grimm, A.; Nowak, S.; Schappacher, F.M.; Rodehorst, U.; Voigt, A.-C.; Passerini, S.; et al. Aging of ceramic coated graphitic negative and NCA positive electrodes in commercial lithium-ion battery cells—An ex-situ study of different states of health for identification and quantification of aging influencing parameters. J. Energy Storage 2017, 13, 304–312. [Google Scholar] [CrossRef]
  57. Jayawardana, C.; Rodrigo, N.D.; Rynearson, L.; Lucht, B.L. Difluorophosphoric Acid Generation and Crossover Reactions in LiNixCoyMnzO2 Cathodes Operating at High Voltage. J. Electrochem. Soc. 2022, 169, 60509. [Google Scholar] [CrossRef]
  58. Hwang, S.; Kim, D.-H.; Shin, J.H.; Jang, J.E.; Ahn, K.H.; Lee, C.; Lee, H. Ionic Conduction and Solution Structure in LiPF 6 and LiBF 4 Propylene Carbonate Electrolytes. J. Phys. Chem. C 2018, 122, 19438–19446. [Google Scholar] [CrossRef]
  59. Jin, Y.; Kneusels, N.-J.H.; Marbella, L.E.; Castillo-Martínez, E.; Magusin, P.C.M.M.; Weatherup, R.S.; Jónsson, E.; Liu, T.; Paul, S.; Grey, C.P. Understanding Fluoroethylene Carbonate and Vinylene Carbonate Based Electrolytes for Si Anodes in Lithium Ion Batteries with NMR Spectroscopy. J. Am. Chem. Soc. 2018, 140, 9854–9867. [Google Scholar] [CrossRef]
  60. Michan, A.L.; Parimalam, B.S.; Leskes, M.; Kerber, R.N.; Yoon, T.; Grey, C.G.; Lucht, B.L. Fluoroethylene Carbonate and Vinylene Carbonate Reduction: Understanding Lithium-ion Battery Electrolyte Additives and Solid Electrolyte Interphase Formation. Chem. Mater. 2016, 28, 8149–8159. [Google Scholar] [CrossRef]
  61. Duan, J.; Tang, X.; Dai, H.; Yang, Y.; Wu, W.; Wei, X.; Huang, Y. Building Safe Lithium-Ion Batteries for Electric Vehicles: A Review. Electrochem. Energ. Rev. 2020, 3, 1–42. [Google Scholar] [CrossRef]
  62. Sloop, S.E.; Kerr, J.B.; Kinoshita, K. The role of Li-ion battery electrolyte reactivity in performance decline and self-discharge. J. Power Sources 2003, 119–121, 330–337. [Google Scholar] [CrossRef]
  63. Vetter, J.; Novák, P.; Wagner, M.R.; Veit, C.; Möller, K.-C.; Besenhard, J.O.; Winter, M.; Wohlfahrt-Mehrens, M.; Vogler, C.; Hammouche, A. Ageing mechanisms in lithium-ion batteries. J. Power Sources 2005, 147, 269–281. [Google Scholar] [CrossRef]
  64. Tesfamhret, Y. Transition Metal Dissolution from Li-Ion Battery Cathodes. Ph.D. Thesis, Uppsala University, Uppsala, Sweden, 2022. [Google Scholar]
  65. Hunter, J. Preparation of a New Crystal Form of Manganese Dioxide: Y-MnO2. J. Solid State Chem. 1981, 39, 142–147. [Google Scholar] [CrossRef]
  66. Besli, M.M.; Xia, S.; Kuppan, S.; Huang, Y.; Metzger, M.; Shukla, A.K.; Schneider, G.; Hellstrom, S.; Christensen, J.; Doeff, M.M.; et al. Mesoscale Chemomechanical Interplay of the LiNi0.8Co0.15Al0.05O2 Cathode in Solid-State Polymer Batteries. Chem. Mater. 2019, 31, 491–501. [Google Scholar] [CrossRef]
  67. Xiao, X.; Liu, Z.; Baggetto, L.; Veith, G.M.; More, K.L.; Unocic, R.R. Unraveling manganese dissolution/deposition mechanisms on the negative electrode in lithium ion batteries. Phys. Chem. Chem. Phys. 2014, 16, 10398–10402. [Google Scholar] [CrossRef]
  68. Meunier, V.; de Souza, M.L.; Morcrette, M.; Grimaud, A. Electrochemical Protocols to Assess the Effects of Dissolved Transition Metal in Graphite/LiNiO2 Cells Performance. J. Electrochem. Soc. 2022, 169, 70506. [Google Scholar] [CrossRef]
  69. Jung, S.-K.; Gwon, H.; Hong, J.; Park, K.-Y.; Seo, D.-H.; Kim, H.; Hyun, J.; Yang, W.; Kang, K. Understanding the Degradation Mechanisms of LiNi0.5Co0.2Mn0.3O2 Cathode Material in Lithium Ion Batteries. Adv. Energy Mater. 2014, 4, 1300787. [Google Scholar] [CrossRef]
  70. Xu, J.; Lin, F.; Doeff, M.M.; Tong, W. A review of Ni-based layered oxides for reachargeable Li-ion batteries. J. Mater. Chem. A 2017, 5, 874–901. [Google Scholar] [CrossRef]
  71. Sharifi-Asl, S.; Soto, F.A.; Nie, A.; Yuan, Y.; Asayesh-Ardakani, H.; Foroozan, T.; Yurkiv, V.; Song, B.; Mashayek, F.; Klie, R.F.; et al. Facet-Dependent Thermal Instability in LiCoO2. Nano Lett. 2017, 17, 2165–2171. [Google Scholar] [CrossRef]
  72. Jung, D.-H.; Umirov, N.; Kim, T.; Bakenov, Z.; Kim, J.-S.; Kim, S.-S. Thermal and Structural Stabilities of Lix CoO2 Cathode for Li Secondary Battery Studied by a Temperature Programmed Reduction. Eurasian Chem.-Technol. J. 2019, 21, 3–12. [Google Scholar] [CrossRef]
  73. Kikkawa, J.; Shohei Terada, S.; Gunji, A.; Nagai, T.; Kurashima, K.; Kimoto, K. Chemical States of Overcharged LiCoO2 Particle Surfaces and Interiors Observed Using Electron Energy-Loss Spectroscopy. J. Phys. Chem. 2015, 119, 15823–15830. [Google Scholar] [CrossRef]
  74. Fuller, E.J.; Ashby, D.S.; Polop, C.; Salagre, E.; Bhargava, B.; Song, Y.; Vasco, E.; Sugar, J.D.; Albertus, P.; Menteş, T.O.; et al. Imaging Phase Segregation in Nanoscale LixCoO2 Single Particles. ACS Nano 2022, 16, 16363–16371. [Google Scholar] [CrossRef]
Figure 1. A comparison of two different aging scenarios resulting in a capacity decrease. (a) The calendric aged cell is part of a test series, which stores the cells at 60 °C in a discharged, medium charged and charged state. The rapid capacity decrease through the triggered current interrupt device (CID) (Section 3.1) occurs only for the charged state. (b) Cyclic aging takes place under laboratory conditions (20 ± 2 °C) between the potentials 2.75 V and 4.2 V. The long-term cycled cell passes through 1680 cycles which results in a normalized SOH of 24.6%.
Nanoenergyadv 04 00011 g001
Figure 2. The detection of two macroscopic aging phenomena with computer tomography (CT) comparing the reference, calendric and cyclic aged cells. (ac) The positive pole can be seen from a side view. It shows the current interrupt device (CID) which is triggered for the calendric aged cell. (df) The jelly roll inside the cell is compared in cross-sections. The cyclic aged cell shows a delamination process in the middle.
Nanoenergyadv 04 00011 g002
Figure 3. The detection of deposition products by using scanning electron microscopy (SEM). (a,cf) SEM of the top cathode surface; the top cathode surface consists of active material particles with graphite binder (purple—graphite binder) in between. The calendric and cyclic aged cell have precipitations on top (blue—calendric, red—cyclic). (d) The depositions on the calendric top cathode surface are sensitive to electron beam damage. (e) The fine-grained depositions on the cyclic top cathode surface are difficult to distinguish from the graphite binder. (b,gj) SEM of the top anode surface; the reference anode has a clean surface showing several graphite plates. The changes on the top of the calendric anode are dominated by a thin coating (green-colored) showing (h) brighter material contrast areas with the EsB detector. The cyclic anode shows small grains (cyan-colored) as well as a thin coating which covers the surface completely. (j) The small grains are larger and more frequent for the cyclic anode.
Nanoenergyadv 04 00011 g003
Figure 4. Pore size comparison using SEM of (a) reference, (b) calendric and (c) cyclic cell; Significant pore size reduction for calendric and cyclic cell; (d) separator consists of large and small pores and fibers. Pores of reference, calendric and cyclic separator correspond to 16.1%, 7.4% and 4.7% of surface, respectively. (e) Area-weighted pore size distribution of reference (black), calendric (blue) and cyclic (red) separator; significant decrease in large pore sizes and increase in small pore sizes for calendric and cyclic cell.
Nanoenergyadv 04 00011 g004
Figure 5. A comparison of (b) the reference anode mass spectrum with (a) the graphite standard (industrial graphite, IGS-895, Nippon Carbon) mass spectrum with negative ions using secondary ion mass spectrometry (SIMS); (a) the graphite standard spectrum has peaks for the m/z ratios 24, 25 and 36 and traces for 1 and 26; (b) the m/z ratios 1 and 26 are clearly visible for the reference anode and indicate hydrogen on top.
Nanoenergyadv 04 00011 g005
Figure 6. Mass spectra comparison of (a) the reference (black) with (b) the cyclic (red) and (c) the calendric (blue) anode using secondary ion mass spectrometry (SIMS) with positive ions. (a) The reference has five significant mass/charge ratios: 6, 7, 14, 19, 23 and 33; these represent elements enriched on top through the first SEI. They can also be found for the cyclic and calendric anode spectra. (b) The cyclic anode has additional lithium peaks with the mass/charge ratios 30, 31 and 32; two peaks represent manganese and cobalt (m/z 55 and 59). These indicate cathode decomposition combined with element diffusion processes. (c) The calendric anode spectrum presents the same peaks as the cyclic anode and has seven additional mass/charge ratios which can be correlated to combinations of hydrogen, carbon and oxygen. Two more peaks show additional lithium ions which can only be detected for the calendric anode.
Nanoenergyadv 04 00011 g006
Figure 7. Ion content comparison of (a) the top of the anode and (b) the top of the cathode using energy dispersive spectroscopy (EDS); (a) the calendric (A) and cyclic (Y) anode spectrum is significantly enriched with oxygen, fluorine and phosphorous. Traces of manganese, cobalt and nickel could be detected which indicates cathode decomposition. The measurement parameters are 15 kV/35 pA, WD = 5 mm and a magnification of 5000. (b) The calendric (A) and cyclic (Y) cathode spectrum is significantly enriched with fluorine and phosphorous. The oxygen content reduces only for the calendric cell. The measured amount of manganese, cobalt and nickel is reduced for the calendric and cyclic cells; the measurement parameters are 15 kV/67 pA, WD = 5 mm and a magnification of 1000.
Nanoenergyadv 04 00011 g007
Figure 8. An overview of the decomposition reactions of the conductive salt LiPF6 taking place in the electrolyte of the reference (black), calendric (blue) and cyclic (red) cells identified with indicator anions (colored green); the reaction of the reference cell stops after step one [24], while the reaction of the calendric cell continues to step two [24] and then reacts with DMC, forming the gas CO2. The cyclic cell shows no fluoride anion but based on the mass spectrometry results, we assume that step one has taken place and LiF has been formed.
Nanoenergyadv 04 00011 g008
Table 1. The electrolyte components measured with GC-FID; each value has an accuracy of ±5%.
Reference
ethylene carbonate (EC) [ma %]25.2
ethyl methyl carbonate (EMC) [ma %]17.2
dimethyl carbonate (DMC) [ma %]52.6
diethylcarbonate (DEC) [ma %]0.35
fluoroethylene carbonate (FEC) [ma %]2.7
succinonitrile [ma %]0.4
adiponitrilePeak overlap with EMDOHC
Table 2. EDS measurement parameters.
AnodeCathode
Acceleration voltage [kV]1515
Current [pA]3567
Working distance [mm]55
Magnification50005000
Table 3. Electrolyte comparison of the reference, calendric and cyclic cells. The electrolyte analysis reveals differences in the ion content of fluoride, hexafluorophosphate, difluorophosphate and fluoroethylene carbonate; the fluoride anion can only be detected for the reference cell and is below the limit of detection (LOD) for the calendric and cyclic aged cell; calendric aging increases the content of hexafluorophosphate and leads to the formation of difluorophosphate; cyclic aging also increases the hexafluorophosphate content and consumes the additive FEC.
ReferenceCalendric AgedCyclic Aged
Fluoride (F)0.15 mol/L<LOD 1<LOD 1
Hexafluorophosphate (PF6)0.79 mol/L1.17 mol/L1.34 mol/L
Difluorophosphate (PO2F2)<LOD 133 mmol/L<LOD 1
Fluoroethylene carbonate (FEC)2.7 ma %2.4 ma %<LOD 1
Succinonitrile0.4 ma %<LOD 1<LOD 1
Adiponitriledetected<LOD 1<LOD 1
1 Limit of detection.
Disclaimer/Publisher’s Note: The statements, opinions and data contained in all publications are solely those of the individual author(s) and contributor(s) and not of MDPI and/or the editor(s). MDPI and/or the editor(s) disclaim responsibility for any injury to people or property resulting from any ideas, methods, instructions or products referred to in the content.

