1. Introduction
Advanced age is associated with decreased ankle and increased hip joint mechanical output during walking [
1,
2,
3,
4,
5]. Although this hip-to-ankle (often referred to as distal-to-proximal) mechanical redistribution is commonly reported in older adults, the causes and functional consequences of this gait feature remain unclear. One leading hypothesis is that physiological changes associated with advanced age disproportionately affect muscles and other soft tissues (e.g., the Achilles tendon) spanning the ankle and that older adults shift mechanical output toward the hips as a compensatory strategy [
6]. Given the importance of the ankle plantarflexors in generating propulsive forces during walking, reduced utilization of these tissues has traditionally been considered maladaptive. However, emerging evidence suggests that mechanical redistribution may, in some respects, be beneficial for older adults. For example, redistribution magnitudes share positive relationships with self-reported measures of physical capacity and quantitative measures of gait performance [
1]; older adults with a history of long-distance running adopt larger magnitudes of mechanical redistribution compared to those without such a history [
7]; strength and power training have been shown to increase hip relative to ankle joint mechanical output in healthy older adults [
8]; and healthy older adults rely on larger magnitudes of redistribution to complete more challenging gait tasks (e.g., uphill walking, maximal speed walking) [
1,
9]. In this light, it is possible that increased utilization of motor output from the hip joint reflects a form of motor “flexibility”—i.e., the ability to alter gait patterns in response to changes in the internal/external environment—and that healthier older adults are those who are more capable of adapting gait mechanics when needed.
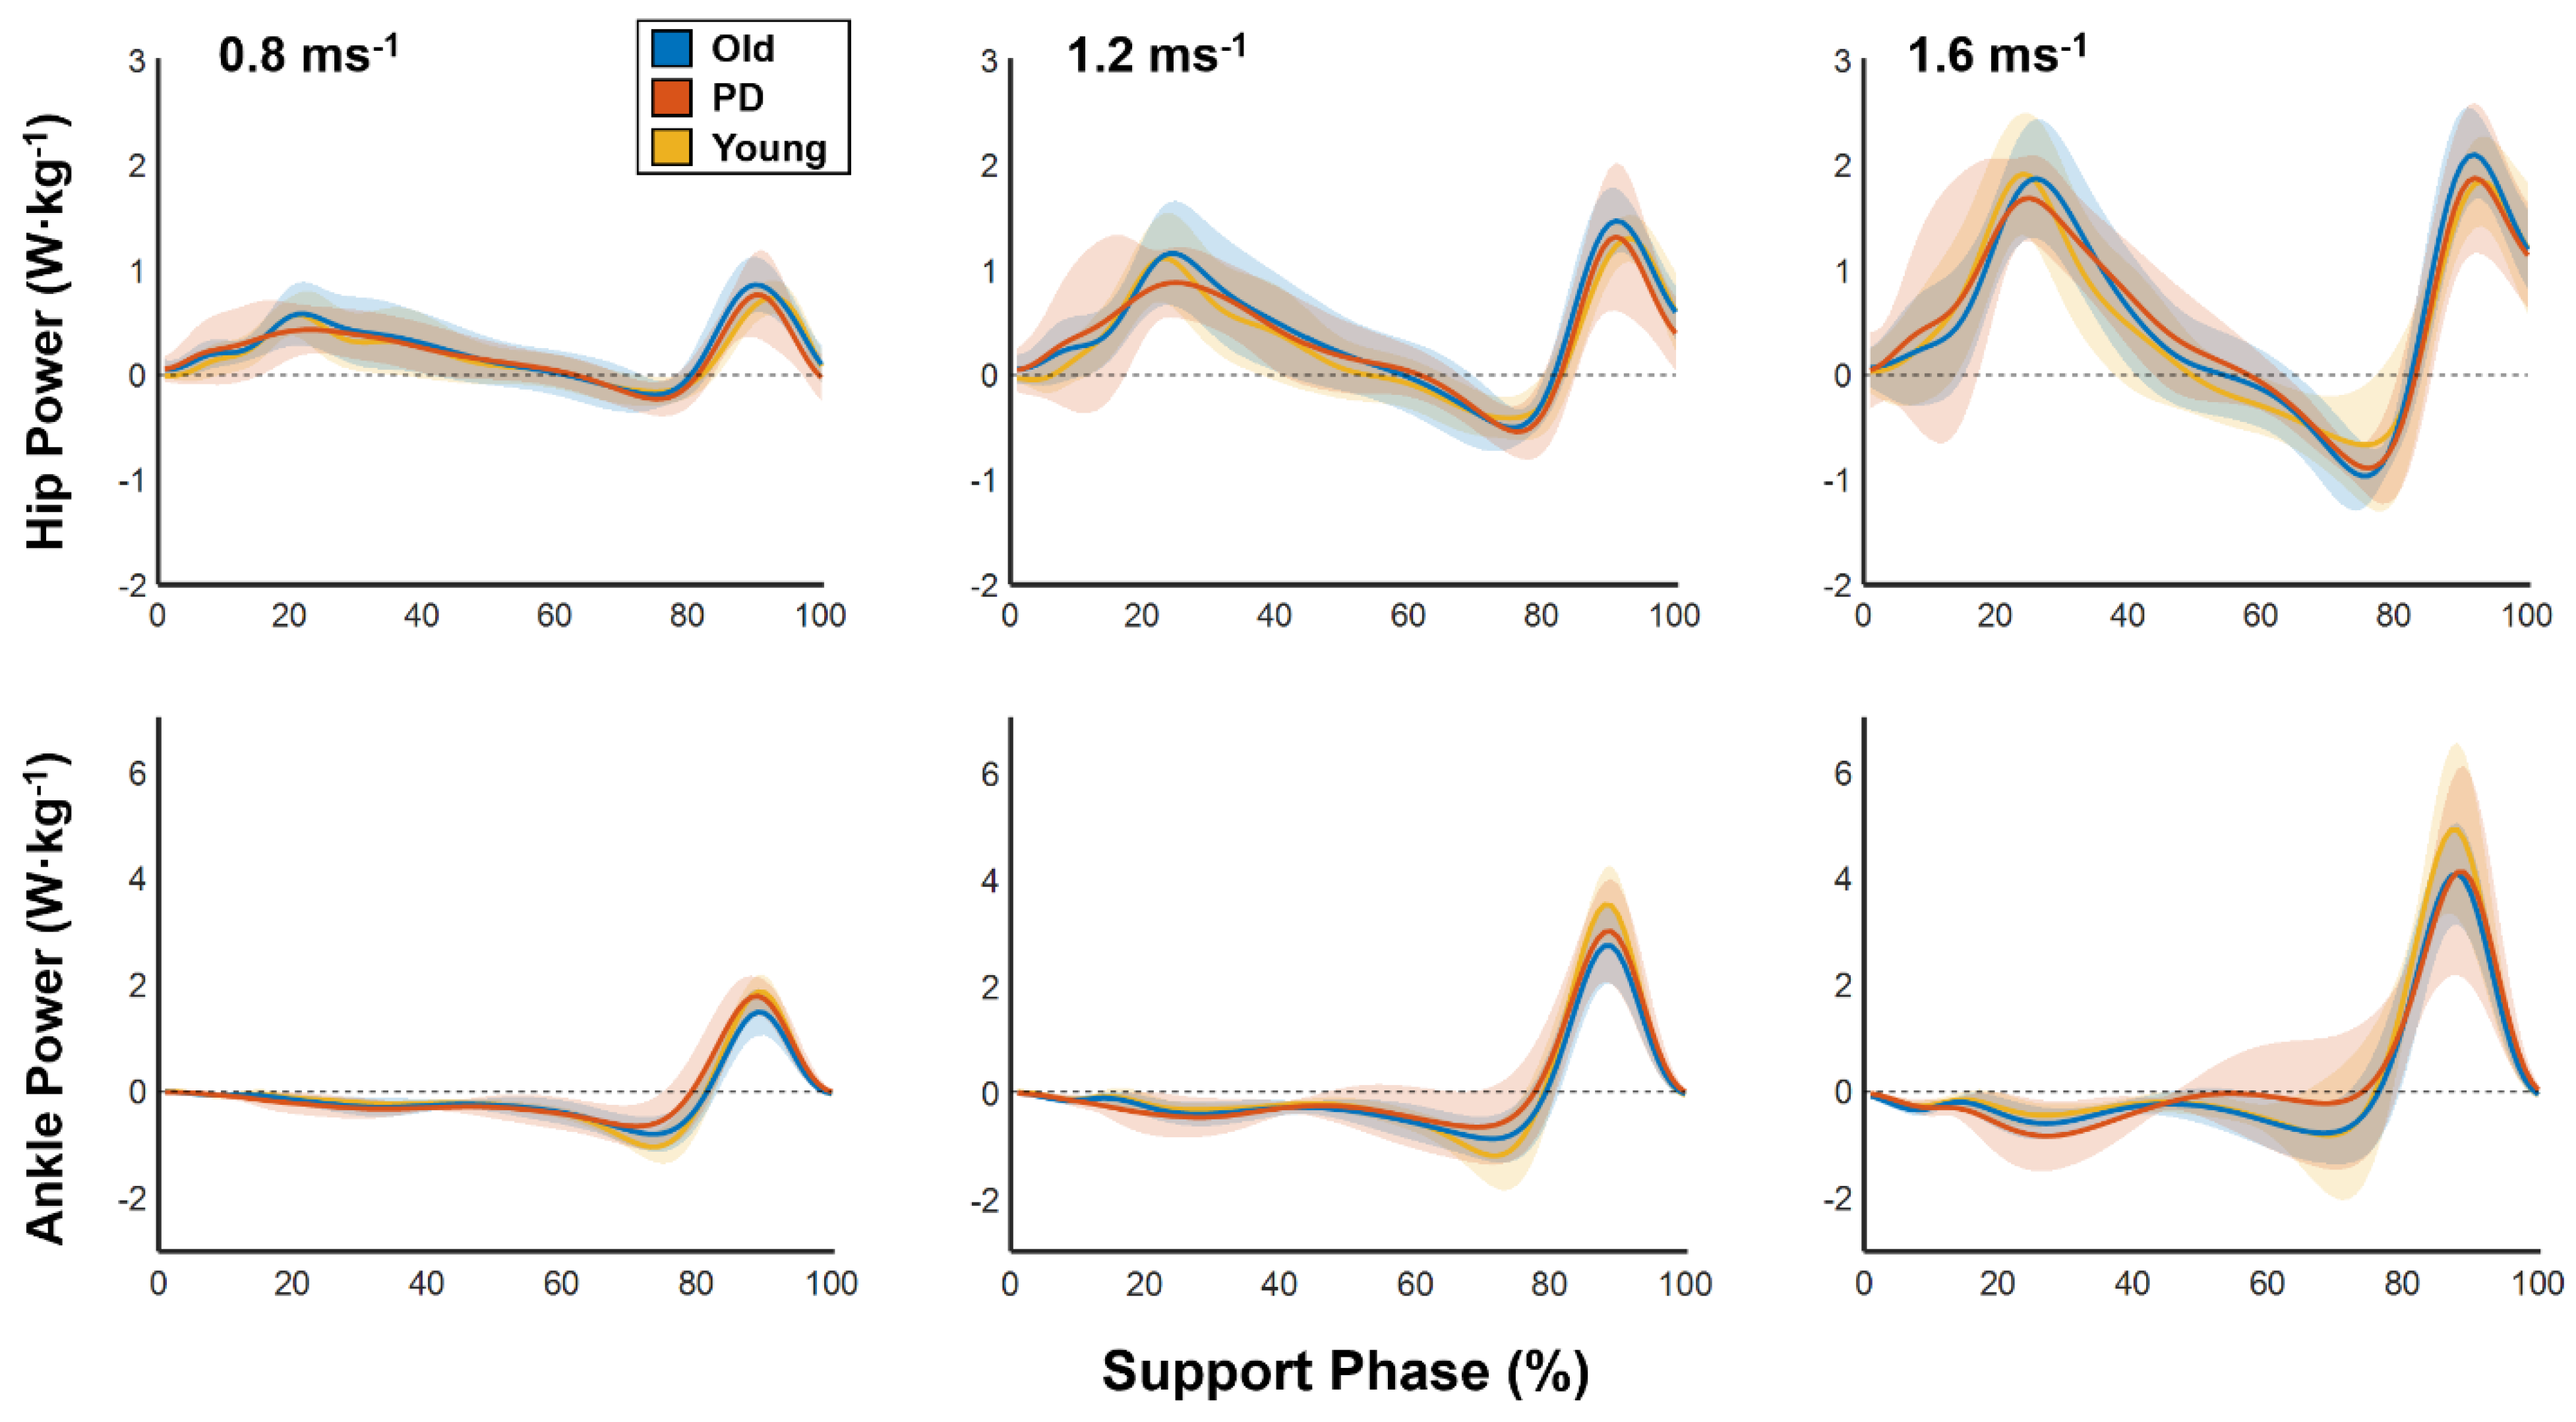
Our recent work indicates that healthy younger adults alter individual joint function when walking at faster speeds. Specifically, we found that the ankle joint functioned less as a mechanical spring (passively absorbing and restoring energy) and more as a mechanical motor (actively generating push-off force) as walking speed increased from 0.8 to 2 ms
−1 [
10]. Physiological changes to the ankle plantarflexors (e.g., reduced muscle mass, decreased neural drive) that occur with advanced age may limit their ability to function as effective motors and healthy older adults may compensate by redistributing mechanical output toward more proximal muscles [
11]. Such a scenario may provide an explanation for increased magnitudes of mechanical redistribution reported in healthy older adults walking at faster speeds [
9]. Interestingly, individuals with Parkinson’s disease (PD), who are often within the age range of “older” adults at initial diagnosis, likely experience the same changes to the ankle plantarflexors but do not appear to adopt larger magnitudes of mechanical redistribution to walk at faster speeds [
9,
12]. This inability to alter mechanical output may be a manifestation of loss of motor flexibility previously reported in PD patients during gait and postural adaptation tasks [
13,
14]. Thus, individuals with PD may not only have difficulty using the ankle as an effective motor but may also lack the ability to compensate via proximal redistribution of mechanical output. Functionally, this combination may limit the extent to which individuals with PD can reach fast walking speeds. In community settings, inability to walk at sufficiently fast speeds can have negative consequences for general mobility—e.g., inability to safely cross a city street.
Given the known physiological and biomechanical effects of advanced age on the ankle plantarflexors, it seems likely that older adults would have a reduced capacity to utilize the ankle joint as a mechanical motor at progressively faster walking speeds. To address this, we tested the hypothesis that advanced age, regardless of the presence of PD, reduces the extent to which individuals can increase motor-like behavior of the ankle plantarflexors across progressively faster walking speeds. A growing body of evidence now suggests that healthy older adults disproportionately rely on mechanical output from more proximal joints (i.e., the hips) to walk at faster speeds, perhaps as a compensatory strategy for reduced capacity to use the ankle as a mechanical motor. Interestingly, previous work from our lab suggests that individuals with Parkinson’s disease—despite being in the age range typically used to define older adults—do not adopt such a strategy. To address this, we tested whether healthy older adults exhibited disproportionately greater redistributions of mechanical work across progressively faster walking speeds compared to both healthy younger adults and individuals with PD.
2. Materials and Methods
2.1. Participants
Sixteen healthy younger adults (age: 31.0 ± 5.9), 16 healthy older adults (age: 68.6 ± 3.1), and 8 PD patients (age: 64.0 ± 9.1) participated in this study (
Table 1). Eligibility criteria were: (1) ≥18 years and ≤35 years for healthy younger individuals and ≥65 years for older adults, (2) able to walk at least 10 m without assistance, (3) able to walk continuously for at least 60 steps on a treadmill without assistance, and (4) must not have any musculoskeletal conditions affecting independent ambulation. Healthy younger and older adults were excluded if they if they had cognitive impairment (Mini-Mental State Examination score < 24) or progressive neurological deficits or musculoskeletal conditions affecting ambulation. Individuals with PD were ≥45 years old and clinically diagnosed with idiopathic PD with Hoehn and Yahr (H&Y) stages 2 or 3. PD patients were excluded from the study if they presented cognitive impairment, signs or symptoms concerning atypical or secondary parkinsonism, or a diagnosis of other existing neurological disorders and/or medical conditions affecting ambulation. The study was conducted according to the guidelines of the Declaration of Helsinki and approved by the Institutional Review Board of the University of Alabama at Birmingham. Informed consent was obtained from all subjects involved in this study.
2.2. Experimental Set-Up
Kinematic and kinetic data were collected using 11 infrared cameras (Vicon Motion Systems, Denver, CO, USA; 100 Hz) and a dual-belt force-instrumented treadmill (Motek Link, Amsterdam, Netherlands; 1000 Hz), respectively. Vicon Nexus, Visual 3D (C-Motion Inc., Rockville, MD, USA), and laboratory software developed in MATLAB (v2020b; MathWorks Inc., Natick, MA, USA) and R ([
15]; Version 4.0.2) were used to collect, process, and analyze biomechanical data.
2.3. Experimental Protocol
Passive reflective markers were placed on anatomical landmarks to define and track movement of the forearms, upper arms, trunk, pelvis, thighs, shanks, and feet. Each of these segments was treated as a rigid body for biomechanical analysis. Prior to performing the experimental protocol, participants performed a practice treadmill walking trial to ensure familiarity with the laboratory setting. Participants then performed treadmill walking trials at 0.8, 1.2, and 1.6 ms−1. Each trial lasted ~60 s and participants rested as needed between trials. Between trials, participants were asked whether they wanted to attempt to walk at a faster speed. If participants answered in the affirmative, the next trial was performed; if they declined, the protocol ended. All PD patients completed the protocol while optimally medicated to reduce PD-related symptoms.
2.4. Data Analysis
Marker trajectories and ground reaction forces were filtered using low-pass 4th-order Butterworth filters with cutoff frequencies of 6 and 12 Hz, respectively. Net joint moments and powers were estimated using inverse dynamics in Visual 3D and the following outcome variables were calculated using custom written software developed in MATLAB.
For the hip, knee, and ankle of both legs, we calculated positive joint work (
) as the integral of all positive portions of each joint’s support phase power curve. We then calculated each joint’s contribution to total positive work (i.e., relative joint work) using the following equations:
To capture the distal-to-proximal redistribution of mechanical output using a single variable, we used a hip-to-ankle ratio in which increased hip and/or decreased ankle mechanical output results in larger values and thus larger magnitudes of redistribution:
We calculated strut, spring, motor, and damper indices at the ankle during the support phase to characterize the joint’s mechanical function during walking [
10,
16,
17]. This analysis—referred to as “joint functional indexing”—is used to functionally characterize the mechanical work performed by joints during locomotion. It quantifies, by percent, the extent to which a particular joint functions as a strut, spring, motor, and damper and the equations included in the analysis are performed such that the sum of percentages of all functions equals 100%.
Strut index: The strut index was calculated as the ratio of joint-level mechanical work over moment impulse during the support phase. The strut index will be higher when large moments occur concurrently with little mechanical work.
where
is the strut index;
is time of toe-off and
is time of heel strike;
represents joint power and
represents joint moment.
Spring-index: The spring-index represents potential storage and return of energy at a joint. Spring-like behavior was defined as any period of negative work (“potential storage” work;
) followed immediately by positive work (“potential return” work;
), such that the negative work could be stored and returned. When multiple instances of such behavior occurred,
was calculated as the sum of work from all periods of potential storage and
was calculated as work from all periods of potential return.
where
represents negative work and
represents positive work.
Motor-index: The motor-index represents positive work not performed via spring-like behavior. The motor-index will be higher when large amounts of positive work are not immediately preceded by large amounts of negative work.
Damper-index: The damper-index represents negative work that is not potentially stored for spring-like behavior. The damper-index will be higher when large amounts of negative work are not immediately followed by large amounts of positive work.
All variables were calculated for as many steps as possible for each participant in each trial. For some participants, not all steps could be analyzed due to inappropriate foot placement on the treadmill (e.g., the left foot contacted the right treadmill belt). We refrained from providing corrective feedback during walking trials to ensure that participants did not purposefully change their gait (e.g., increase step width) to maintain appropriate foot placement. For each participant, data were averaged across both legs at each speed.
2.5. Statistical Analysis
To determine the effects of group (younger, older, PD), speed (0.8, 1.2, 1.6 ms−1), and their interaction on all outcome variables, we used group (between subjects factor) by speed (within subject factor) repeated measures ANOVAs. Based on our hypotheses, we expected to find significant group-by-speed interactions for ankle motor index (with younger increasing across speeds to a greater extent than older and PD) and redistribution ratios (with older increasing across speeds to a greater extent than younger and PD). When appropriate, we conducted post-hoc pairwise comparisons using Bonferroni adjustments for multiple comparisons. For all analyses, p < 0.05 was used as the threshold for determining statistical significance.
4. Discussion
In this study we tested the hypothesis that advanced age (regardless of the presence of PD) reduces the extent to which older individuals can increase motor-like behavior of the ankle plantarflexors across progressively faster walking speeds. In support of this hypothesis, we found that both older and PD groups increased motor-like function of the ankle to a lesser extent than younger adults as walking speed increased from 0.8 to 1.6 ms−1. We also tested the hypothesis that healthy older adults would exhibit disproportionately greater distal-to-proximal redistribution of mechanical work across progressively faster walking speeds. This hypothesis was not supported by our results, as we found that older adults decreased redistribution ratios as walking speed increased. Thus, although older adults appear to have a reduced capacity to utilize the ankle as a mechanical motor across walking speeds, we did not find evidence that increased reliance on mechanical output from the hip serves as a compensatory mechanism.
In support of our previous work, we found that healthy younger adults increasingly use the ankle as a mechanical motor to walk at faster speeds [
10]. We now show that older adults have a reduced capacity to increase motor-like behavior of the ankle plantarflexors, regardless of the presence of PD. On average, compared to younger adults, older and PD groups reached ~12% and ~8% lower motor indices at 1.6 ms
−1, respectively. This is somewhat unsurprising, as several relatively well-established, age-related physiological changes likely reduce the capacity for older adults to use their plantarflexors to actively generate large amounts of energy. For example, even healthy advanced aging is associated with reduced muscle volume, smaller cross-sectional area, and changes to fiber-type contribution and motor unit properties [
18]. Combined, these advanced age-related changes render muscles less capable of generating large forces over short time horizons (e.g., over the course of a single step during walking), reducing their capacity to serve as mechanical motors [
19].
Our findings add to the growing body of literature describing the advanced age-related distal-to-proximal redistribution of mechanical output [
1,
2,
3,
4,
5,
6,
8,
9]. Although we did not observe increased redistribution magnitudes across progressively faster speeds, we found that across all speeds healthy older adults exhibit increased reliance on mechanical output from the hip during walking [
2,
8,
9]. Specifically, on average across all speeds, healthy older adults exhibited larger hip and smaller ankle joint contributions to mechanical work (i.e., relative work) as well as larger redistribution ratios compared to both healthy younger adults and individuals with PD. Larger redistributions of mechanical work in healthy older adults versus individuals with PD supports the emerging hypothesis that this gait adaptation represents a beneficial adaptation with advanced aging [
1,
5,
7,
9]. The notion that a more proximally controlled gait strategy is beneficial comes not only from cross-sectional observations, but also from longitudinal exercise studies. Specifically, Beijersbergen et al., (2017) showed that 10 weeks of power training resulted in increased hip and decreased ankle joint mechanical output and increased walking speeds in older adults [
8]. It remains unclear how increased reliance on mechanical output from the hip can be beneficial for older adults. Over three decades ago, Winter et al., (1990) suggested that increased hip joint extensor moments in older adults could aid in stabilizing the head, arms, and trunk during locomotion and may therefore represent a stability-related adaption [
20]. Similar shifts toward hip-driven control strategies have also been observed in older adults performing progressively more challenging postural tasks, lending support to the argument that this control strategy is beneficial for stability [
21]. Future studies are warranted to more adequately test the hypothesis that increased magnitudes of mechanical redistribution provide older adults more stability during locomotion tasks.
We found that relative contributions from the hip and ankle joints in PD remained stable across speeds, which supports prior findings [
9]. These results add further support to the notion that PD is associated with a loss of motor flexibility, which has now been observed across a range of locomotion and postural disturbance tasks [
13,
14]. It should be noted, however, that inability to redistribute joint-level mechanical output during walking constitutes only a small set of metrics collected during a single task, whereas the general term “motor inflexibility” is often used to reflect multiple domains of the nervous system. PD stems primarily from a lack of dopamine-producing neurons in the substantia nigra, which disrupts a number of dopamine-mediated neural circuits within and outside of the basal ganglia. Some of these circuits are involved in neural processes (e.g., sensorimotor integration) thought to underpin motor adaptions [
22,
23,
24]. Although all participants in the current study completed the protocol while optimally medicated, recent evidence suggests that between-patient differences in motor adaptation exist even during on-medication testing [
25]. It is possible that our cohort of PD patients included primarily individuals with lower capacities for motor adaptations, even while optimally medicated. Functionally, an inability to appropriately adapt motor outputs to meet the demands of the environment may reduce one’s ability to move safely and independently (i.e., reduce mobility) through the community. From a rehabilitation perspective it remains unclear how to target motor adaptability, however, promising new technologies (e.g., closed-loop, adaptive deep brain stimulation) and protocols (e.g., robotic-assisted training) are currently being developed [
26,
27].
It is important to consider several limitations when interpreting our findings. A formal sample size estimation was not performed prior to beginning this study and our relatively small sample of participants, particularly in the PD cohort, coupled with a large number of pairwise comparisons may have biased our results and limited our ability to observe between-group differences in post-hoc analyses. Relatedly, our inclusion criteria ensured that all participants enrolled in this study were relatively healthy and high functioning. This sampling process may have biased our results, as in the older adult and PD communities at large, health status and general physical fitness vary widely, and this variation may not have been sufficiently reflected in our cohorts. Our results may therefore not be generalizable to these wider populations. Data in this study were collected while participants walked on a treadmill at standardized speeds, which limits our ability to generalize these findings to real world scenarios, where individuals walk overground at self-selected speeds. Indeed, even in laboratory settings, differences in joint-level kinetic data between overground and treadmill walking have been observed [
28]. Further, variation in physical fitness between participants may have led to variation in their relative efforts at each walking speed, which may have influenced our results. The functional indexing method includes several assumptions which may not capture true biological function of the muscles and other tissues spanning the ankle joint. For example, the spring index equation assumes that 100% of negative work proceeded immediately by positive work can be stored and returned. In reality, even highly efficient biological systems cannot store and return 100% of energy [
29]. The functional indexing method relies on joint-level moments and powers, which we estimated using an inverse dynamics approach. This approach estimates net forces acting across the joint. Although we attributed our findings from the ankle to plantarflexor behavior, it is entirely possible that some of the behavior captured at the ankle represents antagonist muscles and even muscles spanning other joints [
30].


 ,
, 

