
Horizontal Deceleration Performance in Professional Female Handball Players


 , , , , and
Abstract
:1. Introduction
2. Materials and Methods
2.1. Participants
2.2. Acceleration–Deceleration Assessment
2.3. The 5-0-5 Change-in-Direction Test
2.4. Radar Data Analysis
2.5. Countermovement Vertical Jump Test
2.6. Statistical Analysis
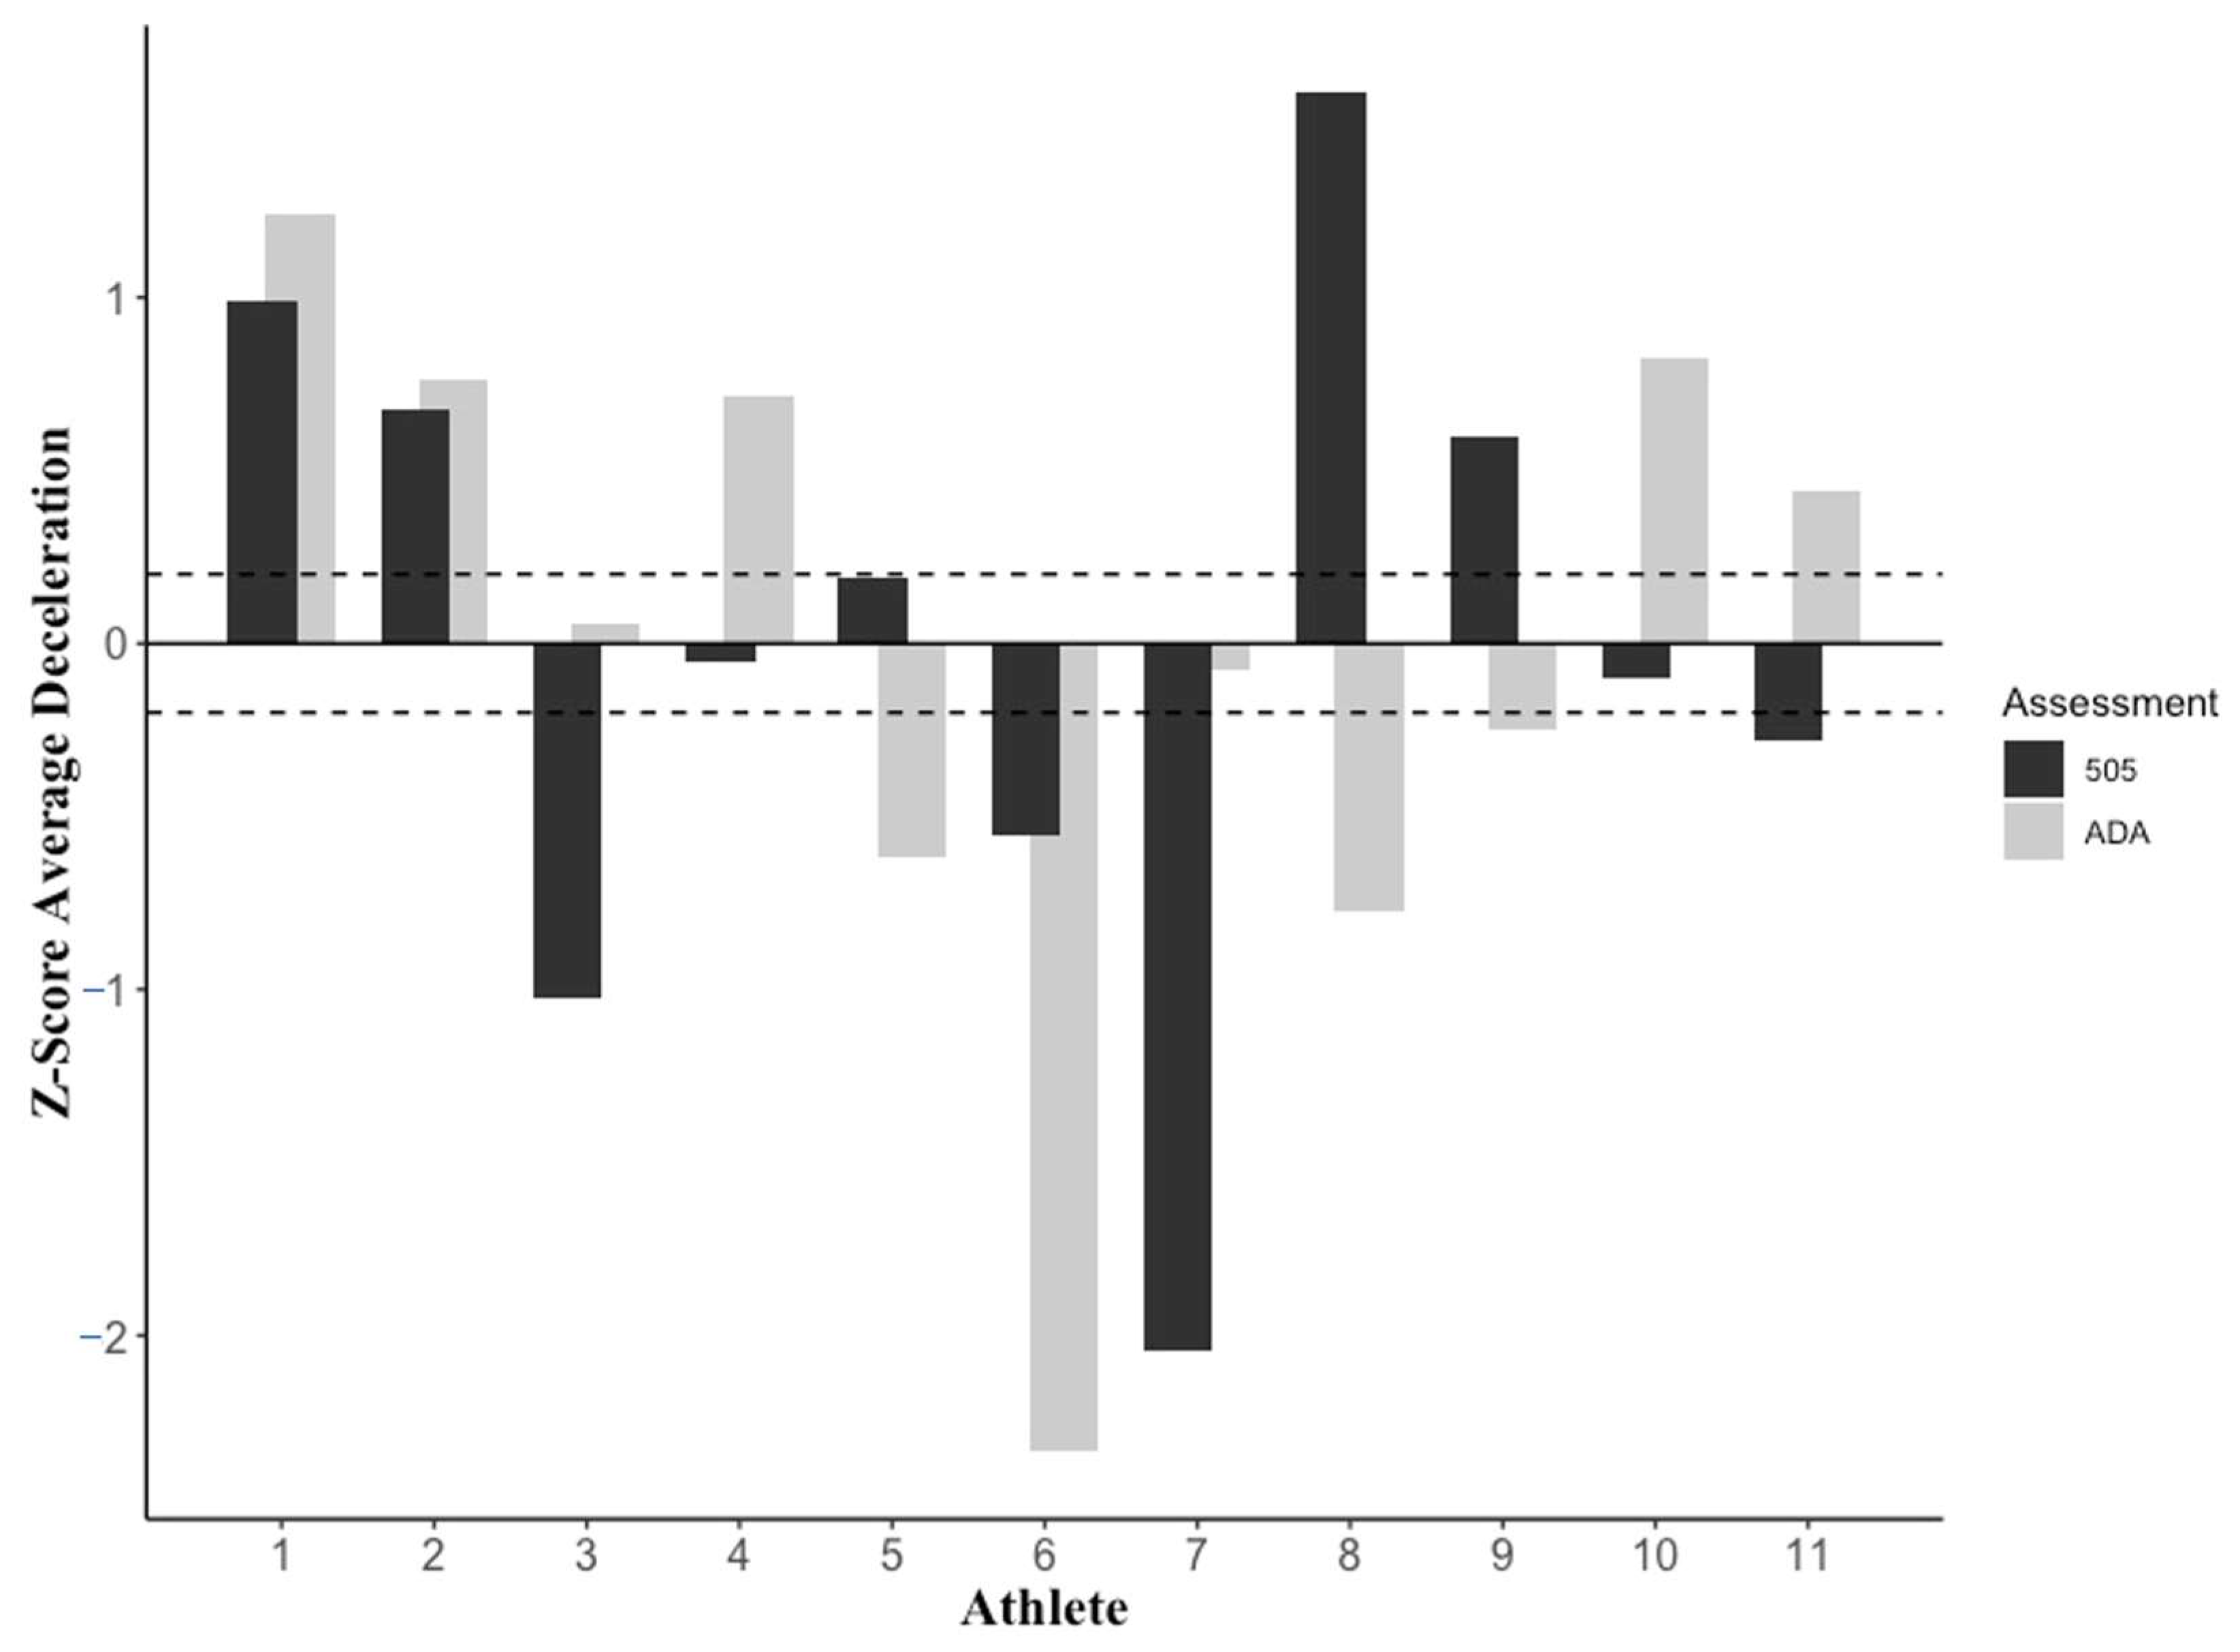
3. Results
4. Discussion
5. Conclusions
Author Contributions
Funding
Institutional Review Board Statement
Informed Consent Statement
Data Availability Statement
Conflicts of Interest
References
- Saavedra, J.M. Handball research: State of the art. J. Hum. Kinet. 2018, 63, 5–8. [Google Scholar] [CrossRef] [PubMed] [Green Version]
- Manchado, C.; Tortosa-Martínez, J.; Vila, H.; Ferragut, C.; Platen, P. Performance factors in women’s team handball: Physical and physiological aspects—A review. J. Strength Cond. Res. 2013, 27, 1708–1719. [Google Scholar] [CrossRef] [PubMed] [Green Version]
- Karcher, C.; Buchheit, M. On-court demands of elite handball, with special reference to playing positions. Sports Med. 2014, 44, 797–814. [Google Scholar] [CrossRef] [PubMed]
- Kruger, K.; Pilat, C.; Uckert, K.; Frech, T.; Mooren, F.C. Physical performance profile of handball players is related to playing position and playing class. J. Strength Cond. Res. 2014, 28, 117–125. [Google Scholar] [CrossRef] [PubMed]
- Pereira, L.A.; Nimphius, S.; Kobal, R.; Kitamura, K.; Turisco, L.A.L.; Orsi, R.C.; Cal Abad, C.C.; Loturco, I. Relationship between change of direction, speed, and power in male and female national olympic team handball athletes. J. Strength Cond. Res. 2018, 32, 2987–2994. [Google Scholar] [CrossRef] [PubMed]
- Harper, D.J.; Carling, C.; Kiely, J. High-intensity acceleration and deceleration demands in elite team sports competitive match play: A systematic review and meta-analysis of observational Studies. Sports Med. 2019, 49, 1923–1947. [Google Scholar] [CrossRef] [Green Version]
- Dalen, T.; Ingebrigtsen, J.; Ettema, G.; Hjelde, G.H.; Wisloff, U. Player load, acceleration, and deceleration during forty-five competitive matches of elite soccer. J. Strength Cond. Res. 2016, 30, 351–359. [Google Scholar] [CrossRef]
- Verheul, J.; Nedergaard, N.J.; Pogson, M.; Lisboa, P.; Gregson, W.; Vanrenterghem, J.; Robinson, M.A. Biomechanical loading during running: Can a two mass-spring-damper model be used to evaluate ground reaction forces for high-intensity tasks? Sports Biomech. 2021, 20, 571–582. [Google Scholar] [CrossRef]
- Harper, D.J.; Kiely, J. Damaging nature of decelerations: Do we adequately prepare players? BMJ Open Sport Exerc. Med. 2018, 4, e000379. [Google Scholar] [CrossRef] [Green Version]
- Spiteri, T.; Nimphius, S.; Hart, N.H.; Specos, C.; Sheppard, J.M.; Newton, R.U. Contribution of strength characteristics to change of direction and agility performance in female basketball athletes. J. Strength Cond. Res. 2014, 28, 2415–2423. [Google Scholar] [CrossRef]
- Harper, D.J.; Jordan, A.R.; Kiely, J. Relationships between eccentric and concentric knee strength capacities and maximal linear deceleration ability in male academy soccer players. J. Strength Cond. Res. 2021, 35, 465–472. [Google Scholar] [CrossRef]
- Edwards, W.B. Modeling overuse injuries in sport as a mechanical fatigue phenomenon. Exerc. Sport Sci. Rev. 2018, 46, 224–231. [Google Scholar] [CrossRef]
- Cabarkapa, D.V.; Cabarkapa, D.; Philipp, N.M.; Fry, A.C. Impact of the Anatomical Accelerometer placement on vertical jump performance characteristics. Sports 2023, 11, 92. [Google Scholar] [CrossRef]
- Harper, D.J.; Cohen, D.D.; Carling, C.; Kiely, J. Can countermovement jump neuromuscular performance qualities differentiate maximal horizontal deceleration ability in team sport athletes? Sports 2020, 8, 76. [Google Scholar] [CrossRef]
- Harper, D.J.; Morin, J.B.; Carling, C.; Kiely, J. Measuring maximal horizontal deceleration ability using radar technology: Reliability and sensitivity of kinematic and kinetic variables. Sports Biomech. 2020, 1–17, ahead of print. [Google Scholar] [CrossRef]
- McBurnie, A.J.; Harper, D.J.; Jones, P.A.; Dos’Santos, T. Deceleration training in team sports: Another potential “vaccine” for sports-related injury? Sports Med. 2022, 52, 1–12. [Google Scholar] [CrossRef]
- Graham-Smith, P.; Rumpf, M.; Jones, P.A. Assessment of deceleration ability and relationship to approach speed and eccentric strength. In Proceedings of the International Society of Biomechanics in Sports, Auckland, New Zealand, 10–14 September 2018. [Google Scholar]
- Zhang, Q.; Dellal, A.; Chamari, K.; Igonin, P.H.; Martin, C.; Hautier, C. The influence of short sprint performance, acceleration, and deceleration mechanical properties on change of direction ability in soccer players—A cross-sectional study. Front. Physiol. 2022, 13, 2209. [Google Scholar] [CrossRef]
- Harper, D.J.; McBurnie, A.J.; Santos, T.D.; Eriksrud, O.; Evans, M.; Cohen, D.D.; Rhodes, D.; Carling, C.; Kiely, J. Biomechanical and neuromuscular performance requirements of horizontal deceleration: A review with implications for random intermittent multi-directional sports. Sports Med. 2022, 52, 2321–2354. [Google Scholar] [CrossRef]
- Philipp, N.M.; Blackburn, S.D.; Cabarkapa, D.; Fry, A.C. Effect of sprint approach velocity and distance on deceleration performance in NCAA Division-I female softball players. J. Hum. Sport Exerc. 2023; in press. [Google Scholar] [CrossRef]
- Ireland, M.L. The female ACL: Why is it more prone to injury? Orthop. Clin. N. Am. 2002, 33, 637–651. [Google Scholar] [CrossRef] [Green Version]
- Hewett, T.E.; Myer, G.D.; Ford, K.R.; Paterno, M.V.; Quatman, C.E. Mechanisms, prediction, and prevention of ACL injuries: Cut risk with three sharpened and validated tools. J. Orthop. Res. 2016, 34, 1843–1855. [Google Scholar] [CrossRef] [PubMed] [Green Version]
- Simperingham, K.D.; Cronin, J.B.; Ross, A. Advances in sprint acceleration profiling for field-based team-sport athletes: Utility, reliability, validity and limitations. Sports Med. 2016, 46, 1619–1645. [Google Scholar] [CrossRef] [PubMed]
- Kershner, A.L.; Fry, A.C.; Cabarkapa, D. Effect of internal vs. external focus of attention instructions on countermovement jump variables in NCAA Division-I student-athletes. J. Strength Cond. Res. 2019, 33, 1467–1473. [Google Scholar] [CrossRef] [PubMed]
- Anicic, Z.; Janicijevic, D.; Knezevic, O.M.; Garcia-Ramos, A.; Petrovic, M.R.; Cabarkapa, D.; Mirkov, D.M. Assessment of countermovement jump: What should we report? Life 2023, 13, 190. [Google Scholar] [CrossRef] [PubMed]
- Rhea, M.R. Determining the magnitude of treatment effects in strength training research through the use of the effect size. J. Strength Cond. Res. 2004, 18, 918–920. [Google Scholar]
- Vanderburgh, P.M.; Mahar, M.T.; Chou, C.H. Allometric scaling of grip strength by body mass in college-age men and women. Res. Q. Exerc. Sport 1995, 66, 80–84. [Google Scholar] [CrossRef]
- Stickley, C.D.; Andrews, S.N.; Parke, E.A.; Hetzler, R.K. The effectiveness of scaling procedures for comparing ground reaction forces. J. Biomech. 2018, 77, 55–61. [Google Scholar] [CrossRef]
- Jian, Y.; Winter, D.A.; Ishac, M.G.; Gilchrist, L. Trajectory of the body COG and COP during initiation and termination of gait. Gait Posture 1993, 1, 9–22. [Google Scholar] [CrossRef]
- Jones, P.A.; Thomas, C.; Dos’Santos, T.; McMahon, J.J.; Graham-Smith, P. The Role of Eccentric Strength in 180 Turns in Female Soccer Players. Sports 2017, 5, 42. [Google Scholar] [CrossRef] [Green Version]
- Dos’Santos, T.; McBurnie, A.; Comfort, P.; Jones, P.A. The effects of six-weeks change of direction speed and technique modification training on cutting performance and movement quality in male youth soccer players. Sports 2019, 7, 205. [Google Scholar] [CrossRef] [Green Version]
- Dos’Santos, T.; Thomas, C.; McBurnie, A.; Comfort, P.; Jones, P.A. Change of direction speed and technique modification training improves 180° turning performance, kinetics, and kinematics. Sports Sci. 2021, 9, 73. [Google Scholar] [CrossRef]
- Kovacs, M.S.; Roetert, E.P.; Ellenbecker, T.S. Efficient deceleration: The forgotten factor in tennis-specific training. Strength Cond. J. 2008, 30, 58. [Google Scholar] [CrossRef]
- Nimphius, S.; Callaghan, S.J.; Spiteri, T.; Lockie, R.G. Change of direction deficit: A more isolated measure of change of direction performance than total 505 time. J. Strength Cond. Res. 2016, 30, 3024–3032. [Google Scholar] [CrossRef]
- Aronhime, S.; Calcagno, C.; Jajamovich, G.H.; Dyvorne, H.A.; Robson, P.; Dieterich, D.; Fiel, M.I.; Martel-Laferriere, V.; Chatterji, M.; Rusinek, H.; et al. DCE-MRI of the liver: Effect of linear and nonlinear conversions on hepatic perfusion quantification and reproducibility. J. Magn. Reson. Imaging 2014, 40, 90–98. [Google Scholar] [CrossRef] [Green Version]

| Deceleration Metrics (Unit) | Definition |
|---|---|
| Maximal approach velocity (m·s−1) | Maximal velocity prior to deceleration |
| Maximal approach momentum (kg·m·s−1) | Maximal momentum prior to deceleration |
| Average deceleration (m·s−2) | Average change in velocity over time |
| Maximal deceleration (m·s−2) | Maximal change in velocity over time |
| Time to stop (s) | Time from start to end of deceleration |
| Distance to stop (m) | Distance from start to end of deceleration |
| CVJ metrics (unit) | Definition |
| Jump height (cm) | Jump height via impulse-momentum |
| RSImod (ratio) | Jump height divided by contraction time |
| Propulsive mean force (N) | Average force during the propulsive phase |
| Braking mean force (N) | Average force during the braking phase |
| Metric (Unit) | CVJ |
|---|---|
| Jump height (cm) | 28.0 ± 5.01 [2.20] |
| RSImod (ratio) | 0.42 ± 0.10 [8.06] |
| Propulsive mean force (N) | 1423 ± 168 [2.81] |
| Braking mean force (N) | 1243 ± 200 [2.33] |
| Propulsive mean force (N·kgb−1) | 95.3 ± 4.09 [2.81] |
| Braking mean force (N·kgb−1) | 51.6 ± 3.81 [2.33] |
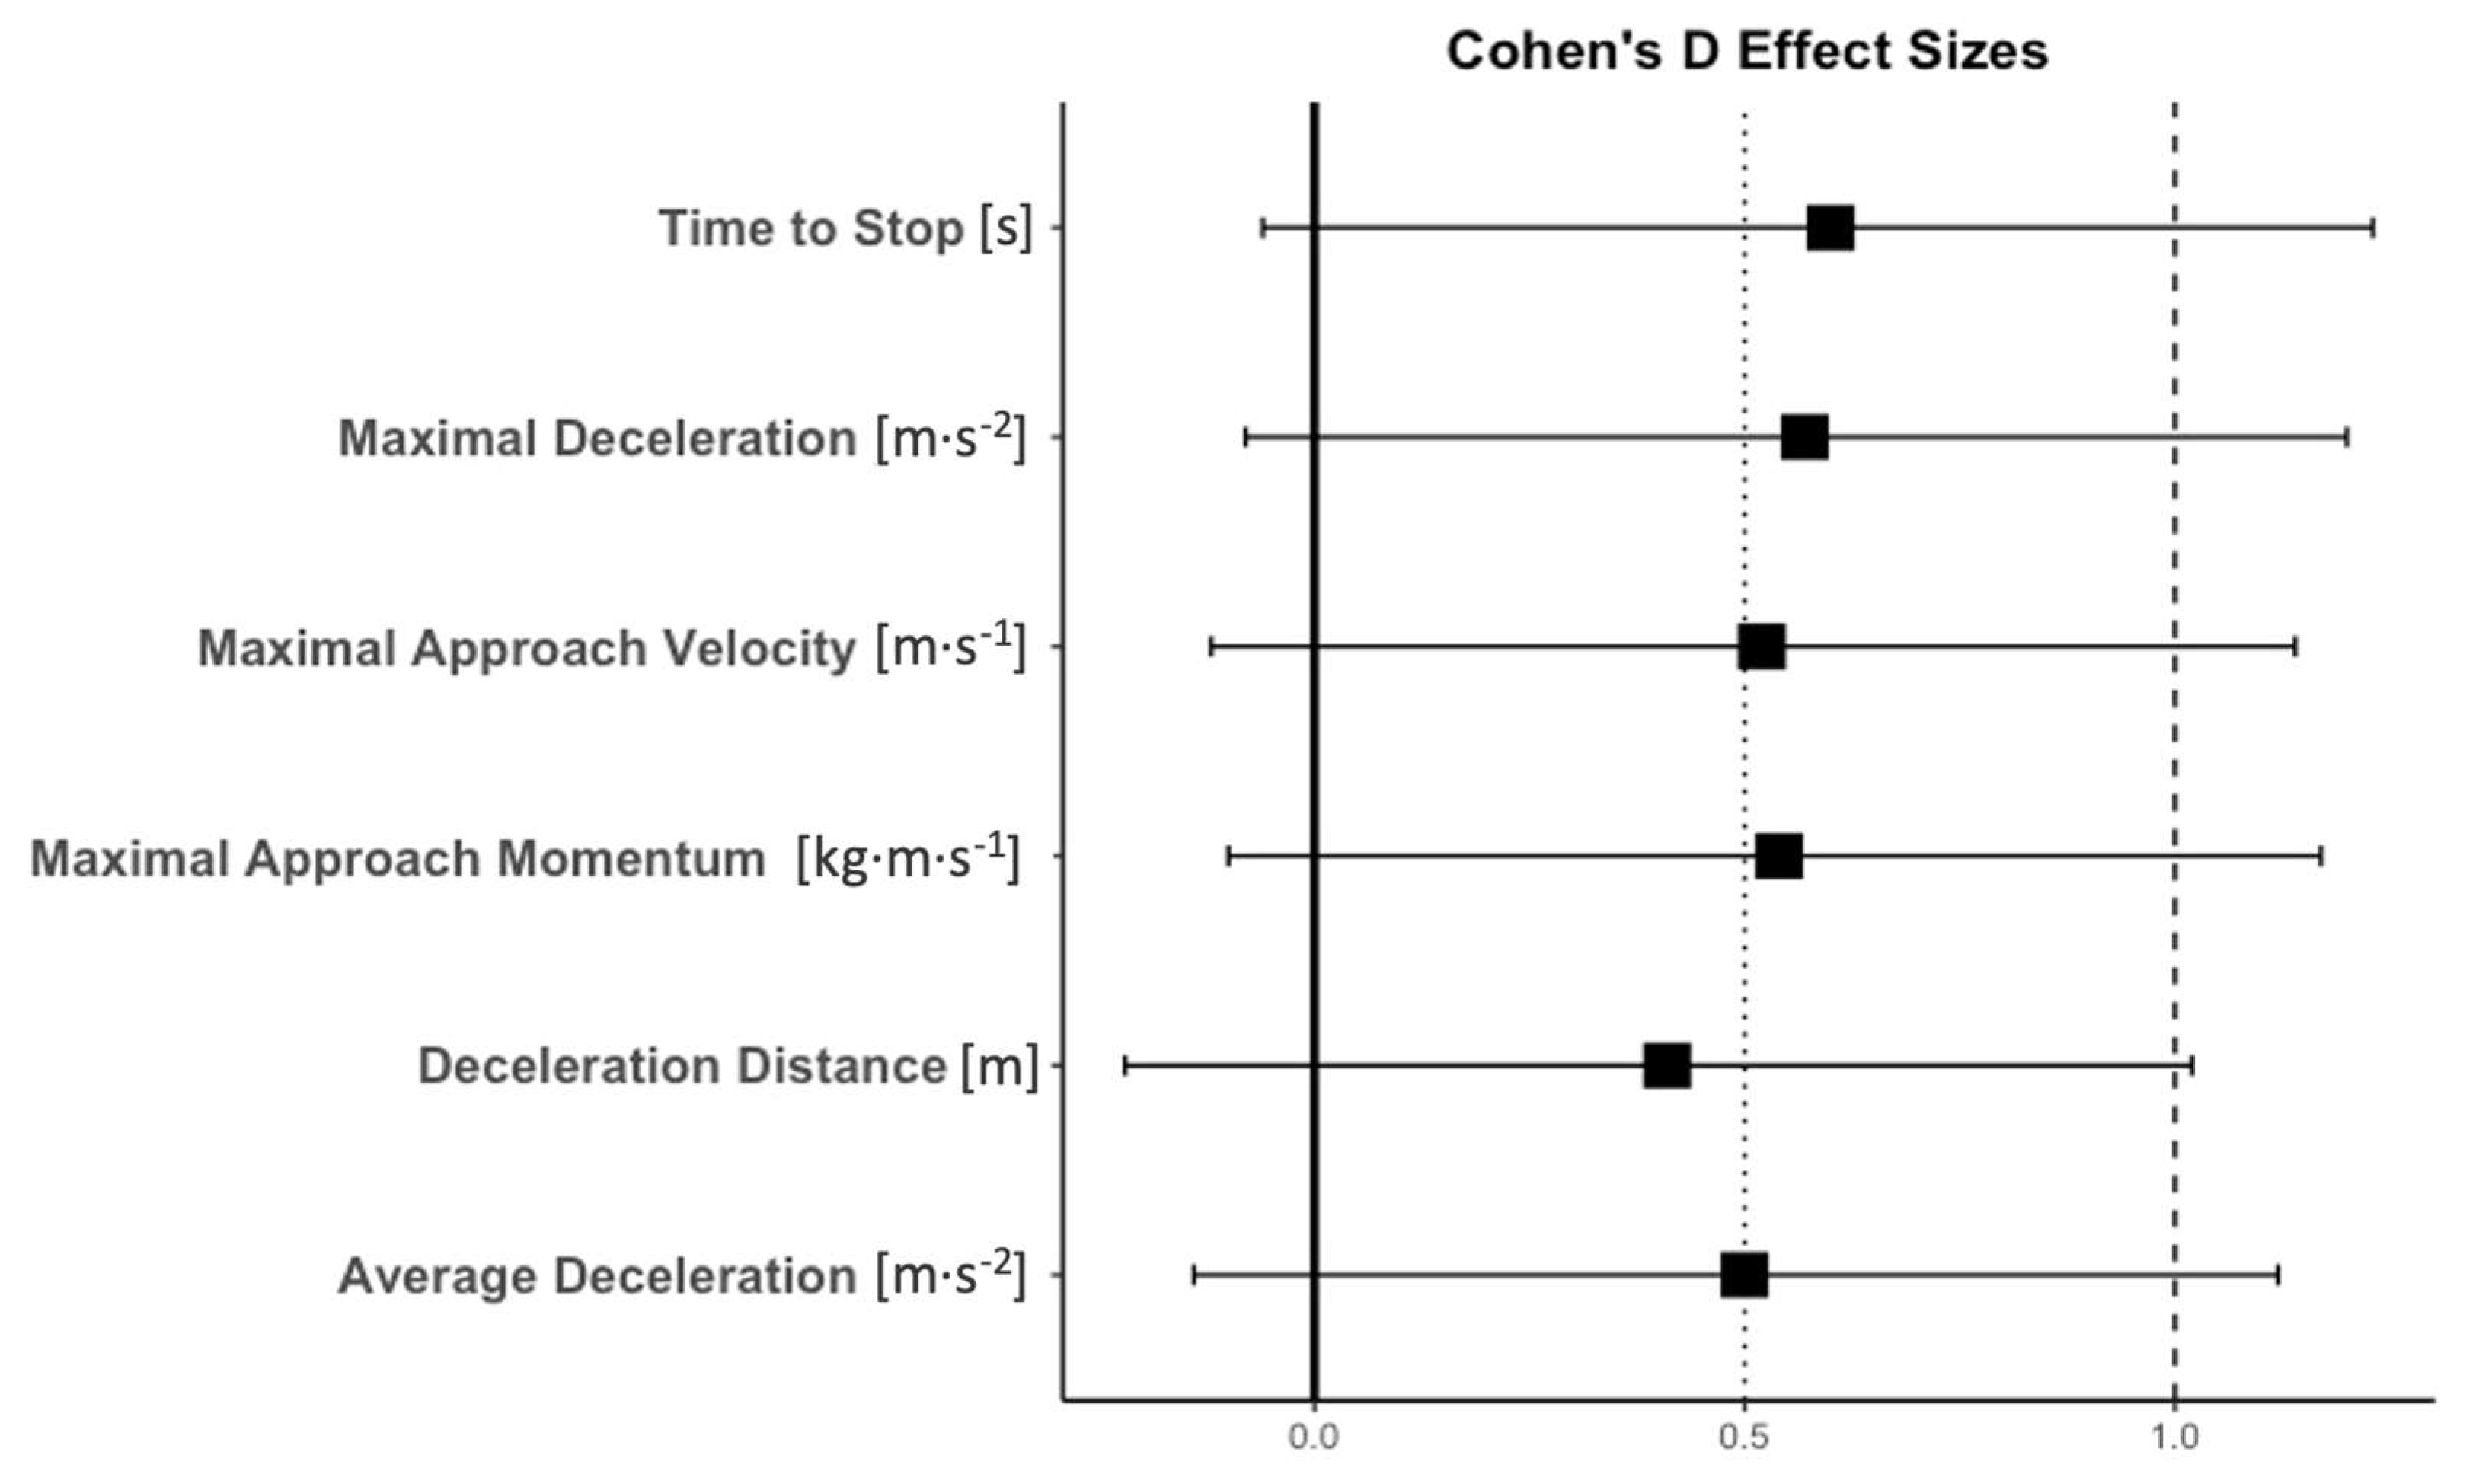
| Metric (Unit) | ADA | 5-0-5 | p-Value | ES |
|---|---|---|---|---|
| Maximal approach velocity (m·s−1) | 6.42 ± 0.34 [3.01] | 6.54 ± 0.26 [1.50] | 0.114 | 0.52 |
| Maximal approach momentum (kg·m·s−1) | 454 ± 62.9 [3.01] | 462 ± 70.3 [1.50] | 0.101 | 0.54 |
| Average deceleration (m·s−2) | −3.65 ± 0.51 [8.5] | −3.29 ± 0.58 [11.78] | 0.129 | 0.50 |
| Maximal deceleration (m·s−2) | −8.79 ± 1.17 [8.10] | −9.53 ± 1.56 [15.47] | 0.088 | 0.57 |
| Time to stop (s) | 1.67 ± 0.16 [10.36] | 1.45 ± 0.28 [11.41] | 0.074 | 0.60 |
| Distance to stop (m) | 6.03 ± 0.48 [16.66] | 6.66 ± 1.41 [11.40] | 0.203 | 0.41 |
Disclaimer/Publisher’s Note: The statements, opinions and data contained in all publications are solely those of the individual author(s) and contributor(s) and not of MDPI and/or the editor(s). MDPI and/or the editor(s) disclaim responsibility for any injury to people or property resulting from any ideas, methods, instructions or products referred to in the content. |
© 2023 by the authors. Licensee MDPI, Basel, Switzerland. This article is an open access article distributed under the terms and conditions of the Creative Commons Attribution (CC BY) license (https://creativecommons.org/licenses/by/4.0/).
Share and Cite
Philipp, N.M.; Cabarkapa, D.; Marten, K.M.; Cabarkapa, D.V.; Mirkov, D.M.; Knezevic, O.M.; Aleksic, J.; Faj, L.; Fry, A.C. Horizontal Deceleration Performance in Professional Female Handball Players. Biomechanics 2023, 3, 299-309. https://doi.org/10.3390/biomechanics3030026
Philipp NM, Cabarkapa D, Marten KM, Cabarkapa DV, Mirkov DM, Knezevic OM, Aleksic J, Faj L, Fry AC. Horizontal Deceleration Performance in Professional Female Handball Players. Biomechanics. 2023; 3(3):299-309. https://doi.org/10.3390/biomechanics3030026
Chicago/Turabian StylePhilipp, Nicolas M., Dimitrije Cabarkapa, Kennedy M. Marten, Damjana V. Cabarkapa, Dragan M. Mirkov, Olivera M. Knezevic, Jelena Aleksic, Lucija Faj, and Andrew C. Fry. 2023. "Horizontal Deceleration Performance in Professional Female Handball Players" Biomechanics 3, no. 3: 299-309. https://doi.org/10.3390/biomechanics3030026