Abstract
Gait asymmetries are a common problem in clinical populations, such as those with a history of stroke or Parkinson’s disease. The use of a split-belt treadmill is one way to enhance gait symmetry but relies on specialty (and typically expensive) equipment. Alternatively, visual cues have been shown as a method to alter gait mechanics, but their utility in altering gait symmetry has been relatively understudied. Before deploying this method to clinical populations, a proof-of-concept study is needed to explore using visual cues to alter gait symmetry in healthy adults. Therefore, the purpose of this study was to examine the extent to which healthy adults could synchronize to an asymmetric visual cue with a small or large gait asymmetry using wearable sensors to measure gait asymmetries. Seventy-two healthy adults (ages: 23.89 ± 6.08 years) walked on the treadmill for two conditions: with and without the visual cue. Each walking condition lasted 10 min at the participant’s preferred walking speed. Inertial sensors were used to measure gait asymmetries. Some participants did not respond to the visual cue, and groups were separated into responders and non-responders. Participants in the small and large asymmetry-responder groups exhibited statistically significant increased asymmetries in single limb support % (p < 0.01) and step duration (s) (p < 0.05, p < 0.01, respectively). Only the large asymmetry-responder group showed statistically significant (p < 0.01) increased asymmetries in stride length. Overall, asymmetrical walking visual cues can alter gait asymmetries, and inertial sensors were sensitive enough to detect small changes in gait asymmetries.
1. Introduction
Neurological populations—such as people with a history of stroke or Parkinson’s disease—commonly exhibit mobility impairments inclusive of gait asymmetries. People with gait asymmetries reduce the amount of weight bearing on the paretic or injured limb, which can lead to further muscular imbalances and a loss of bone mineral density [1]. Therefore, a primary goal of gait rehabilitation is to improve weight bearing on the paretic or affected limb [2]. In clinical and elderly populations, cognitive demand can impact the magnitude of gait asymmetries, as exhibited by dual tasks leading to increased gait asymmetries [3]. Gait asymmetries are also associated with a decreased walking speed and balance control and an increased metabolic cost and fall risk [2,4,5,6]. Falls can lead to a reduced quality of life, critical injuries, and loss of independence, all of which are of great concern for clinical and aging populations who exhibit gait asymmetries [7,8,9,10,11,12,13]. Thus, gait asymmetries are important to assess in clinical and aging populations and are a better indicator of functional recovery than gait velocity due to the weight-bearing aspect [2,14].
Methods to reduce gait asymmetries and fall risk have heavily relied on split-belt treadmill training in clinical populations [15,16,17,18,19]. The split-belt treadmill training paradigm requires the participant to move each limb at a different speed due to the two treadmill belts (one under each limb) moving at different rates. This method can be used as an error-based motor learning strategy during an adaptation (i.e., training) phase to reduce gait asymmetries when the belts are once again moving at the same speed. Split-belt treadmill training has shown success in altering gait asymmetries (e.g., step length, stride length, and double support time asymmetries) during adaptation conditions in which the belts are split in young healthy adults and in clinical populations [16,18,20]. Aftereffects (i.e., changes to the asymmetry remained after the belts went from split to tied) have been observed in step length in young healthy adults and clinical populations, as well as for double support time [16,18]. However, some gait metrics like stance time have been shown to be more difficult to alter with split-belt treadmill training [5,16,17]. Multiple sessions of split-belt treadmill training can improve step length asymmetries, and the improvements last from one to several months post training [17,21]. Thus, the data show that split-belt treadmill training can reduce certain gait asymmetries in clinical populations. However, split-belt treadmills are expensive and mainly conducive to lab-based training only. Therefore, it is important to not only explore alternative cost-effective options to alter gait but also ways to obtain greater clinical applicability. One way to improve clinical applicability is through the use of wearable technology such as inertial sensors. Inertial sensors are a simpler and a more affordable option than split-belt treadmill training, which typically uses embedded force plates or motion capture technology to quantify gait asymmetries. Also, a major advantage is that inertial sensors can be used anywhere, and they produce reliable and sensitive data in healthy and clinical populations [22,23,24].
Besides split-belt treadmill training, gait can be altered through a variety of ways such as using external cueing through visual cues. Visual cueing (i.e., prescribing the desired gait mechanics with a visual) can be performed via projections on a screen or in immersive virtual reality, which have produced greater improvements in gait and gait asymmetries than traditional treadmill training alone [25,26,27]. Synchronization of movement can also occur with external cues such as another human, avatars, and auditory metronomes [28,29,30,31]. Synchronization between two individuals can be intentional (i.e., cued) or spontaneous [32], and intentional synchronization can produce greater synchrony than spontaneous synchronization. Intentionally synchronizing to a human and an avatar in an immersive environment produces similar results, suggesting both methods are effective [31]. Thus, visual cueing combined with an additional external cue—such as intentional instructions to synchronize to a human or avatar—may be a way to alter gait asymmetry. However, the ability to synchronize with an asymmetric walking pattern that simulates training with a split-belt treadmill to alter gait symmetry is unknown. Before deploying this method to clinical populations, it is first important to show proof-of-concept that visual cueing can be used to alter gait symmetry in healthy adults. Given that healthy adults have relatively symmetrical gait patterns, they are an ideal initial population to test the feasibility and efficacy of interventions designed to induce gait asymmetry. In this preclinical work, we elected to first see if the gait patterns of healthy adults could be shifted toward asymmetry using an asymmetrically walking visual cue. If so, that would lay the foundation to test the reverse directionality in future research (i.e., can a symmetrically walking visual cue be used in asymmetrically walking clinical populations to develop more symmetrical gait patterns).
Therefore, the purpose of this study was to examine the extent to which healthy adults could synchronize to an asymmetric visual cue during a 10-min treadmill walking session with a small or large gait asymmetry using wearable sensors to measure gait asymmetries. This was part of a larger study that also examined the retention and transfer of gait asymmetries after the visual cue was removed. However, this manuscript specifically focuses on adaptation due to the novel methodological approach. We hypothesized that gait asymmetries would increase from the baseline to the adaptation phase, and the large asymmetry cue would induce greater gait asymmetries than the small asymmetry cue.
2. Materials and Methods
2.1. Participants
A total of 72 participants (49 females and 23 males) were recruited for this study and were quasi randomized into three groups: Small Gait Asymmetry (n = 32), who were given the visual cue with a 1.4–1 gait asymmetry ratio; Large Gait Asymmetry (n = 32), who were given the visual cue with a 1.9–1 gait asymmetry ratio; and Control (n = 8), who were given a non-stimulating nature documentary. The Small and Large Gait Asymmetry groups were later separated into responder and non-responder groups (Table 1). Our study design was primarily focused on the asymmetrically walking visual cue; however, the small control group served to ensure that our specific visual cue was what influenced changes in gait symmetry. Participants were between the ages of 18–50 years old, had a of BMI < 30, had normal or corrected-to-normal vision, and had the ability to walk continuously for at least 10 min. All participants reported no lower extremity injuries in the last 12 months and no musculoskeletal, cognitive, or neurological conditions.

Table 1.
Participant demographics—means (SE).
2.2. Procedures
All data collection occurred in the Virtual Environment for Assessment and Rehabilitation (VEAR) laboratory at the University of North Carolina Greensboro. Prior to data collection, this study’s procedures were approved by the institutional review board of the University of North Carolina Greensboro (IRB#: IRB-FY23-72). Participants completed the informed consent on Qualtrics and then were screened for limb length discrepancies via the direct method (i.e., measurements between the bony landmarks of the anterior superior iliac spine and the medial malleolus with a tape measure while laying supine) to ensure any discrepancies were less than 2 cm, as greater than 2 cm is related to gait asymmetries [33,34]. Participants completed a demographic/health history questionnaire, Footedness questionnaire, and the International Physical Activity Questionnaire short form (IPAQ-SF) via Qualtrics. Next, participants stepped onto the treadmill (Simbex Active Step, Lebanon, NH, USA) to determine their preferred walking speed [35]. Then, a total of seven Opal inertial sensors (APDM Inc., Portland, OR, USA) were placed on the following locations: the top and center of their shoes; the shins, with straps above the widest part of the gastrocnemius muscles; the lower lateral sides of the thighs at the midline; and the low back at the base of the spine. The sensors were calibrated prior to data collection, and the sensor sampling frequency was 128 Hz. Inertial sensors are reliable and are sensitive to measures in healthy and clinical populations [22,23,24]. Also, inertial sensors were used in this study to improve translatability to field-based studies.
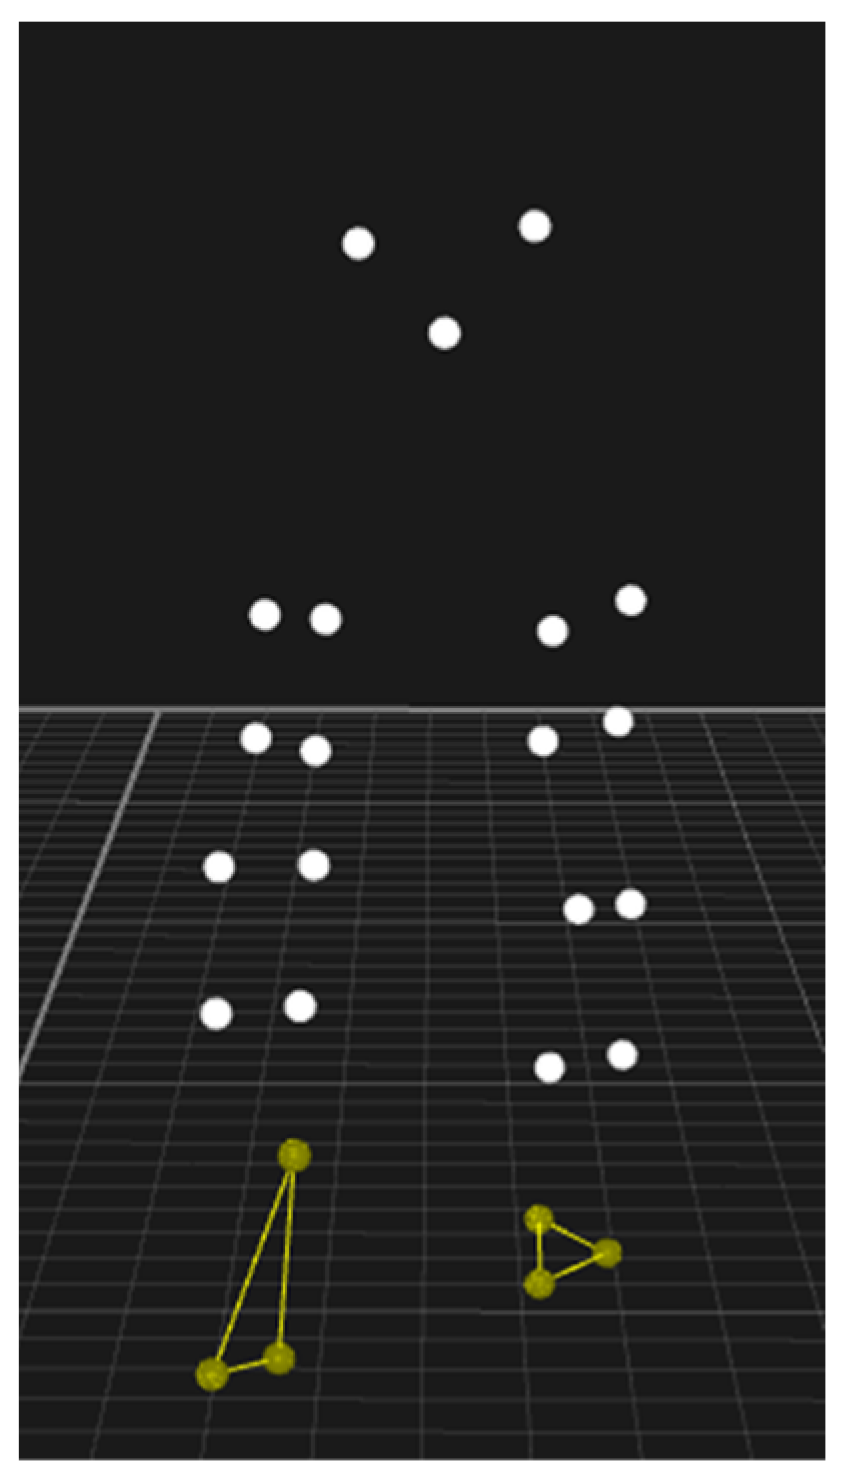
Next, participants walked for two conditions at their preferred walking speed. Condition (1) walking for 10 min (baseline) with no visual cue, and condition (2) participants walked with the visual cue (adaptation) (Figure 1). The asymmetrically walking visual cue was projected on a screen in front of the treadmill. During adaptation, participants in the asymmetry groups were instructed to synchronize their gait to the visual cue via the following instructions “mimic the walking cue as closely as you can to the best of your ability.” The control group were given the non-stimulating documentary video to watch during the adaptation condition and were instructed to walk normally. A five-minute seated rest period was provided between walking conditions to reduce the possibility of fatigue.
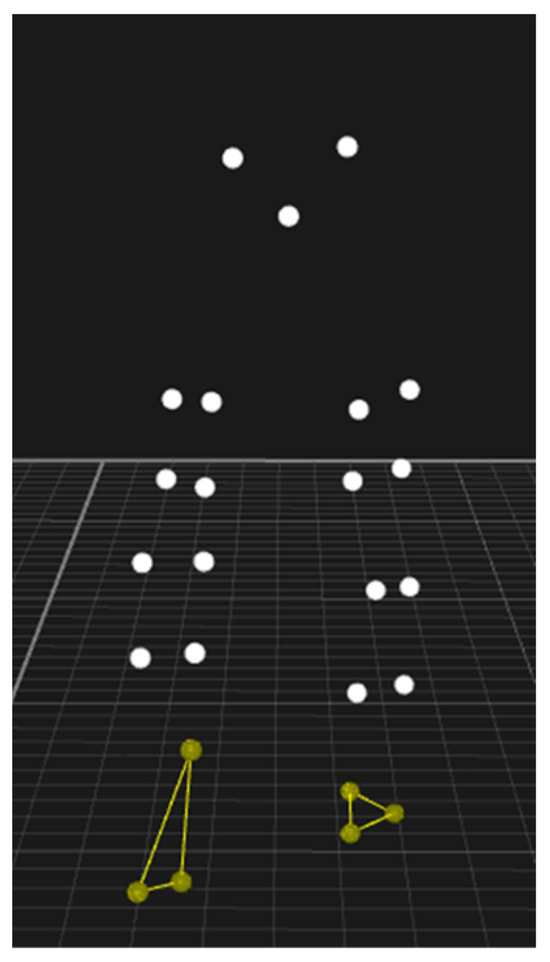
Figure 1.
Freeze frame of the asymmetrically walking visual cue that shows the pelvis, legs, and feet that presented the motion of asymmetrical walking on a screen in front of the treadmill. Please see the Supplmentary Materials section for videos of the cues in motion.
The asymmetrical visual cue was created using data of healthy adults walking on a split-belt treadmill with varying belt speeds to create an asymmetrical walking pattern. To incorporate simulating a clinically relevant gait asymmetry, we used two different ratios of gait asymmetry for the asymmetrically walking visual cue based on the velocity of the treadmill belts. One visual cue has a small gait asymmetry with a ratio of 1.4–1 (i.e., the left side is moving 40% faster than the right). For example, the left belt has a velocity of 1.4 m/s and right belt has a velocity of 1.0 m/s). The other visual cue has a large gait asymmetry ratio of 1.9–1 (i.e., the left side is moving 90% faster than the right side). The visual cues have an average treadmill velocity of 1.24 m/s. The small asymmetrical ratio is slightly under the threshold of what is clinically detected based on observation alone [2], and the large asymmetrical ratio is close to a 2–1 ratio, which is commonly used in split-belt treadmill training to reduce gait asymmetries [16,17,36]. The dependent variables are single limb support (SLS) %, step duration (s), and stride length (m), given many gait asymmetry interventions focus on spatiotemporal measures [19]. The variables were calculated using the APDM provided software [37].
2.3. Statistical Analysis
Power calculations were performed a priori using G*Power 3.1 [38]. The parameter settings, using a t-test, were α = 0.05, power = 0.8, and an effect size of 0.3. All data analyses were performed using R software (version 4.2.3) [39]. One-way ANOVAs were used to compare group demographics (Table 1). The Symmetry Index (SI) equation—a common method to quantify gait asymmetry [19,40]—was calculated for all dependent variables in R (Equation (1)). Gait asymmetries were considered present if the value was not zero [40].
After visually inspecting the data, some participants exhibited minimal changes, while others exhibited more obvious changes from the baseline to adaptation. Therefore, participants were further divided into non-responders (i.e., ≤1% difference in all of the outcome variables after adaptation) or responders (>1% difference in at least one outcome variable after adaptation). The Shapiro–Wilks test (R package “rstatix”) [41] was utilized to assess the distribution of each dependent variable (SLS SI%, step duration SI%, and stride length SI%), which indicated the gait variables from the sensors were non-normally distributed. Therefore, non-parametric tests were performed to compare gait asymmetry indices (SLS SI%, step duration SI%, and stride length SI%) at the baseline to adaptation within the groups and adaptation between groups, respectively. The Wilcoxon Signed-Rank and Mann–Whitney U tests (R package “stats”) were performed for paired samples and independent samples indicated by test statistics “V” and “W”, respectively. Only the 10th minute of each walking condition was used in the analyses. To assess the strength of the association between groups and gait asymmetry indices, we calculated the Wilcoxon Q effect size (R package “rstatix”). As the sample size is small due to the further division of groups based on if participants were categorized as a responder or not in addition to the data not having a normal distribution, the data were bootstrapped (5000 samples) with a bias correction for confidence intervals (CIs) to calculate effect sizes. The values for the Wilcoxon Q effect size are interpreted as follows: r < 0.30 = small effect, r = 0.30–0.49 = medium effect, and r ≥ 0.50 = large effect [42]. For all analyses, the alpha level was set a priori at 0.05.
3. Results
A one-way ANOVA revealed a significant difference between the preferred walking speed between the groups (p = 0.011) (Table 1). A post hoc test with Bonferroni corrections showed the control group had a faster preferred walking speed than the small and large asymmetry-group responders (p = 0.0075 and p = 0.0014, respectively). No other statistically significant differences for the remaining demographic variables were observed.
The Wilcoxon Signed-Rank tests revealed, in the small asymmetry-group responders from the baseline to adaptation, that the single limb support SI% (V = 34, p = 0.003) and step duration SI% (V = 50, p = 0.02) increased, but stride length SI% was not significantly different (V = 88, p = 0.273) (Figure 2). Also, a large effect size was observed with the single limb support SI% (r = 0.59, CI [0.13, 0.8]); a medium effect size for step duration SI% (r = 0.46, CI [0.04, 0.74]); and a small effect size for stride length SI% (r = 0.14, CI [0, 0.43]). The Wilcoxon Signed-Rank tests revealed significant differences in the large asymmetry-group responders from the baseline to adaptation, as the single limb support SI% (V = 43, p = 0.003); step duration SI% (V = 41, p = 0.002); and stride length SI% (V = 33, p = 0.0007) increased in the adaptation condition. Large effect sizes were observed for SLS SI% (r = 0.58, CI [0.16, 0.79]); step duration SI% (r = 0.59, CI [0.11, 0.81]); and stride length SI% (r = 0.65, CI [0.29, 0.83]).
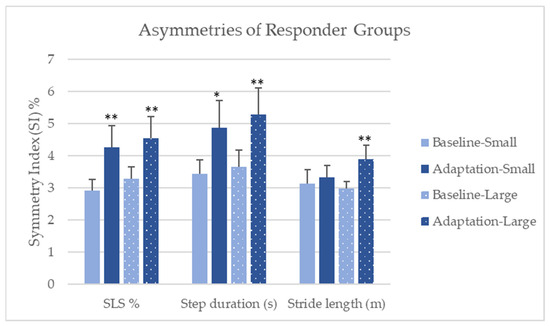
Figure 2.
Comparison of baseline to adaptation in the small and large responder groups—means (SE). Note: SLS % = Single limb support %; * indicates p < 0.05; ** indicates p < 0.01.
The Wilcoxon Signed-Rank tests revealed, in the small asymmetry-group non-responders from the baseline to adaptation, no statistically significant differences in single limb support SI% (V = 48, p = 0.765); step duration SI% (V = 36, p = 0.425); and stride length SI% (V = 39, p = 0.515) (Figure 3). Also, small effect sizes were observed with the single limb support SI% (r = 0.20, CI [0, 0.59]) and step duration SI% (r = 0.07, CI [0, 0.18]). The effect is too small for stride length SI% to calculate confidence intervals. The Wilcoxon Signed-Rank tests revealed no significant differences in the large asymmetry-group non-responders from the baseline to adaptation for single limb support SI% (V = 17, p = 0.161); step duration SI% (V = 28, p = 0.539); and stride length SI% (V = 18, p = 0.188). However, moderate effect sizes were observed for SLS SI% (r = 0.34, CI [0.02, 0.79]) and stride length SI% (r = 0.31, CI [0.02, 0.76]). The effect is too small for step duration SI% to calculate confidence intervals.
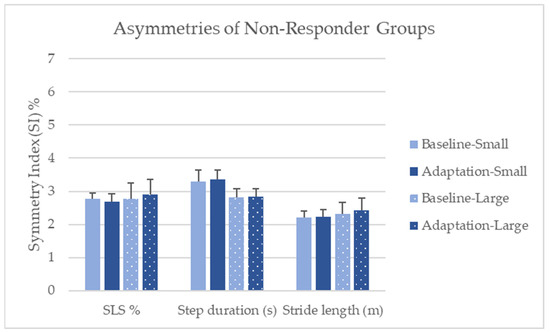
Figure 3.
Comparison of baseline to adaptation in the small and large asymmetry non-responder groups—means (SE). Note: SLS % = Single limb support %.
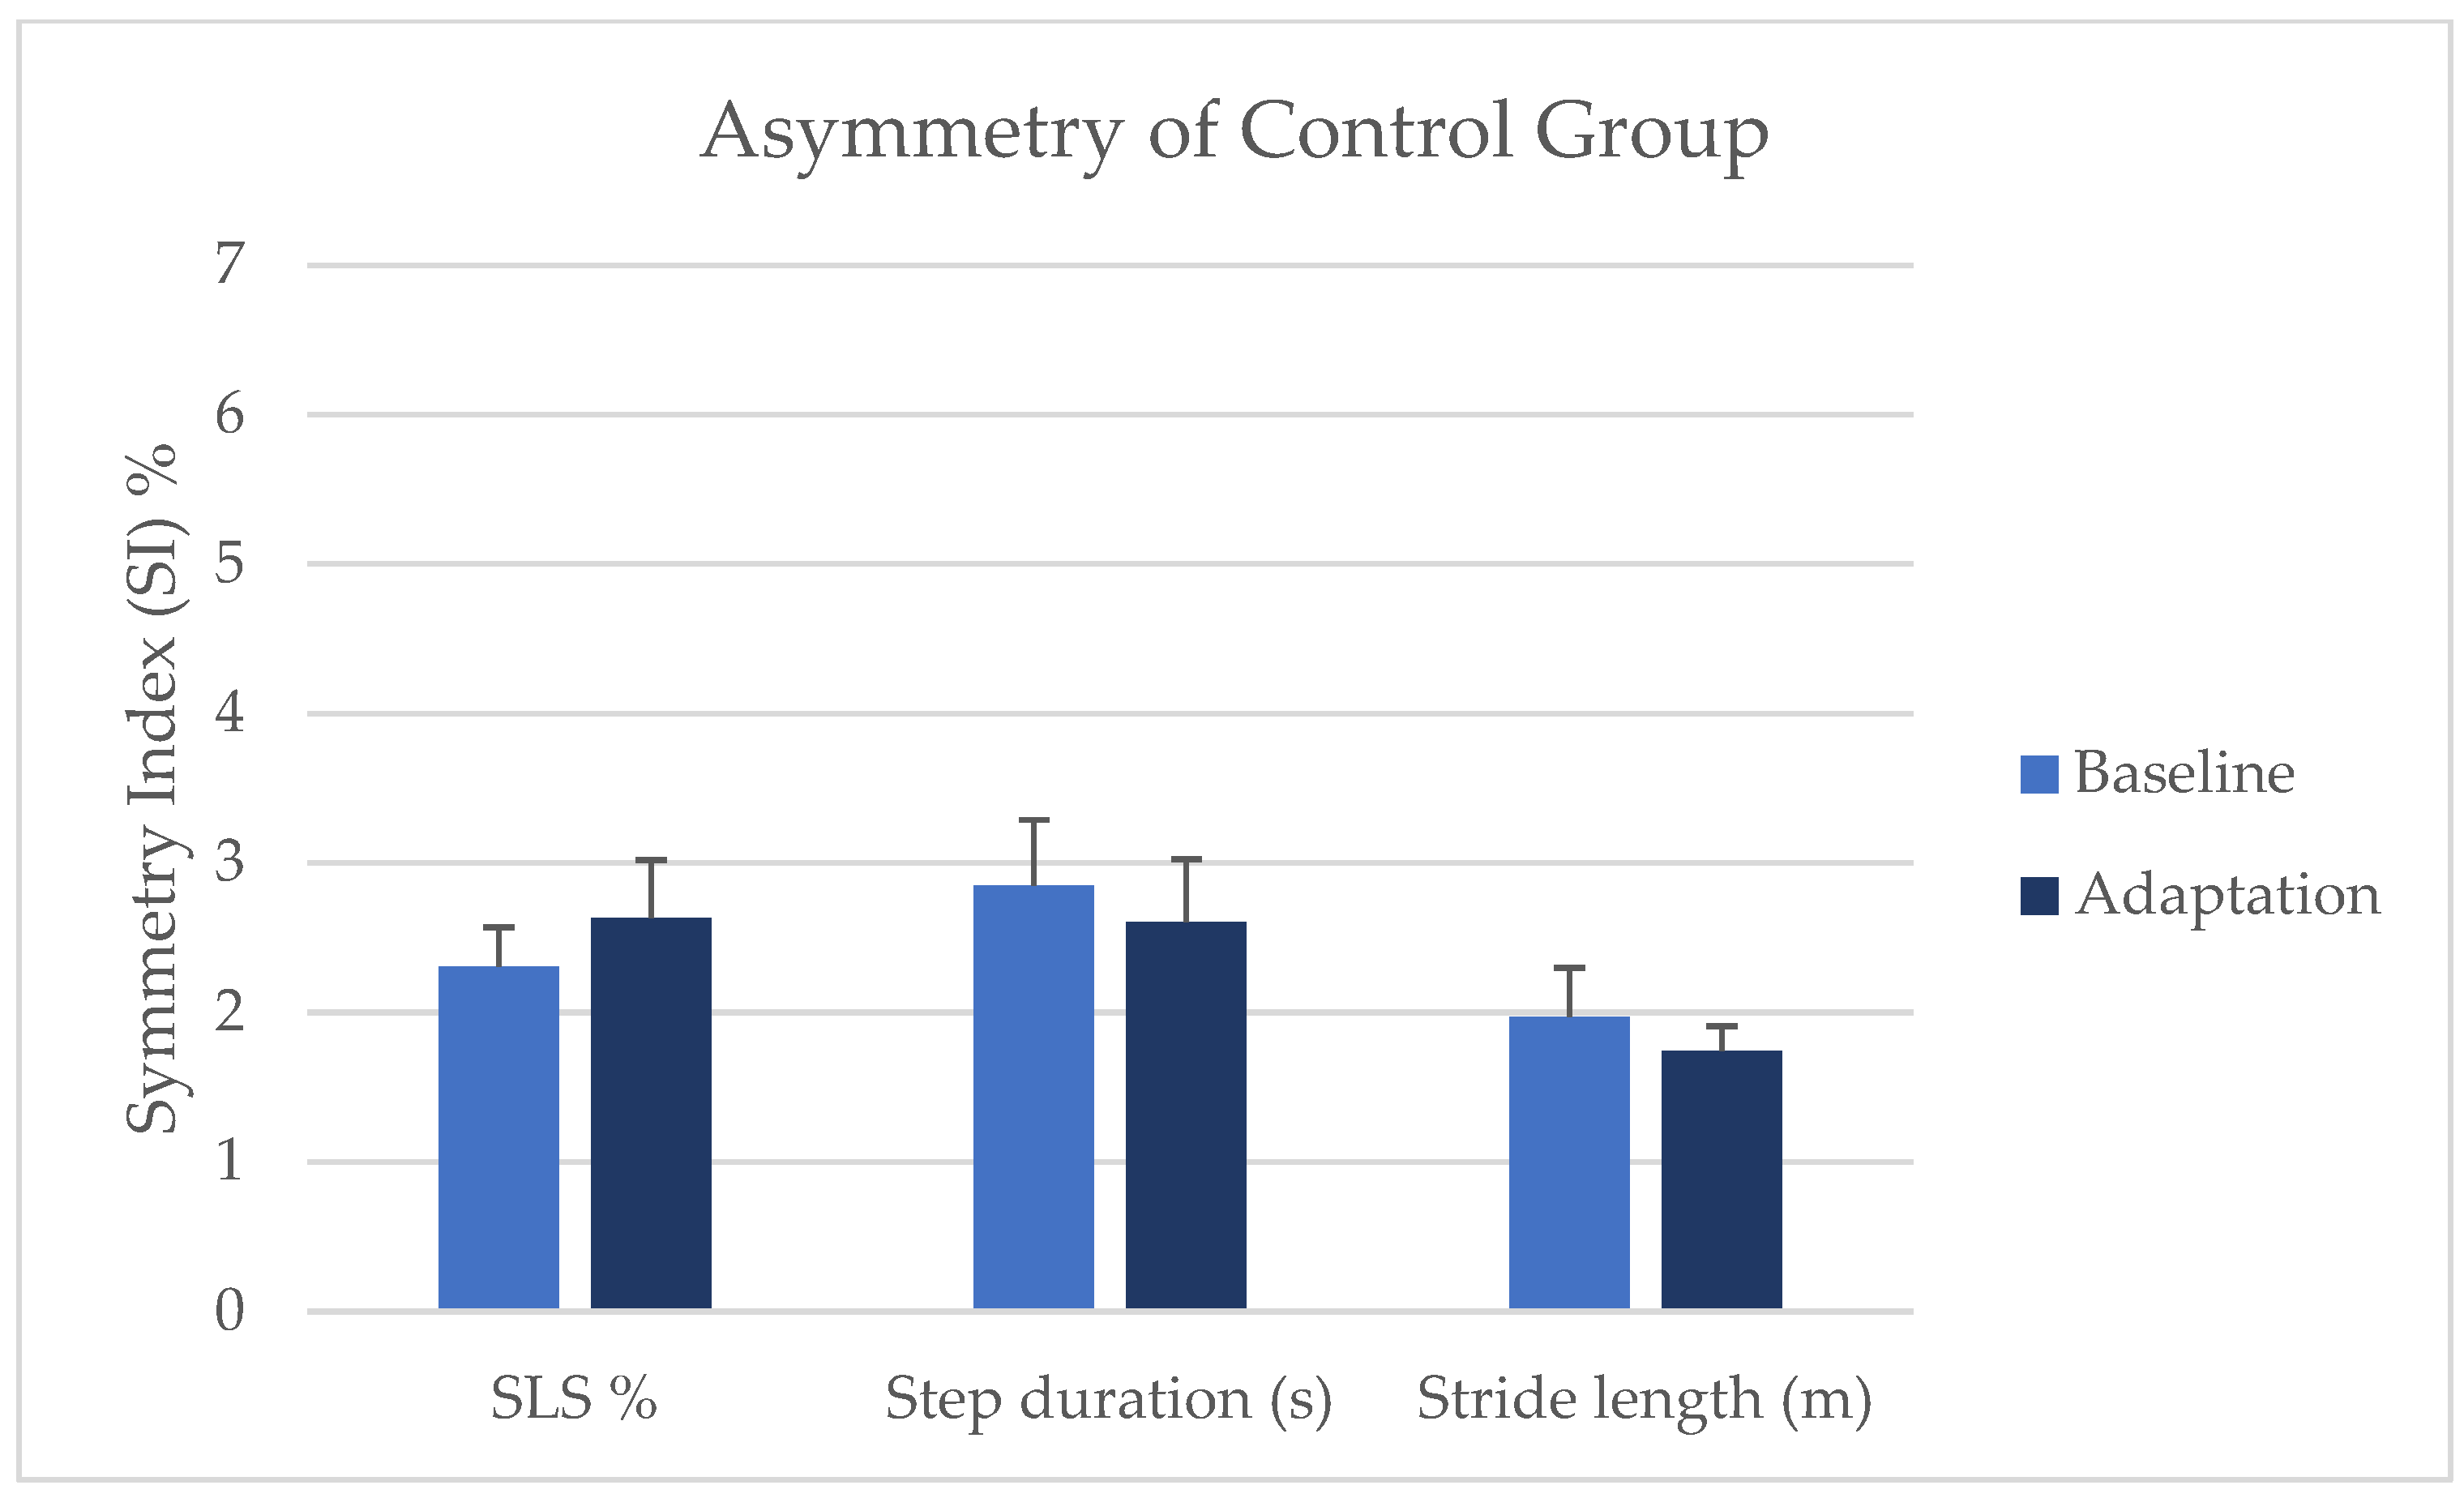
The Wilcoxon Rank-Sum tests (i.e., Mann–Whitney U test) to compare the small and large asymmetry-group responders on the gait asymmetry metrics revealed no statistical differences between groups on SLS SI% (W = 193, p = 0.254, CI [−∞, 0.480]); step duration SI% (W = 193, p = 0.122, CI [−∞, 0.219]); and stride length SI% (W = 177, p = 0.144, CI [−∞, 0.230)] (Figure 4). Based on our criteria for responders, three control participants were categorized as responders; however, when comparing the control responders to the non-responders, no significant differences were shown. Thus, the control group was recombined to include responders and non-responders. The control group did not significantly change from the baseline to adaptation in single limb support SI%, step duration SI%, or stride length SI% (Figure 5).
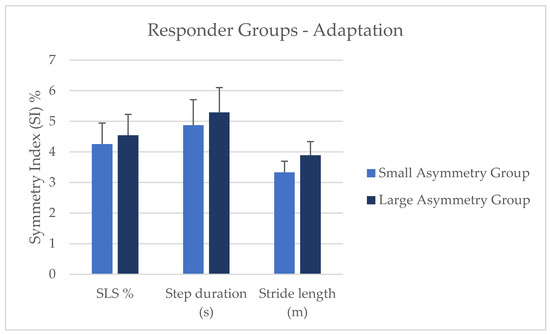
Figure 4.
Comparison of small and large asymmetry-responder groups during the adaptation condition. Note: SLS % = Single limb support %.

Figure 5.
Comparison of asymmetries from baseline to adaptation in the control group. Note: SLS % = Single limb support %.
4. Discussion
The aim of this study was to examine the extent to which healthy adults can synchronize to an asymmetric visual cue during a 10-min treadmill walking session with a small or large gait asymmetry using inertial sensors. This study specifically examined the 10th minute of baseline and adaptation. We hypothesized that gait asymmetries would increase from the baseline to adaptation. Our hypothesis was mainly supported by the responder groups. In the small and large asymmetry-group responders, single limb support SI% and step duration SI% both increased during adaptation, indicating that mimicking an asymmetric cue can alter gait symmetry in healthy adults and that the inertial sensors are sensitive enough to detect small changes in asymmetry. The increases in single limb support asymmetry observed in the responder groups are indirectly supported by the literature, as changes were previously shown with double support asymmetry with split-belt treadmill training [16,18]. The changes in single limb support % and step duration asymmetry suggest temporal measures may be altered with an asymmetrical visual cue in healthy adults, similar to what Roemmich and colleagues [18] reported in their healthy young adult group. However, temporal changes may be harder to alter in clinical or aging populations [5,18,21].
Interestingly, the stride length SI% did not increase for the responders in the small asymmetry-responder group but did increase in the large asymmetry-responder group. The lack of changes to symmetry in the small asymmetry group may be due to the fact the small asymmetry visual cue was a subthreshold of what is clinically observable as having an asymmetric gait. The small asymmetry visual was a ratio of 1.4–1, while clinically observable asymmetry is a 1.5–1 ratio [2]. The asymmetrical visual cue ratio was based on speed, which may suggest participants were primarily focused with the timing of synchronizing to the visual cue rather than the spatial aspect such as in the stride length. Although, the difference between the speed of the visual cue and the participants’ preferred walking speed may play a role. The large asymmetry ratio is similar to what is seen in the split-belt treadmill literature [20,43], so this may be why changes in stride length were seen only in the large asymmetry group and not the small asymmetry group.
In addition, we hypothesized that participants in the large asymmetry group would exhibit greater gait asymmetries than the small asymmetry group. Our hypothesis was not supported by our results, as no differences between the small and large asymmetry groups were found, even though we examined the responder groups. The findings were surprising, as the large asymmetrical visual cue had an obvious asymmetrical gait pattern, while the small asymmetrical visual cue was not as easily noticeable. In contrast to our findings, Reisman and colleagues [20] reported greater gait asymmetries for larger speed ratios of the belts. While we did not see differences when comparing the small and large responder groups, the magnitude of effect sizes varied between the small and large asymmetry groups. The effect size of the single limb support SI% was a large effect size for the small and large asymmetry-responder groups. Step duration SI% was a moderate effect for the small asymmetry-responder group and large for the large asymmetry-responder group. The stride length SI% was small for the small asymmetry-responder group and large for the large asymmetry-responder group. The magnitude of the effect size indicates that the large asymmetrical visual cue has a greater impact on adaptation than the small asymmetrical visual cue. No significant differences were observed in the non-responder groups on gait asymmetries; although, the small asymmetry non-responder groups have small effect sizes, while the large asymmetry non-responder group showed medium effect sizes. As healthy adults have relatively symmetrical gait patterns yet are able to adapt to visual cues, whether it was the small or large asymmetrical ratio suggests that these novel methods were effective in changing gait patterns. The asymmetrically walking visual cues increased gait asymmetries in healthy adults, providing evidence that asymmetrically walking visual cues could be used to alter gait asymmetry in clinical populations without a split-belt treadmill.
Interestingly, 20 out of the 64 experimental group participants did not respond to the visual cue. Greater changes in gait are seen in early adaptation with split-belt treadmill training, so the lack of response may be because participants adapted early to the cue, since this study only examined the 10th minute of adaptation [18,20,44]. However, attention during the adaptation condition may play a role in whether a participant adapted to the visual cue or not. Although the health history questionnaire asked and excluded anyone with a neurological or cognitive disease or disorder, we did not explicitly ask nor exclude anyone with attentional deficit disorders. Attentional deficit disorders are very common and may not be thought of as a neurological disorder by this study’s participants, as research on how attentional disorders in adults can affect how they walk is limited. However, research on children with attentional disorders show greater stride-to-stride variability during walking but reduced variability with dual tasks [45].
Motor-learning principles such as the rate of adaptation should also be considered in future research, as this study only focused on the 10th minute of adaptation. The rate of adaptation can tell us more information of the learning process when adapting to a novel gait task. The literature involving adaptation with split-belt treadmills shows immediate adaptation (i.e., the greatest differences) compared to the end of adaptation, as most healthy participants move back toward symmetry [20,44]. Thus, early adaptation should be compared to late adaptation to examine whether gait asymmetries were greater during the early adaptation condition. Also, Fitts’ law should be considered as well. This study used novel methods, and speed may be an important component influencing the accuracy of mimicking the visual cue, which could contribute to the difficulty of the task [46]. Bootsma and colleagues [47] postulated that the magnitude of motor skill learning on task difficulty may be mediated by the perceived mental workload. Most gait adaptation studies have not asked participants how difficult they felt the task was, which may be impacting the accuracy or optimization of adaptation. A study that did examine perceived exertion reported that participants were divided into responders and non-responders, and the responders indicated a greater perceived exertion with overground walking than the non-responders on the first day of training [17].
A few limitations exist within our study. The sample size was small once the groups were further divided into responders and non-responders. We only examined the 10th minute of each condition, so early adaptation was not examined. Our participants were younger healthy adults, so our study lacks generalizability to a clinical population’s ability to adapt to a visual cue.
5. Conclusions
Asymmetrically walking visual cues can be used to alter gait symmetry in healthy adults. Both a small and large gait asymmetry-ratio visual cue can increase gait asymmetry. Inertial sensors are sensitive to detecting small changes in gait asymmetries and allow for greater clinical applicability. Future research should investigate why some people did not respond to the visual cue and examine if preferred walking speed, difficulty, or mental workload were factors in the lack of a response for some participants. Also, future research should investigate how visual cueing can be utilized to reduce gait asymmetries in clinical populations and use inertial sensors to detect gait changes in and out of the lab environment.
Supplementary Materials
The following supporting information can be downloaded at: https://www.mdpi.com/article/10.3390/biomechanics4020024/s1, Video S1: 1.4 ratio, Video S2: 1.9 ratio.
Author Contributions
Conceptualization, K.G.C. and C.K.R.; methodology, K.G.C., L.D.R., S.E.R. and C.K.R.; software, K.G.C.; validation, K.G.C. and C.K.R.; formal analysis, K.G.C.; investigation, K.G.C.; resources, C.K.R.; data curation, K.G.C.; writing—original draft preparation, K.G.C.; writing—review and editing, K.G.C., L.D.R., S.E.R. and C.K.R.; visualization, K.G.C.; supervision, C.K.R.; project administration, K.G.C. All authors have read and agreed to the published version of the manuscript.
Funding
This research received no external funding.
Institutional Review Board Statement
This study was conducted in accordance with the Declaration of Helsinki and approved by the Institutional Review Board of the University of North Carolina Greensboro (IRB-FY23-72, approval date: 18 October 2022).
Informed Consent Statement
Informed consent was obtained from all subjects involved in this study.
Data Availability Statement
Data will be made available upon reasonable request to the corresponding author.
Acknowledgments
The authors would like to thank Michael D. Lewek for providing the data that were used to create the visual cues and all who volunteered to participate in this study.
Conflicts of Interest
The authors declare no conflicts of interest.
References
- Jørgensen, L.; Crabtree, N.J.; Reeve, J.; Jacobsen, B.K. Ambulatory Level and Asymmetrical Weight Bearing after Stroke Affects Bone Loss in the Upper and Lower Part of the Femoral Neck Differently: Bone Adaptation after Decreased Mechanical Loading. Bone 2000, 27, 701–707. [Google Scholar] [CrossRef]
- Patterson, K.K.; Parafianowicz, I.; Danells, C.J.; Closson, V.; Verrier, M.C.; Staines, W.R.; Black, S.E.; McIlroy, W.E. Gait Asymmetry in Community-Ambulating Stroke Survivors. Arch. Phys. Med. Rehabil. 2008, 89, 304–310. [Google Scholar] [CrossRef]
- Yogev, G.; Plotnik, M.; Peretz, C.; Giladi, N.; Hausdorff, J.M. Gait Asymmetry in Patients with Parkinson’s Disease and Elderly Fallers: When Does the Bilateral Coordination of Gait Require Attention? Exp. Brain Res. 2007, 177, 336–346. [Google Scholar] [CrossRef]
- Awad, L.N.; Palmer, J.A.; Pohlig, R.T.; Binder-Macleod, S.A.; Reisman, D.S. Walking Speed and Step Length Asymmetry Modify the Energy Cost of Walking After Stroke. Neurorehabilit. Neural Repair 2015, 29, 416–423. [Google Scholar] [CrossRef]
- Lewek, M.D.; Bradley, C.E.; Wutzke, C.J.; Zinder, S.M. The Relationship Between Spatiotemporal Gait Asymmetry and Balance in Individuals With Chronic Stroke. J. Appl. Biomech. 2014, 30, 31–36. [Google Scholar] [CrossRef]
- Wei, T.-S.; Liu, P.-T.; Chang, L.-W.; Liu, S.-Y. Gait Asymmetry, Ankle Spasticity, and Depression as Independent Predictors of Falls in Ambulatory Stroke Patients. PLoS ONE 2017, 12, e0177136. [Google Scholar] [CrossRef]
- Alexander, B.H.; Rivara, F.P.; Wolf, M.E. The Cost and Frequency of Hospitalization for Fall-Related Injuries in Older Adults. Am. J. Public Health 1992, 82, 1020–1023. [Google Scholar] [CrossRef]
- Axer, H.; Axer, M.; Sauer, H.; Witte, O.W.; Hagemann, G. Falls and Gait Disorders in Geriatric Neurology. Clin. Neurol. Neurosurg. 2010, 112, 265–274. [Google Scholar] [CrossRef]
- Contreras, A.; Grandas, F. Risk of Falls in Parkinson’s Disease: A Cross-Sectional Study of 160 Patients. Park. Dis. 2012, 2012, 362572. [Google Scholar] [CrossRef]
- Mahlknecht, P.; Kiechl, S.; Bloem, B.R.; Willeit, J.; Scherfler, C.; Gasperi, A.; Rungger, G.; Poewe, W.; Seppi, K. Prevalence and Burden of Gait Disorders in Elderly Men and Women Aged 60–97 Years: A Population-Based Study. PLoS ONE 2013, 8, e69627. [Google Scholar] [CrossRef]
- Malone, L.A.; Bastian, A.J. Spatial and Temporal Asymmetries in Gait Predict Split-Belt Adaptation Behavior in Stroke. Neurorehabilit. Neural Repair 2014, 28, 230–240. [Google Scholar] [CrossRef]
- Sterling, D.A.; O’Connor, J.A.; Bonadies, J. Geriatric Falls: Injury Severity Is High and Disproportionate to Mechanism. J. Trauma Acute Care Surg. 2001, 50, 116–119. [Google Scholar] [CrossRef]
- Wagner, L.M.; Phillips, V.L.; Hunsaker, A.E.; Forducey, P.G. Falls among Community-Residing Stroke Survivors Following Inpatient Rehabilitation: A Descriptive Analysis of Longitudinal Data. BMC Geriatr. 2009, 9, 46. [Google Scholar] [CrossRef]
- Brandstater, M.E.; de Bruin, H.; Gowland, C.; Clark, B.M. Hemiplegic Gait: Analysis of Temporal Variables. Arch. Phys. Med. Rehabil. 1983, 64, 583–587. [Google Scholar]
- Nanhoe-Mahabier, W.; Snijders, A.H.; Delval, A.; Weerdesteyn, V.; Duysens, J.; Overeem, S.; Bloem, B.R. Split-Belt Locomotion in Parkinson’s Disease with and without Freezing of Gait. Neuroscience 2013, 236, 110–116. [Google Scholar] [CrossRef]
- Reisman, D.S.; Wityk, R.; Silver, K.; Bastian, A.J. Locomotor Adaptation on a Split-Belt Treadmill Can Improve Walking Symmetry Post-Stroke. Brain 2007, 130, 1861–1872. [Google Scholar] [CrossRef]
- Reisman, D.S.; McLean, H.; Keller, J.; Danks, K.A.; Bastian, A.J. Repeated Split-BeltTreadmill Training Improves Poststroke Step Length Asymmetry. Neurorehabilit. Neural Repair 2013, 27, 460–468. [Google Scholar] [CrossRef]
- Roemmich, R.T.; Nocera, J.R.; Stegemöller, E.L.; Hassan, A.; Okun, M.S.; Hass, C.J. Locomotor Adaptation and Locomotor Adaptive Learning in Parkinson’s Disease and Normal Aging. Clin. Neurophysiol. 2014, 125, 313–319. [Google Scholar] [CrossRef]
- Meder, K.G.; LoJacono, C.T.; Rhea, C.K. A Systematic Review of Non-Pharmacological Interventions to Improve Gait Asymmetries in Neurological Populations. Symmetry 2022, 14, 281. [Google Scholar] [CrossRef]
- Reisman, D.S.; Block, H.J.; Bastian, A.J. Interlimb Coordination During Locomotion: What Can Be Adapted and Stored? J. Neurophysiol. 2005, 94, 2403–2415. [Google Scholar] [CrossRef]
- Lewek, M.D.; Braun, C.H.; Wutzke, C.; Giuliani, C. The Role of Movement Errors in Modifying Spatiotemporal Gait Asymmetry Post Stroke: A Randomized Controlled Trial. Clin. Rehabil. 2018, 32, 161–172. [Google Scholar] [CrossRef]
- Maidan, I.; Patashov, D.; Shustak, S.; Fahoum, F.; Gazit, E.; Shapiro, B.; Levy, A.; Sosnik, R.; Giladi, N.; Hausdorff, J.M.; et al. A New Approach to Quantifying the EEG during Walking: Initial Evidence of Gait Related Potentials and Their Changes with Aging and Dual Tasking. Exp. Gerontol. 2019, 126, 110709. [Google Scholar] [CrossRef]
- Pozzi, N.G.; Canessa, A.; Palmisano, C.; Brumberg, J.; Steigerwald, F.; Reich, M.M.; Minafra, B.; Pacchetti, C.; Pezzoli, G.; Volkmann, J.; et al. Freezing of Gait in Parkinson’s Disease Reflects a Sudden Derangement of Locomotor Network Dynamics. Brain 2019, 142, 2037–2050. [Google Scholar] [CrossRef]
- Hasegawa, N.; Shah, V.V.; Carlson-Kuhta, P.; Nutt, J.G.; Horak, F.B.; Mancini, M. How to Select Balance Measures Sensitive to Parkinson’s Disease from Body-Worn Inertial Sensors-Separating the Trees from the Forest. Sensors 2019, 19, 3320. [Google Scholar] [CrossRef]
- Cano Porras, D.; Siemonsma, P.; Inzelberg, R.; Zeilig, G.; Plotnik, M. Advantages of Virtual Reality in the Rehabilitation of Balance and Gait: Systematic Review. Neurology 2018, 90, 1017–1025. [Google Scholar] [CrossRef]
- Janeh, O.; Fründt, O.; Schönwald, B.; Gulberti, A.; Buhmann, C.; Gerloff, C.; Steinicke, F.; Pötter-Nerger, M. Gait Training in Virtual Reality: Short-Term Effects of Different Virtual Manipulation Techniques in Parkinson’s Disease. Cells 2019, 8, 419. [Google Scholar] [CrossRef]
- Keshner, E.A.; Lamontagne, A. The Untapped Potential of Virtual Reality in Rehabilitation of Balance and Gait in Neurological Disorders. Front. Virtual Real. 2021, 2, 6. [Google Scholar] [CrossRef]
- Liu, L.Y.; Sangani, S.; Patterson, K.K.; Fung, J.; Lamontagne, A. Real-Time Avatar-Based Feedback to Enhance the Symmetry of Spatiotemporal Parameters After Stroke: Instantaneous Effects of Different Avatar Views. IEEE Trans. Neural Syst. Rehabil. Eng. 2020, 28, 878–887. [Google Scholar] [CrossRef]
- Meerhoff, L.A.; De Poel, H.J.; Jowett, T.W.D.; Button, C. Walking with Avatars: Gait-Related Visual Information for Following a Virtual Leader. Hum. Mov. Sci. 2019, 66, 173–185. [Google Scholar] [CrossRef]
- Rhea, C.K.; Kiefer, A.W.; D’Andrea, S.E.; Warren, W.H.; Aaron, R.K. Entrainment to a Real Time Fractal Visual Stimulus Modulates Fractal Gait Dynamics. Hum. Mov. Sci. 2014, 36, 20–34. [Google Scholar] [CrossRef]
- Soczawa-Stronczyk, A.A.; Bocian, M. Gait Coordination in Overground Walking with a Virtual Reality Avatar. R. Soc. Open Sci. 2020, 7, 200622. [Google Scholar] [CrossRef] [PubMed]
- Felsberg, D.T.; Rhea, C.K. Spontaneous Interpersonal Synchronization of Gait: A Systematic Review. Arch. Rehabil. Res. Clin. Transl. 2021, 3, 100097. [Google Scholar] [CrossRef] [PubMed]
- Kaufman, K.R.; Miller, L.S.; Sutherland, D.H. Gait Asymmetry in Patients with Limb-Length Inequality. J. Pediatr. Orthop. 1996, 16, 144–150. [Google Scholar] [CrossRef] [PubMed]
- Khamis, S.; Carmeli, E. Relationship and Significance of Gait Deviations Associated with Limb Length Discrepancy: A Systematic Review. Gait Posture 2017, 57, 115–123. [Google Scholar] [CrossRef] [PubMed]
- Dingwell, J.B.; Marin, L.C. Kinematic Variability and Local Dynamic Stability of Upper Body Motions When Walking at Different Speeds. J. Biomech. 2006, 39, 444–452. [Google Scholar] [CrossRef] [PubMed]
- Reisman, D.S.; Wityk, R.; Silver, K.; Bastian, A.J. Split-Belt Treadmill Adaptation Transfers to Overground Walking in Persons Poststroke. Neurorehabilit. Neural Repair 2009, 23, 735–744. [Google Scholar] [CrossRef] [PubMed]
- Morris, R.; Stuart, S.; McBarron, G.; Fino, P.C.; Mancini, M.; Curtze, C. Validity of MobilityLab (Version 2) for Gait Assessment in Young Adults, Older Adults and Parkinson’s Disease. Physiol. Meas. 2019, 40, 095003. [Google Scholar] [CrossRef] [PubMed]
- Faul, F.; Erdfelder, E.; Lang, A.-G.; Buchner, A. G*Power 3: A Flexible Statistical Power Analysis Program for the Social, Behavioral, and Biomedical Sciences. Behav. Res. Methods 2007, 39, 175–191. [Google Scholar] [CrossRef] [PubMed]
- R Core Team. R: A Language and Environment for Statistical Computing; R Foundation for Statistical Computing: Vienna, Austria, 2023. [Google Scholar]
- Błażkiewicz, M.; Wiszomirska, I.; Wit, A. Comparison of Four Methods of Calculating the Symmetry of Spatial-Temporal Parameters of Gait. Acta Bioeng. Biomech. 2014, 16, 29–35. [Google Scholar] [CrossRef]
- Kassambara, A. rstatix: Pipe-Friendly Framework for Basic Statistical Tests. R Package Version 0.7.2, 2023. Available online: https://cran.r-project.org/web/packages/rstatix/index.html (accessed on 10 May 2024).
- Wilcox, R. A Robust Nonparametric Measure of Effect Size Based on an Analog of Cohen’s d, Plus Inferences About the Median of the Typical Difference. J. Mod. Appl. Stat. Methods 2019, 17, eP2726. [Google Scholar] [CrossRef]
- Prokop, T.; Berger, W.; Zijlstra, W.; Dietz, V. Adaptational and Learning Processes during Human Split-Belt Locomotion: Interaction between Central Mechanisms and Afferent Input. Exp. Brain Res. 1995, 106, 449–456. [Google Scholar] [CrossRef] [PubMed]
- Bruijn, S.M.; Van Impe, A.; Duysens, J.; Swinnen, S.P. Split-Belt Walking: Adaptation Differences between Young and Older Adults. J. Neurophysiol. 2012, 108, 1149–1157. [Google Scholar] [CrossRef] [PubMed]
- Leitner, Y.; Barak, R.; Giladi, N.; Peretz, C.; Eshel, R.; Gruendlinger, L.; Hausdorff, J.M. Gait in Attention Deficit Hyperactivity Disorder. J. Neurol. 2007, 254, 1330–1338. [Google Scholar] [CrossRef]
- Schmidt, R.A.; Lee, T.D.; Winstein, C.J.; Wulf, G.; Zelaznik, H.N. Motor Control and Learning: A Behavioral Emphasis; Human Kinetics: Champaign, IL, USA, 2019; ISBN 978-1-4925-4775-4. [Google Scholar]
- Bootsma, J.M.; Hortobágyi, T.; Rothwell, J.C.; Caljouw, S.R. The Role of Task Difficulty in Learning a Visuomotor Skill. Med. Sci. Sports Exerc. 2018, 50, 1842. [Google Scholar] [CrossRef] [PubMed]


Disclaimer/Publisher’s Note: The statements, opinions and data contained in all publications are solely those of the individual author(s) and contributor(s) and not of MDPI and/or the editor(s). MDPI and/or the editor(s) disclaim responsibility for any injury to people or property resulting from any ideas, methods, instructions or products referred to in the content. |
© 2024 by the authors. Licensee MDPI, Basel, Switzerland. This article is an open access article distributed under the terms and conditions of the Creative Commons Attribution (CC BY) license (https://creativecommons.org/licenses/by/4.0/).