
Identification of Thermal Refuges and Water Temperature Patterns in Salmonid-Bearing Subarctic Rivers of Northern Quebec
 ,
,
Abstract
:1. Introduction
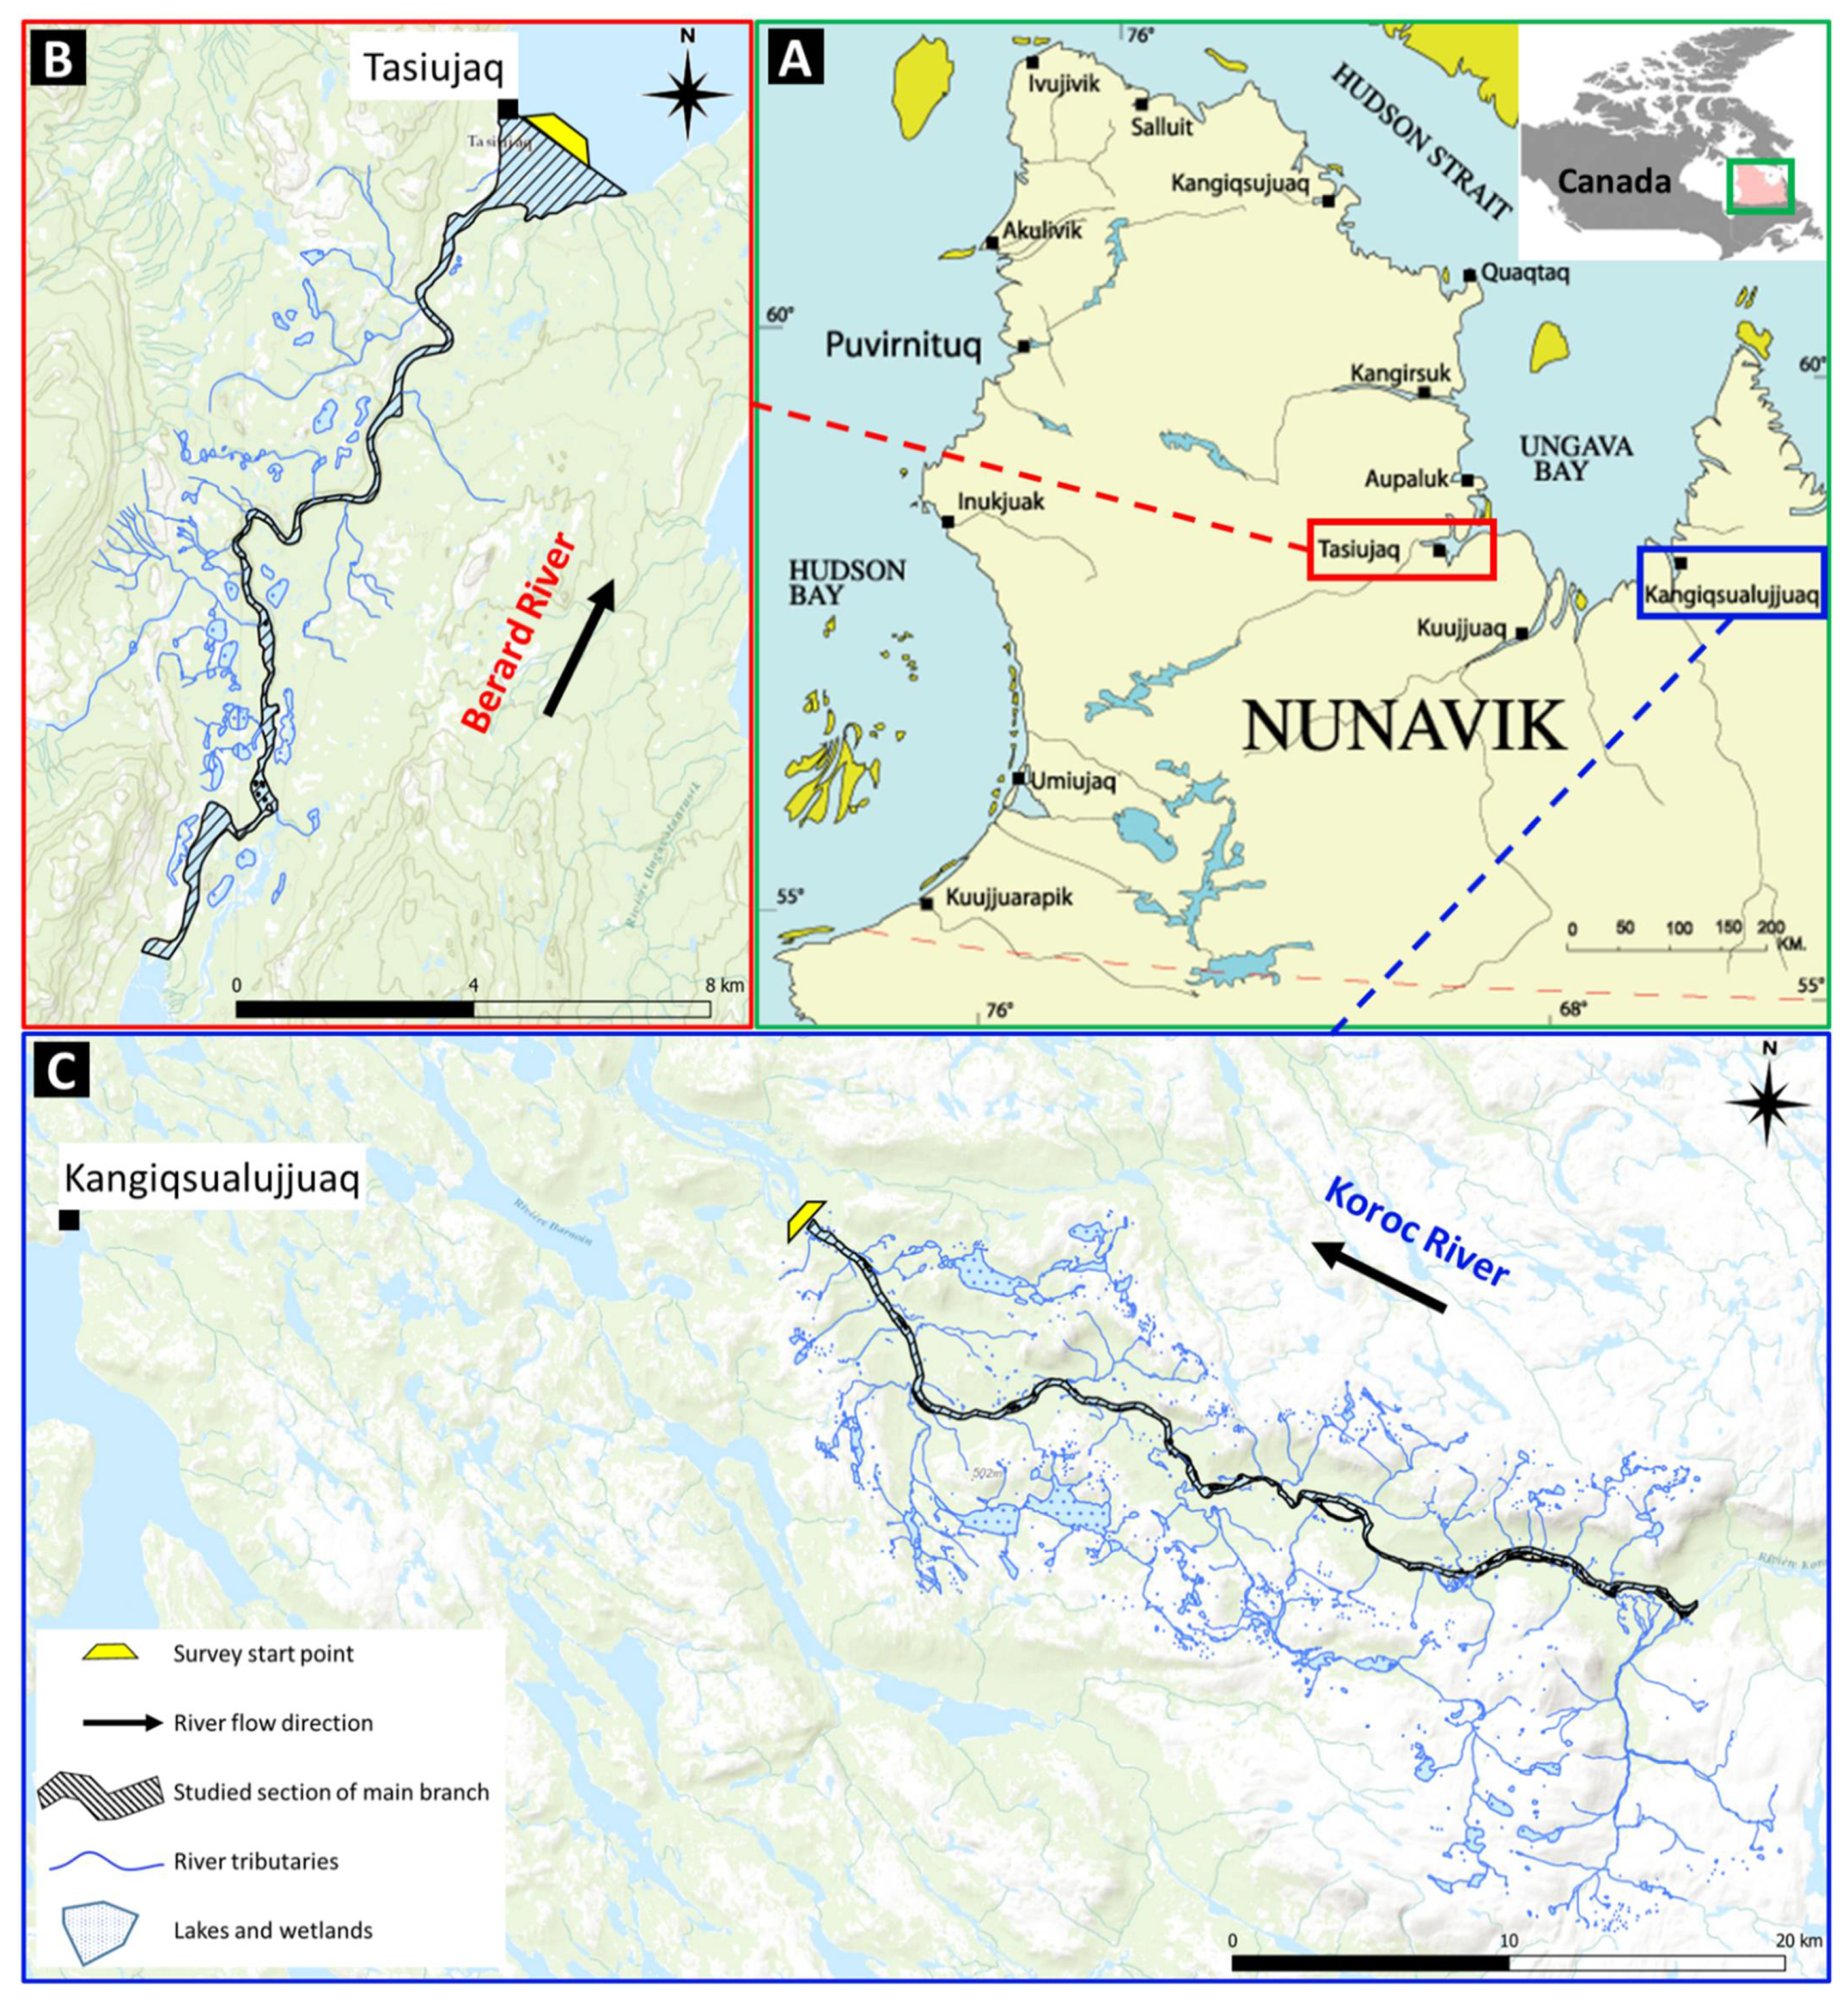
2. Study Area
3. Materials and Methods
3.1. Airborne Imagery
3.2. Links to Landscape Metrics
3.2.1. Drainage Network
3.2.2. River Geomorphology
3.2.3. Geology and Land Cover
4. Results
4.1. Inventory of Thermal Heterogeneity
4.1.1. Thermal Refuges
4.1.2. Cooling Zones
4.1.3. Correlation between Thermal Refuges and Cooling Zones

4.2. Links to Landscape Metrics
4.2.1. Drainage Network
4.2.2. River Morphology
4.2.3. Geology and Land Cover
5. Discussion
6. Conclusions
Author Contributions
Funding
Data Availability Statement
Conflicts of Interest
References
- April, J.; Arvisais, M. Atlantic Salmon Management Plan 2016–2026. Ministère des Forêts, de la Faune et des Parcs, Direction Générale de L’expertise sur la Faune et ses Habitats; Direction de la Faune Aquatique: Quebec City, QC, Canada, 2016; p. 40. [Google Scholar]
- Poesch, M.S.; Chavarie, L.; Chu, C.; Pandit, S.N.; Tonn, W. Climate change impacts on freshwater fishes: A Patagonian perspective. Fisheries 2016, 41, 385–391. [Google Scholar] [CrossRef]
- Finstad, A.; Jonsson, B. Effect of incubation temperature on growth performance in Atlantic salmon. Mar. Ecol. Prog. Ser. 2012, 454, 75–82. [Google Scholar] [CrossRef]
- Nyanti, L.; Soo, C.L.; Ahmad-Tarmizi, N.N.; Ling, T.Y.; Sim, S.F.; Grinang, J.; Ganyai, T. Effects of water temperature, dissolved oxygen and total suspended solids on juvenile barbonymus schwanenfeldii (Bleeker, 1854) and Oreochromis Niloticus (Linnaeus, 1758). Aquac. Aquar. Conserv. Legis. 2018, 11, 394–406. [Google Scholar]
- Jensen, A.J.; Johnsen, B.O.; Saksgård, L. Temperature requirements in Atlantic salmon (Salmo salar), Brown trout (Salmon trutta), and Arctic char (Salvelinus alpinus) from hatching to initial feeding compared with geographic distribution. Can. J. Fish. Aquat. Sci. 1989, 46, 786–789. [Google Scholar] [CrossRef]
- Gunn, J.; Snucins, E. Brook charr mortalities during extreme temperature events in Sutton River, Hudson Bay Lowlands, Canada. Hydrobiologia 2010, 650, 79–84. [Google Scholar] [CrossRef]
- Jonsson, B.; Jonsson, N. A review of the likely effects of climate change on anadromous Atlantic salmon Salmo salar and brown trout Salmo trutta, with particular reference to water temperature and flow. J. Fish Biol. 2009, 75, 2381–2447. [Google Scholar] [CrossRef]
- Palko, K.G.; Lemmen, D.S. Climate Risks and Adaptation Practices for the Canadian Transportation Sector 2016; Transport Canada: Ottawa, ON, Canada, 2017; pp. 182–216.
- Power, G.; Brown, R.S.; Imhof, J.G. Groundwater and fish—Insights from northern North America. Hydrol. Process. 1999, 13, 401–422. [Google Scholar] [CrossRef]
- Baroudy, E.; Elliott, J.M. The critical thermal limits for juvenile Arctic charr Salvelinus alpinus. J. Fish Biol. 1994, 45, 1041–1053. [Google Scholar] [CrossRef]
- Lorenz, J.M.; Filer, J.H. Spawning Habitat and Redd Characteristics of Sockeye Salmon in the Glacial Taku River, British Columbia and Alaska. Trans. Am. Fish. Soc. 1989, 118, 495–502. [Google Scholar] [CrossRef]
- Geist, D.R.; Dauble, D.D. Redd site selection and spawning habitat use by fall chinook salmon: The importance of geomorphic features in large rivers. Environ. Manag. 1998, 22, 655–669. [Google Scholar] [CrossRef]
- Breau, C.; Cunjak, R.A.; Bremset, G. Age-specific aggregation of wild juvenile Atlantic salmon Salmo salar at cool water sources during high temperature events. J. Fish Biol. 2007, 71, 1179–1191. [Google Scholar] [CrossRef]
- Berman, C.H.; Quinn, T.P. Behavioural thermoregulation and homing by spring chinook salmon, Oncorhynchus tshawytscha (Walbaum), in the Yakima River. J. Fish Biol. 1991, 39, 301–312. [Google Scholar] [CrossRef]
- Dugdale, S.J.; Bergeron, N.E.; St-Hilaire, A. Temporal variability of thermal refuges and water temperature patterns in an Atlantic salmon river. Remote Sens. Environ. 2013, 136, 358–373. [Google Scholar] [CrossRef]
- Torgersen, C.E.; Faux, R.N.; A McIntosh, B.; Poage, N.J.; Norton, D.J. Airborne thermal remote sensing for water temperature assessment in rivers and streams. Remote Sens. Environ. 2001, 76, 386–398. [Google Scholar] [CrossRef]
- Dugdale, S.J.; Bergeron, N.E.; St-Hilaire, A. Spatial distribution of thermal refuges analysed in relation to riverscape hydromorphology using airborne thermal infrared imagery. Remote Sens. Environ. 2015, 160, 43–55. [Google Scholar] [CrossRef]
- Casas-Mulet, R.; Pander, J.; Ryu, D.; Stewardson, M.J.; Geist, J. Unmanned Aerial Vehicle (UAV)-Based Thermal Infra-Red (TIR) and Optical Imagery Reveals Multi-Spatial Scale Controls of Cold-Water Areas Over a Groundwater-Dominated Riverscape. Front. Environ. Sci. 2020, 8, 64. [Google Scholar] [CrossRef]
- Dole-Olivier, M.-J.; Wawzyniak, V.; Châtelliers, M.C.D.; Marmonier, P. Do thermal infrared (TIR) remote sensing and direct hyporheic measurements (DHM) similarly detect river-groundwater exchanges? Study along a 40 km-section of the Ain River (France). Sci. Total Environ. 2018, 646, 1097–1110. [Google Scholar] [CrossRef]
- Bergeron, N.; Carbonneau, P.E. Geosalar: Innovative Remote Sensing Methods for Spatially Continuous Mapping of Fluvial Habitat at Riverscape Scale. In Fluvial Remote Sensing for Science and Management, 1st ed.; Carbonneau, P.E., Piegay, H., Eds.; John Wiley and Sons: Chichester, UK, 2012; pp. 193–213. [Google Scholar]
- Dugdale, S.J.; Franssen, J.; Corey, E.; Bergeron, N.E.; Lapointe, M.; Cunjak, R.A. Main stem movement of Atlantic salmon parr in response to high river temperature. Ecol. Freshw. Fish 2016, 25, 429–445. [Google Scholar] [CrossRef]
- Thomas, T.; Council, F.B.; Willms, T.; Bio, R.P.; Whitworth, G. Mapping of Critical Summer Thermal Refuge Habitats for Chinook Salmon, Coho salmon, Steelhead and Bull trout in the Nicola River Watershed—2016; Fraser Basin Council: Kamloops, BC, Canada, 2017. [Google Scholar]
- Monk, W.; Wilbur, N.M.; Curry, R.A.; Gagnon, R.; Faux, R.N. Linking landscape variables to cold water refugia in rivers. J. Environ. Manag. 2013, 118, 170–176. [Google Scholar] [CrossRef]
- Liao, C.; Zhuang, Q. Quantifying the Role of Permafrost Distribution in Groundwater and Surface Water Interactions Using a Three-Dimensional Hydrological Model. Arctic. Antarct. Alp. Res. 2017, 49, 81–100. [Google Scholar] [CrossRef]
- Lamontagne-Hallé, P.; McKenzie, J.M.; Kurylyk, B.L.; Molson, J.; Lyon, L.N. Guidelines for cold-regions groundwater numerical modeling. WIREs Water 2020, 7, e1467. [Google Scholar] [CrossRef]
- Fullerton, A.H.; Torgersen, C.E.; Lawler, J.J.; Faux, R.N.; Steel, E.A.; Beechie, T.J.; Ebersole, J.L.; Leibowitz, S.G. Rethinking the longitudinal stream temperature paradigm: Region-wide comparison of thermal infrared imagery reveals unexpected complexity of river temperatures. Hydrol. Processes 2015, 29, 4719–4737. [Google Scholar] [CrossRef]
- Mainguy, J.; Beaupré, L. Établissement d’un état de référence pour la population d’omble chevalier de la rivière Bérard à Tasiujaq. In Report for Ministère des Forêts, de la Faune et des Parcs, Direction de L’expertise sur la Faune Aquatique et Direction de la Gestion de la Faune du Nord-du-Quebec; Ministère des Forêts, de la Faune et des Parcs (MFFP): Quebec City, QC, Canada, 2019; p. 29. [Google Scholar]
- Kativik Regional Government. Kuururjuaq Park Project (Monts-Torngat-et-Rivière Koroc), Status Report; Ministère des Forêts, de la Faune et des Parcs (MFFP): Quebec City, QC, Canada, 2005.
- Gouvernement du Quebec. Normales Climatiques 1981–2010. Available online: http://www.environnement.gouv.qc.ca/climat/normales/climat-qc.htm (accessed on 1 September 2021).
- ClimateData.ca. Environment and Climate Change Canada Data Servers End-Use Licence. Available online: https://eccc-msc.github.io/open-data/licence/readme_en/ (accessed on 1 September 2021).
- L’Hérault, E.; Allard, M. Production de la 2ième Approximation de la Carte de Pergélisol du Quebec en Fonction des Paramètres Géomorphologiques, Écologiques, et des Processus Physiques Liés au Climat; Quebec City, Rapport Final; Réalisé Pour le Compte du Ministère des Forêts, de la Faune et des Parcs, Gouvernement du Quebec: Quebec City, QC, Canada; Centre D’études Nordiques, Université Laval: Quebec City, QC, Canada, 2018; p. 61.
- SIGÉOM. Surface Deposits Map. Système D’information Géominière du Quebec. 2020. Available online: https://sigeom.mines.gouv.qc.ca/signet/classes/I1108_afchCarteIntr (accessed on 3 June 2021).
- Government of CanadaLakes, Rivers and Glaciers in Canada—CanVec Series—Hydrographic Features. Available online: https://open.canada.ca/data/en/dataset/9d96e8c9-22fe-4ad2-b5e8-94a6991b744b (accessed on 15 May 2019).
- Foretouverte. Cartographie écologique de la VÉGÉTATION du NORD QUÉBÉCOIS; Ministère des Forêts, de la Faune et des Parcs (MFFP): Quebec City, QC, Canada, 2018. Available online: https://www.foretouverte.gouv.qc.ca/ (accessed on 10 June 2021).
- Lemieux, J.-M.; Fortier, R.; Talbot-Poulin, M.-C.; Molson, J.; Therrien, R.; Ouellet, M.; Banville, D.; Cochand, M.; Murray, R. Groundwater occurrence in cold environments: Examples from Nunavik, Canada. Appl. Hydrogeol. 2016, 24, 1497–1513. [Google Scholar] [CrossRef]
- Philipp, M.; Dietz, A.; Buchelt, S.; Kuenzer, C. Trends in Satellite Earth Observation for Permafrost Related Analyses—A Review. Remote Sens. 2021, 13, 1217. [Google Scholar] [CrossRef]
- Allard, M.; Lemay, M.; Barrette, C.; L’Hérault, E.; Sarrazin, D. Permafrost and climate change in Nunavik and Nunatsiavut: Importance for municipal and transportation Contributing authors. In Nunavik and Nunatsiavut: From Science to Policy. An Integrated Regional Impact Study (IRIS) of Climate Change and Modernization; Michel Allard, M.L., Ed.; ArcticNet Inc.: Quebec City, QC, Canada, 2012; Chapter 6; pp. 171–197. [Google Scholar]
- Ulrich, M.; Matthes, H.; Schirrmeister, L.; Schütze, J.; Park, H.; Iijima, Y.; Fedorov, A.N. Differences in behavior and distribution of permafrost-related lakes in C entral Y akutia and their response to climatic drivers. Water Resour. Res. 2017, 53, 1167–1188. [Google Scholar] [CrossRef]
- Duguay, C.R.; Zhang, T.; Leverington, D.W.; Romanovsky, V.E. Satellite Remote Sensing of Permafrost and Seasonally Frozen Ground. Geophys. Monogr. Ser. 2013, 163, 91–118. [Google Scholar] [CrossRef]
- Arp, C.D.; Whitman, M.S.; Jones, B.M.; Grosse, G.; Gaglioti, B.V.; Heim, K.C. Distribution and biophysical processes of beaded streams in Arctic permafrost landscapes. Biogeosciences 2015, 12, 29–47. [Google Scholar] [CrossRef]
- Owuor, S.O.; Butterbach-Bahl, K.; Guzha, A.C.; Rufino, M.C.; Pelster, D.; Diaz-Pines, E.; Breuer, L. Groundwater recharge rates and surface runoff response to land use and land cover changes in semi-arid environments. Ecol. Process. 2016, 5, 16. [Google Scholar] [CrossRef]
- Gerlach, M.E.; Rains, K.C.; Guerrón-Orejuela, E.J.; Kleindl, W.J.; Downs, J.; Landry, S.M.; Rains, M.C. Using Remote Sensing and Machine Learning to Locate Groundwater Discharge to Salmon-Bearing Streams. Remote Sens. 2022, 14, 63. [Google Scholar] [CrossRef]
- Belknap, W.; Naiman, R. A GIS and TIR procedure to detect and map wall-base channels in Western Washington. J. Environ. Manag. 1998, 52, 147–160. [Google Scholar] [CrossRef]
- Ebersole, J.L.; Wigington, P.J.; Leibowitz, S.G.; Comeleo, R.L.; Van Sickle, J. Predicting the occurrence of cold-water patches at intermittent and ephemeral tributary confluences with warm rivers. Freshw. Sci. 2015, 34, 111–124. [Google Scholar] [CrossRef]
- Peterson, N.P.; Reid, L.M. Wall-base channels: Their evolution, distribution, and use by juvenile coho salmon in the Clearwater River, Washington. In Proceedings of the Olympic Wild Fish Conference, Port Angeles, WA, USA, 23–25 March 1983; pp. 215–225. [Google Scholar]
- Liu, S.; Feng, Y. Airborne GPR: Advances and Numerical Simulation College of Geo-Exploration Sci & Tech; Jilin University: Changchun, China; The third Railway Survey and Design Institute Group Corporation: Tianjin, China, 2011; pp. 3397–3400. [Google Scholar]
- Campbell, S.; Affleck, R.T.; Sinclair, S. Ground-penetrating radar studies of permafrost, periglacial, and near-surface geology at McMurdo Station, Antarctica. Cold Reg. Sci. Technol. 2018, 148, 38–49. [Google Scholar] [CrossRef]


| Refuge Type | Abbreviation | Description |
|---|---|---|
| Tributary confluence plume | T.C.P. | Cold water plume created by discharge of tributary |
| Lateral seep | L.S. | Bank-side cold water patch created through direct intersection of water table by river channel |
| Spring brook | S.B. | Cold channel emerging from floodplain depressions, springs or wetlands |
| Cold side channel | C.S.C. | Secondary cold channel alongside main river stem; may be ephemeral |
| Cold alcove | C.A. | Cold water patch at downstream end of bar; often coincides with emergence of abandoned/relict channel |
| Hyporheic upwelling | H.U. | Hyporheic resurgence found downstream of bars, riffles and meanders |
| Wall-base channel A | W.C. (A) | Cold channels formed by runoff at base of terrace (A) |
| Wall-base channel B | W.C. (B) | Cold channels formed by runoff on valley wall (B) |
| Thermal Refuge Type | Koroc River | Berard River |
|---|---|---|
| Spring brook | 23 | |
| Wall-base channel | 20 | |
| Lateral seep | 13 | 2 |
| Cold alcove | 5 | |
| Tributary confluence plume | 4 | |
| Cold side channel | 1 | 2 |
| Hyporheic upwelling | 1 |
| River | Zone | Water Temperature Decrease (°C) | Cooling Zone Length (m) | Temperature Decrease Rate (°C/km) | Valley Length (m) | Sinuosity | Average Channel Width (m) | Average Valley Width (m) | Entrenchment Ratio | Number of Thermal Refuges |
|---|---|---|---|---|---|---|---|---|---|---|
| Berard | B1 | 1.6 | 2363 | 0.68 | 2335 | 1.01 | 159 | 2154 | 13.57 | 0 |
| B2 | 0.6 | 1251 | 0.48 | 1100 | 1.14 | 61 | 1965 | 32.36 | 0 | |
| B3 | 0.4 | 668 | 0.60 | 634 | 1.05 | 54 | 1526 | 28.26 | 1 | |
| B4 | 0.9 | 1620 | 0.56 | 1433 | 1.13 | 55 | 2332 | 42.10 | 1 | |
| B5 | 0.9 | 1885 | 0.48 | 1034 | 1.82 | 62 | 1982 | 32.09 | 0 | |
| mean | 0.9 | 1557.4 | 0.56 | 1307.2 | 1.2 | 78.1 | 1991.7 | 29.7 | 0.4 | |
| SD | 0.4 | 573.6 | 0.08 | 573.2 | 0.3 | 40.4 | 268.3 | 9.3 | 0.5 | |
| Koroc | K1 | 0.5 | 2753 | 0.18 | 2103 | 1.31 | 148 | 1397 | 9.45 | 3 |
| K2 | 0.3 | 3085 | 0.10 | 2462 | 1.25 | 236 | 1119 | 4.73 | 4 | |
| K3 | 0.3 | 976 | 0.31 | 906 | 1.08 | 202 | 1521 | 7.52 | 1 | |
| K4 | 0.7 | 5175 | 0.14 | 4576 | 1.13 | 201 | 1522 | 7.59 | 12 | |
| K5 | 0.6 | 2253 | 0.27 | 2181 | 1.03 | 279 | 850 | 3.05 | 2 | |
| mean | 0.5 | 2512.4 | 0.25 | 2445.6 | 1.0 | 213.2 | 1281.9 | 6.5 | 4.4 | |
| SD | 0.2 | 1543.8 | 0.13 | 1191.4 | 0.3 | 43.2 | 261.2 | 2.3 | 3.9 |
Publisher’s Note: MDPI stays neutral with regard to jurisdictional claims in published maps and institutional affiliations. |
© 2022 by the authors. Licensee MDPI, Basel, Switzerland. This article is an open access article distributed under the terms and conditions of the Creative Commons Attribution (CC BY) license (https://creativecommons.org/licenses/by/4.0/).
Share and Cite
Fakhari, M.; Raymond, J.; Martel, R.; Dugdale, S.J.; Bergeron, N. Identification of Thermal Refuges and Water Temperature Patterns in Salmonid-Bearing Subarctic Rivers of Northern Quebec. Geographies 2022, 2, 528-548. https://doi.org/10.3390/geographies2030032
Fakhari M, Raymond J, Martel R, Dugdale SJ, Bergeron N. Identification of Thermal Refuges and Water Temperature Patterns in Salmonid-Bearing Subarctic Rivers of Northern Quebec. Geographies. 2022; 2(3):528-548. https://doi.org/10.3390/geographies2030032
Chicago/Turabian StyleFakhari, Milad, Jasmin Raymond, Richard Martel, Stephen J. Dugdale, and Normand Bergeron. 2022. "Identification of Thermal Refuges and Water Temperature Patterns in Salmonid-Bearing Subarctic Rivers of Northern Quebec" Geographies 2, no. 3: 528-548. https://doi.org/10.3390/geographies2030032