Article

Low Frequency Cyclic Mechanical Loading of Till Deposits from Northern Germany under Oedometric Conditions

Geomechanics and Geotechnics, Kiel University, Ludewig-Meyn-Straße 10, 24118 Kiel, Germany
*
Author to whom correspondence should be addressed.
Geotechnics 2023, 3(2), 531-549; https://doi.org/10.3390/geotechnics3020029
Submission received: 12 May 2023 / Revised: 16 June 2023 / Accepted: 17 June 2023 / Published: 20 June 2023

Abstract

:
Glacial deposits are of significant importance to geotechnical engineers and geologists in northern Europe, North America, and Northern Asia, as vast areas of these land surfaces were historically covered with ice leading to the formation of a wide variety of till deposits. The use of these areas for various engineering purposes warrants their subjection to mechanical loads (of static and cyclic forms) from manmade structures, as well as natural hazards such as earthquakes. This paper focuses on the experimental investigation of the cyclic mechanical loading behavior of two glacial tills from northern Germany under one-dimensional loading or oedometric conditions, and in different soil wetting conditions. The experimental results show a significant dependence of the cyclic mechanical response of the glacial tills on wetting condition and number of loading cycles. The recorded values of accumulated plastic strains of the glacial tills generally increase with an increase in wetting or moisture content, with the highest measured value for the two tills being around 3.9% after 19 cycles of loading. The findings of the experimental cyclic mechanical tests of the glacial tills are discussed in view of the intrinsic soil behavior and fabric.

1. Introduction

Tills can be generally defined as a poorly graded mixture of silt, sand, grave, or cobble-sized boulders, and clay materials deposited by ice glaciers [1]. Glacial till deposits are predominantly found in most of the northern continents of our world, due to ice cover in the past. These sedimentary deposits show a wide range of variations from weak plastic clay tills to highly dense non-plastic tills, which can be attributed to factors such as the variety of materials they are composed of, the means by which the materials were incorporated in the ice, the mode they were transported and deposited, etc. [2]. Moreover, the geotechnical properties of tills are not clearly defined in the literature, as they do not fall into the categories of coarse- or fine-grained soils and do not conform to typical soil mechanical and depositional models [2,3].
Furthermore, the complex nature of glacial tills as well as their variations in composition, structure, fabric, and general properties makes them difficult to collect, classify, and test [4,5,6]. Clarke [6] reported extensively on the formation, classification, and geotechnical properties of glacial tills, as well as the consequences of glacial processes. They noted that glacial tills are subject primarily to gravitational forces and some to shear forces during their formation, and that some tills may have the same composition but uniquely different properties due to different glaciation processes.
Several studies exist with regard to the formation of glacial deposits and the glacial dynamics of northern European ice sheets [7,8,9,10,11]. Punkari [7,9] studied the time-transgressive flow configurations of the northern European Weichselian ice sheets, including the Scandinavian ice sheet as well as the Novaya Zemlya ice sheet, and other comparatively smaller ice sheets from around the Barents Sea. The studies ranged from detailed fieldwork on a case study in southern Finland to ice-sheet-wide large-scale studies using satellite imagery.
Glacial tills are also predominantly found in northern Germany, through ice advances from Scandinavia via the Baltic depression to the south [12,13]. The oldest detailed mapping and description of glacial landscapes in the Schleswig-Holstein region of northern Germany were published by Gripp [14,15]. Detailed information on the glacial landscapes and the characteristics of the main geomorphological units of northern central Europe, including areas of northern Germany, northern Poland, northern Belarus, and the Baltic states, was reported by Marks et al. [10].
The use of these till deposits for various geotechnical and engineering purposes as the media of support or foundation carrying mechanical loads (of static and cyclic nature) from structures and other time-periodic loads, such as earthquakes, requires proper investigation of their geomechanical behavior. This paper focuses on providing new information on the experimental time-dependent mechanical loading behavior of tills to supplement the existing body of work on the geomechanical behavior of till deposits. The experimental cyclic mechanical loading investigations were carried out on two glacial till deposits from northern Germany with different wetting conditions or water contents using a one-dimensional loading or oedometric device.
Several researchers have studied the response of sands [16,17] and clays [18,19,20,21] to cyclic mechanical loading. Uygar and Doven [16] investigated the one-dimensional compressive behavior of a uniformly graded fine sand at elevated stress levels with oedometer tests using a combination of strain- and stress-controlled apparatus. Their cyclic test results showed a linear relationship between the relative density and compressibility index of the soil.
Fuentes et al. [20] performed simulations on the monotonic and cyclic response of two different clays under oedometric and triaxial conditions using a constitutive model for the simulation of saturated clays. Using the model, they were able to study the strain rate dependency as well as the inclusion of small strain effects of cyclic loading of clays for a wide range of strain amplitudes. Sun et al. [21] conducted a systematic study of the response of hydraulic conductivity of a remolded soft clay to dynamic loading. They performed a series of seepage tests using a dynamic triaxial seepage apparatus after cyclic loading. Their findings indicated a significant drop (up to around 29%) in the measured hydraulic conductivity of the soil after cyclic loading. A comprehensive review of the behavior of cohesive soils subjected to cyclic mechanical loading was reported by Nieto-Leal and Kaliakin [19].
Depending on the drainage type of a soil deposit, application of a cyclic loading can cause an accumulation of plastic or irreversible strains or excess pore-fluid pressures. Under drained conditions, a cyclic mechanical loading can cause the accumulation of plastic deformations at high loading cycles even for small loading amplitudes. For the case of un-drained conditions, a cyclic mechanical loading with significantly high amplitude (e.g., an earthquake) can cause the accumulation of high pore-fluid pressures leading to the liquefaction or the loss of strength of the soil [22,23,24].
Such accumulation of high plastic deformations is of paramount importance to practical engineering projects, where the tolerance to displacement is small, and can endanger the long-term serviceability of the structures, ultimately causing serviceability failures, and hence should be carefully studied prior to their design and operation. The aim of the investigation on the cyclic mechanical loading behavior of the two glacial tills from northern Germany studied in this research is to provide further data on the evolution and accumulation of plastic strains of glacial tills during cyclic loading, which will help future planning and design operations of engineering projects on glacial geological formations from this area.

2. Experimental Program

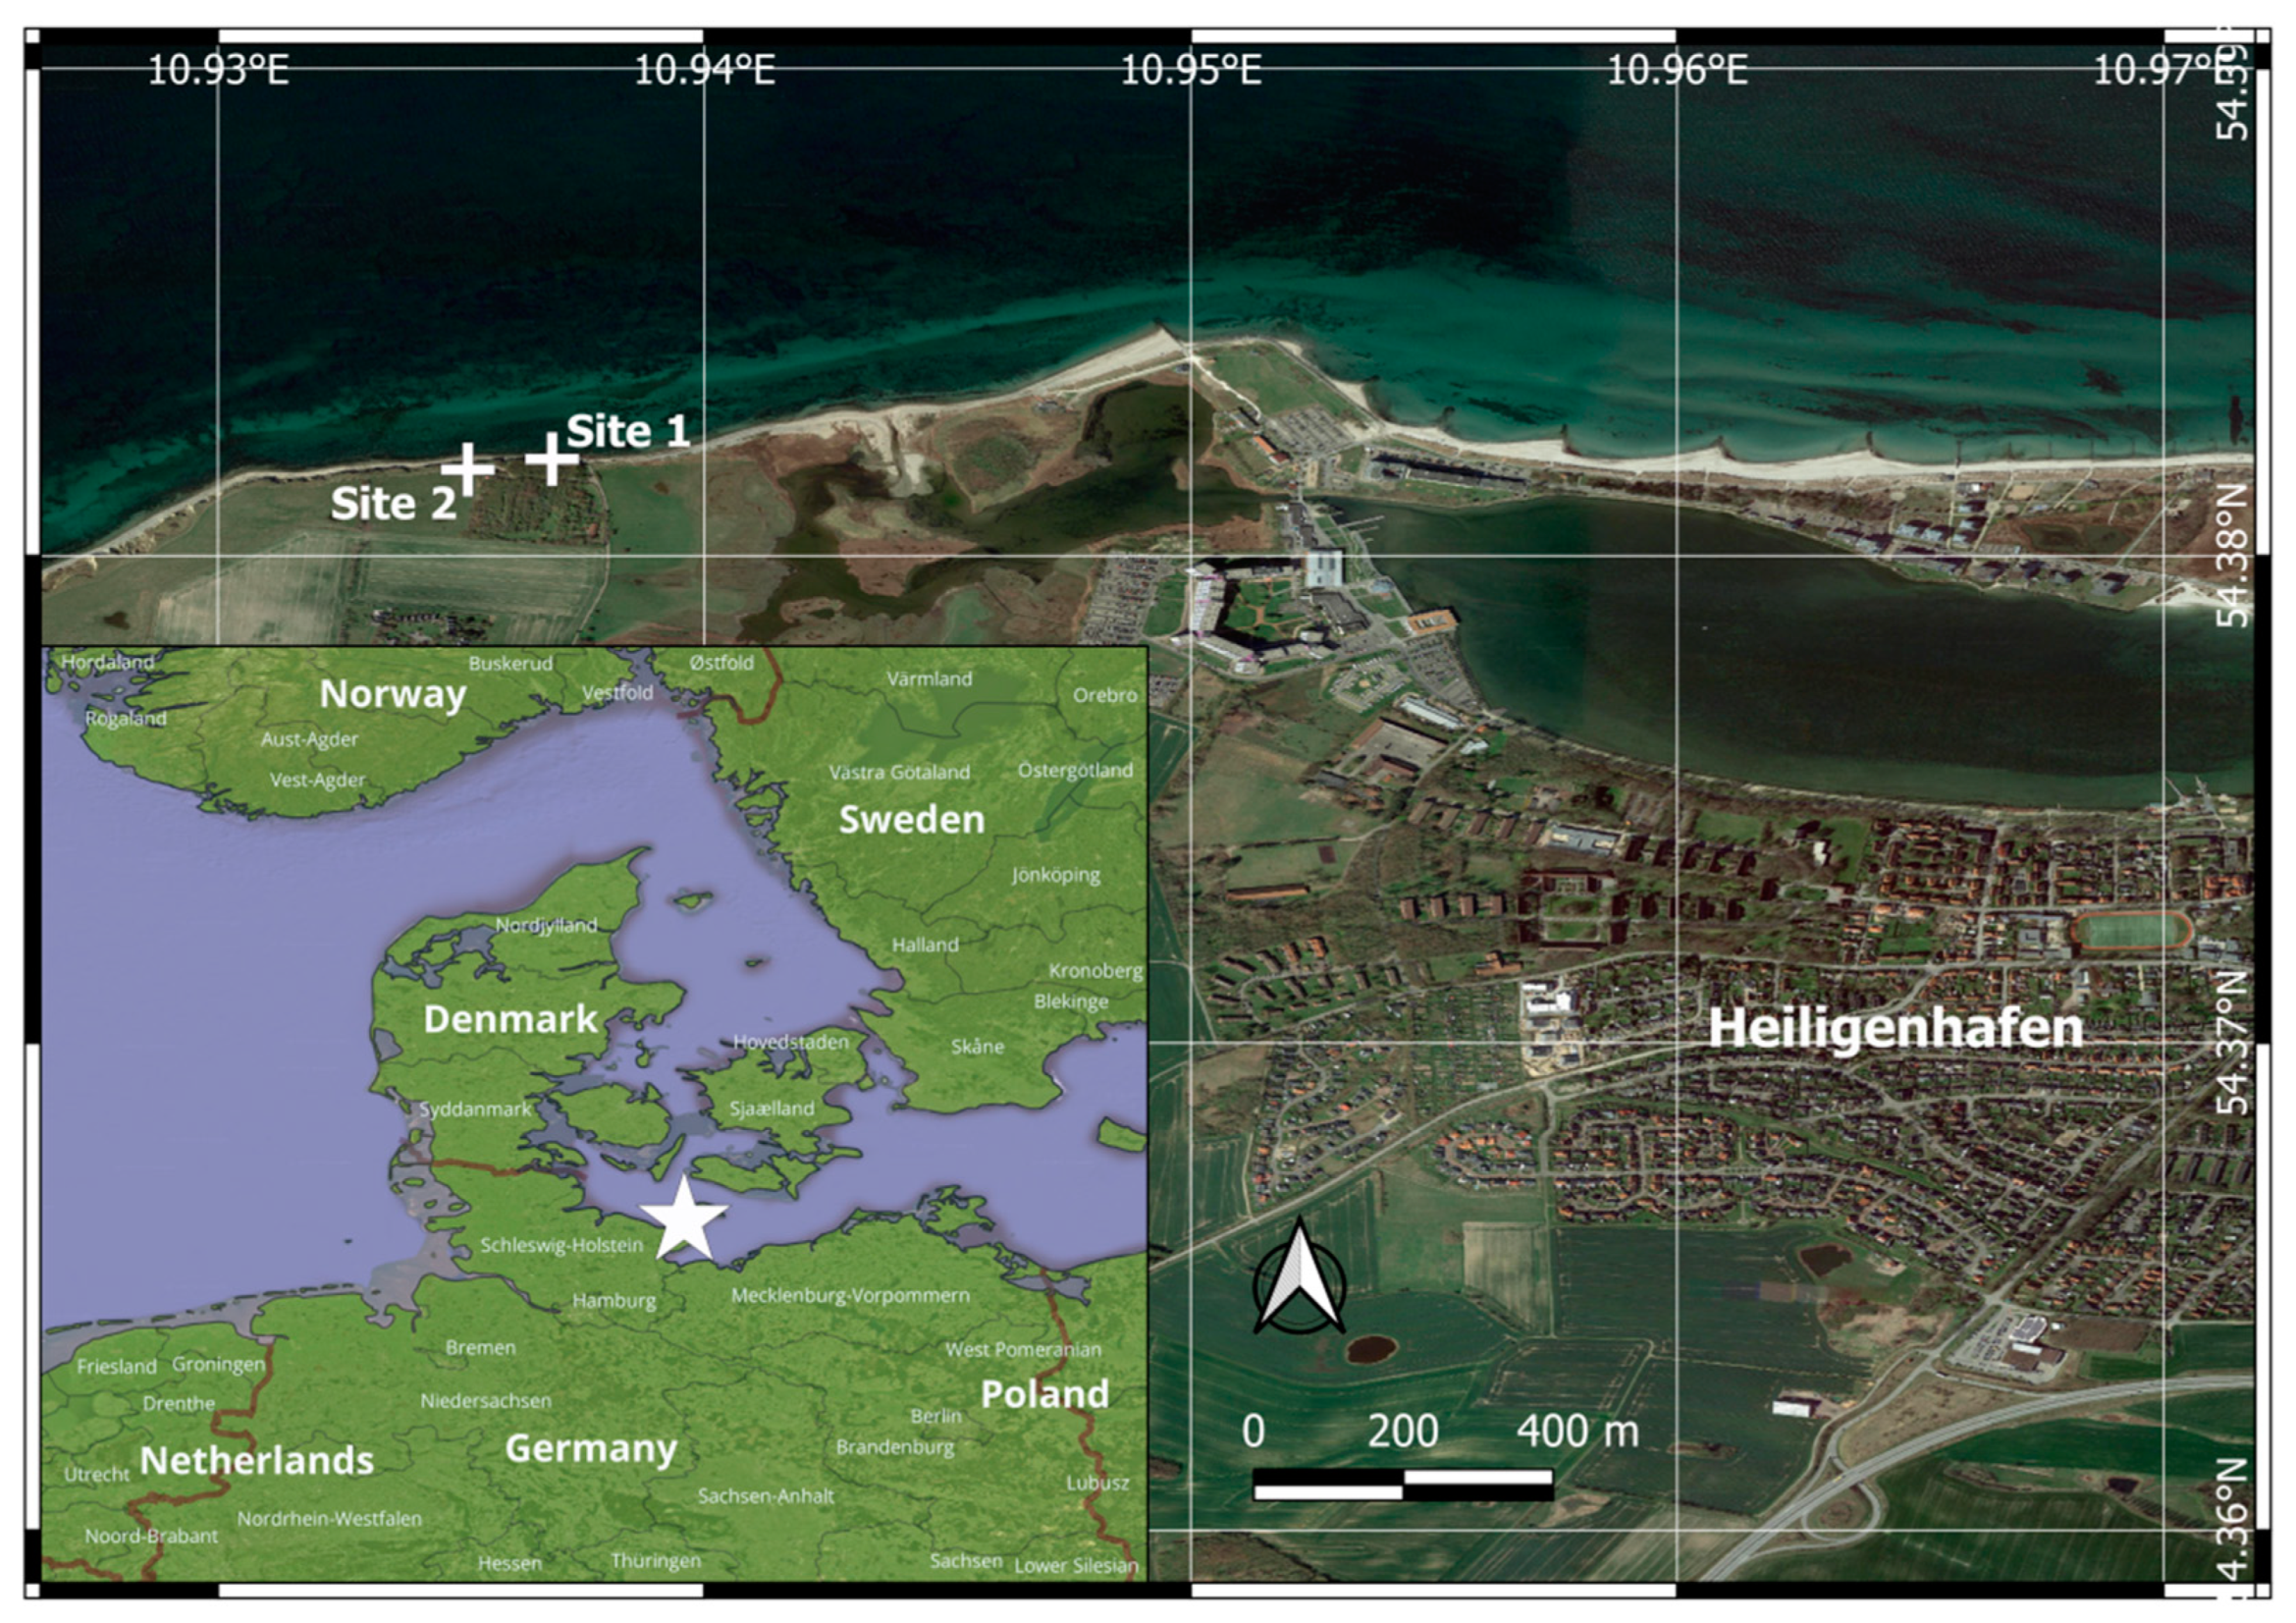
2.1. Tested Glacial Till Deposits

Two naturally occurring glacial tills from the ‘Hohe Ufer’ cliff, found in the Heiligenhafen area of Schleswig-Holstein, northern Germany [25,26], were used for the study (Figure 1 and Figure 2). As reported in Hailemariam and Wuttke [26], the two glacial tills are also labeled here in this study as ‘oM’ or “oberer Geschiebemergel” for the upper or younger Weichselian till deposit collected from site 1, and as ‘mM’ or “mittlerer Geschiebemergel” for the middle or comparatively older Saalian till deposit collected from site 2 (see Figure 1).
The glacial till samples used in our study were collected from the exposed outcrops of both till deposits at Hohes Ufer in Heiligenhafen. Some of the geotechnical properties of the two tills, which were obtained in accordance with ASTM D420-D5876 [27], are given in Table 1, and a more detailed report was provided in Hailemariam and Wuttke [26]. In general, the two glacial till deposits investigated in this study do not primarily fall in any of the single soil classification types as given by the unified soil classification system (USCS), but are rather described using dual symbols as shown in Table 1. Both tills exhibit many of the commonly known properties of typical soils, and are hence referred to as ‘soils’ in this research.

2.2. Equipment Used

The cyclic mechanical loading behavior of the tills was studied experimentally using a one-dimensional loading or oedometric testing device (Figure 3). The test apparatus consists of an oedometer cell containing a cylindrical oedometer ring for holding the sample, with a diameter of 50 mm and a height of 19 mm (which are also the dimensions of the sample); a bottom porous stone and a top loading cap with a porous stone attached to its bottom side facing the sample; an outer circular glass guard used for flooding the sample during a saturated test; a UL-25 loading machine (with a maximum force limit of 25 kN), which can also measure the vertical displacement of the sample from the movement of the loading rods directly, and which is also fitted with a 5 kN capacity high accuracy load cell of the type KAS-E/D for measuring the applied load to the sample; an extra TRS-0025 displacement transducer with an electrical range of 25 mm for measuring the sample deformation; and a PC control and data logger unit for system control and data recording.

2.3. Experimental Procedure

The till samples for the oedometer tests were prepared under remolded conditions inside consolidation rings with dimensions of a diameter of 50 mm and a height of 19 mm, making sure that the bulk density was homogeneous throughout the specimen volume, and the bottom and top faces were made flat to ensure a uniform distribution of the applied vertical stress (Figure 4). The test specimens were prepared from samples of each till deposit which were collected around four years ago from the site at Heiligenhafen, and stored thereafter in our laboratory. The samples were initially collected at field or natural unsaturated condition, but then lost some moisture content during storage. The actual gravimetric moisture contents of the till soils recorded at the time of preparation of the samples for the oedometer tests were 0.1142 for oM and 0.0871 for mM. All water content measurements in this study were performed by placing the soil samples in a drying oven with an inside temperature of around 105 °C for around 24 h. All oedometer samples were initially prepared at these moisture contents and with porosities of 0.281 for oM and 0.258 for mM. The initial bulk density or porosity used for the remolded samples was calculated from undisturbed till specimens obtained from the sampling locations.
The one-dimensional loading tests were conducted under three conditions, namely; dry condition, unsaturated condition, and fully saturated condition (with and without the provision of swelling) (see Table 2 for more details on the investigated cases). For the tests at dry condition, the samples were initially prepared in the oedometer rings at unsaturated condition with a controlled porosity and then placed in the oven with an inside temperature of around 50 °C for around 48 h for drying. The low oven temperature of 50 °C was chosen for the drying process in order to preserve the in situ state of the samples and to avoid chemical changes in the grain fabric of the soils which could occur due to heating the samples at higher temperatures. The use of this reduced oven temperature, which is lower than the standard 105–110 °C typically used for, e.g., water content measurement, was compensated by increasing the drying time of the samples from the standard 24 h to 48 h. After taking the test samples out of the oven, sufficient time was allotted for their temperature to stabilize to room temperature before starting the cyclic oedometric tests. For each sample, sub-samples were prepared for checking the water content of the test samples, and gravimetric water contents of 0.0056 for oM and 0.0051 for mM were obtained at near-dry condition.
For the tests at saturated condition, initially the samples were prepared with a controlled porosity as stated above and in unsaturated condition, and then after two sets of saturation processes were adopted to saturate the samples in the study. The first saturation process was conducted by maintaining the constant sample initial porosity, flooding or inundating the samples with water to achieve saturation of each sample, and then by allowing the samples to homogenize for 24 h after flooding with water prior to the start of the oedometer tests. For each sample, sub-samples were prepared for checking the water content of the test samples, and gravimetric water contents of 0.1507 for oM and 0.1295 for mM were obtained at saturated condition.
The second saturation process was performed by doing a swelling test under a low seating load of 5 kPa prior to the start of the oedometric loading tests. This technique can produce changes in sample porosity prior to the cyclic tests depending on the stiffness or resistance to deformation of the samples. For the swelling tests, a seating load of around 5 kPa was initially applied to the samples and sufficient time was allotted for the strain of the samples to stabilize. After the changes in sample deformation were considered insignificant, the samples were flooded with water, and sufficient time was then allowed for the moisture content of the samples to homogenize. Finally, the cyclic loading phase of the experiments was started around 24 h after the start of the test.
The cyclic one-dimensional loading tests were performed under vertical stress which oscillated between a minimum value of 5 kPa and a maximum value of 205 kPa. Hence, the mean or base load of the tests was around 105 kPa. The minimum load was selected as a contact or seating load, and the maximum load was selected to simulate applied loads coming from a hypothetical superstructure. A constant rate of 100 kPa/min was used to change between the minimum and maximum applied cyclic loads for the tests, and a minimum dwelling period of around 1 min was allotted once the desired minimum or maximum loads were achieved before proceeding to the next load step. This gives a total period of around 360 s for the application of each cycle, corresponding to a target or design frequency of the cyclic tests of around 0.0028 Hz.
However, the actual frequency obtained during the tests was usually slightly lower than the target frequency, as the machine only establishes a load step for the start of the dwelling time of each step after the rate of change of deformation is deemed small enough (i.e., lower than 0.05 mm/min). Comparatively speaking, the measured test frequency generally decreased with an increase in the moisture content of the samples and vice versa, because more time is needed for the stabilization of strains for wetter samples as compared to drier samples. The average actual test frequency recorded for the tests excluding the swelling tests was around 0.0021 Hz for the whole duration of the cyclic tests, and typically around 0.0022 Hz for the last three cycles of loading only. A total of 19 cycles of mechanical loading were applied for each specimen, and the cyclic loading and displacement data were recorded at an acquisition rate of 1 s.

3. Results and Discussion

In this section, the experimental results of the cyclic one-dimensional mechanical loading of the glacial tills are presented.

3.1. Influence of Wetting on the Cyclic Mechanical Loading Behavior of the Till Deposits

Figure 5, Figure 6, Figure 7, Figure 8, Figure 9, Figure 10, Figure 11 and Figure 12 show the results of the cyclic oedometric tests on the two till soils at the three wetting conditions (i.e., dry condition, unsaturated condition and saturated condition without swelling test). The oedometer test is normally a fully drained test, due to the provision of porous stones on both faces of the specimen for water removal upon the loading process of the soil. For our case, it can be assumed that for the tests with wetter sample conditions (i.e., unsaturated and saturated states), although the rate of loading used in this study is faster than what is used for normal consolidation tests, generation of excess pore-water pressure in the specimens can be considered insignificant as the two soils have significantly low plasticity or are non-plastic (see Table 1).
The actual average test frequencies obtained using the best-fit sine functions plotted alongside the vertical stress σ versus the elapsed time t plots for the last three cycles of the tests at the three wetting conditions were: 0.00250 Hz at dry state (Figure 6a,b), 0.00216 Hz at unsaturated state (Figure 8a,b) and 0.00204 Hz at fully saturated state (Figure 10a,b). These differences in the applied cyclic load frequency are due to the fact that the machine establishes a load step for the start of the dwelling time of each step only after the rate of change of deformation is deemed small enough (i.e., lower than 0.05 mm/min).
Comparatively speaking, the measured test frequency decreased with the increase in moisture content of the samples and vice versa because more time is needed for the stabilization of strains for wetter samples as compared to drier samples. This is shown by the comparatively higher gradient of settlement ∇δ values (especially for the first cycle) for wetter samples (e.g., maximum ∇δ values were around 0.5 mm/min for oM and around 0.34 mm/min for mM at fully saturated state) than drier samples (e.g., maximum ∇δ values were around 0.1 mm/min for both soils at dry state), leading to a longer test duration for the tests on the wetter samples than the drier samples (Figure 6c,d, Figure 8c,d and Figure 10c,d).
To evaluate the actual frequency of the vertical stress σ versus time t signals over the whole test duration for all studied cases, basic spectral analysis of the signals was performed using Fourier transform. Fourier transform is a tool that can be used to reveal the frequency components of time- or space-varying signals by representing them in the frequency domain. In this research, the discrete Fourier transform (DFT) of the data was performed using the fast Fourier transform (FFT) or ‘fft’ function of MATLAB. The FFT or DFT of a real signal is a complex number, with a real and an imaginary component.
Before applying the FFT function to the signals, mean adjustment was applied to the signals to remove the 0 Hz frequency peak component of the signals, using the relation σ ( t ) = σ ( t ) σ m e a n , where σ(t) is the time varying applied vertical stress and σmean is the mean vertical stress. Afterward FFT was applied using the ‘fft’ function of MATLAB to compute the discrete Fourier transform of the signals. Then after the ‘fftshift’ function of MATLAB was used to view the power spectrum or power P versus frequency f plots of the signals centered at 0 Hz frequency by performing a circular shift on the FFT, as this will better represent the signal’s periodicity.
All these Fourier transform processes applied together are able to consequently reveal the hidden frequency components of the signals in the time domain as spikes in power in the frequency domain. The power in each frequency component represented by the FFT or DFT of the signal is obtained as P = | FFT [ σ ( t ) ] | 2 / n , where n is the number of samples in the signal. More detailed information on the time series analysis of signals can be found in Ghaderpour and Pagiatakis [28] and Ghaderpour et al. [29].
The actual average test frequencies obtained using the Fourier transform of the signals for the whole duration of the cyclic loading for the three wetting conditions were: 0.00241 Hz at dry state, 0.00202 Hz at unsaturated state, and 0.00189 Hz at fully saturated state without prior swelling test (Figure 11). As expected, these frequency values obtained for the whole duration of cyclic loading are slightly lower than the actual average frequencies obtained only for the last 3 cycles at the same three wetting conditions. This is due to the fact that with the progress of cyclic loading, the response of the soils to cyclic loading becomes more and more elastic with little accumulation of plastic strains, and consequently, the time needed for the stabilization of strains and for changing between the applied cyclic loads is generally lower near the end of the cyclic loading test compared to the start of the test.
In all three cases of saturation, the plots show a considerable increase in the measured cyclic vertical deformation δ or cyclic vertical strain ε of the till samples with the increasing number of cycles N (Figure 5a,b, Figure 7a,b and Figure 9a,b), as the stress and strain loops generated by the application of the cyclic mechanical loads are not completely closed (Figure 5c,d, Figure 7c,d and Figure 9c,d). This leads to irrecoverable or plastic deformations δp and the generation of plastic strains εp with each applied cycle, leading to an accumulation of plastic deformations δp,acc or strains εp,acc with the progress of cyclic loading [24].
The actual cyclic frequency (around f = 0.0021 Hz) used in the study is much lower than 1 Hz, hence, inertia forces are neglected and the accumulated deformations are largely considered to be plastic [30,31]. Furthermore, the magnitude of the measured εp,acc of the tills is in general the highest for the first cycle, which is typically referred to as the ‘irregular cycle’ in the literature. The magnitudes of εp of each cycle and hence εp,acc shown in all the plots in this study were calculated from the experimental stress-strain data using a new code written in MATLAB.
The results show a significant increase in the measured cyclic vertical strains ε and hence accumulation of low cycle plastic strains εp,acc of both tills with the increasing number of cycles N. With the application of the cyclic mechanical loading and changes in the stress-strain loops of the soils, the quartz, calcite, and albite-dominated particle grains [26] are subjected to changes in their inter-particle interlocking and frictional or cohesional forces and the till skeleton undergoes grain rearrangements leading to irrecoverable or plastic deformations.
Generally, for the given range of loading, mM with its coarser grain fraction or texture and lower plasticity is stiffer (with a higher compressibility modulus) and has a lower measured total strain ε for all soil saturation conditions compared to that of oM (Figure 5, Figure 7 and Figure 9). The levels of strain ε measured for oM at dry, unsaturated, and saturated conditions at the end of the loading phase of the first cycle are 0.75, 2.97 and 4.26%, respectively (Figure 12a), while for mM the corresponding values are 0.66, 1.26 and 2.14%, respectively (Figure 12b). Overall, the experimental results show an increase in the compressibility of the two glacial tills (as well as an increase in the measured εp,acc) with an increase in water content (Figure 12).
Overall, fine- and medium-size grained soils are characterized by the presence of high quantities of bound and free water molecules at the inter-planar space of the clay minerals [32,33,34]. Upon vertical loading of these soils in this condition, the soils are compressed and pore-water is expelled from their void spaces in a process typically known as consolidation. The degree of compression or consolidation usually decreases with soil dryness, and is highly related to the degree of saturation or the amount of water present in the void space of the soil. For fine- and medium-grained soils, the degree of interlocking and friction between the particle grains at low moisture contents is high resulting in high resistance to deformation, whereas, with the addition of moisture content to the soil, the lubrication between the individual particle grains forming the soil skeleton increases, thus lowering the resistance to deformation of the soil.
In a similar manner, the amount of the measured εp,acc of the soils with the progress of cyclic loading increased with an increase in wetting or moisture content of the soil (measured εp,acc for oM at dry, unsaturated, and saturated conditions after 19 cycles are 0.36, 2.58 and 3.90%, respectively, Figure 12c, while for mM the corresponding values are 0.27, 0.78 and 1.58%, respectively, Figure 12d). Furthermore, both tills show shakedown behavior, with most of the measured εp,acc of the soils occurring within the first cycle and stabilizing afterward.
The rate of increase or increment in plastic strain after the first cycle was also higher for the wetter soils (hence requiring a higher number of cycles for the cyclic response of the soils to stabilize and eventually become elastic) compared to the drier conditions (where both glacial till soils stabilize quickly more or less after the first cycle, and their cyclic response becomes elastic) (Figure 8c,d). Shakedown behavior is typically seen when the cyclic strain increment decreases and the soil stabilizes with the increasing number of cycles without ever reaching ultimate failure. The different modes of plastic strain accumulation of soils subjected to cyclic loading are described in Goldscheider [35] and Shajarati et al. [31].

3.2. Investigation of Swelling Behavior and Cyclic Mechanical Loading of the Glacial Till Deposits

In Figure 13, Figure 14, Figure 15 and Figure 16, the results of the cyclic mechanical oedometric tests on the two till soils which were performed at fully saturated conditions with the provision of swelling are shown.
The findings indicate that till oM, being the softer of the two soils, undergoes a high rate of deformation (a total strain of around 0.75%) under the application of the seating load of 5 kPa prior to inundation with water (Figure 13a). The strain induced by the swelling of the soil afterward due to the addition of water was around 0.17%. As a result, a much denser medium is formed, and thus the total strain reached after full saturation and the application of the loading phase of the first cycle for the soil saturated with prior swelling is only around 3.27%, which is much lower than its equivalent strain value of around 4.26% for the oM soil saturated without a prior swelling test (Figure 16a).
However, till mM, being a comparatively stiffer soil, exhibits minor or negligible deformation (a total strain of around 0.09%) upon the application of the seating load of 5 kPa prior to the addition of water for saturation (Figure 13b). Almost no induced strain from swelling of the soil due to the addition of water was observed. Hence, unlike till oM, its loading behavior is not considerably affected by the saturation procedure, i.e., with or without a swelling test (the total strain after the application of the loading phase of the first cycle is around 2.27% for the saturated test with a provision for swelling and around 2.14% for the saturated test without a provision for swelling) (Figure 16b).
The same behavior is also observed for the two soils in terms of the magnitude of the accumulated plastic strains associated with the loading cycles. Overall, for soil oM, much lower εp,acc is measured after 19 cycles of loading for the saturated test with swelling (εp,acc = 2.47%) compared to the one without swelling (εp,acc = 3.90%) (Figure 16c). Whereas, for soil mM, the accumulated plastic strains after 19 cycles of loading for the two saturation processes were comparably close in magnitude (measured εp,acc = 1.66% with a swelling test and εp,acc = 1.58% without a swelling test) (Figure 16d).
With regards to the obtained frequencies f and gradient of settlement ∇δ values, very minor variations were detected for the tests at saturated condition with and without the provision of swelling. The actual average test frequency of the last three cycles only of the cyclic test, which was obtained using the best-fit sine function plotted alongside the vertical stress σ versus the elapsed time t plot, was 0.00206 Hz at the fully saturated condition with prior swelling (Figure 14a,b). This value is similar to the corresponding average frequency for the test at saturated condition without prior swelling (i.e., f = 0.00204 Hz) (Figure 10a,b). Furthermore, the FFT spectral analysis of the vertical stress σ versus time t signals of the two soils at saturated state indicates very minor variations of the obtained mean frequencies for the whole duration of cyclic loading of the two soils with the two saturation methods (i.e., with and without the provision of swelling) (Figure 15).
Similarly, for soil mM, close values of the gradient of settlement ∇δ for the first cycle were obtained at the saturated tests without swelling compared to those with swelling (e.g., maximum ∇δ values for mM at saturated state with, Figure 14d, and without, Figure 10d, swelling tests were around 0.3 mm/min and 0.34 mm/min, respectively). Whereas, for soil oM, slightly lower gradient of settlement ∇δ values for the first cycle were obtained at the saturated tests with swelling compared to those without swelling (e.g., maximum ∇δ values for oM at saturated state with, Figure 14c, and without, Figure 10c, swelling tests were around 0.34 mm/min and 0.5 mm/min, respectively). This is to be expected considering that the sample for soil oM with prior swelling tests is comparatively denser compared to that without prior swelling test at the beginning of the cyclic loading test (during the first cycle), as discussed earlier.
The findings of this research can contribute to future work concerning a higher understanding of the behavior of glacial till deposits subjected to cyclic one-dimensional loading, and the subsequent development of models for the yielding and plastic deformation analysis of glacial tills under these loading conditions, which will enable the safe design and operations of future engineering projects built on these geological formations. However, the focus of the study presented in this research was on only the two glacial tills, and hence, the scope of future studies can be widened to include more glacial tills, covering wider areas and geological formations, as well as the measurement and monitoring of several parameters such as matric suction, temperature, etc. under laboratory conditions simultaneous with the cyclic tests.

4. Conclusions

Glacial till deposits are commonly found in most of the northern continents of our world due to ice cover in the past. Till deposits are also largely found in northern Germany through past ice advances from Scandinavia. Assessing the mechanical behavior of the till deposits (in the forms of static and cyclic loading) prior to their use for geotechnical and engineering purposes, as the media of support or foundation carrying loads from structures and other time periodic natural loads, such as earthquakes, is necessary. In this paper, the findings of an experimental study on the cyclic mechanical one-dimensional loading of two glacial till deposits, performed at different wetting conditions ranging from dry condition to saturated state, were presented.
The findings showed a significant increase in the measured vertical deformation δ or strain ε and the accumulation of plastic deformations δp,acc or strains εp,acc of both soils with the increasing number of cycles, as the stress and strain loops generated by the application of the cyclic loads were not completely closed. Overall, for the given range of loading, the second till, ‘mM’, with its comparatively coarser grain fraction or texture and lower plasticity, was stiffer (with a higher compressibility modulus), and exhibited a lower measured total strain ε for all soil saturation conditions when compared to that of the first till, ‘oM’. In addition, the experimental results showed an increase in the compressibility of the two glacial tills (as well as an increase in the measured accumulated plastic strains εp,acc) with an increase in water content. Measured εp,acc for oM at dry, unsaturated, and saturated conditions after 19 cycles were 0.36, 2.58, and 3.90%, respectively, while for mM the corresponding values were 0.27, 0.78, and 1.58%, respectively. This is as expected, as the addition of moisture content to a soil increases the degree of lubrication between the individual particle grains forming the soil skeleton, thus lowering the resistance to deformation or increasing the compressibility of the soil.
Furthermore, both tills showed a shakedown behavior, where the cyclic strain increment or the accumulation of plastic deformation decreases with the increasing number of cycles without ever reaching ultimate failure and finally reaching a stable state. The rate of increase of plastic strain after the first cycle was also comparatively higher for the soils in a wetter state (hence requiring higher number of cycles for the cyclic response of the soils to stabilize and eventually become elastic) when compared to the soils in drier conditions (where both till soils stabilize quickly more or less after the first cycle, and their cyclic response becomes elastic). The assessment of shakedown behavior and accumulation of plastic strains of a soil is generally of high importance in assessing the long-term serviceability of structures resting upon the soil.
The outcomes of this research can provide valuable data and insight for future experimental work and analysis, as well as the development of the yielding behavior and prediction models for the cyclic one-dimensional loading response of glacial till deposits.

Author Contributions

Conceptualization, H.H.; methodology, H.H.; formal analysis, H.H.; investigation, H.H.; resources, H.H. and F.W.; data curation, H.H.; writing—original draft preparation, H.H.; writing—review and editing, H.H. and F.W.; project administration, F.W.; funding acquisition, F.W. All authors have read and agreed to the published version of the manuscript.

Funding

This research was partially funded by the German Federal Ministry for Economic Affairs and Energy (BMWi), under grant number 03ET6122A.

Data Availability Statement

No public data repository.

Acknowledgments

Collection of soils from the sites in the Heiligenhafen area of Schleswig-Holstein, northern Germany, was performed during the time of Project ANGUS II, which was funded by the BMWi, under grant number 03ET6122A. The authors would like to acknowledge the financial support provided by the BMWi during this time.

Conflicts of Interest

The authors declare no conflict of interest.

References

  1. Hambrey, M.J. Glacial Environment; University College Press: London, UK, 1994. [Google Scholar]
  2. Bell, F.G. The geotechnical properties of some till deposits occurring along the coastal areas of eastern England. Eng. Geol. 2002, 63, 49–68. [Google Scholar] [CrossRef]
  3. Hughes, D.B.; Clarke, B.G.; Money, M.S. The glacial succession in lowland northern England. Q. J. Engng. Geol. 1998, 31, 211–234. [Google Scholar] [CrossRef]
  4. Clarke, B.G. Engineering of Glacial Deposits; CRC Press: London, UK, 2017. [Google Scholar]
  5. Griffiths, J.S.; Martin, C.J. (Eds.) Engineering Geology and Geomorphology of Glaciated and Periglaciated Terrains; Engineering Group Working Party Report, Engineering Geology Special Publications no. 28; Geological Society of London: London, UK, 2017. [Google Scholar]
  6. Clarke, B.G. The engineering properties of glacial tills. Geotech. Res. 2018, 5, 262–277. [Google Scholar] [CrossRef] [Green Version]
  7. Punkari, M. Glacial Dynamics of the Northern European Ice Sheets. Ph.D. Thesis, Department of Geology, University of Helsinki, Helsinki, Finland, 1996. [Google Scholar]
  8. Forsström, L.; Punkari, M. Initiation of the last glaciation in northern Europe. Quat. Sci. Rev. 1997, 16, 1197–1215. [Google Scholar] [CrossRef]
  9. Punkari, M. Glacial and glaciofluvial deposits in the interlobate areas of the Scandinavian Ice Sheet. Quat. Sci. Rev. 1997, 16, 741–753. [Google Scholar] [CrossRef]
  10. Marks, L.; Bitinas, A.; Blaszkiewicz, M.; Borner, A.; Guobyte, R.; Rinterknecht, V.; Tylmann, K. Glacial landscapes of northern central Europe. In European Glacial Landscapes; Palacios, D., García-Ruiz, J.M., Hughes, P.D., Andrés, N., Eds.; Elsevier: Chennai, India, 2022; pp. 45–52. [Google Scholar]
  11. Pisarska-Jamroży, M.; Belzyt, S.; Börner, A.; Hoffmann, G.; Kenzler, M.; Rother, H.; Steffen, R.; Steffen, H. Late Pleistocene earthquakes imprinted on glaciolacustrine sediments on Gnitz Peninsula (Usedom Island, NE Germany). Quat. Sci. Rev. 2022, 296, 107807. [Google Scholar] [CrossRef]
  12. Lampe, R. Pleistocene and Holocene evolution of coastal NE Germany (Isle of Rügen). In From the Northern Ice Shield to the Alpine Glaciations; Sauer, D., Ed.; Deutsche Quartärvereinigung e.V.; Geozon Science Media: Greifswald, Germany, 2011; pp. 6–18. [Google Scholar]
  13. LLUR. Geologische Übersichtskarte von Schleswig-Holstein; Landesamt für Landwirtschaft, Umwelt und ländliche Räume (LLUR): Flintbek, Germany, 2012. [Google Scholar]
  14. Gripp, K. Über die Äußerste Grenze der Letzten Vereisung in Nordwest-Deutschland; Sonderabdruck aus Mitteilungen der Geographischen Gesellschaft in Hamburg Band XXXVI; De Gruyter: Berlin, Germany, 1924; pp. 159–245. [Google Scholar]
  15. Gripp, K. Erdgeschichte von Schleswig-Holstein; Karl Wachholtz: Neumünster, Germany, 1964. [Google Scholar]
  16. Uygar, E.; Doven, A.G. Monotonic and cyclic oedometer tests on sand at high stress levels. Granul. Matter 2006, 8, 19–26. [Google Scholar] [CrossRef]
  17. Xia, P.; Shao, L.; Deng, W.; Zeng, C. Evolution prediction of hysteresis behavior of sand under cyclic loading. Processes 2022, 10, 879. [Google Scholar] [CrossRef]
  18. Åhnberg, H.; Larsson, R.; Holmén, M. Degradation of clay due to cyclic loadings and deformations. In Proceedings of the 18th International Conference on Soil Mechanics and Geotechnical Engineering; Delage, P., Desrues, L., Frank, R., Puech, A., Schlosser, F., Eds.; Presses des Ponts: Paris, France, 2013; pp. 1411–1414. [Google Scholar]
  19. Nieto-Leal, A.; Kaliakin, V.N. Behavior of Cohesive Soils Subjected to Cyclic Loading: An Extensive Review of Pertinent Literature; Research Report; Department of Civil and Environmental Engineering, University of Delaware: Newark, DE, USA, 2013. [Google Scholar]
  20. Fuentes, W.; Tafili, M.; Triantafyllidis, T. An ISA-plasticity-based model for viscous and non-viscous clays. Acta Geotech. 2018, 13, 367–386. [Google Scholar] [CrossRef]
  21. Sun, M.; Yu, J.; Ding, Z.; He, S. Numerical model about the influence of cyclic load on the hydraulic conductivity of soft clay. KSCE J. Civ. Eng. 2021, 25, 4159–4172. [Google Scholar] [CrossRef]
  22. Zienkiewicz, O.C.; Chang, C.T.; Hinton, E. Non-linear seismic response and liquefaction. Int. J. Numer. Anal. Methods Geomech. 1978, 2, 381–404. [Google Scholar] [CrossRef]
  23. Finn, W.D.L. Dynamic response analyses of saturated sands. In Soil Mechanics–Transient and Cyclic Loads; Zienkiewicz, O.C., Ed.; Wiley: New York, NY, USA, 1982; pp. 6–18. [Google Scholar]
  24. Sawicki, A.; Swidzinski, W. Mechanics of a sandy subsoil subjected to cyclic loadings. Int. J. Numer. Anal. Methods Geomech. 1989, 13, 511–529. [Google Scholar] [CrossRef]
  25. Stephan, H.J. Exkursionsführer Heiligenhafener ‘Hohes Ufer’. Der Geschiebesammler 1985, 18, 83–99. [Google Scholar]
  26. Hailemariam, H.; Wuttke, F. A Laboratory study on the shear strength behavior of two till deposits from northern Germany. Energies 2021, 14, 1692. [Google Scholar] [CrossRef]
  27. ASTM D420–D5876; Soil and Rock (I). ASTM International: West Conshohocken, PA, USA, 2011.
  28. Ghaderpour, E.; Pagiatakis, S.D. LSWAVE: A MATLAB software for the least-squares wavelet and crosswavelet analyses. GPS Solut. 2019, 23, 50. [Google Scholar] [CrossRef]
  29. Ghaderpour, E.; Pagiatakis, S.D.; Hassan, Q.K. A survey on change detection and time series analysis with applications. Appl. Sci. 2021, 11, 6141. [Google Scholar] [CrossRef]
  30. Peralta, P.K. Investigations on the Behavior of Large Diameter Piles under Long-Term Lateral Cyclic Loading in Cohesionless Soil. Ph.D. Thesis, Leibnitz Universität Hannover, Hannover, Germany, 2010. [Google Scholar]
  31. Shajarati, A.; Sørensen, K.W.; Nielsen, S.K.; Ibsen, L.B. Behaviour of Cohesionless Soils during Cyclic Loading; DCE Technical Memorandum, No. 14; Department of Civil Engineering, Aalborg University: Aalborg, Denmark, 2012. [Google Scholar]
  32. Schafer, J.C.; Singer, M.J. Influence of physical and mineralogical properties on swelling of soils in Yolo County, California. Soil Sci. Soc. Am. J. 1976, 40, 557–562. [Google Scholar] [CrossRef]
  33. Low, P.F.; Margheim, J.F. The swelling of clay: I. Basic concepts and empirical equations. Soil Sci. Soc. Am. J. 1979, 43, 473–481. [Google Scholar] [CrossRef]
  34. Parker, J.C.; Amos, D.F.; Zelazny, L.W. Water adsorption and swelling of clay minerals in soil systems. Soil Sci. Soc. Am. J. 1982, 46, 450–456. [Google Scholar] [CrossRef]
  35. Goldscheider, M. Shakedown and incremental collapse of structures in dry sand bodies. In Dynamical Methods in Soil and Rock Mechanics. Proceedings of an International Symposium and a NATO Advanced Study Institute, Karlsruhe 1977. 1: Dynamic Response and Wave Propagation in Soils. 2: Plastic and Long-term Effects in Soils. 3: Rock Dynamics and Geophysical Aspects; Balkema: Rotterdam, The Netherlands, 1978. [Google Scholar]
Figure 1. Sampling locations at the ‘Hohe Ufer’ cliff of Heiligenhafen area in Schleswig-Holstein, northern Germany: Site 1 (54°22′55.0′′ N 10°56′12.9′′ E) location of glacial till deposit oM; site 2 (54°22′54.6′′ N 10°56′06.4′′ E) location of glacial till deposit mM (note: image made with open source mapping application QGIS using Natural Earth and Google Satellite data).
Geotechnics 03 00029 g001
Figure 2. Images taken from the sampling locations of the two glacial tills used in this study: (a) till deposit oM; (b) till deposit mM.
Geotechnics 03 00029 g002
Figure 3. One-dimensional loading or oedometric testing device at Kiel University.
Geotechnics 03 00029 g003
Figure 4. Samples prepared at unsaturated condition inside the consolidation rings for the oedometric testing of (a) oM; (b) mM.
Geotechnics 03 00029 g004
Figure 5. Stress σ—strain ε—time t plots at dry condition for: (a,c) oM; (b,d) mM.
Geotechnics 03 00029 g005
Figure 6. Stress σ—strain ε—time t—gradient of settlement ∇δ plots at dry condition for: (a,c) oM; (b,d) mM (Note: Sub-figures (a,b) are showing plots for the last 3 cycles of loading only).
Geotechnics 03 00029 g006
Figure 7. Stress σ—strain ε—time t plots at unsaturated condition for: (a,c) oM; (b,d) mM.
Geotechnics 03 00029 g007
Figure 8. Stress σ—strain ε—time t—gradient of settlement ∇δ plots at unsaturated condition for (a,c) oM; (b,d) mM (Note: Sub-figures (a,b) are showing plots for the last 3 cycles of loading only).
Geotechnics 03 00029 g008
Figure 9. Stress σ—strain ε—time t plots at saturated condition without swelling tests for: (a,c) oM and (b,d) mM.
Geotechnics 03 00029 g009
Figure 10. Stress σ—strain ε—time t—gradient of settlement ∇δ plots at saturated condition without swelling tests for: (a,c) oM; (b,d) mM (Note: Sub-figures (a,b) are showing plots for the last 3 cycles of loading only).
Geotechnics 03 00029 g010
Figure 11. Spectral analysis of the vertical stress σ versus time t signals of the cyclic mechanical loading tests of the till soils at the three wetting conditions plotted in the form of power spectrum or power P of FFT as a function of frequency f for (a) oM; (b) mM.
Geotechnics 03 00029 g011
Figure 12. Comparison between the stress σ—total strain ε—accumulated plastic strain εp,acc—number of cycles N plots of the two till soils at different wetting conditions: (a,c) oM; (b,d) mM (Note: sub-figures (a,b) are showing stress-strain plots for the loading phase (loading rate of 100 kPa/min) of the first cycle only).
Geotechnics 03 00029 g012
Figure 13. Stress σ—strain ε—time t plots at saturated condition with swelling tests of: (a,c) oM; (b,d) mM.
Geotechnics 03 00029 g013
Figure 14. Stress σ—strain ε—time t—gradient of settlement ∇δ plots at saturated condition with swelling tests of: (a,c) oM; (b,d) mM (Note: Sub-figures (a,b) are showing plots for the last 3 cycles of loading only).
Geotechnics 03 00029 g014
Figure 15. Spectral analysis of the vertical stress σ versus time t signals of the cyclic mechanical loading tests of the till soils with the two saturation methods plotted in the form of power spectrum or power P of FFT as a function of frequency f for (a) oM; (b) mM.
Geotechnics 03 00029 g015
Figure 16. Comparison between the stress σ—total strain ε—accumulated plastic strain εp,acc—number of cycles N plots of the two till soils at saturation processes with- and without- swelling test: (a,c) oM; (b,d) mM (Note: Sub-figures (a,b) are showing stress-strain plots for the loading phase (loading rate of 100 kPa/min) of the first cycle only).
Geotechnics 03 00029 g016
Table 1. Some physical properties of the glacial tills [26].
PropertiesoMmM
Gravel, >2 mm (wt.%)2.854.72
Sand, 0.063–2 mm (wt.%)50.9857.08
Silt, 0.002–0.063 mm (wt.%)43.2037.39
Clay, <0.002 mm (wt.%)2.970.81
Porosity n (−)0.2810.258
Solids specific gravity Gs (−)2.6502.696
Bulk dry density ρd (g cm−3)1.9052.000
Field or natural gravimetric water content wn (%)14.689.52
Lime content (%)6.6712.56
Unified soil classification system (USCS)ML or CL (a)SM or SC (b)
(a): silt or clay of low plasticity, (b): silty or clayey sand.
Table 2. Layout of experimental conditions studied for the cyclic loading of the glacial tills.
ConditionPrior Swelling TestoMmM
DryNow = 0.0056w = 0.0051
UnsaturatedNow = 0.1142w = 0.0871
SaturatedNow = 0.1507w = 0.1295
Yes--
w: gravimetric water content.
Disclaimer/Publisher’s Note: The statements, opinions and data contained in all publications are solely those of the individual author(s) and contributor(s) and not of MDPI and/or the editor(s). MDPI and/or the editor(s) disclaim responsibility for any injury to people or property resulting from any ideas, methods, instructions or products referred to in the content.

