Abstract
This paper provides a review of the present status of the topic dealt with. The contact and non-contact methods used for rock joint roughness measurement are summarized including their salient features, advantages, and disadvantages. A critical review is given of the empirical, statistical, and fractal-based methods used for rock joint roughness quantification identifying their salient features, shortcomings, and strong attributes. The surface topography of rough rock joints is highly erratic. Fractional geometry is better suited than Euclidean geometry in representing highly erratic rock joint surfaces. The influence of non-stationarity on accurate quantification of roughness is discussed. The existence of heterogeneity of natural rock joint roughness and its effect on computed roughness parameters are well illustrated. The controversial findings that have been appearing in the literature on roughness scale effects during the last 40 years have resulted from neglecting the effect of roughness heterogeneity on scale effects. The roughness heterogeneity controls the rock joint roughness scale effect, and it can be either negative, positive, or no scale effect depending on the type and level of the roughness heterogeneity of the rock joint surface. The importance of consideration of the existence of possible anisotropy in the quantification of roughness is well illustrated. The indices available to quantify the level of anisotropy are given. Effects of sampling interval and measurement resolution on the accurate quantification of roughness are discussed. A comparison of results obtained by using different quantification methods is discussed. A few recommendations are given for future research to address the shortcomings that exist on the topic dealt with in the paper.
1. Introduction
Rock joint roughness controls the mechanical properties of rock joints [1,2,3]. Hydraulic properties of rock joints depend on the aperture distribution between the two rough surfaces of the joints [4,5]. The hydro-mechanical behavior of rock joints depends on both the joint roughness and aperture distribution. Therefore, a reliable estimation of mechanical, hydraulic, and hydro-mechanical properties of rock joints requires accurate quantification of joint roughness. Most of the rock masses consist of intact rock and discontinuities such as joints, bedding planes, and faults. Therefore, a reliable estimation of rock mass mechanical and hydraulic properties depends very much on the accurate estimation of rock joint mechanical and hydraulic properties.
The methods available to measure rock joint roughness can be categorized broadly into contact [6,7,8,9,10,11,12,13] and non-contact [3,14,15,16,17,18,19,20,21,22,23,24,25,26,27,28] methods. These measurement methods are summarized in this paper including their salient features, advantages, and disadvantages.
The surface topography of rough rock joints is highly erratic. Therefore, it is difficult to represent rough rock joint surfaces accurately using Euclidean geometry even though it has been used extensively in the rock mechanics/engineering geology literature. The statistical parameters used in the literature for rock joint roughness quantification [8,20,21,29,30,31,32,33,34,35,36] belong to the Euclidean geometry category. Fractional geometry [30,37,38] is better suited than Euclidean geometry in the representation of highly erratic rock joint surfaces. However, because it is more complex than Euclidean geometry, it has been used only by a few researchers in representing rough rock joint surfaces. The fractal-based parameters used for roughness quantification in the literature [17,18,24,39,40,41,42,43,44] belong to the fractional geometry category.
The third category of methods used for roughness quantification is the empirical method. The main metric under the empirical methods is known as the JRC (Joint Roughness Coefficient). The JRC neither belongs to the category of Euclidean geometry nor belongs to fractional geometry. The JRC is usually estimated by comparing a rough surface with Barton’s published ten standard profiles [45]. That means the procedure is visual and highly subjective and can provide results of high variability for the same rough joint. However, credit should be given for developing the JRC as the first roughness parameter. It may be used as a preliminary index of rock joint roughness. However, accurate quantification of roughness through JRC is highly questionable [3,8,15,46,47,48].
The roughness of most of the rock joint surfaces exhibits non-stationarities and significant heterogeneity. However, the majority of the research results appearing in the literature have not considered at all the effects of non-stationarities and heterogeneity in the quantification of rough rock joint surfaces. The aforementioned shortcomings have led to reporting controversial findings on the scale effects of rock joint roughness (roughness properties changing with the joint size) in the rock mechanics/engineering geology literature. The existence of non-stationarities and heterogeneity also leads to the presence of anisotropy of rock joint roughness. The type and level of roughness anisotropy seem to have a relation to the way the rock joints are formed. It is interesting to investigate this aspect. Perfectly smooth horizontal rock joint surfaces have no non-stationarities and heterogeneity. Such surfaces are homogeneous and should exhibit no scale effects and anisotropy. In the presence of non-stationarities and heterogeneity of rough rock joint surfaces, intuitively the values of the quantified roughness metrics should change according to the used measurement resolution and used sampling interval in the quantification procedure. Such results unfortunately appear in the literature. That means for each roughness metric the quantified value is not unique for the same rough surface. This is not a desirable feature. It seems that the variability level of roughness metrics depends on the type of metric. It is important to investigate the effect of the used sampling interval on the variability of each roughness metric.
This paper aims to provide a critical review of the current status of the aspects mentioned in the above paragraphs. A comparison of results obtained by using different quantification methods is discussed. A few recommendations are given for future research to address the shortcomings that exist on the topic dealt with in the paper.
2. Rock Joint Roughness Measurement Techniques
Roughness measurement techniques can be placed in two groups (contact and non-contact methods) depending on whether or not there is actual contact between a profiler and a surface to be measured or between the measuring equipment and the surface of interest.
2.1. Contact Methods
As the name implies, contact methods require real contact with the joint surface to take measurements. Such methods include the linear profiling method [6], straight edges and rulers [49], the compass and disc clinometer method [6], the shadow profilometry method [8], the tangent plane (equilateral tripod) sampling and pin sampling technique [10,50], needle profilometer [48], and mechanical or electronic stylus profilometry [7,9,11,12,51]. The use of traditional contact methods for surface measurements is time-demanding [24]. Additionally, because they normally are unable to capture minute elements of a roughness surface at such small intervals (typically less than 0.5 mm), they are typically not appropriate for roughness measurements of surfaces.
2.2. Non Contact Methods
As opposed to contact methods, non-contact methods do not require physical contact with a rough surface to obtain measurements. They are very accurate compared to contact methods and are generally capable of capturing tiny details (micro-features) on a joint surface at high resolutions. Non-contact methods include laser profilometry [3,17,18,20,25]; structured light techniques, for instance, laser scanning [23,24,36] and stereo topometric cameras [21,27,52]; and close-range photogrammetry [53,54].
3. Rock Joint Roughness Quantification Methods
Roughness is typically quantified using three approaches: empirical, statistical, and fractal. In this section, the aforementioned methods are covered.
3.1. Empirical Methods
Barton and Choubey [45] proposed the Joint Roughness Coefficient (JRC) for quantifying joint roughness. It is fundamental to the Barton–Bandis shear strength criterion [45]. Ten well-known standard profiles were provided by Barton and Choubey [45] for estimating JRC. Moreover, images of ten rock specimens corresponding to the JRC ranges were made available by Barton [55]. JRC has been accepted by the International Society of Rock Mechanics [56] and widely used for estimating roughness over the years. Bandis et al. [2] investigated scale effects associated with rock joint shear behaviour. In the study, JRC was found to decrease with the increasing length of joints. Recognizing the need to account for this negative scale effect associated with JRC, Barton et al. [4] put forward a correction factor for JRC.
The challenges associated with JRC are well documented [3,8,46,48,57,58,59,60]. Alameda-Hernández et al. [48], for instance, demonstrated the subjectivity of obtaining JRC through visual inspection by asking 90 respondents (students and academics in the field of rock mechanics) familiar with Barton’s profiles to assign JRC values to 12 profiles; as expected, for each profile a wide range of JRC values was obtained.
3.2. Statistical Methods
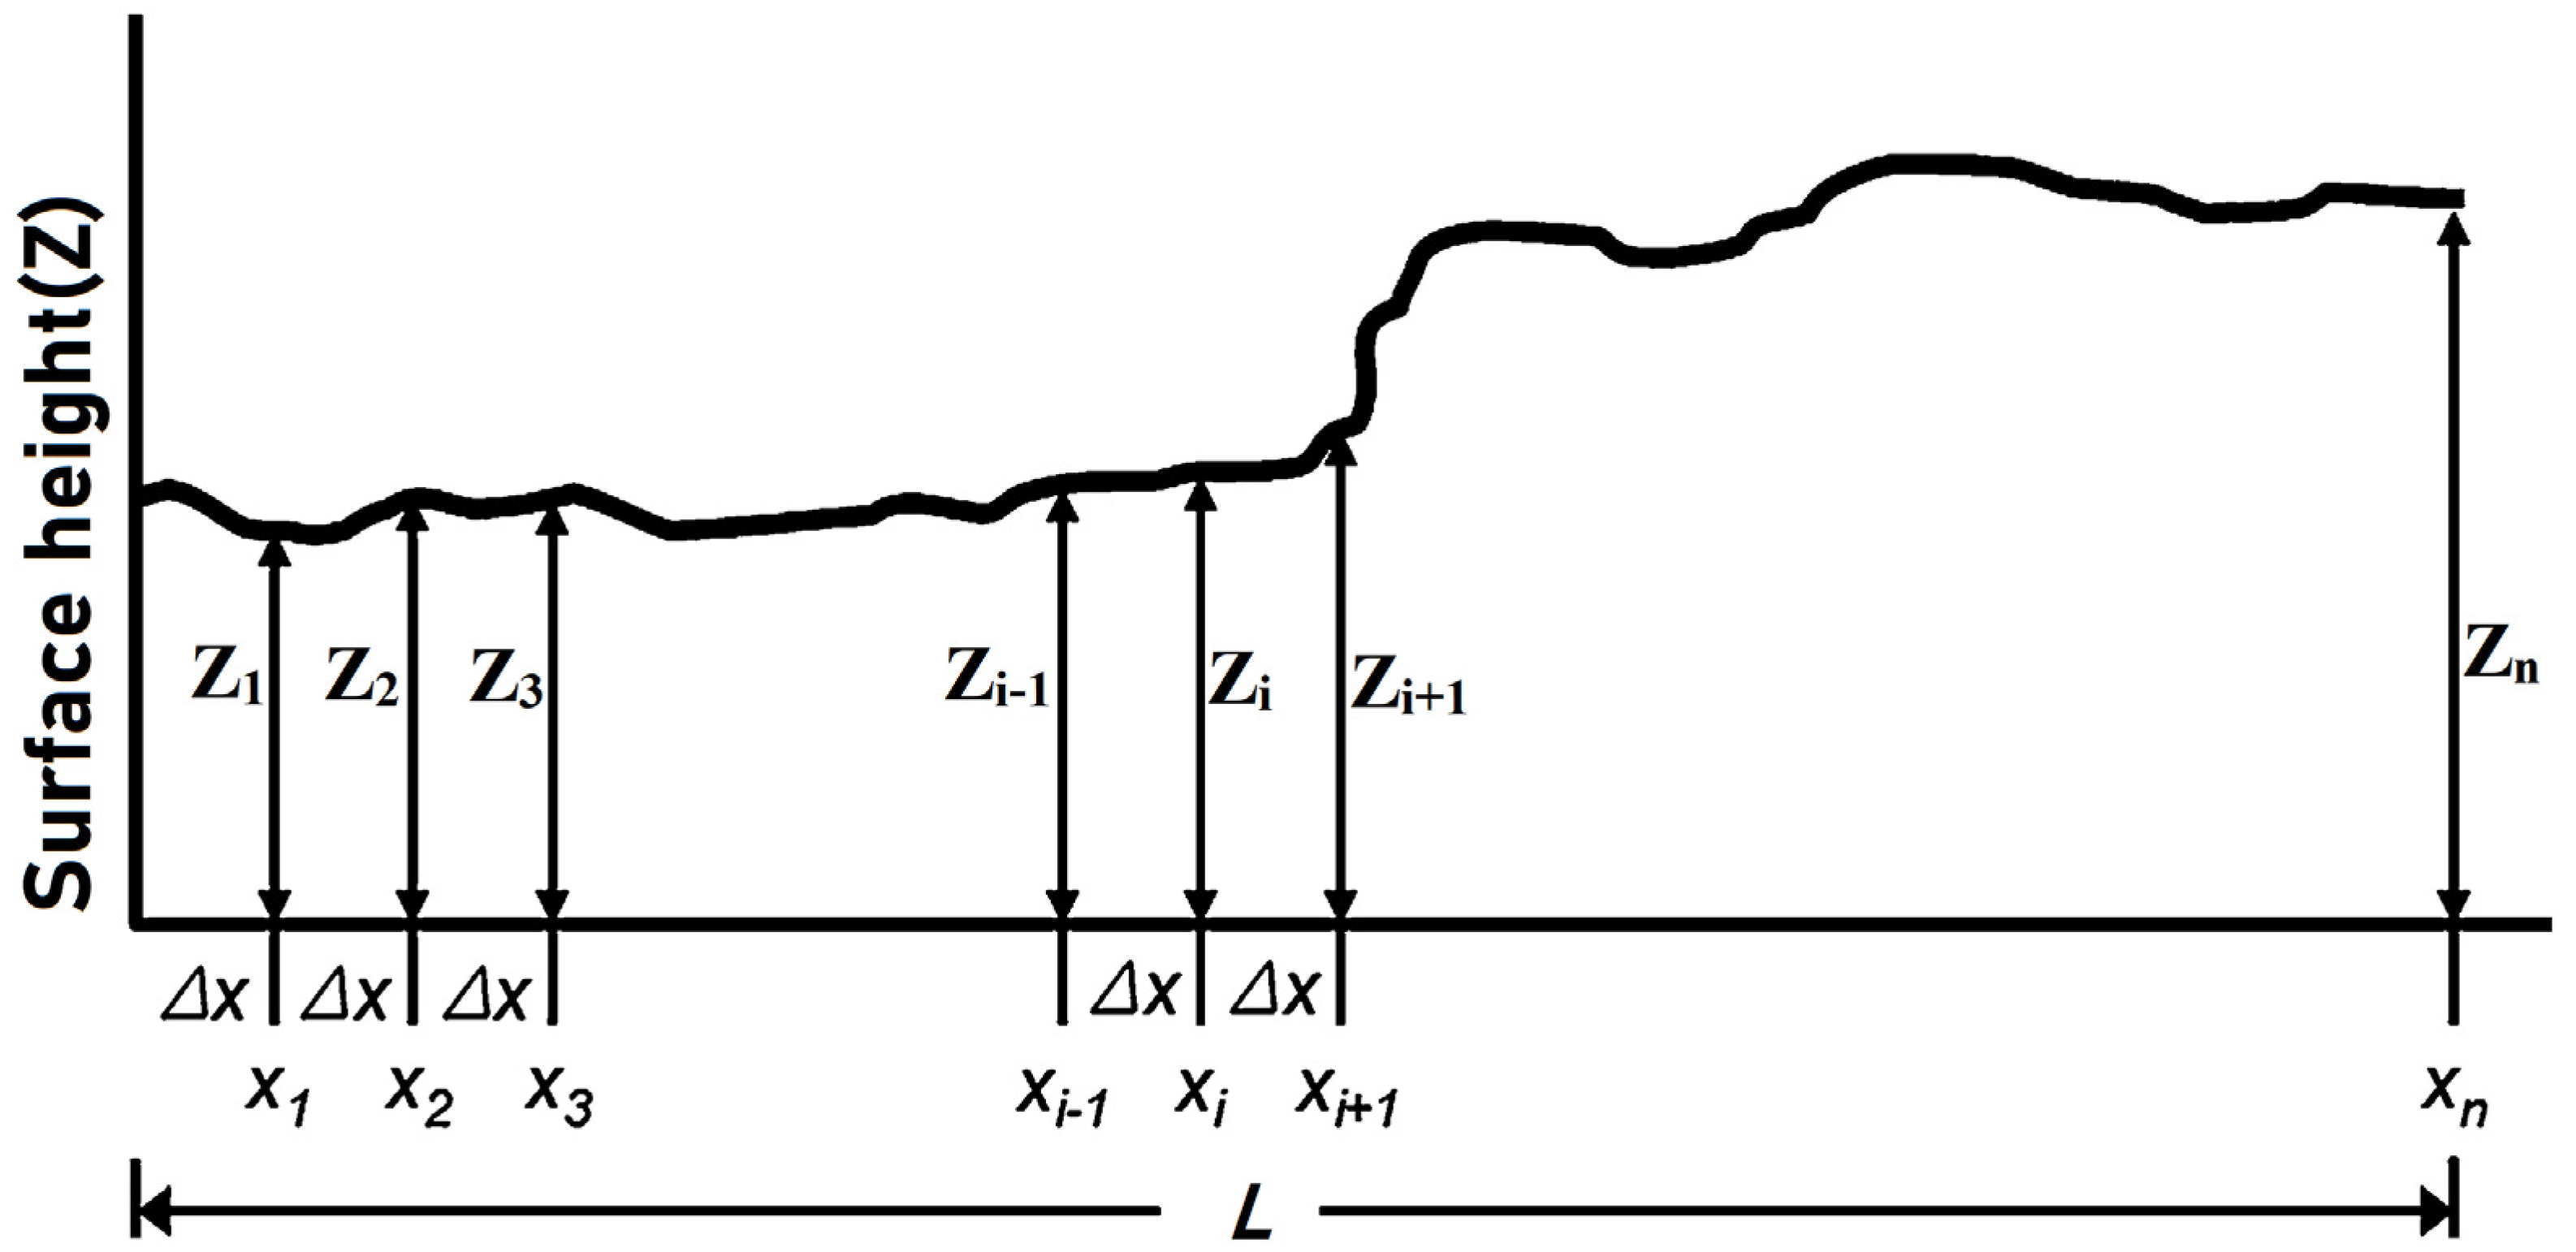
Various 2-D and 3-D statistical metrics have been suggested over the years for quantifying joint roughness (see Table 1). These roughness metrics are defined based on the general features of joint profiles or surfaces. Figure 1 [3,61] illustrates the basic elements of a joint profile that form the basis of defining statistical parameters.

Table 1.
Statistical metrics suggested in the literature to quantify rock joint roughness.
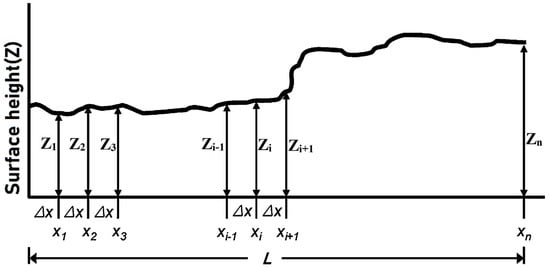
Figure 1.
The basic elements of a used roughness profile to define statistical parameters, after Kulatilake et al. [3].
In Figure 1, is the height of a roughness profile at ; is the distance between and ; L is the profile length; n is the number of measurements on the profile.
Statistical parameters fall into three categories: amplitude-based parameters, slope-based parameters, and combined slope and amplitude-based parameters. The various statistical parameters and their formulae are shown in Table 2.

Table 2.
Statistical parameters and their formulae.
3.2.1. Amplitude-Based Roughness Parameters
Amplitude-based parameters are measures of the amplitude of a roughness profile. Examples include MSV [33], RMS [29,33], and CLA [33]. Based on the idea that the distribution of asperity heights of a joint profile could be regarded as a random occurrence, Tse and Cruden [33] defined MSV by Equation (1). RMS (see Equation (2)) is similar to MSV and can be obtained by taking the square root of MSV. CLA, like MSV and RMS, estimates the mean deviation of asperity heights and is defined by Equation (3).
3.2.2. Slope-Based Roughness Parameters
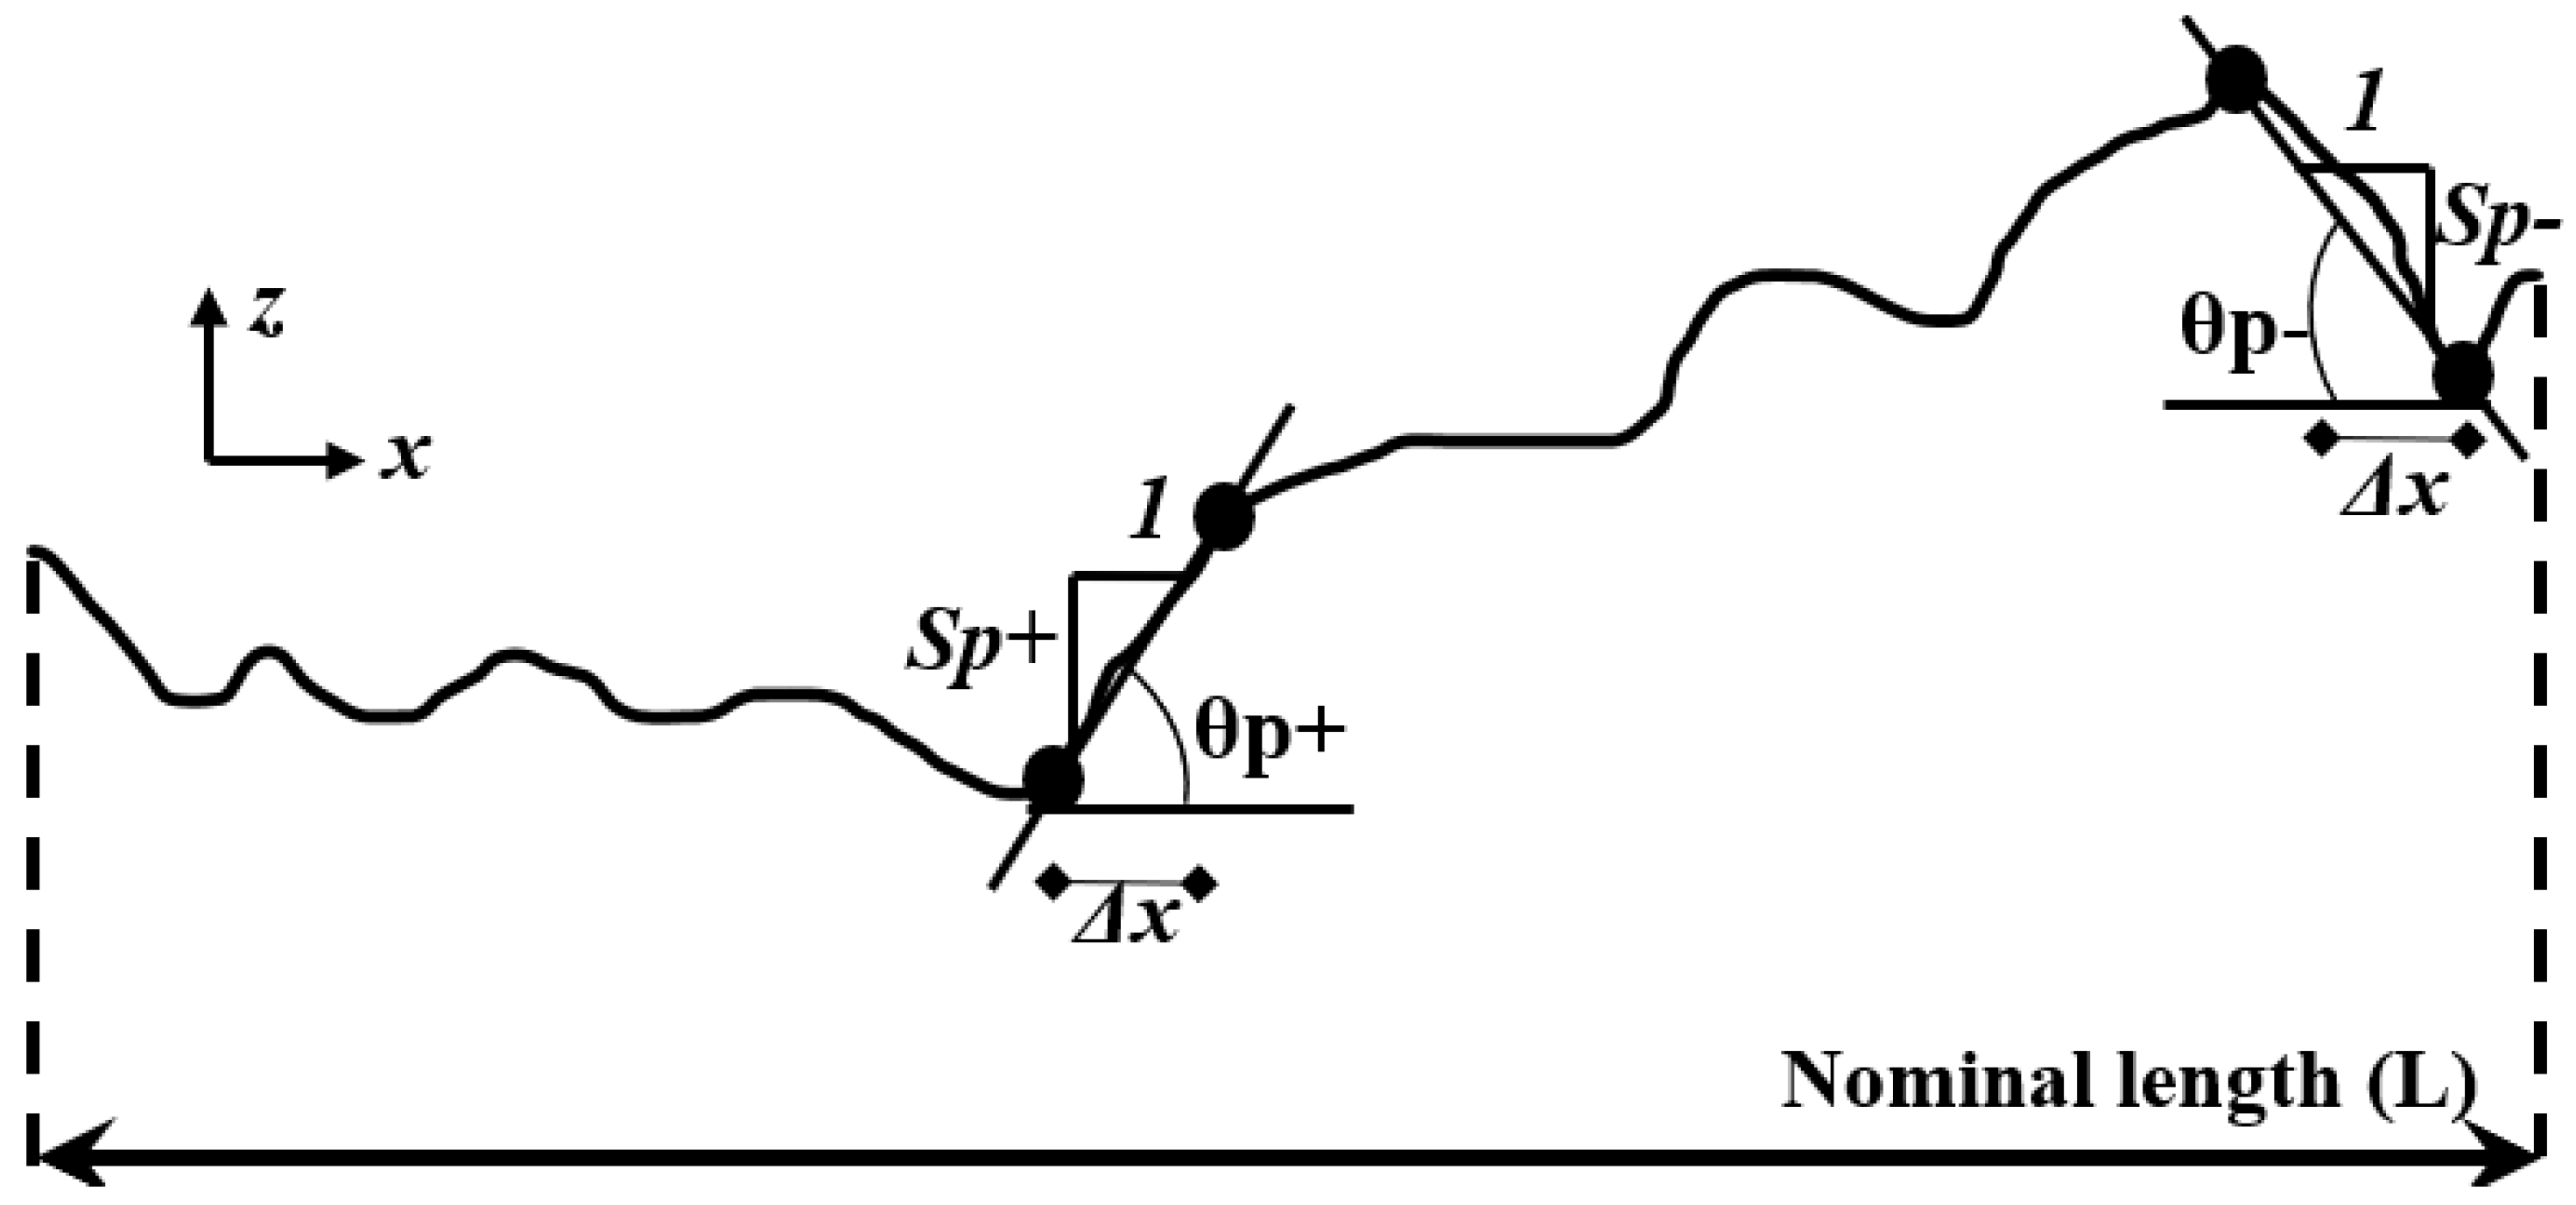
Slope-based parameters are measures of either the slope or spatial variation of the roughness profile or roughness surface. Examples include θP [20], Z2 [29,33,34], Z3 [29,33], SD θP [34], and Z4 [29,33]. θP is calculated based on the mean of both positive and negative slopes of a joint profile according to Equation (4). Belem et al. [20] defined two other parameters, (θP+ and θP−) which are similar to θP. θP+ is calculated based on the mean of positive slopes using Equation (5) while θP− is calculated based on the mean of positive slopes using Equation (6). θP+ and θP− are illustrated in Figure 2. The 3-D version of θP (θs) is obtained using Equation (7). Note that in Equation (7), denotes the true dip angle of the three-dimensional plane of each elementary triangle that constitutes the discontinuity surface.
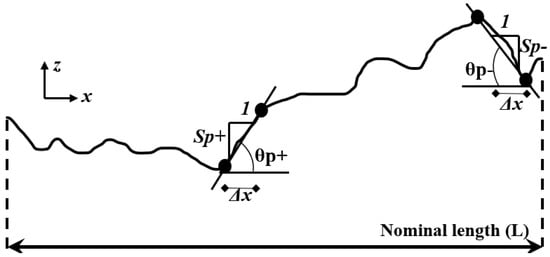
Figure 2.
Slopes and angles in a typical joint profile, after Belem et al. [20].
Z2 (RMS of the slope) is arguably the most widely used statistical parameter because of its strong correlation with JRC; it is calculated using Equation (8). Modified versions of Z2 have been developed and used to quantify roughness in the literature. Kulatilake et al. [3], for example, used an improved version of Z2 referred to as Z’2 to estimate roughness. Another modified version of Z2 (Z’2) was suggested by Zhang et al. [63]. The 3-D version of Z2 is Z2S which is a measure of the slope in the diagonal direction of a surface.
Another widely used parameter, SF, is approximately the square of Z2 and can be calculated using Equation (9). Z3 is the RMS of the second derivative of the slope and is obtained using Equation (10).
The parameter Z4 is unique in that unlike Z2 and Z3, it is not a derivative of the slope. It is based on the actual distance of positive and negative inclinations along a joint profile. Z4 is defined by Equation (11). Z4 is not a good parameter for estimating joint roughness. Taking a saw-toothed rock joint into consideration, distances over which the slope is positive and over which the slope is negative will even out resulting in a Z4 value of zero. This clearly shows the inability of Z4 to accurately quantify roughness.
The parameter SD θP expresses the variability of the mean inclination angle of the profile (θP) or, the variability of the mean positive or negative inclination angles of the profile (θP+, θP−), respectively. SD θP can be obtained using Equation (12).
It is noteworthy that Mo and Li [64] conducted a study in which they reviewed 3-D joint roughness parameters and used a number of them to quantify joint roughness and to estimate JRC; the authors found slope parameters to be better quantifiers of roughness compared to amplitude parameters. This observation aligns with that of Ankah et al. [65] who found that the RMS (amplitude) parameter is not a reliable parameter for estimating the roughness of a joint surface. Note that all the slope and/or slope and amplitude parameters used in Ankah et al. [65] produced consistent results.
3.2.3. Amplitude and Slope-Based Roughness Parameters
This category of parameters includes measures of both the amplitude and slope of a profile or rough surface. Examples include Rp [8,30,34], RS [20,62], TS [20], and the metric θ*Max/[C + 1] [36].
The parameter Rp has been widely used in the literature [36,48,51,66]. It is defined as the ratio of the actual length of a roughness profile (Lt) to its projected length on the horizontal surface (Ln). Rp values range in increasing roughness from 1 to 2 for rock joint surfaces. It is calculated using Equation (13). The 3-D equivalent of Rp is Rs which is defined as the ratio of the actual area of a rough surface to its projected area on the horizontal surface; it can be obtained using Equation (14). The actual area of the joint surface (At) can be gotten by quadrangulation (wireframe) or by triangulation (for example Delaunay) while the nominal area (An) can be directly calculated. Similar to Rp, Rs ranges in value from 1 to 2. An Rs value of 1 implies that the joint surface is completely flat and smooth [20]. In effect, the closer the Rs value is to 1, the smoother the joint surface is, and the closer it is to the mean plane and vice versa. The relative advantage Rp (directional metric) holds over Rs (surface metric) is that it is suitable for investigating anisotropy while Rs is not. Three other roughness parameters derived from Rs are the specific roughness surface (SRs), the degree of relative surface roughness (DRr), and the degree of surface roughness degradation (Dw) [67]. SRs was suggested for estimating the evolution of the joint surface as shearing progresses. It ranges in increasing surface roughness from zero to one. DRw, defined as the ratio of SRs to Rs, estimates the potential evolution of the joint surface roughness from the very first state of the surface. Dw, on the other hand, is a measure of the extent to which surface roughness is degraded as a result of shearing.
The statistical parameter Ts is defined as the ratio of the actual area of the joint surface (At) to the area of the surface formed by the four outermost points on the joint surface (Ap). It can be obtained from Equation (15a). Ts is related to Rs by Equations (14) and (15). The ranges of Ts and are and respectively. can be obtained by fitting a mean plane to the four outermost points on the joint surface through least square regression. When the value of Ts equals 1, Rs is either greater than 1, in which case the surface is rough or both Rs and values are 1 implying that the joint surface is completely smooth and flat [20].
Grasselli et al. [21] proposed a 3-D parameter, θ*Max/C, for quantifying anisotropic roughness. According to the study, the parameter was premised on the theory that during shearing, contact only occurs on the triangular elements which are parallel to or face the shear direction. The parameter was therefore designed such that at specific threshold values (inclinations), potential damage zones will be those areas with triangular elements inclined steeper than the threshold value; triangular elements whose inclinations are of the same value as the threshold will only be in contact with no damage. The parameter, therefore, relies on apparent dip angles (θ*), potential contact areas (Aθ*), and a fitting parameter (C). In 2009, θ*Max/C was modified into θ*Max/[C + 1]3D [52] to avoid a situation where C has a value of zero and the parameter value becomes undefined (see Equation (16)). Tatone and Grasselli [52] provided an elaborate procedure for quantifying 3-D roughness using θ*Max/[C + 1]3D. For an explanation of the computational procedure, the reader is also referred to Ankah et al. [65]. In 2010, Tatone and Grasselli [35] developed a 2-D version of the aforesaid metric.
It is interesting to note that Liu et al. [68] claimed that θ*Max/[C + 1]3D might not accurately estimate roughness; according to their paper, when they used the roughness indices reported by Grasselli [69], based on θ*Max/[C + 1]3D, to calculate peak shear strengths and JRC, they got results which seemed to show that θ*Max/[C + 1]3D might not have accurately quantified roughness. They, therefore, suggested modifications to θ*Max/[C + 1]3D.
3.2.4. Relations between JRC and Statistical Parameters
In light of the many challenges associated with the original JRC, some researchers have attempted to remedy this situation by resorting to the use of statistical parameters to quantify the roughness of joint surfaces. Some researchers have also sought to find objective and better ways of estimating JRC; such studies usually involved the use of statistical parameters. In this context, many empirical relations have been documented in the literature relating JRC to the same statistical parameters. Li and Zhang [70] for instance, listed as many as forty-seven different empirical relations relating JRC to various statistical parameters in the literature; a majority (19) of these relations were between JRC and Z2. It is interesting to note that Li and Zhang [70] suggested fifteen new empirical relations in their work. Thus, there are 62 empirical relations in all that relate JRC to statistical parameters in the aforementioned study alone. Some of these empirical relations relating JRC to statistical parameters are shown in Table 3. This places researchers in a difficult position as they are unable to objectively ascertain which of these relations is appropriate for accurately quantifying joint roughness. Jang et al. [61] attested to this by reporting that they obtained varying JRC values when they used some of the empirical relations available in the literature to estimate JRC. Another major drawback of most of these empirical relations is they do not satisfy the condition of JRC = 0 for a smooth joint. As an example, Z2 should be zero for a smooth joint. When Z2 equals zero is substituted for empirical relations 1 through 8 they do not produce JRC equals zero. Similar shortcomings exist with empirical relations 10 through 19. That means the reliability of these empirical relations is highly questionable.

Table 3.
Some relations between JRC and Statistical parameters appear in the literature.
3.3. Fractals-Based Methods
Two types of fractals exist: (a) self-similar and (b) self-affine. The statistical properties of self-similar fractals do not change by various magnifications of viewing. In other words, the self-similar fractals provide scale-invariant values. To preserve statistical similarity, the self-affine fractals need to be scaled differently in different directions. Russ [38] stated that a section taken at any orientation other than parallel to the mean surface orientation would result in a self-affine object. Therefore, it is incorrect to consider natural rock joint profiles to be self-similar as treated by some investigators in the literature. Rock joint profiles should be treated as self-affine profiles. Self-similar techniques such as the original divider and original box-counting [37] methods provide accurate results only for self-similar objects. These techniques have produced erroneous fractal dimension values by applying those to self-affine rock joint profiles. Such erroneous results even appear in rock mechanics/engineering geology journals. The reasons for these erroneous results are explained in detail by Kulatilake et al. [17]. The original divider method has been modified to obtain correct fractal dimension values for self-affine profiles. This modified method is known as the modified two-dimensional (2D) divider method [73]. Kulatilake et al. [17] extended this modified 2D divider method to three dimensions (3D) and calculated the fractal dimension as well as another fractal parameter which is a measure of the amplitude of roughness for a few natural rock joint surfaces. For details of the calculation procedure, the reader is referred to Kulatilake et al. [17] or Ankah et al. [43]. This modified 3D divider method has been further applied in computing accurate fractal parameter values for several natural rock joint surfaces [24,43].
The variogram [74], spectral [75], and roughness length [76] methods have been identified as potential methods to quantify self-affine fractals. These three methods, which are based on self-affine fractals, have been used to quantify rock joint roughness [3,7,14,17,18,24,25,39,41,42,43,77,78,79,80]. To compute fractal parameters, each of these three methods uses an input parameter in a range of scales rather than one value. On the other hand, all the statistical parameters just use one input parameter value in quantifying rock joint roughness. Unfortunately, the results differ significantly based on the values used for the input parameter. Therefore, unique results are not possible through the use of statistical parameters. For fractal parameters too, the computed values may change based on the ranges of scales used for the input parameters; however, within each range of scale, the computed values are the same. Therefore, the changes resulting from using fractal parameters are much less compared to the changes resulting from using statistical parameters when the results are compared within the same range of scales for the two types of methods. Therefore, the roughness quantification results obtained through the self-affine techniques are superior to those obtained through statistical parameters.
In using fractal methods, some researchers have computed only the fractal dimension. A few researchers [14,39,41,42,46,77,81] have shown clearly that the fractal dimension itself is not sufficient to quantify rock joint roughness. Only the spatial variation of a profile is captured by the fractal dimension. In addition to the fractal dimension, another parameter is needed to capture the amplitude of a roughness profile [3]. Note that all the aforementioned self-affine techniques can compute the fractal dimension and another fractal parameter which is a measure of the amplitude of the roughness profile.
The fractal parameters computed by the aforementioned self-affine techniques may depend significantly on the input parameter values used in those methods as well as on the profile parameters such as the stationary/non-stationary nature of the profile, data density of the profile (the number of data per unit length), and profile length. After performing extensive investigations on the effect of input parameter values and profile parameter values on the computed fractal parameters, refined procedures have been suggested in the literature to quantify natural rock joint roughness accurately through the spectral [39], variogram [41], and roughness length [42] methods. These papers indicate that the input parameter values need to be chosen in a narrow range to obtain accurate fractal parameter estimates. That means accurate quantification of rock joint roughness using self-affine methods is not a trivial exercise. Some researchers have applied self-affine techniques without following these guidelines. Those have ended up with controversial findings. The suggested range of scale for each self-affine technique may have a connection to the self-similar scale of the rock joint profile or the surface. By using such a range of scale a possibility exists to obtain just one set of fractal parameter values using each of the self-affine techniques rather than ending up with a different set of results using different ranges of scale. For details of the calculation procedures for the roughness length method, the reader is referred to Kulatilake et al. [81] or Ankah et al. [43]. For details of the calculation procedures for the variogram method, the reader is referred to Kulatilake et al. [17] or Ankah et al. [43]. Several example applications of the said refined procedures of self-affine techniques to natural rough rock joints can be found in [17,80], Ge et al. [24], and Ankah et al. [43].
4. Effect of Non-Stationarity on Computed Roughness Parameters
The profiles that satisfy the following properties are known as second-order stationary profiles: (a) the mean surface height is a constant irrespective of the spatial location; (b) the variance of the surface height around the mean surface is a constant irrespective of the spatial location; (c) the covariance function of the surface height depends only on the lag distance irrespective of the spatial location. The profiles that do not satisfy at least one of the above three criteria are termed non-stationary profiles. Both stationary and non-stationary features exist on rock joint surfaces [3,17,24,36,43,65,80,82,83]. In the literature, little attention has been given to investigating the effect of non-stationarity on computed roughness parameters. At the lowest level, the non-stationarity arises due to the presence of an inclination or a declination of a rock joint roughness profile. Kulatilake et al. [3] incorporated the effect of non-stationary and stationary components in roughness in developing an anisotropic peak shear strength criterion for rough rock joints. The non-stationary roughness was represented by the average inclination angle along the direction of roughness measurement. The stationary roughness was quantified using two fractal parameters. Ge et al. [84] have observed the non-stationary effect to increase with the inclination angle. To make computed stationary roughness parameter results more reliable, it is necessary to remove the non-stationary features of rock joint profiles [36,81,83].
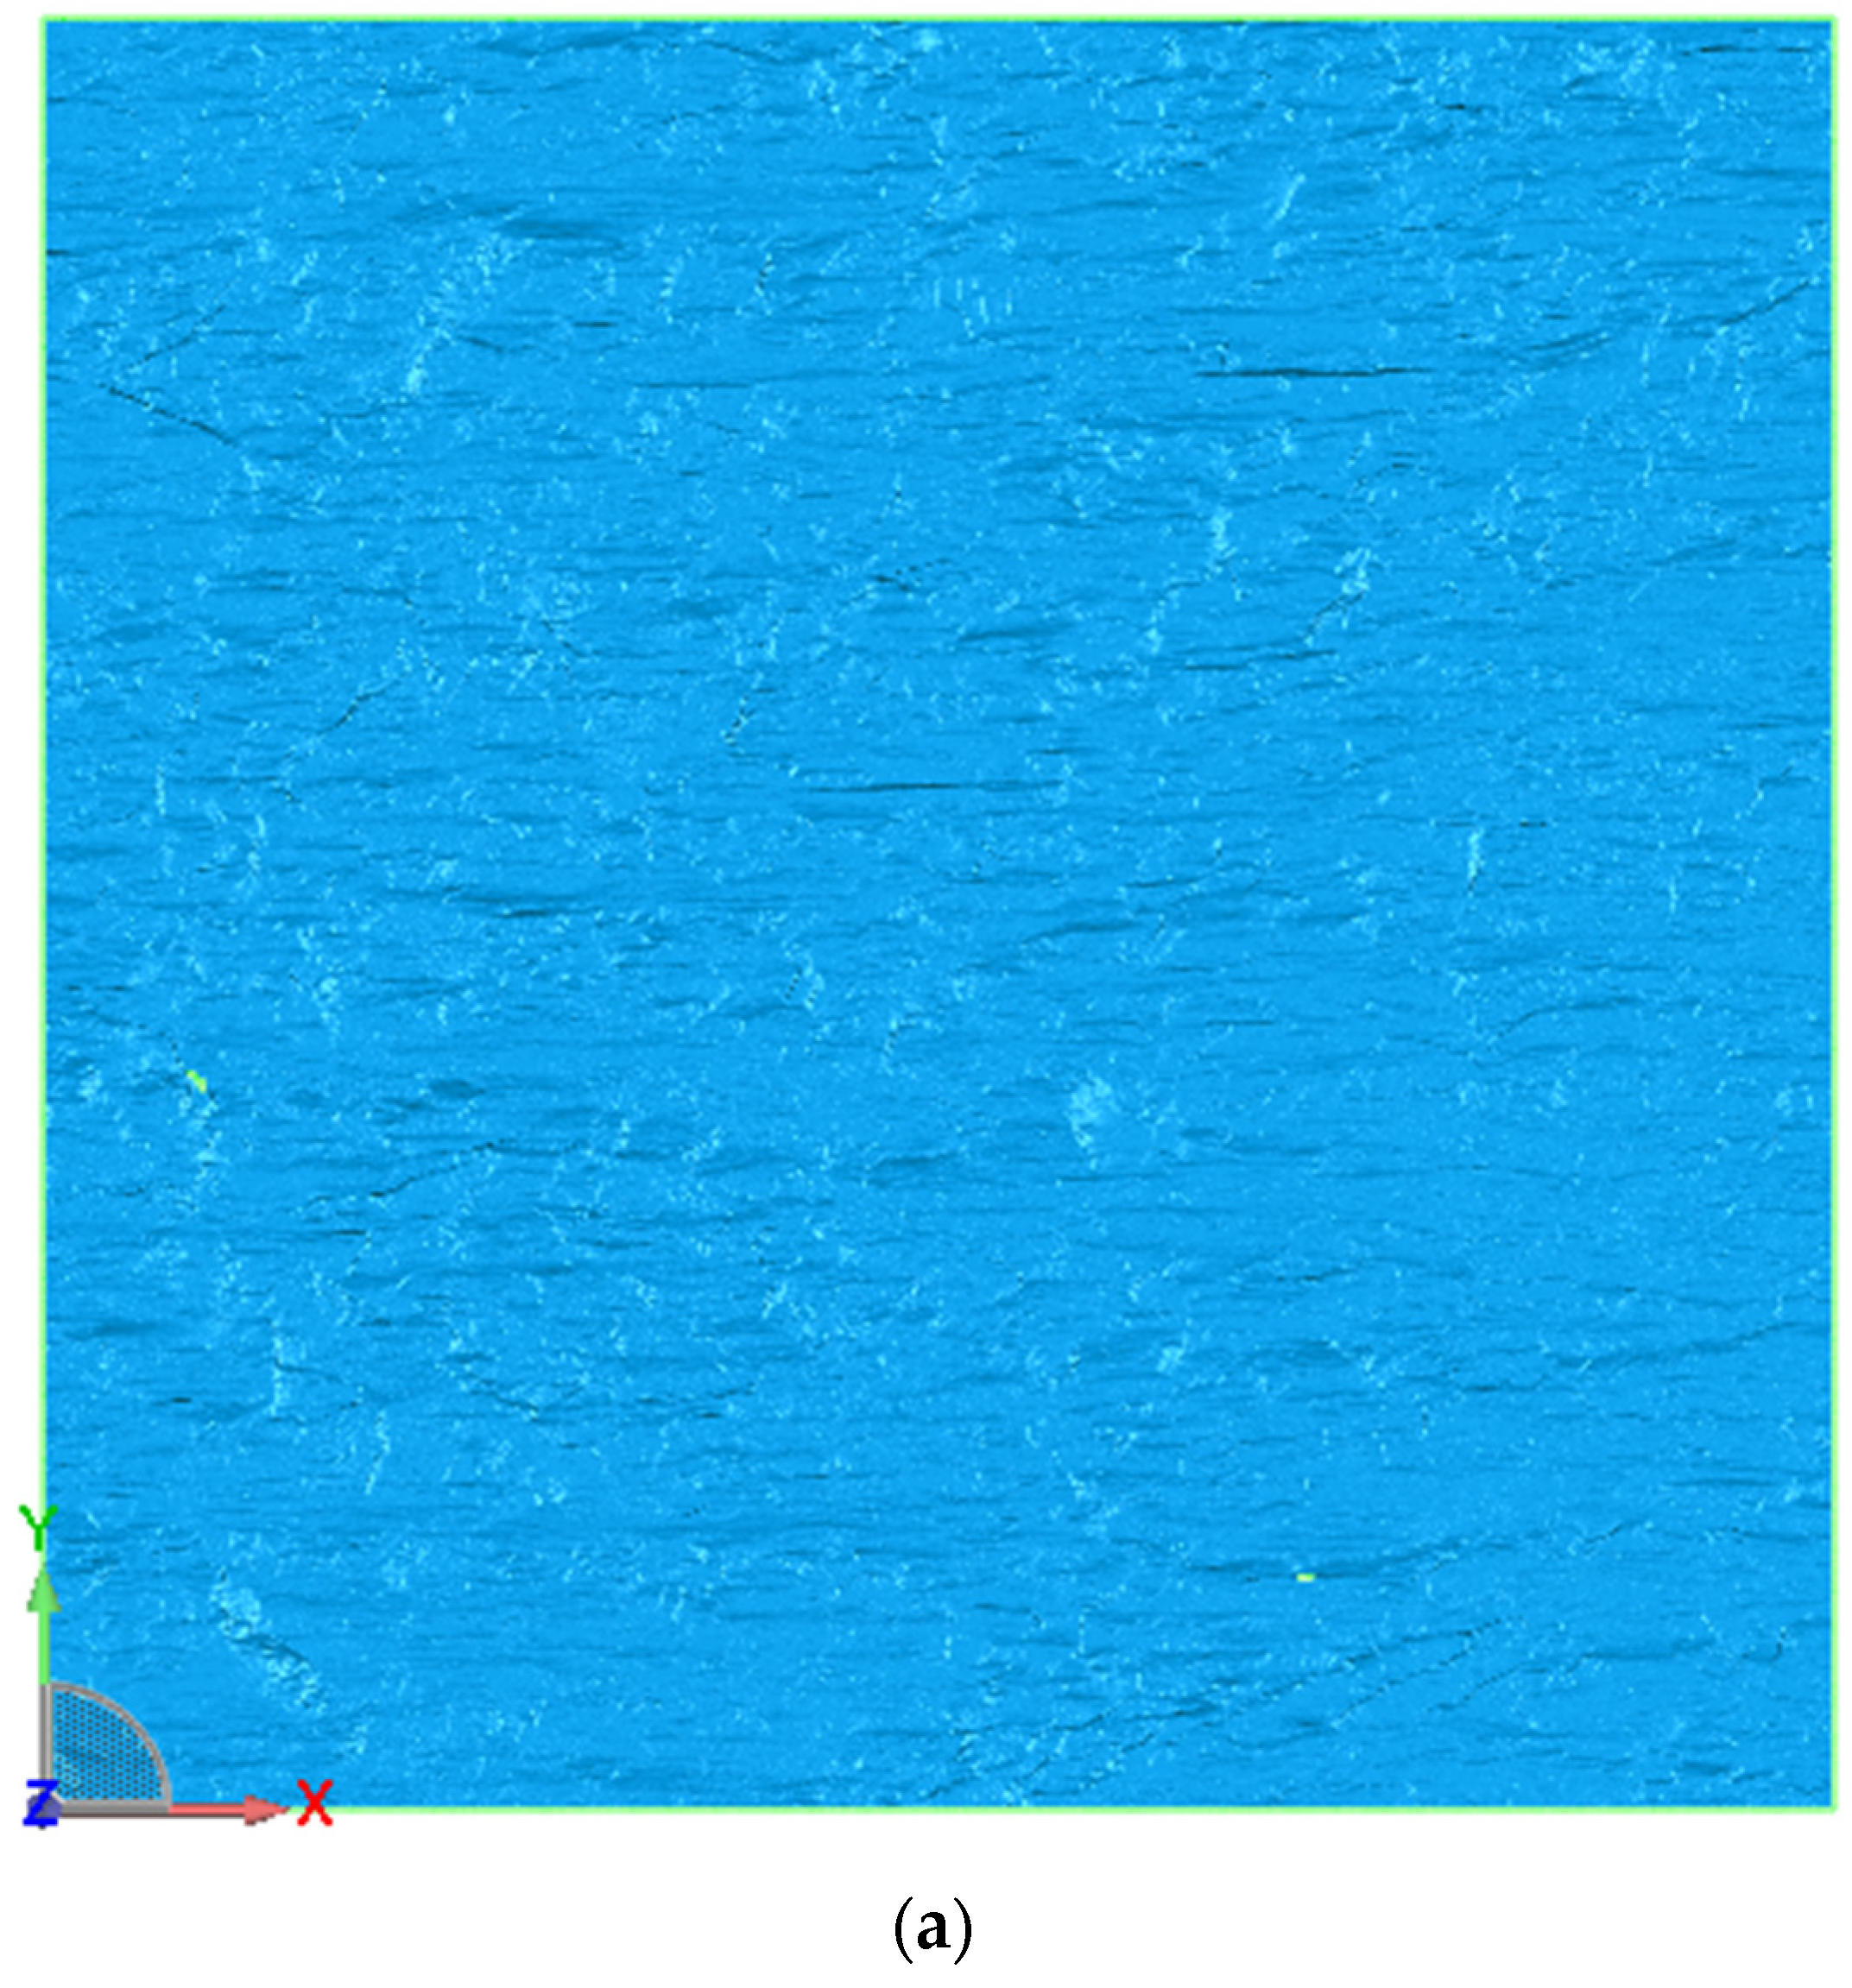
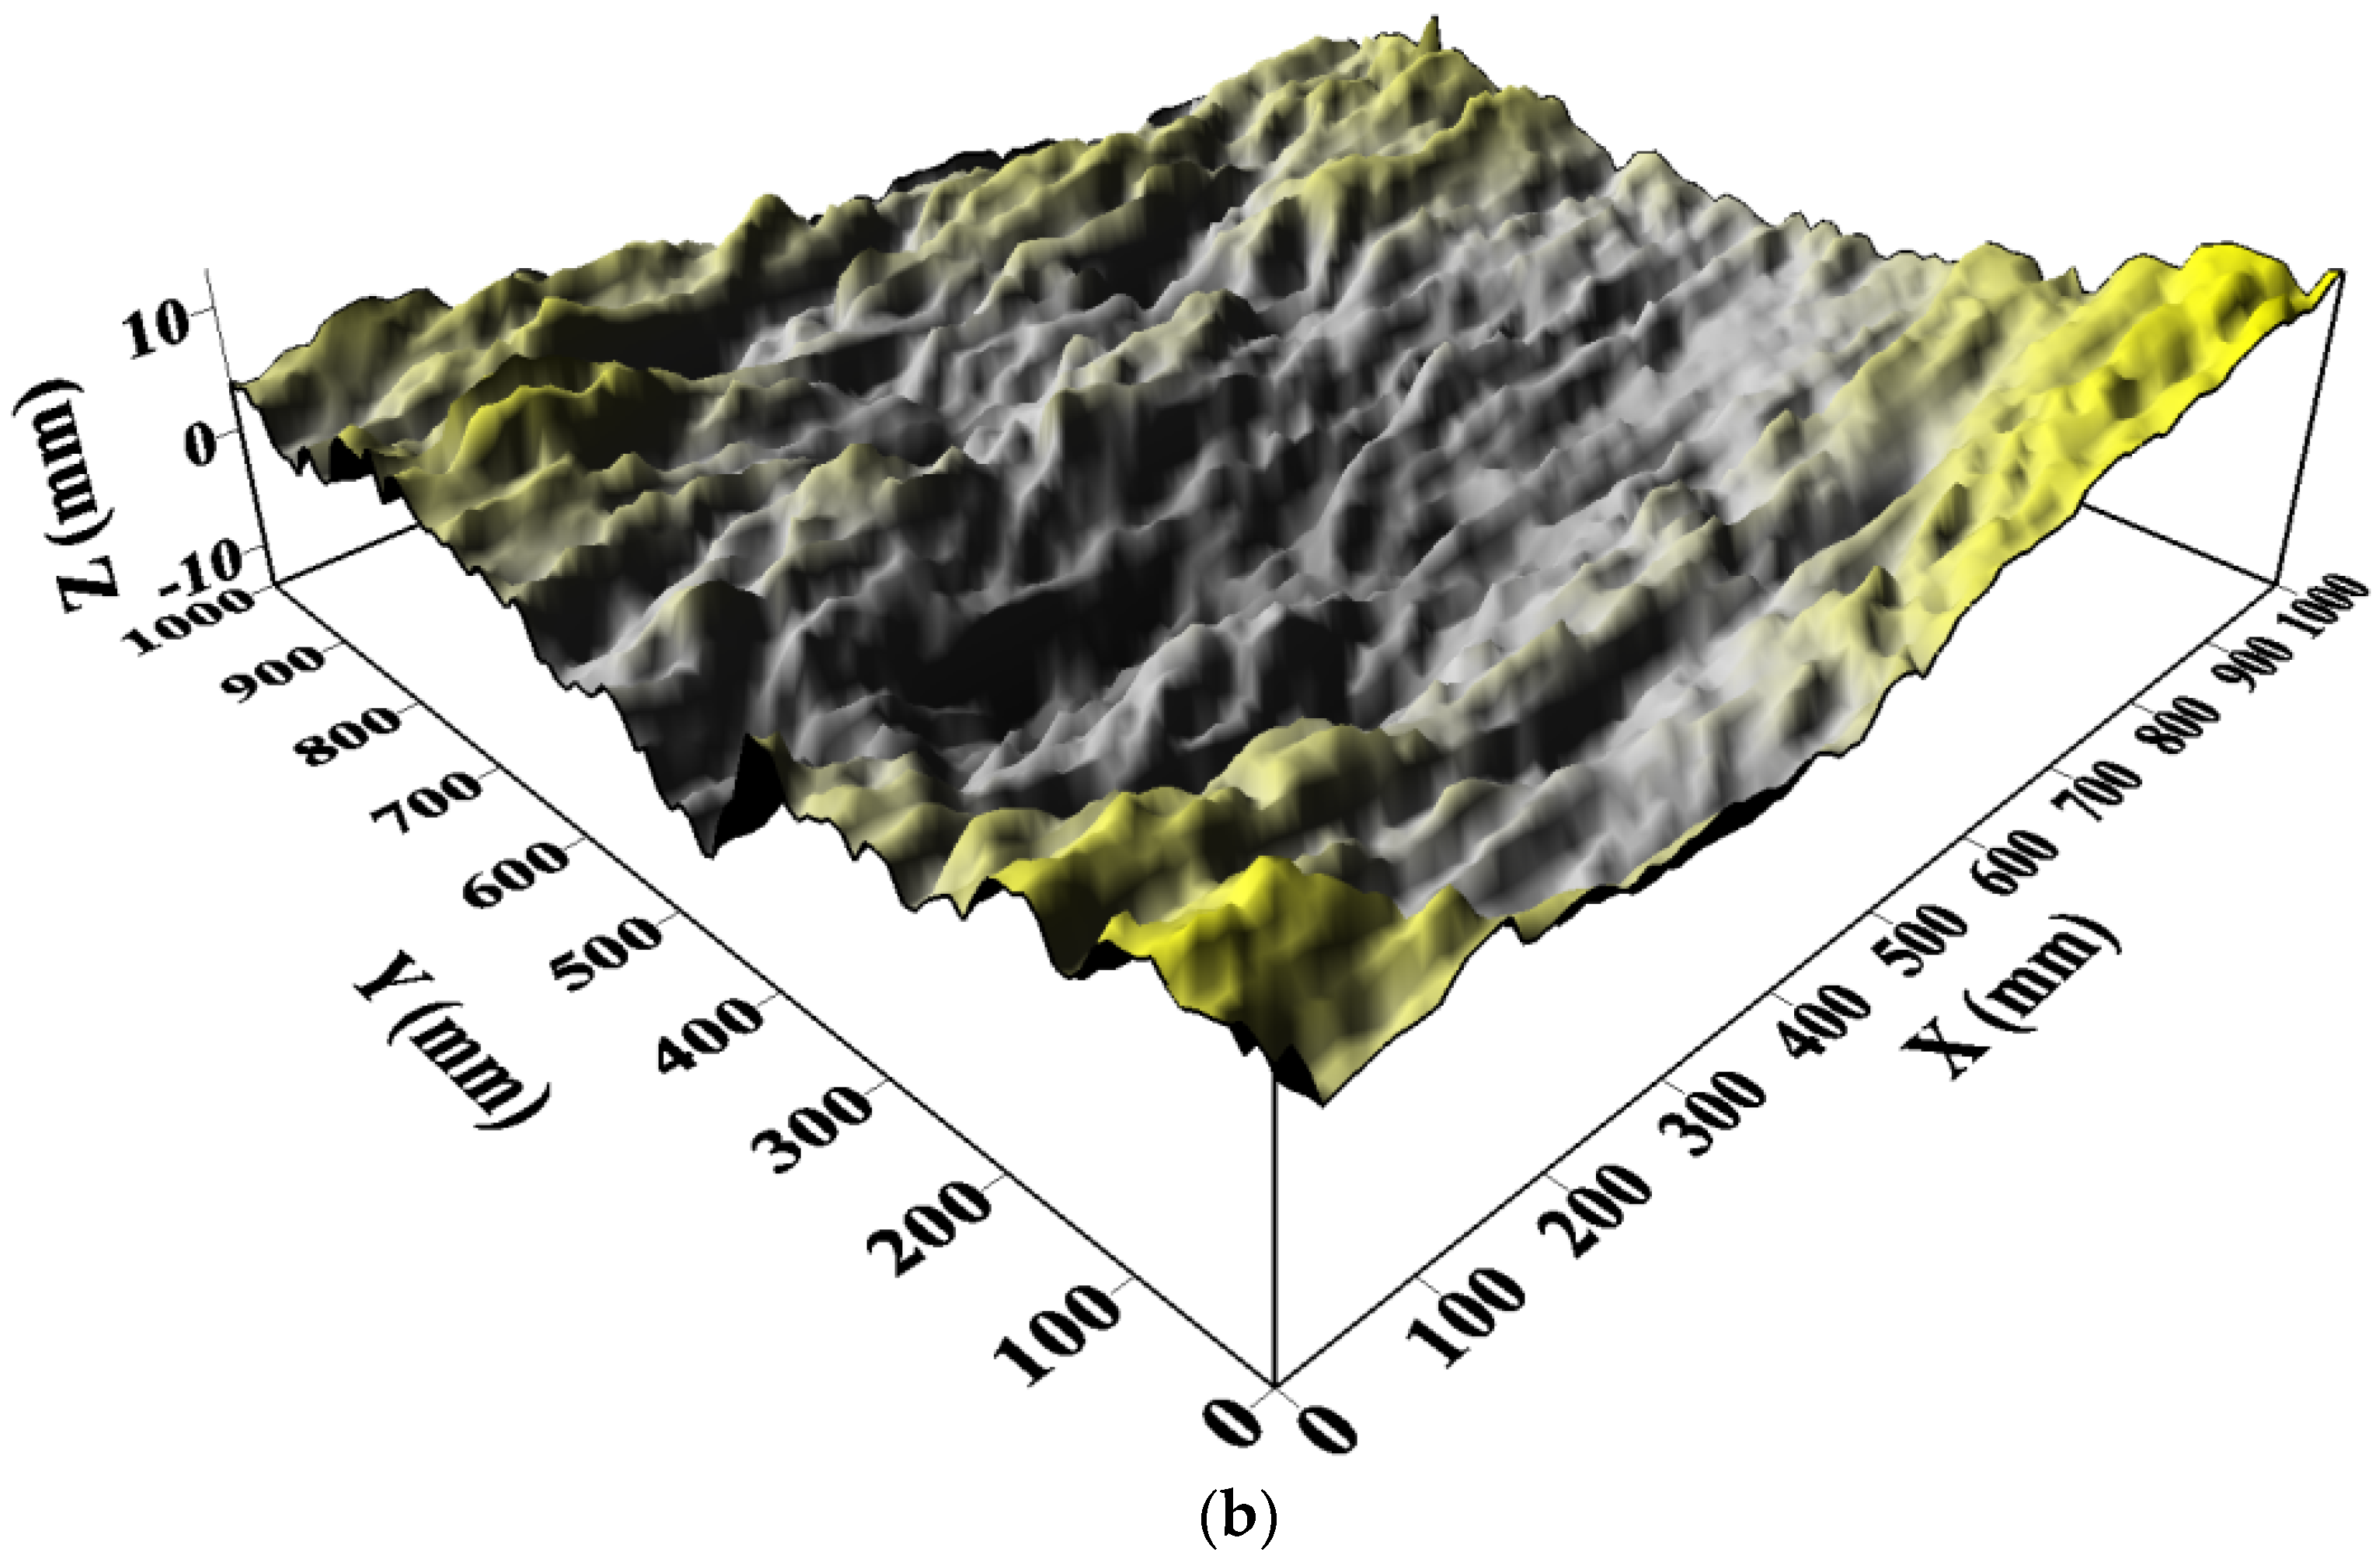
Recently, Kulatilake et al. [80] and Ankah et al. [43,65] performed a large number of roughness computations on a 1 m square rock joint to investigate the effect of non-stationarity on computed roughness parameters. The used rock joint surface is shown in Figure 3. Figure 3b shows the highly erratic nature and the roughness heterogeneity of the rough rock joint surface. The roughness computations have been performed using statistical parameters on raw roughness data as well as on residual roughness data after removing the first-order non-stationary features using regression analysis. The amplitude roughness parameters such as the mean square value (MSV) and root mean square (RMS) value have exhibited significant sensitivity to the presence of first-order non-stationary features. That means it indicated that the removal of non-stationary features is needed to obtain correct results in using amplitude roughness parameters. Slope-related roughness parameters such as the θP, θP−, θP+, θS, I, and θA automatically remove the linear trend or the first-order non-stationarity. Therefore, theoretically, the accuracy of slope-related roughness parameters should not be affected by the presence of a linear trend in the roughness profile. The numerator of the RP parameter is a length measurement along the roughness profile. The denominator of the RP parameter is the horizontal length of the roughness profile. Both these components are not affected by the presence of a non-stationary feature in the roughness profile. Therefore, the RP parameter is not affected by the presence of a non-stationary feature in the roughness profile. By the same token, the modified 2D divider fractal parameters should not be affected by the presence of a non-stationary feature of the roughness profile. The numerator of the RS parameter is an area measurement along the rough surface. The denominator of the RS parameter is the horizontal area of the rough surface. Both these components are not affected by the presence of a non-stationary feature on the rough surface. Therefore, the RS parameter is not affected by the presence of a non-stationary feature in the rough surface. By the same token, the modified 3D divider fractal parameters should not be affected by the presence of a non-stationary feature of the rough surface. Tatone and Grasselli’s 2D roughness parameter [35] is a combined measure of the slope and the actual length of the roughness profile. Tatone and Grasselli’s 3D roughness parameter [36] is a combined measure of the slope and the actual area of the rough surface. Therefore, both these parameters should not get affected by the presence of a linear trend of the rough surface. Variogram and roughness length methods automatically remove the first-order non-stationary roughness. Therefore, the fractal parameters obtained through the variogram and roughness length methods do not get affected by the presence of first-order non-stationary roughness. The results of Kulatilake et al. [80] and Ankah et al. [43,65] have confirmed the aforementioned statements made through intuition. However, it is not possible to say how some of the aforementioned parameters respond to the presence of a second-order non-stationarity feature.

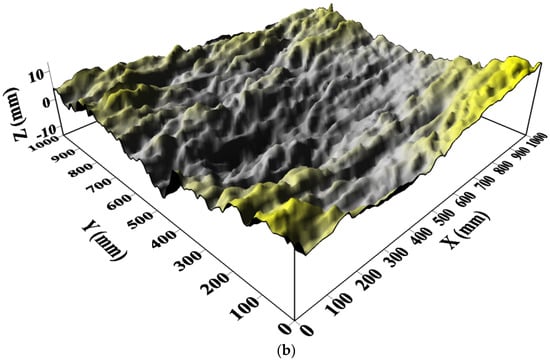
Figure 3.
The visual roughness of the 1 m × 1 m joint surface: (a) a scanned image of the joint surface, (b) the digitized joint surface with roughness exaggerated by 10 times approximately to show the highly erratic roughness spatial variation, after [43,65].
5. Effect of Heterogeneity on Computed Roughness Parameters
In roughness quantification, almost no attention has been paid to investigating roughness heterogeneity until very recently. Statements made on scale effects without giving proper consideration for roughness heterogeneity have led to controversial conclusions in the literature for nearly 40 years. That will be addressed in Section 6. This section is focused on showing the existence of roughness heterogeneity of rock joints and its effect on computed roughness parameters.
Recently, Ankah et al. [65] have performed a large number of roughness computations on a 1 m square rock joint to investigate the effect of roughness heterogeneity on several statistical 2D and 3D roughness parameters.
In the investigation of 2D statistical roughness parameters, computations have been conducted on roughness profiles selected in two perpendicular directions, X and Y (on Z-X profiles and Z-Y profiles). For 2D statistical parameters, a part of the obtained results are given in Table 4 and Table 5, respectively, for the following two sets: (a) eight cases of one hundred and one 125 mm Z-Y profiles (0–125 mm, 125–250 mm, 250–375 mm, 375–500 mm, 500–625 mm, 625–750 mm, 750–875 mm, and 875–1000 mm sections) spaced at 10 mm in the X direction; (b) eight cases of fifty-one 125 mm Z-X profiles (0–125 mm, 125–250 mm, 250–375 mm, 375–500 mm, 500–625 mm, 625–750 mm, 750–875 mm, and 875–1000 mm sections) spaced at 20 mm in the Y direction. A comparison of the results between Table 4 and Table 5 shows that the level of roughness and heterogeneity of the Z-Y profiles is higher than that of the Z-X profiles. For 125 mm Z-Y profiles, the highest and the second-highest values for the statistical parameters appear for the 750–875 mm and 875–1000 mm sections, respectively. The values obtained for the aforementioned roughness parameters for those two sections are significantly higher than that given for the rest of the 125 mm sections for Z-Y profiles. Therefore, the aforementioned observations imply that irrespective of the X values, the 0–750 mm section in the Y direction may be considered relatively homogeneous out of the whole rock joint.

Table 4.
Influence of heterogeneity on 2D statistical parameter results (Z-Y profiles) (after [65]).

Table 5.
Influence of heterogeneity on 2-D statistical parameter results (Z-X profiles) (after [65]).
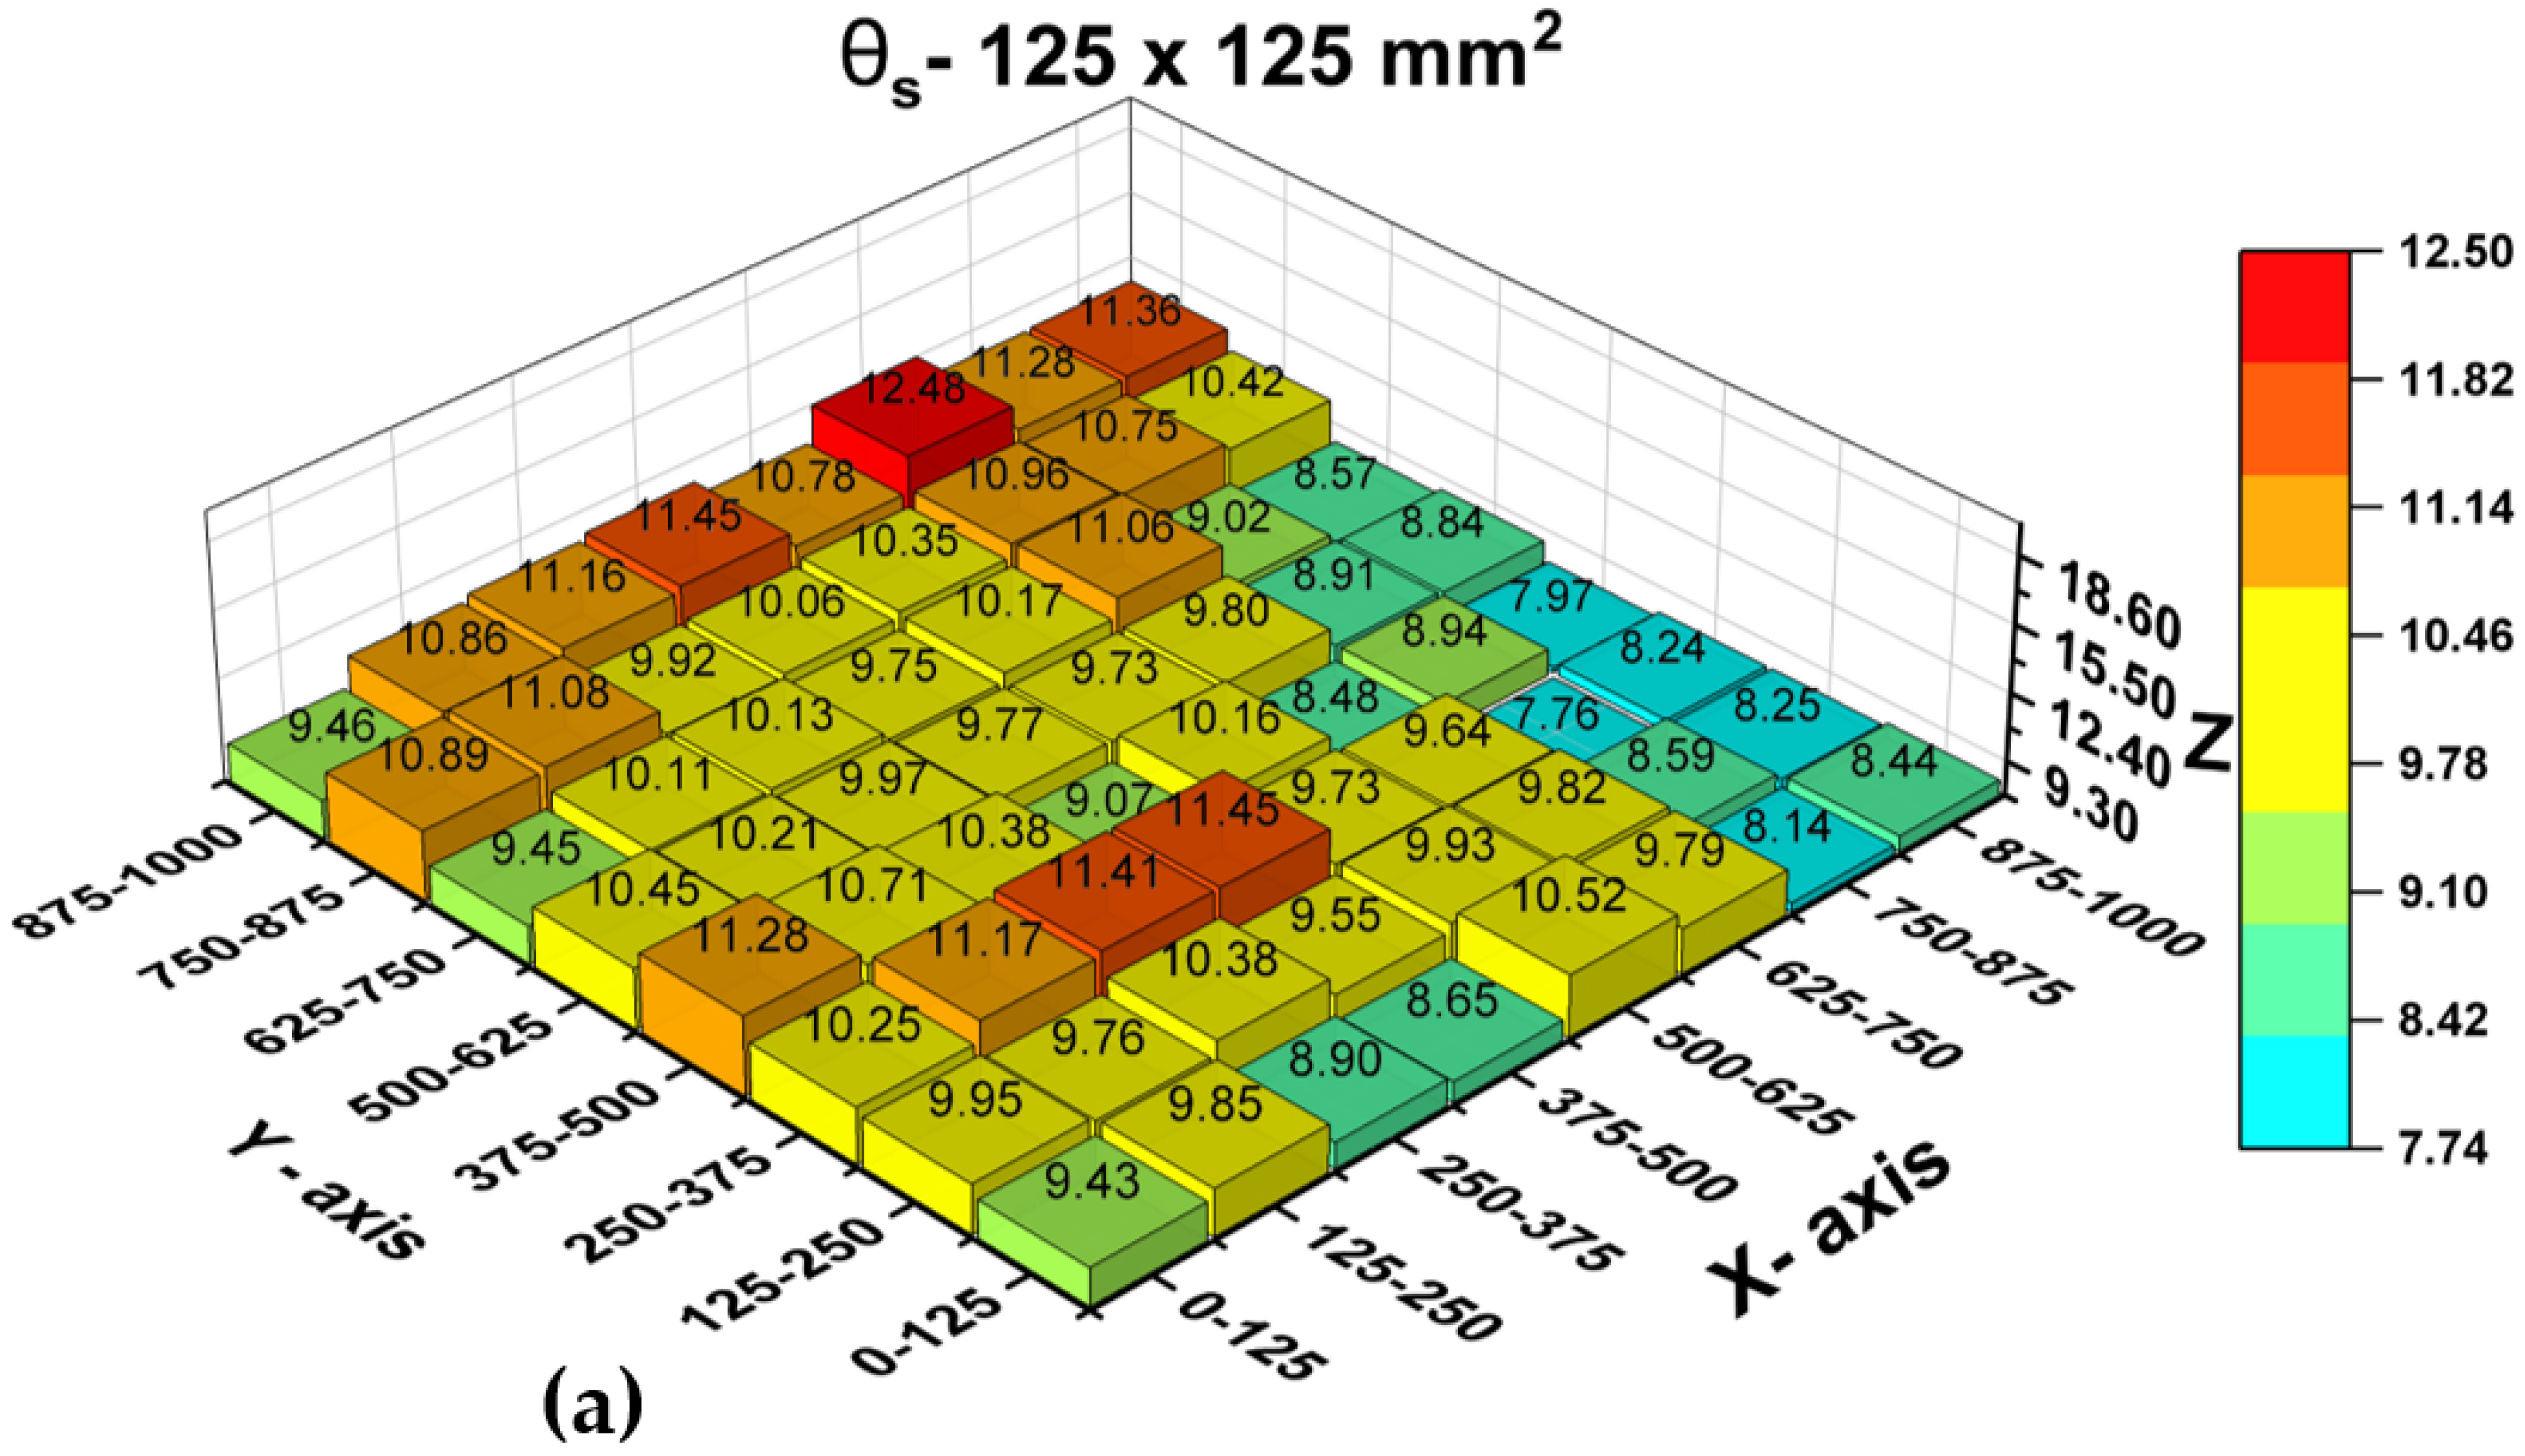
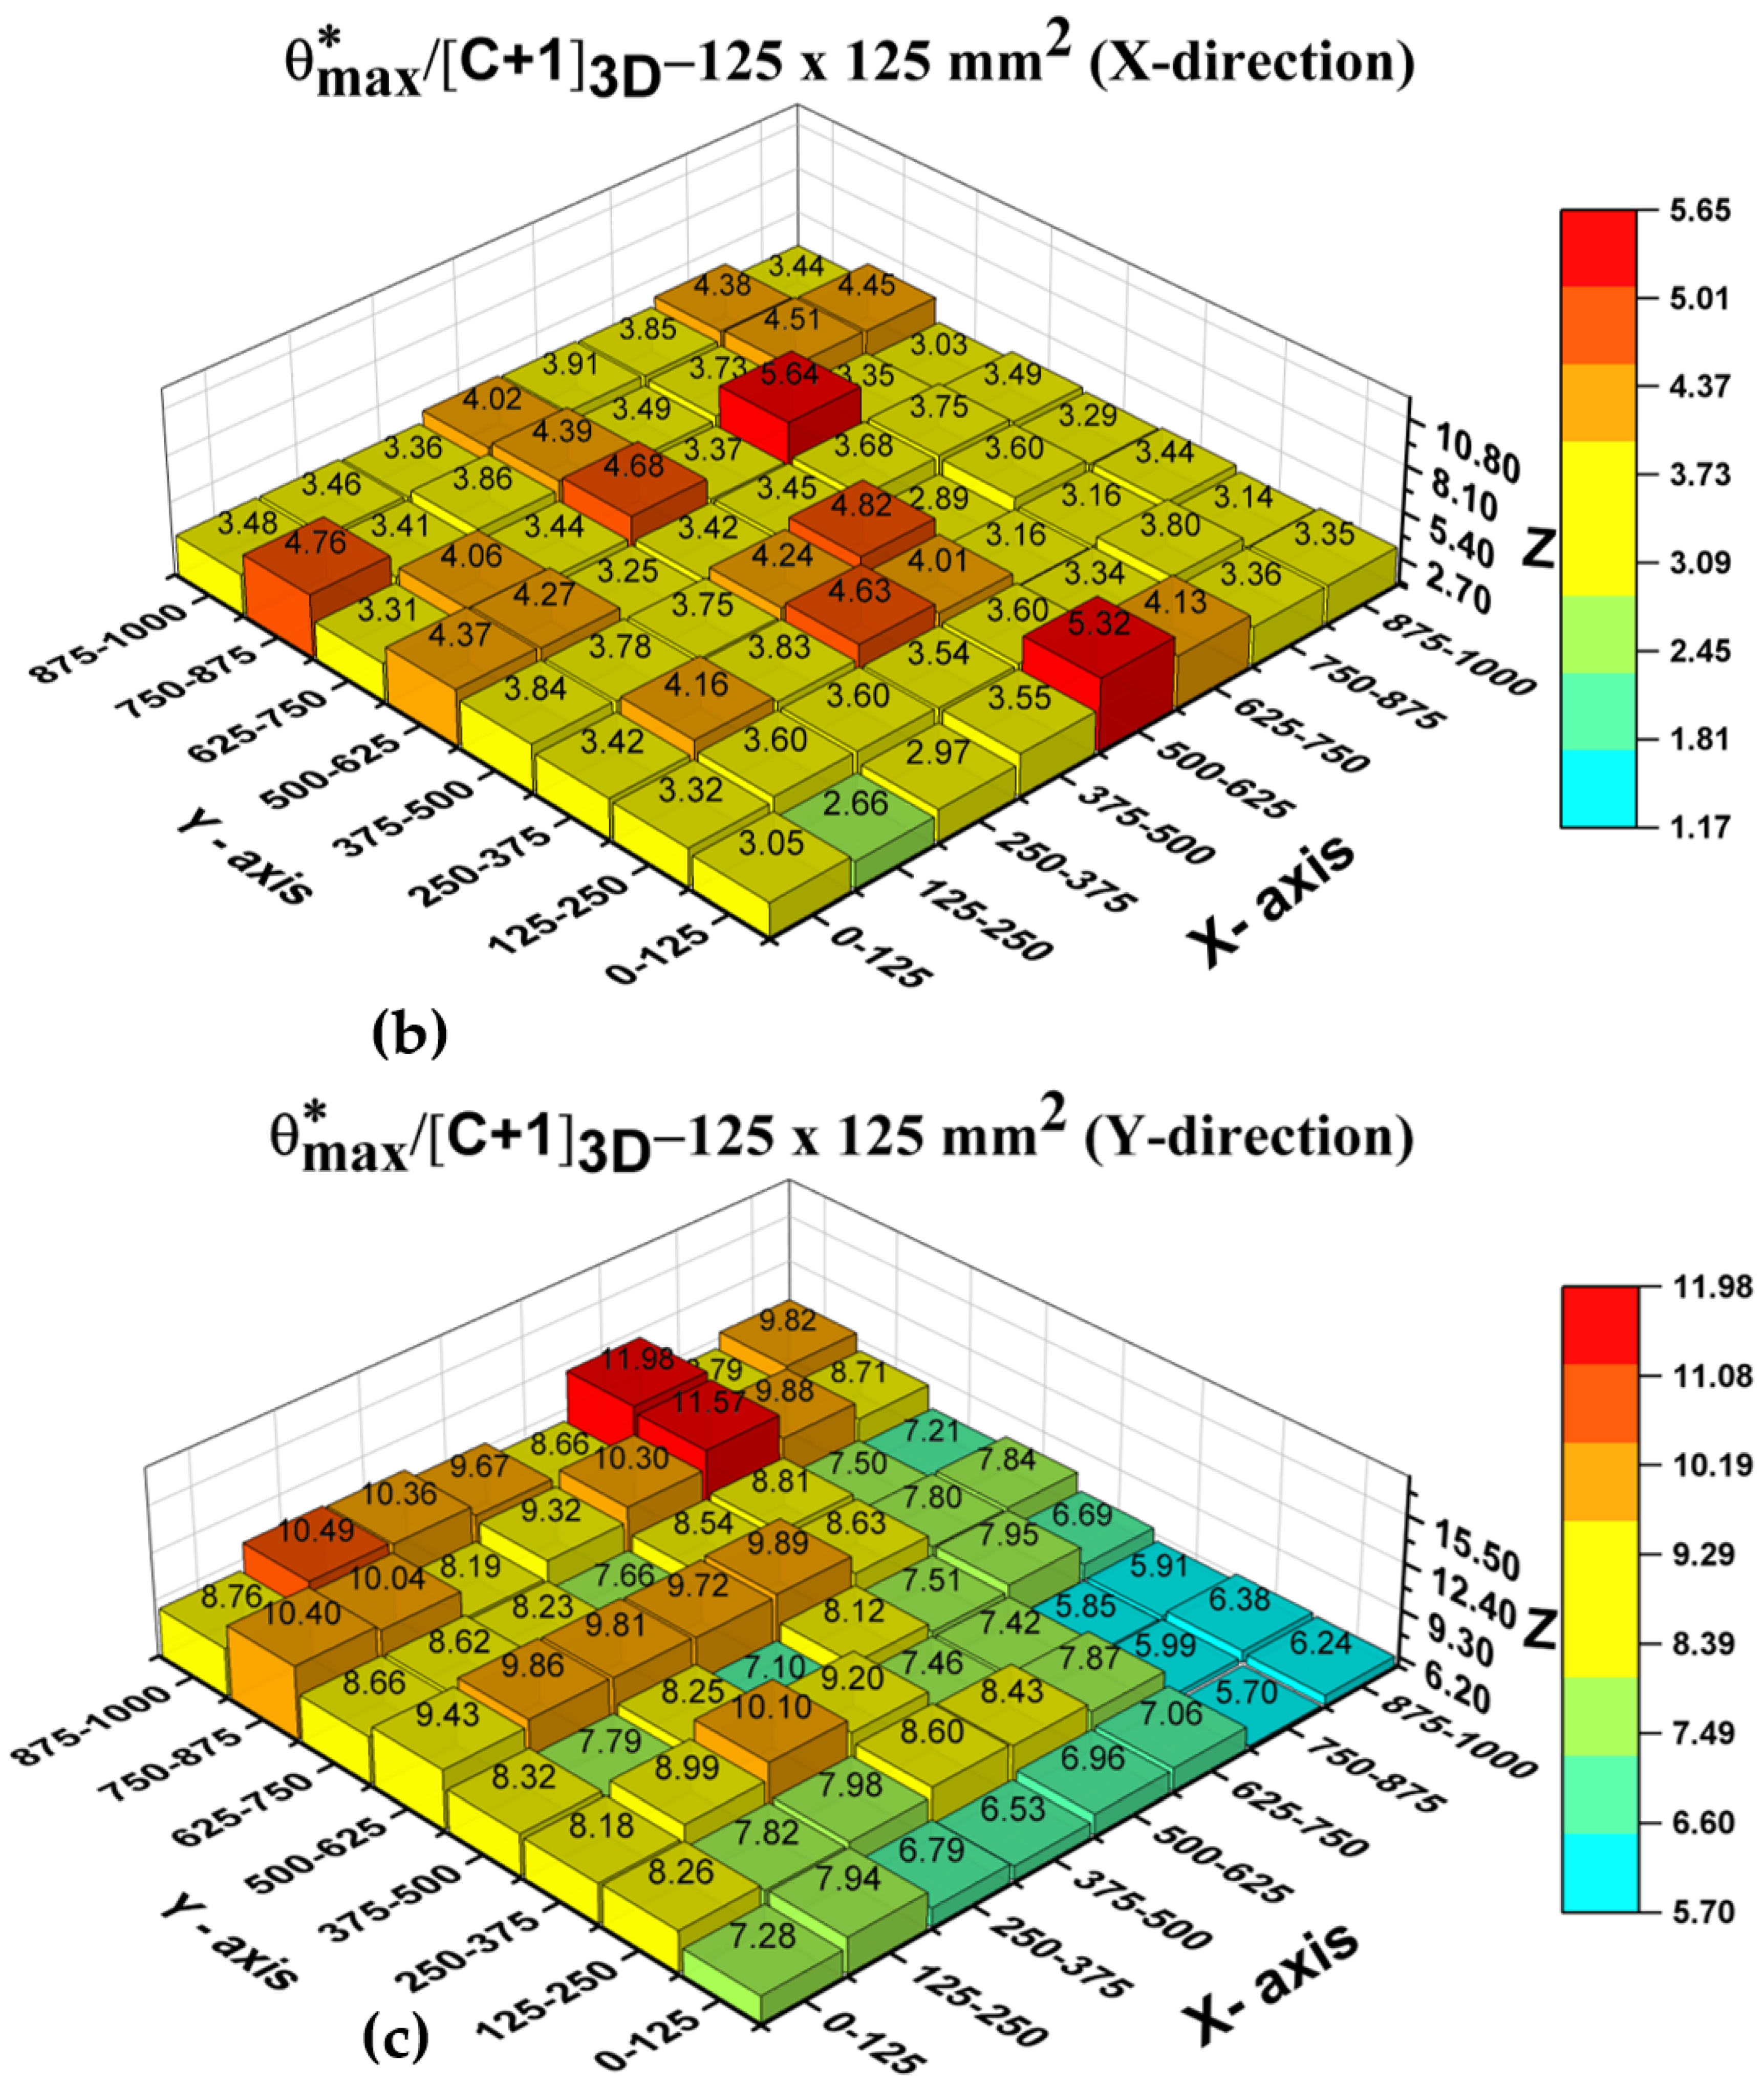
In the investigation of the effect of heterogeneity on 3D statistical roughness parameters, Ankah et al. [65] have performed roughness computations on three sizes of square surface areas of the aforementioned 1 m square rock joint as follows: (a) sixty-four 125 mm square surfaces, (b) sixteen 250 mm square surfaces, and (c) four 500 mm square surfaces. Two 3D statistical parameters have been used to study the effect of heterogeneity: (a) θS and (b) θ*max/[C+1]3D. The roughness index θ*max/[C+1]3D is a directional roughness parameter. Therefore, it has been computed along the two perpendicular directions X and Y. The obtained results for the two 3D statistical parameters for the sixty-four 125 mm square surfaces are depicted in Figure 4 to show the effect of heterogeneity. The effect of roughness heterogeneity is clearly shown in Figure 4 for both 3D statistical roughness parameters. For θS and (b) θ*max/[C+1]3D-Y direction, the maximum values have occurred on the surface with X between 625 and 750 mm, and Y between 875 and 1000 mm. For θ*max/[C+1]3D-X direction, the maximum value has occurred on the surface with X between 625 and 750 mm, and Y between 625 and 750 mm. For the roughness parameter θ*max/[C+1]3D, the value as well as the variability in the Y-direction is significantly higher compared to that in the X-direction (compare the scales in Figure 4b,c). As for the 2D statistical roughness parameters, the values obtained for the 3D statistical roughness parameters for the two sections 750–875 mm and 875–1000 mm are significantly higher than that given for the rest of the 125 mm sections in the Y direction. Therefore, the aforementioned observations imply that irrespective of the X values, the 0–750 mm section in the Y direction may be considered relatively homogeneous out of the whole rock joint.
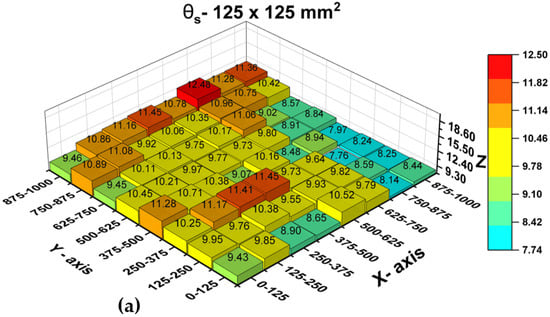
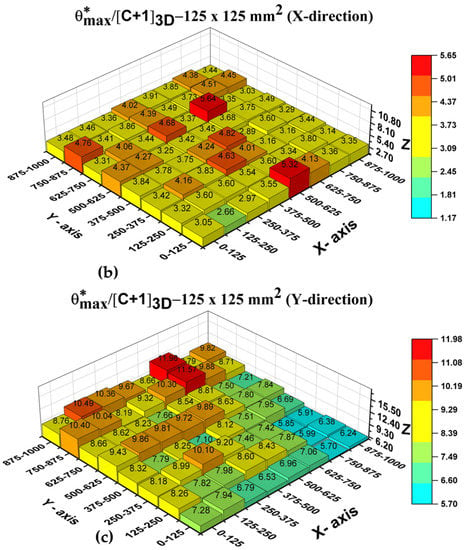
Figure 4.
3D statistical parameter results for: (a) θs; (b) θ*max/[C + 1]3D (X-direction); (c) θ*max/[C + 1]3D (Y-direction), after [65].
Recently, Kulatilake et al. [80] have performed a large number of roughness computations on the same 1 m square rock joint to investigate the effect of roughness heterogeneity on 2D fractal roughness parameters based on the variogram method. Similar computations have been performed by Ankah et al. [43] on the same rock joint to investigate the effect of roughness heterogeneity on 2D fractal roughness parameters based on the roughness length method. These computations have been conducted on roughness profiles selected in two perpendicular directions X and Y (Z-X profiles and Z-Y profiles). A part of the obtained results for the variogram method is given in Table 6.

Table 6.
Influence of heterogeneity on 2D variogram fractal parameter results (after [80]).
It can be seen that the DV × KV (the product between DV and KV) values obtained for the Z-Y profiles are much higher than that obtained for the Z-X profiles. That indicates higher roughness in the Y direction compared to that in the X direction. Moreover, the DV × KV value obtained for the Z-Y profiles in the 750–1000 mm section is much higher than that obtained for other sections of the Z-Y profiles. This indicates that the 750–1000 mm section is much rougher compared to the 0–750 mm section in the Y direction. Table 7 shows a part of the results obtained for the roughness length method. It can be seen that the DRL × A (the product between DRL and A) values obtained for the Z-Y profiles are much higher than that obtained for the Z-X profiles. That indicates higher roughness in the Y direction compared to that in the X direction. Moreover, the DRL × A value obtained for the Z-Y profiles in the 750–1000 mm section is much higher than that obtained for other sections of the Z-Y profiles. This indicates that the 750–1000 mm section is much rougher compared to the 0–750 mm section in the Y direction. Therefore, the aforementioned observations imply that irrespective of the X values, the 0–750 mm section in the Y direction may be considered relatively homogeneous out of the whole rock joint.

Table 7.
Influence of heterogeneity on 2D roughness length fractal parameter results (after [43]).
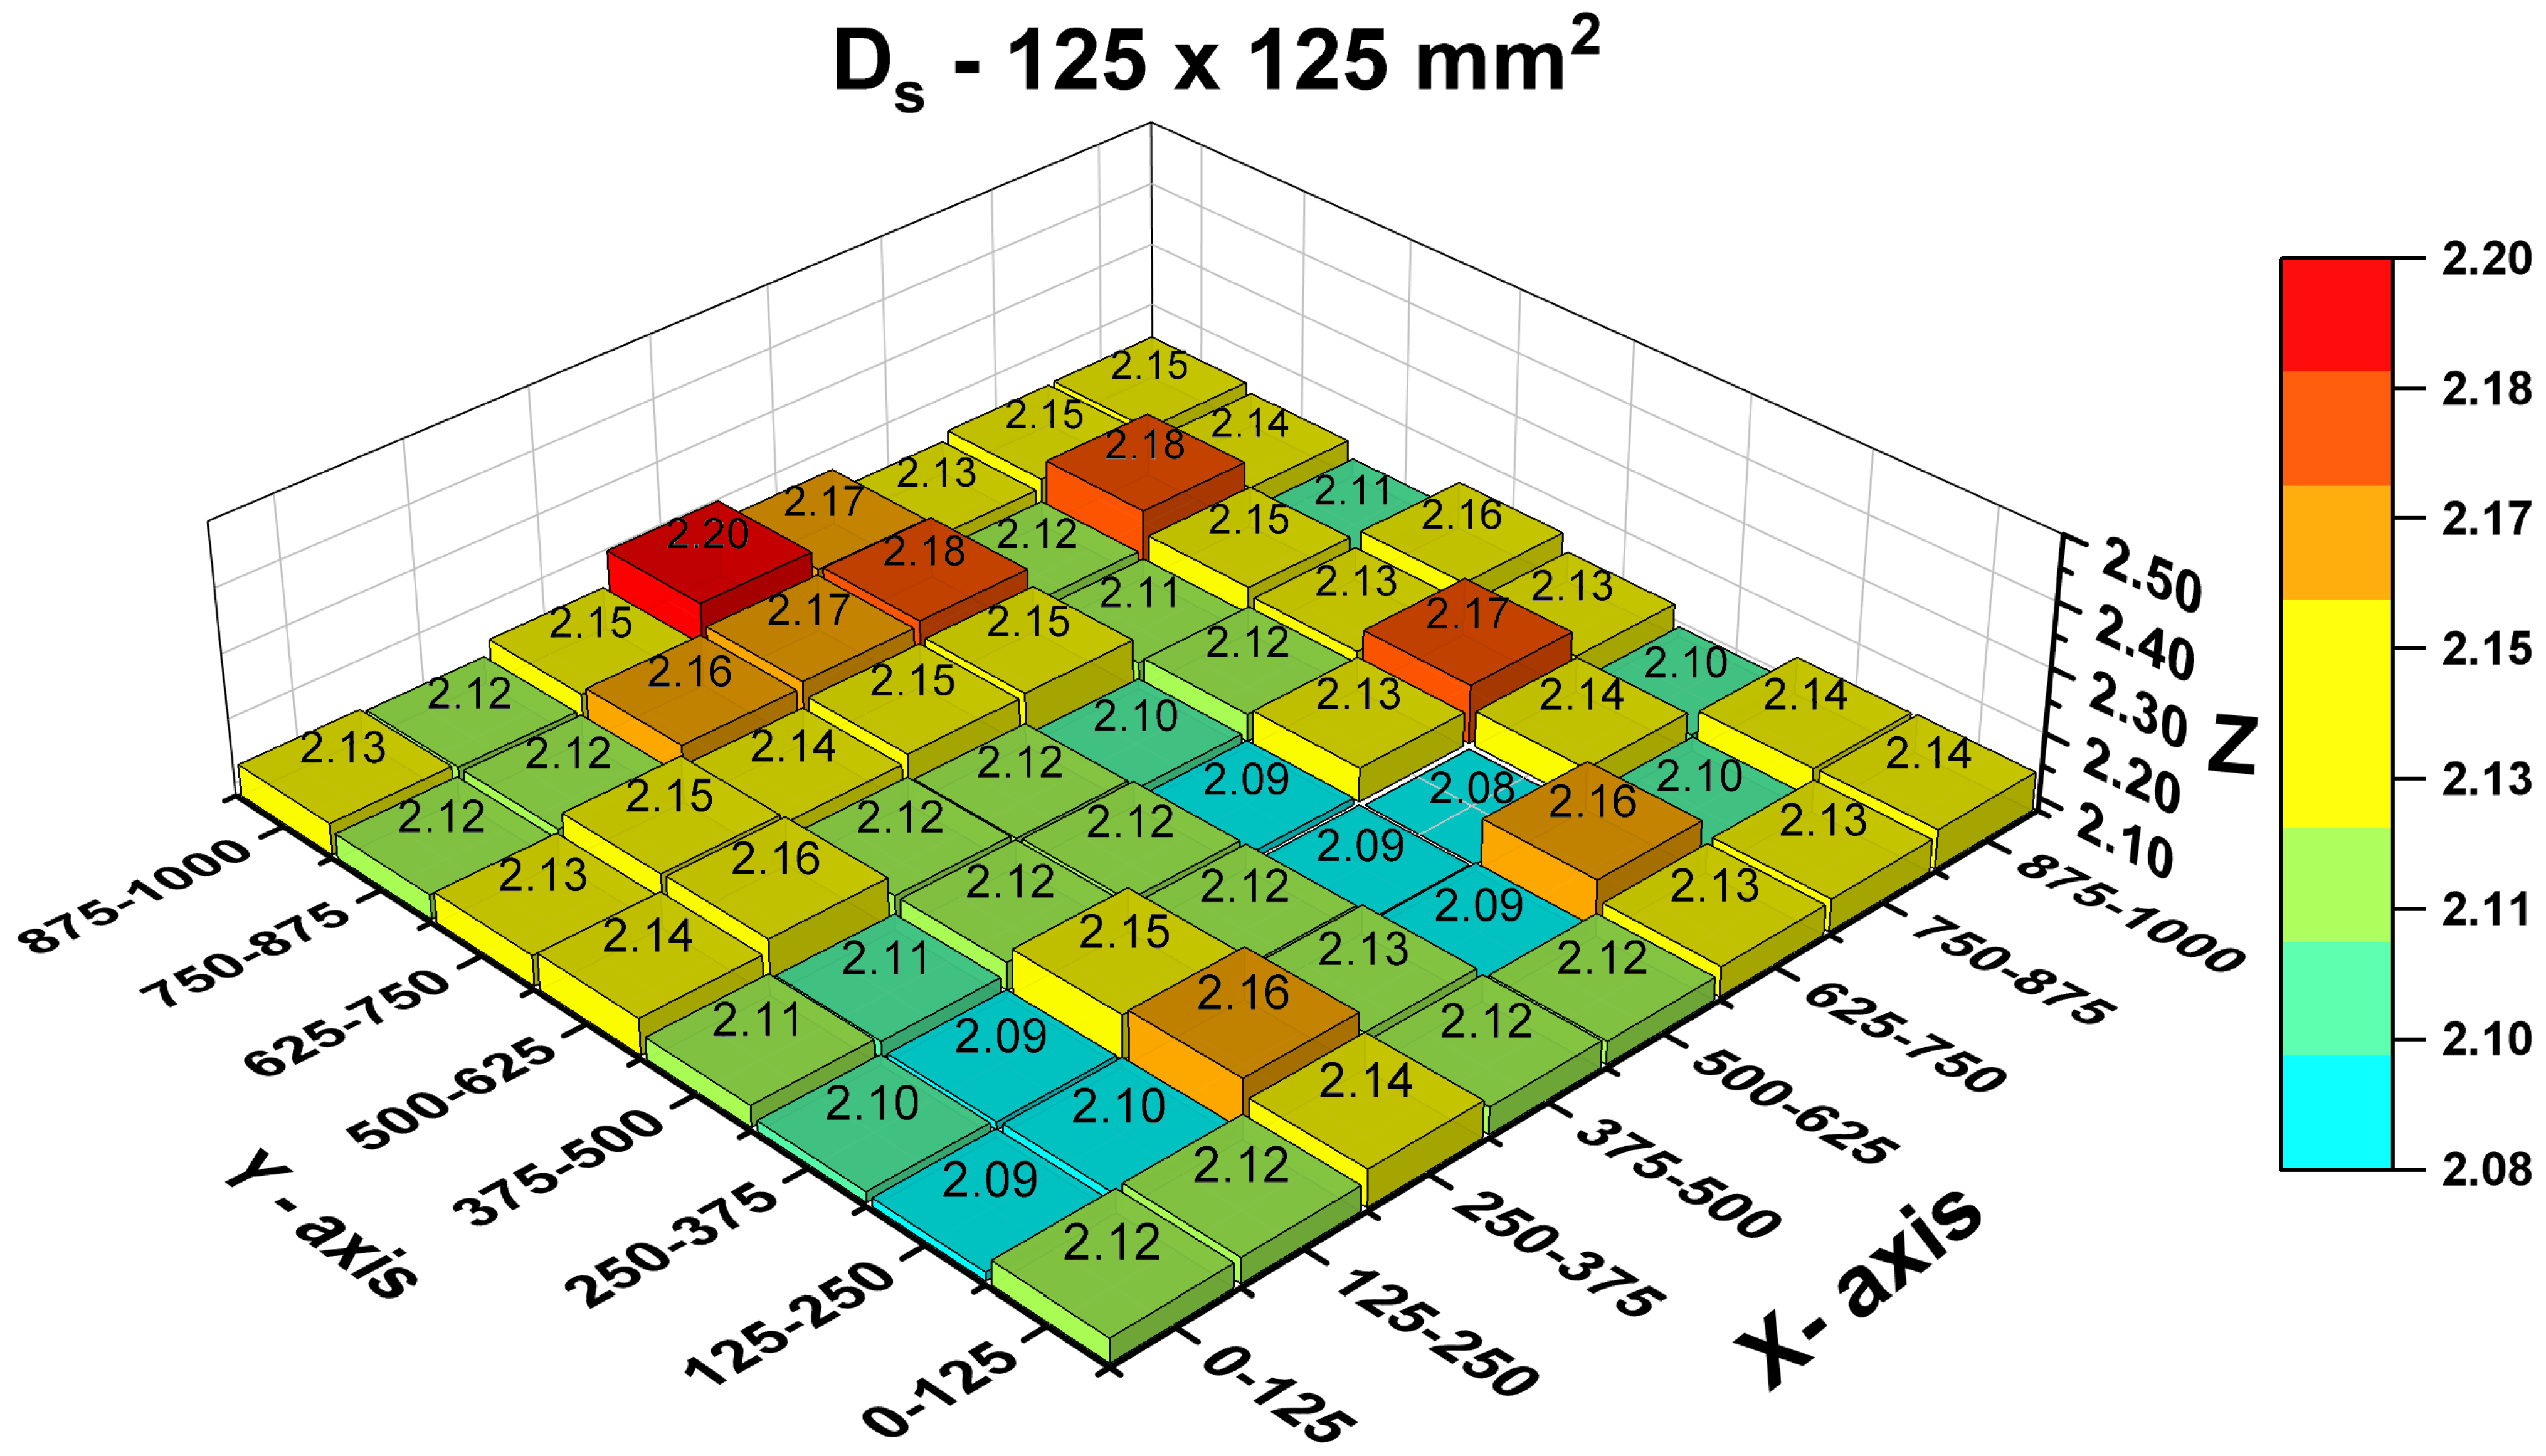
The effect of heterogeneity on 3D fractal roughness parameters has been investigated by Ankah et al. [43] by performing roughness computations using the 3D modified divider method on three sizes of square surface areas of the same 1 m square rock joint as follows: (a) sixty-four 125 mm square surfaces, (b) sixteen 250 mm square surfaces, and (c) four 500 mm square surfaces. The obtained results for the 3D modified divider method for the sixty-four 125 mm square surfaces are given in Figure 5 to show the effect of heterogeneity. The effect of roughness heterogeneity is clearly shown in Figure 5 for the surface fractal dimension DS varying between 2.081 and 2.201. Figure 5 shows that the surface with X(375–500 mm) and Y(875–1000 mm), and the surface with X(750–875 mm) and Y(750–875 mm) with DS values ranging between 2.181 and 2.201 are the roughest regions of the 125 mm square surfaces. The results obtained for DS seem to agree with the results obtained for 2D fractal parameters. In addition, DS results show that the joint surface is heterogeneous with the Y(750–1000 mm) section being significantly rougher than all other sections of the joint surface, irrespective of the X values. In other words, it implies that irrespective of the X values, the 0–750 mm section in the Y direction may be considered relatively homogeneous out of the whole rock joint.
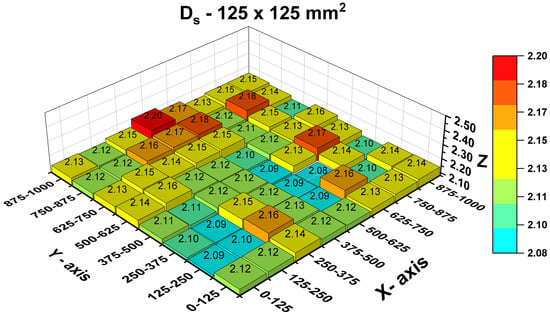
Figure 5.
The obtained results for the 3D modified divider method for 125 mm square surfaces [43].
6. Effect of Joint Size on Computed Roughness Parameters
Up until 1985, only the negative scale effect of rock joint roughness (a decrease of roughness with increasing joint size) appeared in the literature [2,45]. Since then, from their studies on rock joint roughness, researchers have reported the existence of the positive scale effect (an increase of roughness with increasing joint size), negative scale effect, and no scale effect [8,18,23,36,44,79,82,85,86,87,88,89]. However, the reasons for these contradictory findings have not been explained in the literature until 2021. Theoretically, no joint size effect should exist on a perfectly homogeneous very smooth rock joint. Unfortunately, it is uncommon to find highly homogeneous fracture surfaces on natural rock joints. Most probably the research results on scale effects reported before 2021 are based on research performed on heterogeneous rock joint surfaces. Unfortunately, in these reported results, in making conclusions on scale effects, the effect of heterogeneity has been completely ignored. Therefore, these contradictory findings might have resulted partly due to not considering the effect of heterogeneity of rock joint surfaces on the scale effects of rock joint roughness. Furthermore, these contradictory findings might have occurred due to using inappropriate or inconsistent sampling intervals in the case of statistical parameters (or range of sampling intervals in the case of fractal parameters) or/and measurement resolutions in studying the scale effect of rock joint roughness. The recent research results reported in the literature to reveal the reasons for the contradictory findings on the roughness scale effect are summarized in the following paragraphs in this section.
As discussed in Section 5, it is reasonable to consider the 0–750 mm section of the Z-Y profiles of the rock joint considered by Ankah et al. [65] as a relatively homogeneous section. To be on the conservative side, Ankah et al. [65] considered the 0–500 mm section of the Z-Y profiles of the rock joint as a relatively homogeneous section. This 0–500 mm section was used to test the null hypothesis that no joint size effect exists on the roughness of relatively homogeneous rock joint surfaces. To test the null hypothesis, the roughness was quantified by applying 2D statistical parameters on the following Z-Y profile sections that exist on the 0–500 mm relatively homogeneous section: (a) 500 mm Z-Y profiles in the 0–500 mm section, (b) 250 mm Z-Y profiles in the 0–250 mm and 250–500 mm sections, and (c) 125 mm Z-Y profiles in the 0–125 mm, 125–250 mm, 250–375 mm, and 375–500 mm sections. The mean values of the 2D statistical parameters given in Table 8 are almost the same for different joint sizes that exist in the relatively homogeneous 0–500 mm section. This confirms the null hypothesis that the relatively homogeneous sections of different joint sizes do not show scale effects on roughness due to the joint size. Ankah et al. [65] performed similar studies for the 3D statistical parameters on the same 0–500 mm relatively homogeneous section of the same rock joint. The results of those studies too confirmed the aforementioned null hypothesis. Studies similar to the above performed using fractal 2D and 3D parameters on the same 0–500 mm relatively homogeneous section of the same rock joint by Kulatilake et al. [80] and Ankah et al. [43] too confirmed the aforementioned null hypothesis.

Table 8.
Effect of joint size on computed 2-D statistical parameter summary statistics through comparison of roughness analyses results between the following homogeneous lumped sections: (a) 0–125, 125–250, 250–375, 375–500 mm sections of Z-Y; (b) 0–250, 250–500 mm sections of Z-Y and (c) 0–500 mm section of Z-Y (after [65]).
Ankah et al. [65] also performed roughness computations by applying 2D statistical parameters on the following Z-X and Z-Y profile sections that exist on the 1 m square whole rock joint: (a) 1000 mm Z-X profiles in the 0–1000 mm section, (b) 500 mm Z-X profiles in the 0–500 mm and 500–1000 mm sections, (c) 250 mm Z-X profiles in the 0–250 mm, 250–500 mm. 500–750 mm, and 750–1000 mm sections, and (d) 125 mm Z-X profiles in the 0–125 mm, 125–250 mm, 250–375 mm, 375–500 mm, 500–625 mm, 625–750 mm, 750–875 mm, and 875–1000 mm sections, (e) 1000 mm Z-Y profiles in the 0–1000 mm section, (f) 500 mm Z-Y profiles in the 0–500 mm and 500–1000 mm sections, (g) 250 mm Z-Y profiles in the 0–250 mm, 250–500 mm. 500–750 mm, and 750–1000 mm sections, and (h) 125 mm Z-Y profiles in the 0–125 mm, 125–250 mm, 250–375 mm, 375–500 mm, 500–625 mm, 625–750 mm, 750–875 mm, and 875–1000 mm sections. Note that in this investigation the high-roughness areas have been combined with the low-roughness areas in comparing the results between different joint sizes. In each direction, the quantified roughness values of all the profiles of the same joint size have been averaged; in other words, the quantified roughness value for each joint size is the mean value of the lumped sections of the same joint size. Note that the mean roughness and variability of the Z-Y profiles were significantly higher than that of the Z-X profiles. That means the heterogeneity level of the Z-Y profiles was higher than that of the Z-X profiles. This study was purposely done to evaluate the effect of the level of heterogeneity on the scale effect. Table 9 provides the reported results. The computed mean values of θP, and θP− given in Table 9 are only slightly different with increasing joint size for Z-Y profiles, indicating a slight joint size effect; however, the computed values of the Rp parameter are the same. The CV values of all three parameters decrease with increasing joint size, indicating a decrease in variability of the roughness with increasing joint size. Results given in Table 9 show higher mean and CV values compared to that given in Table 8. This has occurred due to combining the higher roughness 750–1000 mm Z-Y section with the lower roughness 0–750 mm Z-Y section in computing the mean values for Z-Y profiles. That means the computed results have reflected the increase in roughness heterogeneity due to combining the aforesaid profiles. Note that Table 8 provides results only for the 0–500 mm relatively homogeneous section of the Z-Y profiles. The computed mean values of Rp, θP, and θP− of the Z-X profiles are nearly the same or only slightly different with increasing joint size, indicating negligible joint size effect (Table 9). In summary, the Z-Y profiles of the relatively homogeneous 0–500 mm section indicated no joint size effect; the low-level heterogeneous Z-X profiles of the 0–1000 mm section showed negligible joint size effect; the moderate level heterogeneous Z-Y profiles of the 0–1000 mm section provided slight joint size effect. These results show the possible occurrence of roughness scale effects as the roughness heterogeneity increases. Ankah et al. [65] performed similar studies for the 3D statistical parameters on the heterogeneous whole rock joint. The results of those studies too turned out to be similar to what was observed for the 2D statistical parameters. Studies similar to the above performed using fractal 2D and 3D parameters on the whole rock joint by Kulatilake et al. [80] and Ankah et al. [43] too ended up providing conclusions similar to the ones obtained through 2D and 3D statistical parameters. Therefore, it is possible to say that the roughness heterogeneity has played an important role concerning the contradictory findings appearing in the literature on roughness scale effects.

Table 9.
Effect of joint size and anisotropy on 2-D statistical parameter results (after [65]).
7. Roughness Anisotropy
Evidence abounds in the literature that joint surface anisotropy has been of interest to researchers. Kulatilake et al. [3] and Kulatilake et al. [81] investigated joint surface anisotropy using statistical and fractal (roughness length) methods, respectively, and developed peak shear strength criteria for anisotropic rock joints. Aydan et al. [9] demonstrated that rock joint surfaces can be quantified for anisotropy by using roughness profiles along their Eigendirections. Belem et al. [20] suggested an anisotropy classification scheme for rock joints based on the mean inclination angle of the profile. Ge et al. [24] studied roughness anisotropy using the variogram method and the normal vector to the surface. Grasselli et al. [21] and Tatone and Grasselli [36] used the metric θ*Max/[C + 1]3D to study directional (anisotropic) roughness. Tatone and Grasselli [35] also characterized anisotropy using θ*Max/[C + 1]2D. Ge et al. [90] suggested an index, Brightness Area Percentage (BAP), for quantifying joint roughness; the authors claimed that the index took into consideration joint surface anisotropy. Chen et al. [91] studied joint roughness anisotropy using a digital image processing technique and a fractal method (variogram); two indices (SRV and b) which depend on the variogram sill and range, were suggested in the study for characterizing anisotropic roughness and joint aperture respectively. Bao et al. [92] suggested a parameter (M) for quantifying joint roughness; the authors asserted that the suggested roughness parameter, which was based on the root mean square of the profile, was suitable for characterizing anisotropy of joint surfaces. Moreover, Chen et al. [93] proposed the roughness metric, R, (a simpler version of θ*Max/[C + 1]3D) for characterizing roughness anisotropy. It is worth noting that JRC varies with direction (exhibits anisotropy) [63].
Other recent research that has studied roughness anisotropy includes Ankah et al. [65], Kulatilake et al. [80], and Ankah et al. [43]. Results given in Table 6, Table 7 and Table 9 show that the values obtained for the roughness parameters for the Z-Y profiles are higher than that for the Z-X profiles. Figure 4b,c shows that the results obtained for θ*Max/[C+1]3D are higher in the Y direction compared to that in the X direction. These results indicate the anisotropy very well. In these three studies, the authors believed that although anisotropic roughness had been assessed in the literature no study had looked at the impact of anisotropy on the scale effect. According to the authors, it made sense to include anisotropy’s impact on the scale effect as a component of heterogeneity’s impact. Results given in Table 9 and Figure 4b,c show through a unique approach the existence of anisotropic roughness on the joint surface and the linkage to roughness heterogeneity.
8. Effect of Sampling Interval and Resolution on Computed Roughness Parameters
Sampling interval and measurement resolution are crucial in the accurate quantification of joint roughness. Researchers such as Tatone and Grasselli [36] found that measurement resolution had a greater influence on roughness compared to the sample size. Tatone and Grasselli [36] hypothesized based on their study that certain prior researchers’ observations of a decrease in roughness with increased sample size may have been caused by the use of different measurement resolutions. Jang et al. [61] used four different sampling intervals, ranging from 0.1 mm to 2.0 mm, to study the effect of sampling interval on JRC values; the authors found that all the roughness parameters used for the study showed a sampling interval effect. Additionally, in a study conducted by Ge et al. [90], the sampling interval effect was investigated by digitizing a natural rock joint in situ at sampling intervals ranging from 0.01 m2 to 3.61 m2; roughness was found to decrease with the sampling interval. Tang et al. [94], as well, studied the sampling interval effect on roughness using the parameter θ*Max/[C + 1]3D. The study considered six sampling intervals ranging from 0.1 mm to 4.0 mm; the results showed that θ*Max/[C + 1]3D values decreased as the sampling interval increased. Pickering and Aydin [95] also reported a great sampling interval influence on Z2 and suggested a signal analysis approach as a potential solution to this problem. Similarly, Li et al. [96] and Yong et al. [28] observed that the sampling interval greatly influenced the roughness metrics they used.
Note that Ankah et al. [65] also investigated the influence of sampling interval on six statistical roughness metrics using a very large dataset of joint profiles. Apart from the amplitude parameter which was shown not to be reliable, the calculated roughness metric values at the lower sampling interval were observed to be significantly higher than that obtained at the higher sampling interval. This is clearly in line with the observations of other studies on the subject. The foregoing discussion highlights a major shortcoming of the statistical parameters.
9. Comparison between the Values Obtained for some of the Roughness Parameters
It is not possible to compare the values obtained for all the roughness parameters mentioned in this paper because they are based on different concepts. However, the slope roughness parameter values expressed in degrees (parameter numbers 4 through 7 and 16 in Table 2) can be compared. Ankah et al. [65] have made a comparison among the values obtained for those roughness parameters by applying those parameters to the same rock joint surface. Good comparisons have been obtained between θP, θP−, and θ*Max/[C + 1]3D. θs values represented the mean true dips of the selected surfaces of the rock joint. θP, θP−, and θ*Max/[C + 1]3D represented apparent dips of the rock joint surface in the chosen directions. The true dips need to be higher than the apparent dips. This fact was very well reflected in the values obtained by Ankah et al. [65].
Kulatilake et al. [80] have applied the variogram fractal method, and Ankah et al. [43] have applied two 2D fractal methods and one 3D fractal method to the same rock joint surface. As one of the fractal parameters, they have calculated the fractal dimension in 2D and 3D. To make a comparison, it is necessary to add 1 to the 2D fractal dimension values to arrive at 3D fractal dimension values. They have obtained a very good comparison between the 2D fractal dimension values and 3D fractal dimension values for the three fractal methods reported in the paper.
10. Discussion and Conclusions
The non-contact methods are more accurate and faster than contact methods in measuring rock joint roughness. Even though JRC may be used as a preliminary roughness index, it is not suitable for accurate quantification of rock joint roughness due to the subjective nature of its estimation. Rock joint roughness has two major characteristics: (a) amplitude and (b) autocorrelation structure. Research results appearing in the literature have shown that the amplitude-based statistical roughness parameters are not suitable for accurate quantification of rock joint roughness most probably because they cannot capture the autocorrelation structure of rock joint roughness. Out of the slope-based roughness parameters, based on the explanations given in the paper, Z4 is not a suitable parameter for roughness quantification. Based on the explanations given in the paper, the relations appearing in the literature between JRC and statistical roughness parameters have no reliability. Among the statistical roughness parameters, the combined amplitude and slope-based roughness parameters theoretically seem to have better potential than only the slope-based roughness parameters in the accurate quantification of rock joint roughness.
Due to the highly erratic nature of the rock joint roughness, fractional geometry is more suitable than Euclidean geometry in quantifying rock joint roughness. Note that all the statistical roughness parameters are based on Euclidean geometry and all the fractal roughness parameters are based on fractional geometry. In the quantification of rock joint roughness, each statistical parameter uses a single sampling interval. In general, all the statistical roughness parameters provide several values or non-unique values based on the different values used for the sampling interval. This is a major drawback of the statistical roughness parameters. On the other hand, each of the fractal methods stated in the paper uses a range of sampling intervals in computing fractal roughness parameters. Due to the aforementioned reasons, the fractal roughness parameters seem more reliable than statistical roughness parameters in the accurate quantification of rock joint roughness.
For accurate quantification of rock joint roughness, it is necessary to remove the non-stationary features of rock joint profiles. Results given in the literature have indicated that the removal of non-stationary features is needed to obtain correct results in using amplitude roughness parameters. Slope-related roughness parameters automatically remove the linear trend or the first-order non-stationarity. Therefore, the slope-based roughness parameters are not affected by the presence of first-order non-stationarity in the roughness surfaces. As explained in the paper, based on the definitions and structures, the combined amplitude and slope-based roughness parameters listed in the paper are also not affected by the presence of first-order non-stationarity in the roughness surfaces. Variogram and roughness length fractal methods automatically remove the first-order non-stationarity of roughness profiles. Therefore, variogram and roughness length roughness parameters are not affected by the presence of first-order non-stationarity in the roughness surfaces. Based on the definitions and structures, the modified 2D and 3D divider roughness parameters are also not affected by the presence of first-order non-stationarity in the roughness surfaces. At present, it is not possible to say how some of the aforementioned parameters respond to the presence of the second-order non-stationary roughness features.
Until 2021, roughness heterogeneity has been neglected in the literature in making decisions on the roughness scale effects. Theoretically, no joint size effect exists on 100% smooth homogeneous rock joints. Unfortunately, the roughness of natural rock joints is heterogeneous. Based on these facts and the recent results reported in the literature on rock joint scale effects, it is possible to say that the contradictory findings that have been appearing in the literature on roughness scale effects during the last 40 years have resulted from neglecting the effect of roughness heterogeneity on scale effects. It means that the roughness heterogeneity controls the rock joint roughness scale effect, and it can be either negative, positive, or no scale effect depending on the type and level of the roughness heterogeneity of the rock joint surface.
Natural rock joint surfaces usually show anisotropic roughness. The type and level of anisotropy depend on how the rock joints were formed. The roughness heterogeneity contributes to the roughness anisotropy. Rock joints formed from shearing usually indicate lower roughness and heterogeneity in the shearing direction and higher roughness and heterogeneity in the direction perpendicular to the shearing direction. Therefore, rock joints formed through shearing tend to show orthogonal roughness anisotropy. Rock joints formed through tensile failures tend to show non-orthogonal anisotropic roughness.
Comparisons made between several 2D and 3D slope-based statistical roughness parameter values utilizing the same rough surface have shown consistent results for the different roughness parameters. For the three fractal methods reported in the paper, very good comparisons have been obtained between the 2D fractal dimension values and 3D fractal dimension values computed for the same rough rock joint.
11. Recommendations for Future Research
It is important to investigate the effect of second-order non-stationary roughness on the accurate quantification of statistical and fractal roughness parameters. Further investigations on the effect of roughness heterogeneity on the roughness scale effects should be conducted by making roughness computations on different types of roughness surfaces. Future research is recommended on studying the effect of different ranges of sampling intervals on the fractal parameters. Differently formed fracture surfaces (under the shearing mode, tensile mode, combined shearing and tensile mode, etc.) should be subjected to accurate quantification of roughness to study the relation between fracture formation mode and roughness anisotropy. The same roughness quantification procedure should be applied to the measured roughness data obtained from different non-contact methods applied to the same rock joint to compare the accuracy of the data obtained from different non-contact measurement methods.
Funding
This research received no external funding.
Conflicts of Interest
The authors declare that they have no conflict of interest.
References
- Barton, N. Review of a new shear-strength criterion for rock joints. Eng. Geol. 1973, 7, 287–332. [Google Scholar] [CrossRef]
- Bandis, S.; Lumsden, A.C.; Barton, N.R. Experimental studies of scale effects on the shear behaviour of rock joints. Int. J. Rock Mech. Min. Sci. Geomech. Abstr. 1981, 18, 1–21. [Google Scholar] [CrossRef]
- Kulatilake, P.H.S.W.; Shou, G.; Huang, T.; Morgan, R. New peak shear strength criteria for anisotropic rock joints. Int. J. Rock Mech. Min. Sci. Geomech. Abstr. 1995, 32, 673–697. [Google Scholar] [CrossRef]
- Barton, N.; Bandis, S.; Bakhtar, K. Strength, deformation and conductivity coupling of rock joints. Int. J. Rock Mech. Min. Sci. Geomech. Abstr. 1985, 22, 121–140. [Google Scholar] [CrossRef]
- Kulatilake, P.H.S.W.; Park, J.; Balasingam, P.; Morgan, R. Quantification of aperture and relations between aperture, normal stress and fluid flow for natural single rock fractures. Geotech. Geol. Eng. 2008, 26, 269–281. [Google Scholar] [CrossRef]
- Fecker, E.; Rengers, N. Measurement of large scale roughness of rock planes by means of profilograph and geological compass. In Proceedings of the 1st ISRM Symposium on Rock Fracture, Nancy, France, 4–6 October 1971. [Google Scholar]
- Brown, S.R.; Scholz, C.H. Broad bandwidth study of the topography of natural rock surfaces. J. Geophys. Res. Solid 1985, 90, 12575–12582. [Google Scholar] [CrossRef]
- Maerz, N.H.; Franklin, J.A.; Bennett, C.P. Joint roughness measurement using shadow profilometry. Int. J. Rock Mech. Min. Sci. Geomech. Abstr. 1990, 27, 329–343. [Google Scholar] [CrossRef]
- Aydan, Ö.; Shimizu, Y.; Kawamoto, T. The anisotropy of surface morphology characteristics of rock discontinuities. Rock Mech. Rock Eng. 1996, 29, 47–59. [Google Scholar] [CrossRef]
- Rasouli, V.; Harrison, J.P. A comparison of linear profiling and an in-plane method for the analysis of rock surface geometry. Int. J. Rock Mech. Min. 2004, 41, 133–138. [Google Scholar] [CrossRef]
- Develi, K.; Babadagli, T.; Comlekci, C. A new computer-controlled surface-scanning device for measurement of fracture surface roughness. Comput. Geotech. 2001, 27, 265–277. [Google Scholar] [CrossRef]
- Du, S. Research on complexity of surface undulating shapes of rock joints. J. China Univ. Geosci. 1998, 9, 86–89. [Google Scholar]
- Du, S.; Hu, Y.; Hu, X. Measurement of joint roughness coefficient by using profilograph and roughness ruler. J. Earth Sci. 2009, 20, 890–896. [Google Scholar] [CrossRef]
- Huang, S.; Oelfke, S.; Speck, R. Applicability of fractal characterization and modelling to rock joint profiles. Int. J. Rock Mech. Min. Sci. Geomech. Abstr. 1992, 29, 89–191. [Google Scholar] [CrossRef]
- Hsiung, S.; Ghosh, A.; Ahola, M.; Chowdhury, A. Assessment of conventional methodologies for joint roughness coefficient determination. In Proceedings of the 34th US Symposium on Rock Mechanics (USRMS), Madison, WI, USA, 27–30 June 1993. [Google Scholar]
- Brown, S.R. Simple mathematical model of a rough fracture. J. Geophys. Res. Solid 1995, 100, 5941–5952. [Google Scholar] [CrossRef]
- Kulatilake, P.H.S.W.; Balasingam, P.; Park, J.; Morgan, R. Natural rock joint roughness quantification through fractal techniques. Geotech. Geol. Eng. 2006, 24, 1181–1202. [Google Scholar] [CrossRef]
- Xie, H.; Wang, J.-A.; Xie, W.-H. Fractal effects of surface roughness on the mechanical behavior of rock joints. Chaos Soliton Fract. 1997, 8, 221–252. [Google Scholar] [CrossRef]
- Lanaro, F.; Jing, L.; Stephansson, O. 3-D-laser measurements and representation of roughness of rock fractures. In Mechanics of Jointed and Faulted Rock; Routledge: Oxford, UK, 1998; pp. 185–189. [Google Scholar]
- Belem, T.; Homand-Etienne, F.; Souley, M. Quantitative parameters for rock joint surface roughness. Rock Mech. Rock Eng. 2000, 33, 217–242. [Google Scholar] [CrossRef]
- Grasselli, G.; Wirth, J.; Egger, P. Quantitative three-dimensional description of a rough surface and parameter evolution with shearing. Int. J. Rock Mech. Min. 2002, 39, 789–800. [Google Scholar] [CrossRef]
- Feng, Q.; Fardin, N.; Jing, L.; Stephansson, O. A new method for in-situ non-contact roughness measurement of large rock fracture surfaces. Rock Mech. Rock Eng. 2003, 36, 3–25. [Google Scholar] [CrossRef]
- Fardin, N.; Feng, Q.; Stephansson, O. Application of a new in situ 3D laser scanner to study the scale effect on the rock joint surface roughness. Int. J. Rock Mech. Min. 2004, 41, 329–335. [Google Scholar] [CrossRef]
- Ge, Y.; Kulatilake, P.H.S.W.; Tang, H.; Xiong, C. Investigation of natural rock joint roughness. Comput. Geotech. 2014, 55, 290–305. [Google Scholar] [CrossRef]
- Jiang, Y.; Li, B.; Tanabashi, Y. Estimating the relation between surface roughness and mechanical properties of rock joints. Int. J. Rock Mech. Min. 2006, 43, 837–846. [Google Scholar] [CrossRef]
- Tatone, B.S.; Grasselli, G. A method to evaluate the three-dimensional roughness of fracture surfaces in brittle geomaterials. Rev. Sci. Instrum. 2009, 80, 125110. [Google Scholar] [CrossRef] [PubMed]
- Hong, E.S.; Lee, J.S.; Lee, I.M. Underestimation of roughness in rough rock joints. Int. J. Numer. Anal. Methods Geomech. 2008, 32, 1385–1403. [Google Scholar] [CrossRef]
- Yong, R.; Ye, J.; Li, B.; Du, S.-G. Determining the maximum sampling interval in rock joint roughness measurements using Fourier series. Int. J. Rock Mech. Min. 2018, 101, 78–88. [Google Scholar] [CrossRef]
- Myers, N.O. Characterization of surface roughness. Wear 1962, 5, 182–189. [Google Scholar] [CrossRef]
- Mandelbrot, B. How long is the coast of Britain? Statistical self-similarity and fractional dimension. Science 1967, 156, 636–638. [Google Scholar] [CrossRef]
- Sayles, R.S.; Thomas, T.R. The spatial representation of surface roughness by means of the structure function: A practical alternative to correlation. Wear 1977, 42, 263–276. [Google Scholar] [CrossRef]
- Wu, T.H.; Ali, E.M. Statistical representation of the joint roughness. Int. J. Rock Mech. Min. Sci. Geomech. Abstr. 1978, 259–262. [Google Scholar] [CrossRef]
- Tse, R.; Cruden, D. Estimating joint roughness coefficients. Int. J. Rock Mech. Min. Sci. Geomech. Abstr. 1979, 16, 303–307. [Google Scholar] [CrossRef]
- Yu, X.; Vayssade, B. Joint profiles and their roughness parameters. Int. J. Rock Mech. Min. Sci. Geomech. Abstr. 1991, 28, 333–336. [Google Scholar] [CrossRef]
- Tatone, B.S.A.; Grasselli, G. A new 2D discontinuity roughness parameter and its correlation with JRC. Int. J. Rock Mech. Min. 2010, 47, 1391–1400. [Google Scholar] [CrossRef]
- Tatone, B.S.; Grasselli, G. An investigation of discontinuity roughness scale dependency using high-resolution surface measurements. Rock Mech. Rock Eng. 2013, 46, 657–681. [Google Scholar] [CrossRef]
- Feder, J. Fractals; Plenum Press: New York, NY, USA, 1988. [Google Scholar]
- Russ, J.C. Fractal Surfaces; Springer: Berlin/Heidelberg, Germany, 1994. [Google Scholar]
- Shirono, T.; Kulatilake, P.H.S.W. Accuracy of the spectral method in estimating fractal/spectral parameters for self-affine roughness profiles. Int. J. Rock Mech. Min. 1997, 34, 789–804. [Google Scholar] [CrossRef]
- Roko, R.O.; Daemen, J.J.K.; Myers, D.E. Variogram characterization of joint surface morphology and asperity deformation during shearing. Int. J. Rock Mech. Min. 1997, 34, 71–84. [Google Scholar] [CrossRef]
- Kulatilake, P.H.S.W.; Um, J.; Pan, G. Requirements for accurate quantification of self-affine roughness using the variogram method. Int. J. Solids Struct. 1998, 35, 4167–4189. [Google Scholar] [CrossRef]
- Kulatilake, P.H.S.W.; Um, J. Requirements for accurate quantification of self-affine roughness using the roughness–length method. Int. J. Rock Mech. Min. 1999, 36, 5–18. [Google Scholar] [CrossRef]
- Ankah, M.L.Y.; Kulatilake, P.H.; Sunkpal, D.T.; Zhao, X. Rock Joint Roughness Quantification Using 2D And 3D Fractal Methods. Fractals 2022, 30, 1–16. [Google Scholar] [CrossRef]
- Lanaro, F. A random field model for surface roughness and aperture of rock fractures. Int. J. Rock Mech. Min. 2000, 37, 1195–1210. [Google Scholar] [CrossRef]
- Barton, N.; Choubey, V. The shear strength of rock joints in theory and practice. Rock Mech. 1977, 10, 1–54. [Google Scholar] [CrossRef]
- Miller, S.; McWilliams, P.; Kerkering, J. Ambiguities in estimating fractal dimensions of rock fracture surfaces. In Proceedings of the 31st US Symposium on Rock Mechanics (USRMS), Golden, CO, USA, 18–20 June 1990. [Google Scholar]
- Kodikara, J.K.; Johnston, I.W. Shear behaviour of irregular triangular rock-concrete joints. Int. J. Rock Mech. Min. Sci. Geomech. Abstr. 1994, 31, 313–322. [Google Scholar] [CrossRef]
- Alameda-Hernández, P.; Jiménez-Perálvarez, J.; Palenzuela, J.A.; El Hamdouni, R.; Irigaray, C.; Cabrerizo, M.A.; Chacón, J. Improvement of the JRC calculation using different parameters obtained through a new survey method applied to rock discontinuities. Rock Mech. Rock Eng. 2014, 47, 2047–2060. [Google Scholar] [CrossRef]
- Milne, D.; Germain, P.; Potvin, Y. Measurement of rock mass properties for mine design. In Proceedings of the Rock Characterization: ISRM Symposium, Eurock’92, Chester, UK, 14–17 September 1992. [Google Scholar]
- Rasouli, V.; Harrison, J.P. Scale effect, anisotropy and directionality of discontinuity surface roughness. In Proceedings of the EUROCK Symposium, Aachen, Germany, 27 March 2000; Volume 14, pp. 751–756. [Google Scholar]
- Yong, R.; Ye, J.; Liang, Q.-F.; Huang, M.; Du, S.-G. Estimation of the joint roughness coefficient (JRC) of rock joints by vector similarity measures. Bull. Eng. Geol. Environ. 2018, 77, 735–749. [Google Scholar] [CrossRef]
- Tatone, B.S.A.; Grasselli, G. Use of a Stereo-Topometric Measurement System for the Characterization of Rock Joint Roughness In-Situ and in the Laboratory. Available online: extension://bfdogplmndidlpjfhoijckpakkdjkkil/pdf/viewer.html?file=https%3A%2F%2Fgeogroup.utoronto.ca%2Fwp-content%2Fuploads%2FRockEng09%2FPDF%2FSession15%2F4145%2520PAPER.pdf (accessed on 20 February 2023).
- Lee, H.-S.; Ahn, K.-W. A prototype of digital photogrammetric algorithm for estimating roughness of rock surface. Geosci. J. 2004, 8, 333–341. [Google Scholar] [CrossRef]
- Baker, B.R.; Gessner, K.; Holden, E.-J.; Squelch, A.P. Automatic detection of anisotropic features on rock surfaces. Geosphere 2008, 4, 418–428. [Google Scholar] [CrossRef]
- Barton, N. Barton-Bandis Criterion Summarized with Figures. 2017. Available online: http://www.nickbarton.com/downloads_04.asp (accessed on 5 February 2023).
- ISRM. Suggested Methods for the Quantitative Description of Discontinuities in Rock Masses. In Rock Characterization, Testing and Monitoring—ISRM Suggested Methods; Brown, E.T., Ed.; Pergamon Press: Oxford, UK, 1981; pp. 3–52. [Google Scholar]
- Ünlüsoy, D.; Süzen, M.L. A new method for automated estimation of joint roughness coefficient for 2D surface profiles using power spectral density. Int. J. Rock Mech. Min. Sci. 2020, 125, 104156. [Google Scholar] [CrossRef]
- Grasselli, G.; Egger, P. Constitutive law for the shear strength of rock joints based on three-dimensional surface parameters. Int. J. Rock Mech. Min. Sci. 2003, 40, 25–40. [Google Scholar] [CrossRef]
- Beer, A.J.; Stead, D.; Coggan, J.S. Technical note estimation of the joint roughness coefficient (JRC) by visual comparison. Rock Mech. Rock Eng. 2002, 35, 65–74. [Google Scholar] [CrossRef]
- Wu, X.; Zheng, H.; Jiang, Y. Influence of joint roughness on the shear properties of energy-absorbing bolt. Int. J. Rock Mech. Min. 2023, 163, 105322. [Google Scholar] [CrossRef]
- Jang, H.-S.; Kang, S.-S.; Jang, B.-A. Determination of joint roughness coefficients using roughness parameters. Rock Mech. Rock Eng. 2014, 47, 2061–2073. [Google Scholar] [CrossRef]
- El-Soudani, S.M. Profilometric analysis of fractures. Metallography 1978, 11, 247–336. [Google Scholar] [CrossRef]
- Zhang, G.; Karakus, M.; Tang, H.; Ge, Y.; Zhang, L. A new method estimating the 2D joint roughness coefficient for discontinuity surfaces in rock masses. Int. J. Rock Mech. Min. Sci. 2014, 72, 191–198. [Google Scholar] [CrossRef]
- Mo, P.; Li, Y. Estimating the three-dimensional joint roughness coefficient value of rock fractures. Bull. Eng. Geol. Environ. 2019, 78, 857–866. [Google Scholar] [CrossRef]
- Ankah, M.L.Y.; Sunkpal, D.T.; Zhao, X.; Kulatilake, P.H.S.W. Role of heterogeneity on joint size effect, and influence of anisotropy and sampling interval on rock joint roughness quantification. Geomech. Geophys 2022, 8, 101. [Google Scholar] [CrossRef]
- McGough, M.; Kimes, L.; Harris, A.; Kreidl, O.P.; Hudyma, N. Investigation of roughness algorithms applied to jrc profiles for assessment of weathering. In Proceedings of the 49th US Rock Mechanics/Geomechanics Symposium, San Francisco, CA, USA, 29 June–1 July 2015. [Google Scholar]
- Belem, T.; Souley, M.; Homand, F. Modeling surface roughness degradation of rock joint wall during monotonic and cyclic shearing. Acta Geotech. 2007, 2, 227–248. [Google Scholar] [CrossRef]
- Liu, Q.; Tian, Y.; Liu, D.; Jiang, Y. Updates to JRC-JCS model for estimating the peak shear strength of rock joints based on quantified surface description. Eng. Geol. 2017, 228, 282–300. [Google Scholar] [CrossRef]
- Grasselli, G. Shear Strength of Rock Joints Based on Quantified Surface Description. Ph.D. Thesis, Ecole Polytechnique Federale de Lausanne, Lausanne, Switzerland, 2001. [Google Scholar]
- Li, Y.; Zhang, Y. Quantitative estimation of joint roughness coefficient using statistical parameters. Int. J. Rock Mech. Min. 2015, 100, 27–35. [Google Scholar] [CrossRef]
- Yang, Z.; Di, C.; Yen, K. The effect of asperity order on the roughness of rock joints. Int. J. Rock Mech. Min. 2001, 38, 745–752. [Google Scholar] [CrossRef]
- Gravanis, E.; Pantelidis, L. Determining of the Joint Roughness Coefficient (JRC) of Rock Discontinuities Based on the Theory of Random Fields. Geosci. J. 2019, 9, 295. [Google Scholar] [CrossRef]
- Mandelbrot, B.B. Self-affine fractals and fractal dimension. Phys. Scr. 1985, 32, 257. [Google Scholar] [CrossRef]
- Orey, S. Gaussian sample functions and the Hausdorff dimension of level crossings. Z. Für Wahrscheinlichkeitstheorie Und Verwandte Geb. 1970, 15, 249–256. [Google Scholar] [CrossRef]
- Berry, M.V.; Lewis, Z.; Nye, J.F. On the Weierstrass-Mandelbrot fractal function. Proc. R. Soc. Lond. A Math. Phys. Sci. 1980, 370, 459–484. [Google Scholar]
- Malinverno, A. A simple method to estimate the fractal dimension of a self-affine series. Geophys. Res. Lett. 1990, 17, 1953–1956. [Google Scholar] [CrossRef]
- Power, W.L.; Tullis, T.E. Euclidean and fractal models for the description of rock surface roughness. J. Geophys. Res. Solid 1991, 96, 415–424. [Google Scholar] [CrossRef]
- Poon, C.; Sayles, R.; Jones, T. Surface measurement and fractal characterization of naturally fractured rocks. J. Phys. D 1992, 25, 1269. [Google Scholar] [CrossRef]
- Fardin, N.; Stephansson, O.; Jing, L. The scale dependence of rock joint surface roughness. Int. J. Rock Mech. Min. 2001, 38, 659–669. [Google Scholar] [CrossRef]
- Kulatilake, P.H.S.W.; Du, S.-G.; Ankah, M.L.Y.; Yong, R.; Sunkpal, D.T.; Zhao, X.; Liu, G.-J.; Wu, R. Non-stationarity, heterogeneity, scale effects, and anisotropy investigations on natural rock joint roughness using the variogram method. Bull. Eng. Geol. Environ. 2021, 80, 6121–6143. [Google Scholar] [CrossRef]
- Kulatilake, P.H.S.W.; Um, J.; Panda, B.B.; Nghiem, N. Development of new peak shear-strength criterion for anisotropic rock joints. J. Eng. Mech. 1999, 125, 1010–1017. [Google Scholar] [CrossRef]
- Fardin, N. Influence of structural non-stationarity of surface roughness on morphological characterization and mechanical deformation of rock joints. Rock Mech. Rock Eng. 2008, 41, 267–297. [Google Scholar] [CrossRef]
- Jiang, Q.; Feng, X.; Gong, Y.; Song, L.; Ran, S.; Cui, J. Reverse modelling of natural rock joints using 3D scanning and 3D printing. Comput. Geotech. 2016, 73, 210–220. [Google Scholar] [CrossRef]
- Ge, Y.; Lin, Z.; Tang, H.; Zhao, B.; Chen, H.; Xie, Z.; Du, B. Investigation of the effects of nonstationary features on rock joint roughness using the laser scanning technique. Bull. Eng. Geol. Environ. 2020, 79, 3163–3174. [Google Scholar] [CrossRef]
- Swan, G.; Zongqi, S. Prediction of shear behaviour of joints using profiles. Rock Mech. Rock Eng. 1985, 18, 183–212. [Google Scholar] [CrossRef]
- Cravero, M.; Iabichino, G.; Ferrero, A.M. Evaluation of joint roughness and dilatancy of schistosity joints. In Rock mechanics-a challenge for society. In Proceedings of the ISRM Regional Symposium EUROCK 2001, Espoo, Finland, 4–7 June 2001; pp. 217–222. [Google Scholar]
- Cravero, M.; Iabichino, G.; Piovano, V. Analysis of large joint profiles related to rock slope instabilities. In Proceedings of the 8th ISRM Congress, Tokyo, Japan, 25–29 September 1995. [Google Scholar]
- Lanaro, F.; Jing, L.; Stephansson, O. Scale dependency of roughness and stationarity of rock joints. In Proceedings of the 9th ISRM Congress, Paris, France, 25–28 August 1999. [Google Scholar]
- Leal-Gomes, M.J.A. Some new essential questions about scale effects on the mechanics of rock mass joints. In Proceedings of the 10th ISRM Congress, Sandton, South Africa, 8–12 September 2003; The South African Institute of Mining & Metallurgy: Johannesburg, South Africa, 2003. [Google Scholar]
- Ge, Y.; Tang, H.; Eldin, M.M.E.; Chen, P.; Wang, L.; Wang, J. A description for rock joint roughness based on terrestrial laser scanner and image analysis. Sci. Rep. 2015, 5, 16999. [Google Scholar] [CrossRef]
- Chen, S.J.; Zhu, W.C.; Yu, Q.L.; Liu, X.G. Characterization of Anisotropy of Joint Surface Roughness and Aperture by Variogram Approach Based on Digital Image Processing Technique. Rock Mech. Rock Eng. 2016, 49, 855–876. [Google Scholar] [CrossRef]
- Bao, H.; Xu, X.; Lan, H.; Zhang, G.; Yin, P.; Yan, C.; Xu, J. A new joint morphology parameter considering the effects of micro-slope distribution of joint surface. Eng. Geol. 2020, 275, 105734. [Google Scholar] [CrossRef]
- Chen, X.; Zeng, Y.; Ye, Y.; Sun, H.; Tang, Z.; Zhang, X. A Simplified form of Grasselli’s 3D Roughness Measure θmax*/(C + 1). Rock Mech. Rock Eng. 2021, 54, 4329–4346. [Google Scholar] [CrossRef]
- Tang, Z.C.; Jiao, Y.Y.; Wong, L.N.Y.; Wang, X.C. Choosing appropriate parameters for developing empirical shear strength criterion of rock joint: Review and new insights. Rock Mech. Rock Eng. 2016, 49, 4479–4490. [Google Scholar] [CrossRef]
- Pickering, C.; Aydin, A. Modeling roughness of rock discontinuity surfaces: A signal analysis approach. Rock Mech. Rock Eng. 2016, 49, 2959–2965. [Google Scholar] [CrossRef]
- Li, Y.; Xu, Q.; Aydin, A. Uncertainties in estimating the roughness coefficient of rock fracture surfaces. Bull. Eng. Geol. Environ. 2017, 76, 1153–1165. [Google Scholar] [CrossRef]
Disclaimer/Publisher’s Note: The statements, opinions and data contained in all publications are solely those of the individual author(s) and contributor(s) and not of MDPI and/or the editor(s). MDPI and/or the editor(s) disclaim responsibility for any injury to people or property resulting from any ideas, methods, instructions or products referred to in the content. |
© 2023 by the authors. Licensee MDPI, Basel, Switzerland. This article is an open access article distributed under the terms and conditions of the Creative Commons Attribution (CC BY) license (https://creativecommons.org/licenses/by/4.0/).

