Article

Comparative Analysis of Non-Pneumatic Tire Spoke Designs for Off-Road Applications: A Smoothed Particle Hydrodynamics Perspective

by
Charanpreet Sidhu
and
Zeinab El-Sayegh
*
Faculty of Engineering and Applied Science, Ontario Tech University, Oshawa, ON L1G 0C5, Canada
*
Author to whom correspondence should be addressed.
Geotechnics 2024, 4(2), 549-563; https://doi.org/10.3390/geotechnics4020030
Submission received: 6 May 2024 / Revised: 25 May 2024 / Accepted: 1 June 2024 / Published: 5 June 2024

Abstract

:
This study explores the development of a terramechanics-based model for non-pneumatic tire–terrain interaction, focusing on different spoke designs. The research investigates how four spoke shapes (honeycomb, modified honeycomb, re-entrant honeycomb, and straight spokes) affect non-pneumatic tire performance in off-road conditions. Using the finite element method (FEM) to model non-pneumatic tires, and smoothed-particle hydrodynamics (SPH) to model dry, loose soil, simulations were conducted to replicate real-world loading conditions. This study utilizes virtual environment solution finite element analysis software to examine the interaction between a non-pneumatic tire and dry, loose soil, with a focus on calculating longitudinal and vertical forces. These forces play a pivotal role in determining the motion resistance coefficient. The results show distinct variations in the motion-resistance coefficients among the spoke designs on dry, loose soil. This analysis helps to identify the spoke configurations that optimize energy efficiency and fuel consumption. By comparing and evaluating the four spoke designs, this study shows the effect of spoke design on tire motion resistance. This study concluded that the modified honeycomb spoke design is the most stable and the least sensitive to operating conditions.

1. Introduction

This study focuses on advancing the understanding of non-pneumatic tire performance in off-road environments through a terramechanics-based approach. Terramechanics is a field of study that deals with the interaction between terrain and vehicles, providing insights into how different terrains affect vehicle performance. The research specifically looks at how different spoke designs influence the performance of non-pneumatic tires in off-road conditions. Non-pneumatic tires are innovative alternatives to traditional pneumatic tires, offering benefits such as increased durability and resistance to punctures. To ensure the accuracy of the model predictions, the performance of a non-pneumatic tire in dry, loose soil must undergo validation. This study employs virtual performance solution–FEM software to analyze the interaction between a non-pneumatic tire and dry, loose soil, calculating longitudinal, and vertical forces, and the motion resistance coefficient. Prior research by Sidhu et al., El-Sayegh et al., and Wong [1,2,3,4,5] described the dry, loose soil used in this study for the off-road terrain modeling using the mesh-free particle technique and described the experimental tools used to calculate the normal and shear stresses employed on the terrain. The direct shear box test computes the used shear stress, whereas the pressure–sinkage test, also called the plate penetration test, establishes the normal stress.
In 2023, Phromjan et al. [6] investigated the use of non-pneumatic tires in agricultural machinery to reduce soil compaction compared to conventional pneumatic tires. The study employed experimental, empirical, and numerical methods to assess the impact of non-pneumatic tires on soil compaction. Various tire designs, including random pneumatic tires and original- and reduced-spoke non-pneumatic tires, were examined experimentally. In 2023, Sardinha et al. provided a comprehensive overview of the current state of the mechanical design and development of non-pneumatic tire research and identified the key research areas [7]. In 2022, Islam et al. [8] investigated the applicability of continuum scale methods, specifically Eulerian smoothed particle hydrodynamics and total Lagrangian smoothed particle hydrodynamics, to small-scale systems by comparing them with atomistic-scale molecular dynamics simulations. In 2022, Andriya et al. [9] explored the application of a tailored 3D printing system for producing economical and functional rapid prototypes of non-pneumatic tires using a thermoplastic polyurethane (TPU) material and the fused deposition modeling (FDM) technique. The research aimed to assess the viability of incorporating TPU-based auxetic structures into non-pneumatic tires. In their 2021 study set-up, Liang et al. [10] proposed a non-linear radial stiffness of the spoke that could more accurately describe the structural performance of the non-pneumatic tire. In 2021, Sim et al. [11] analyzed the vertical stiffness characteristics of a commercial non-pneumatic tire, comparing three tire models with modified spoke shapes to a reference model. The models included a fillet-applied model, an asymmetric-spoke division model, and a symmetric-spoke division model. In 2020, Wang et al. [12] conducted a series of experiments to evaluate the feasibility of using TPU materials and FDM technology for 3D printing non-pneumatic tires. They studied the TPU material printing process through tensile testing and scanning electron microscopy (SEM) observation. The results indicated that the optimal 3D printing temperature for the selected TPU material was found to be 210 °C. The same year, Phromjan et al. [13] proposes a simplified approach to modeling and analyzing airless tires by modifying the steel belt layers. The Mooney–Rivlin hyperelastic model was employed to describe the material properties of the tread and spoke components, with constitutive model constants obtained through standardized tensile and compressive tests. In 2019, Du et al. [14] worked on the grounding characteristics of a non-pneumatic mechanical tire design and compared it with an inflatable tire. The stiffness tests were carried out to verify the accuracy of the simulation models. In the same year, 2018, Jin et al. [15] inspected the static and dynamic behaviors of non-pneumatic tires with different honeycomb spokes. In 2017, Mohan et al. [16] introduced a new design for a non-pneumatic tire for vehicles to withstand challenging terrain. The proposed design consists of a combination of a flexible central hub and outer spokes made of a rigid material. In 2017, Sugiura et al. [17] extended the application of the Godunov SPH method to elastic dynamics by incorporating a deviatoric stress tensor. This tensor represents stress in situations involving shear deformation or anisotropic compression, which are common in elastic materials. In 2016, Marrone et al. [18] presented a novel algorithm for simulating free surface flows with significant front deformation and fragmentation. The algorithm combines a classical finite volume approach, with the smoothed particle hydrodynamics method. In 2015, Valizadeh et al. [19] focused on comparing two methods for treating solid wall boundaries in the weakly compressible SPH method. The first method is the boundary force particles proposed by Monaghan and Kajtar [20], while the second method involves layers of fixed boundary particles, initially introduced by Morris et al. [21] but later improved by Adami et al. [22]. Both methods are widely used in simulations. The study also examines the effect of density-diffusive terms proposed by Molteni et al. [23], later modified by Antuono et al. [24]. The authors conduct simulations, including the time-dependent spin-down of fluid within a cylinder, the behavior of fluid in a box subjected to constant acceleration at an angle to the walls, and a dam break over a triangular obstacle. The results indicate that the method of Adami et al. [22], combined with density diffusion, shows very satisfactory agreement with experimental results. In 2015, Litvinov et al. [25] discussed typical errors in smoothed particle hydrodynamics approximations of scalar field gradients and proposed a method to achieve partition of unity by relaxing particle distribution under a given pressure field and invariant particle volume, resulting in a distribution similar to liquid molecules. In 2013, Adami et al. [26] introduced a new algorithm to improve the standard, weakly compressible SPH method, which typically encounters issues such as particle clumping and void regions in high Reynolds number flows and under negative pressure conditions. In 1995, Swegle et al. [27] provided a comprehensive overview of the challenges and complexities associated with the stability of the SPH method, particularly in the context of large deformation events.
In this study, four designs for the spokes are considered (honeycomb, modified honeycomb, re-entrant honeycomb, and straight spokes) for non-pneumatic tire–terrain interaction performance metrics, such as motion resistance, which are critical in off-road applications where vehicles often encounter challenging terrain. The study employs the finite element method (FEM) to model non-pneumatic tires, simulating real-world loading conditions. Additionally, a dry, loose soil model is created using a mesh-free particle technique, providing a realistic representation of an off-road terrain through the calibration of the soil model using pressure–sinkage and shear-strength tests. The tire–terrain interaction is then analyzed at different operating conditions including a variation in normal force, linear velocity, and spoke designs. Simulation results reveal distinct variations in the motion resistance coefficients between the four spoke designs on dry, loose soil. By analyzing these variations, the study aims to identify spoke configurations that optimize performance metrics, ultimately leading to more efficient off-road vehicles. This study provides insights into the non-pneumatic tire–terrain motion resistance over dry, loose soil and acts as a criterion to select the best tire spoke design based on several operating conditions.

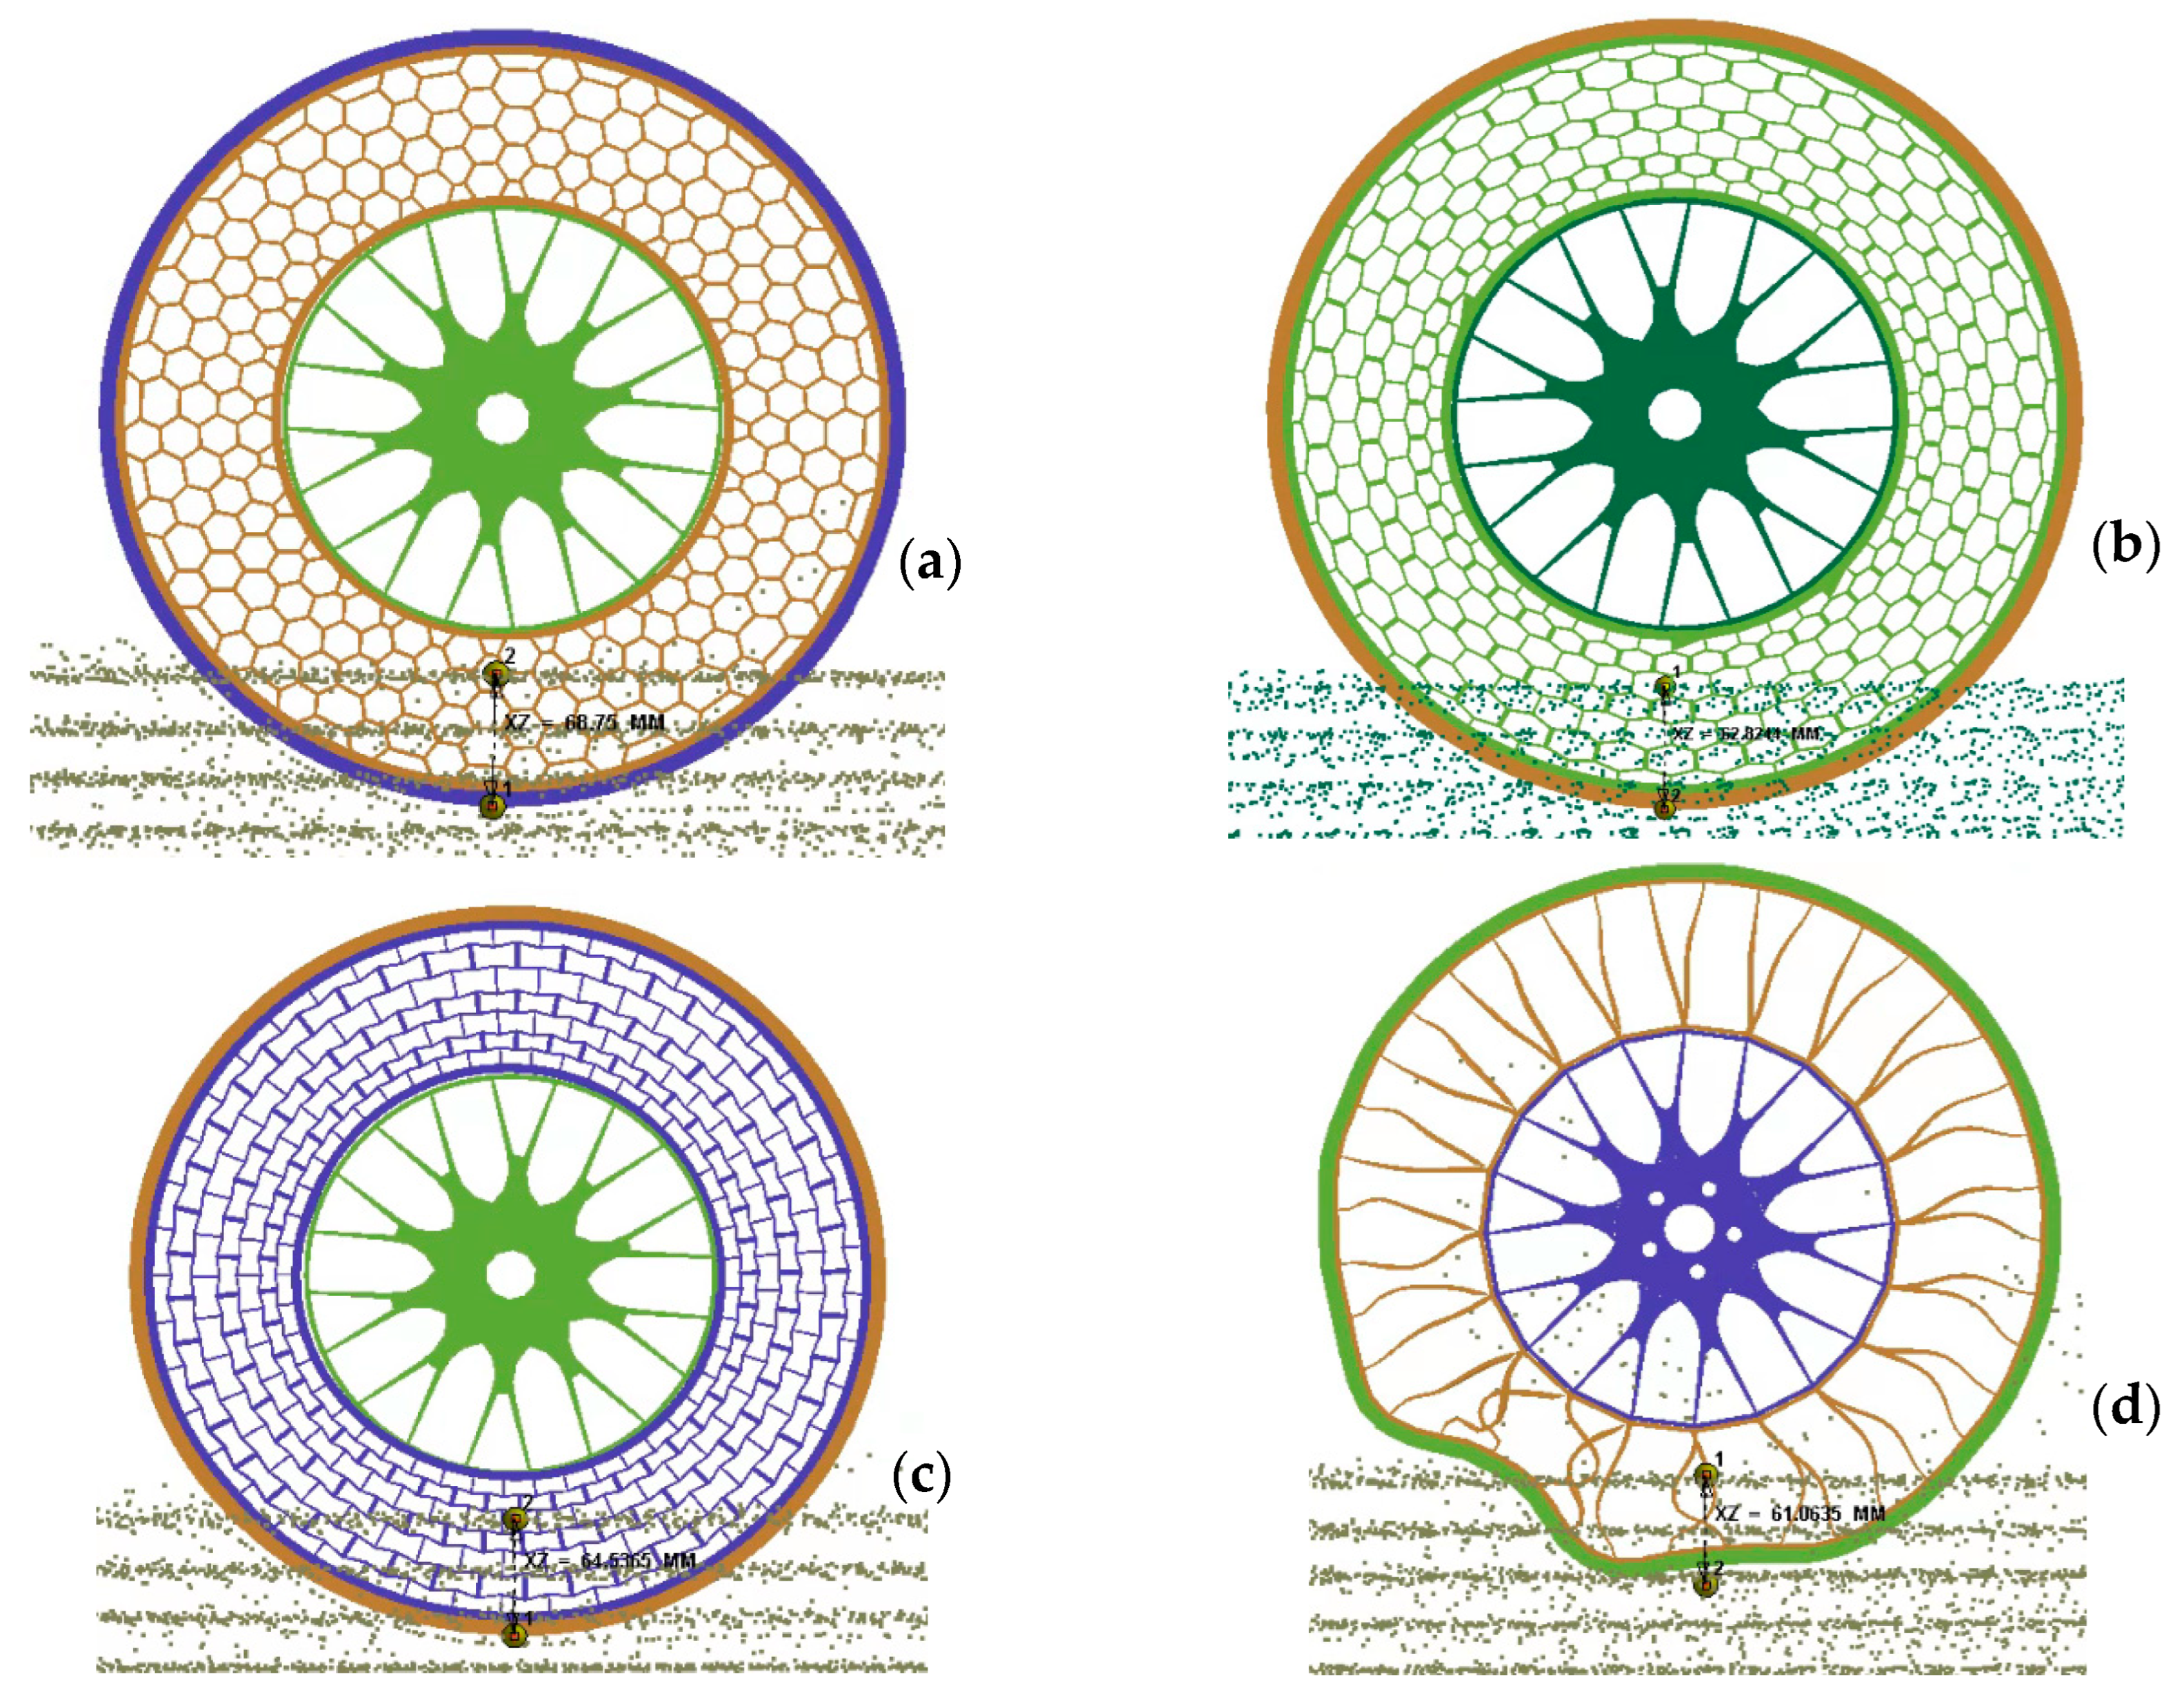
2. Non-Pneumatic Tire Spokes Modeling

Finite element analysis has emerged as a crucial tool in tire modeling, especially for the development of non-pneumatic tires. This study takes a comprehensive approach to analyzing and optimizing non-pneumatic tires using bald non-pneumatic tire designs [28].
Figure 1 shows the different parts of a bald non-pneumatic tire assembly which includes a hub, spoke, and shear beam. The study utilized bald tires to simplify the analysis and isolate the effect of the spokes on the tire–terrain interaction.
Unlike traditional tires with air-filled cavities, non-pneumatic tires typically employ the structure of an interconnected spokes system to support loads. The study investigates the impact on motion resistance between tire and soil under the influence of four different spokes’ shapes for off-road applications: honeycomb (Figure 2a), characterized by adjacent hexagons with an element length of 11 mm and a thickness of 2 mm; the modified honeycomb (Figure 2b) where hexagons increase in size from the center axle to the tire periphery; this design has a diverging angle of 8 degrees and a consistent element thickness of 2 mm, except for the elements adjacent to the center which are 4 mm thick. In this pattern, the non-vertical members form obtuse angles of 105 degrees with each adjacent member; the re-entrant honeycomb (Figure 2c) shares similarities with the modified honeycomb but has non-vertical members that form acute angles of 80 degrees with each other, has a diverging angle of 8 degrees and a consistent element thickness of 2 mm, except for the elements adjacent to the center, which are 4 mm thick; and finally, straight spokes (Figure 2d) as a benchmark included for comparison of the performance of the other spoke shapes. All these spokes are mounted on a standard non-pneumatic tire model (Figure 1, 15/6N6) which is constructed with a diameter of 416 mm and a width of 152 mm using the finite element virtual performance solution software.
The material selection for the non-pneumatic tire included three key components: the hub or rim, which is made of “Null Solid shell” material, spokes made of “Linear Visco-Elastic” material, and a shear beam made of “Mooney–Rivlin Solid” [1] material.
Since the hub is regarded as a rigid body that cannot deform or deflect, the “Null Solid Shell” material was chosen. The term “null solid” signifies that the material behaves like a solid element but with an insignificant thickness or volume. In simpler terms, it is a method of depicting a thin structure using solid elements instead of shell elements.
The non-pneumatic spokes are generally made of polyurethane materials, which are molded into the desired shape and do not require inflation, providing a maintenance-free and puncture-resistant alternative to pneumatic tires. In this case, the tire spokes are modeled using the “Linear Viscoelastic” material definition. The Zener model is utilized to model the linear response of the rubber compounds. Another explanation for the linear Zener model in the application of filled rubber compounds is the standard linear solid model. This linear Zener model is adopted to represent the stress relaxation phenomena of carbon-black reinforced rubber, particularly those used in tire rubber compounds. A linear viscoelastic material is one that responds to an applied load by exhibiting both elastic and viscous behavior, and whose response is linearly proportionate to the applied force. This indicates that a linear viscoelastic material’s stress–strain relationship is time-dependent and follows the linear viscoelasticity hypothesis. When a load is applied to a linear viscoelastic material, it initially responds elastically, with stress proportional to strain. However, as time passes, the material begins to flow and displays viscous behavior, with stress proportional to strain rate. The density of the spokes is considered to be around 1.5 × 10⁻⁹ ton/mm3, and the bulk modulus is about 400 MPa. In addition, the short-time shear modulus is 10 MPa and the long-time shear modulus is 1 MPa, while the decay constant is set to 1 s−1 [1].
The shear beam in non-pneumatic tires is typically constructed from relatively thick rubber materials and experiences shear stresses and sudden changes in curvature during operation. To accurately model these components, three-dimensional solid elements are necessary. The Mooney–Rivlin hyperelastic material allows for the inclusion of non-vanishing compressibility effects in the strain energy density function. To ensure reliable simulations for meaningful comparisons, the shear beam has a thickness of 8mm.
To calculate the spoke’s damping coefficient, the damping effect of the non-pneumatic tire must be considered, typically ranging from 5% to 70% of the critical damping as reported in prior studies [1]. It should be noted that applying damping to the tire sidewall (in this case, the spokes) is crucial to mimic the dynamic response of the tire and the energy dissipation that naturally occurs due to internal friction and material hysteresis. The spoke’s damping also provides stability during different FEA simulation analyses.
The critical frequency, ω , is usually calculated from an FEA simulation of the standard drum-cleat test where the tire is excited over a drum with a 15 mm diameter cleat. Assuming a damping ratio of 10%, the damping coefficient, C , is then calculated by multiplying the critical frequency in rad/s by the damping ratio. Table 1 shows the critical frequency and the damping coefficient of different spoke shapes.
It is noted that the straight spoke Tweel has the highest recorded critical frequency of about 48 Hz. The term “critical frequency” refers to the natural frequency at which a structure (in this case, tires) tends to vibrate when subjected to external forces. A high critical frequency means that the structure’s natural frequency of vibration is relatively high. In this case, the Tweel spoke design has a strong resistance to vibration or oscillation, particularly in response to dynamic loads such as wind, seismic activity, or machinery operation. On the other hand, the honeycomb spokes design has the lowest critical frequency at 25 Hz which is about 47% lower than the Tweel design.

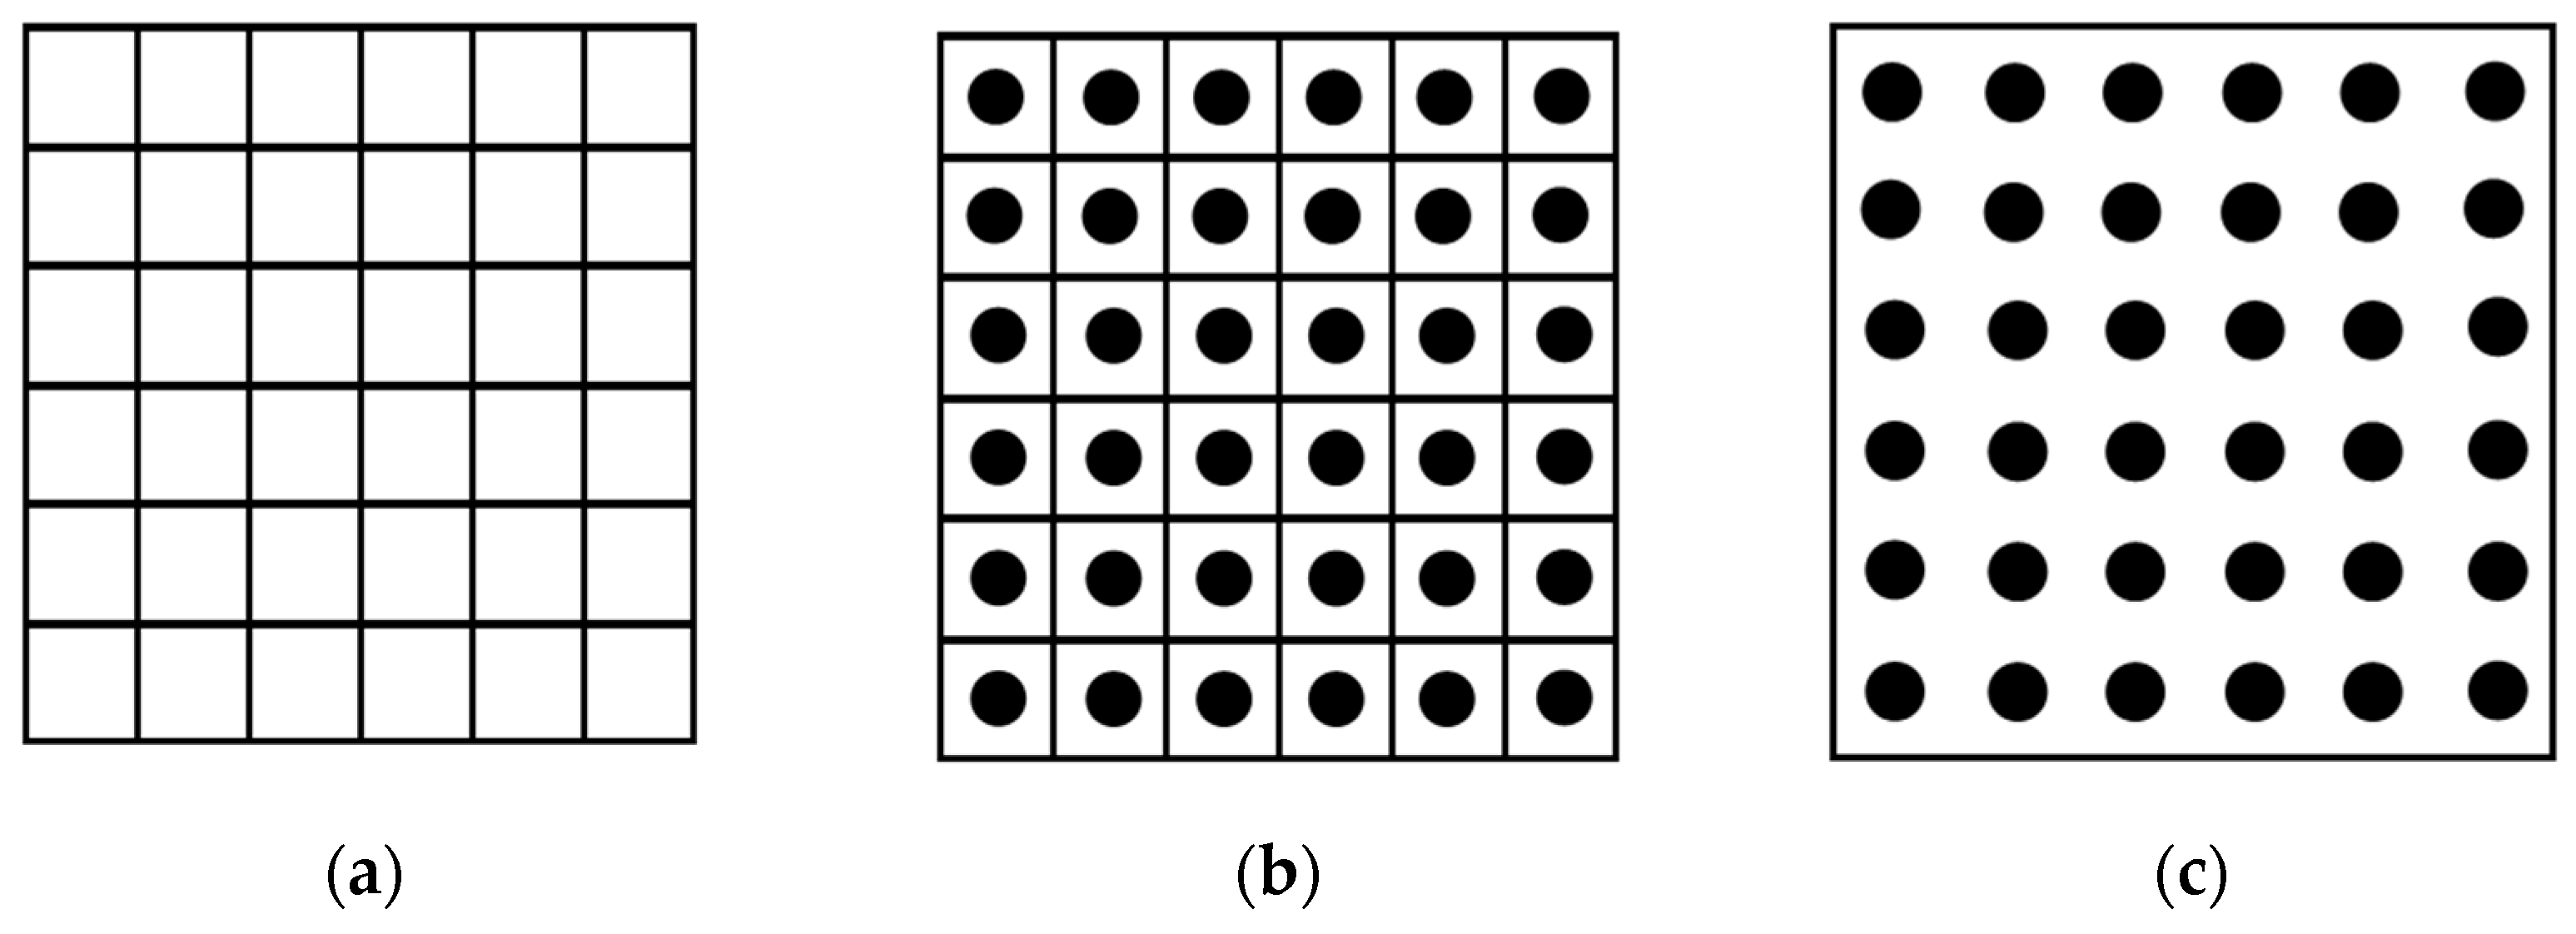
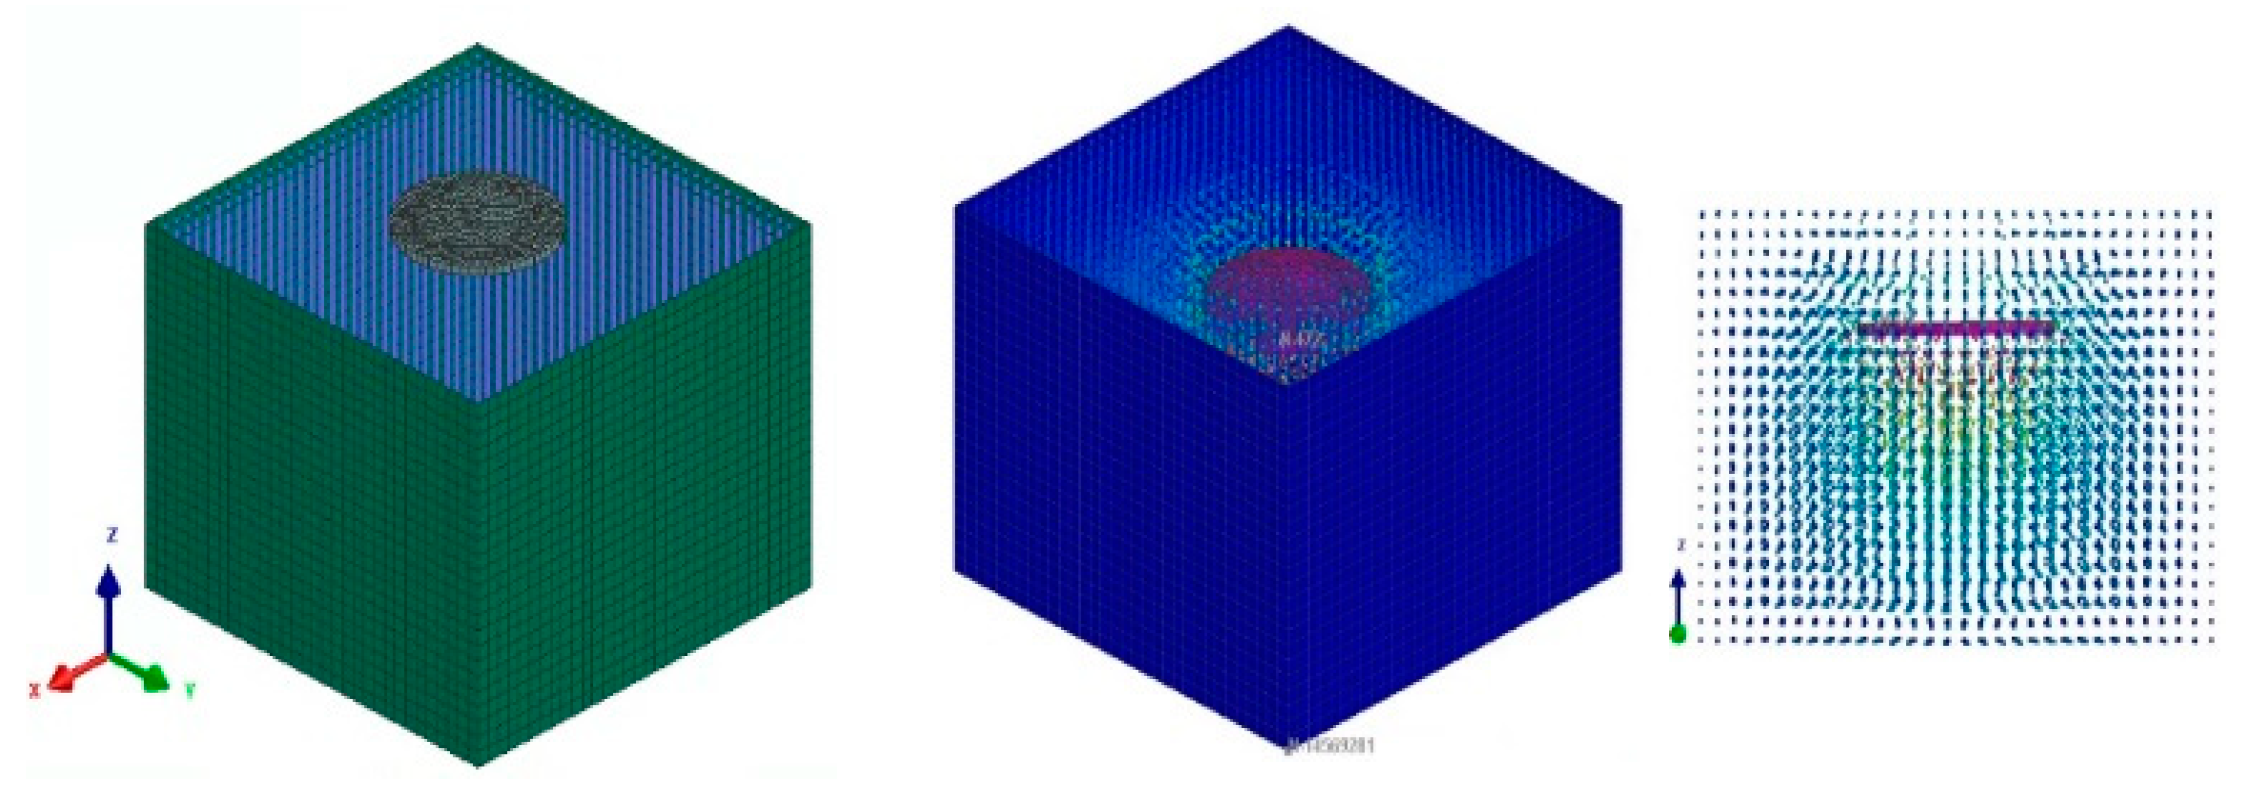
3. Soil Modeling and Calibration

In this study, dry, loose soil [3] is considered for off-road non-pneumatic tire–soil interaction analysis.
Figure 3 illustrates the smoothed particle hydrodynamics (SPH) conversion for a square mesh from a finite element mesh. To convert from FEM to particles, the first step is generating a mesh, as illustrated in Figure 3a. Each element within this mesh contains nodes where equations are solved. The FEM utilizes interpolation functions within each element to approximate the behavior of the material under analysis, in this case, soil. On the other hand, the particles in the SPH method do not rely on a mesh, they represent the continuum directly. These particles possess properties such as position, velocity, density, and pressure. Initially, these particles are distributed in space according to the simulation’s initial conditions. To transition from FEM to SPH, a mapping of information from FEM nodes to SPH particles is required, as depicted in Figure 3b. This mapping involves transferring the properties of finite element nodes, including displacement, stress, and strain, to their corresponding SPH particles. In SPH, interactions between particles are modeled using a kernel function. This function governs how each particle influences the properties of its neighbors. The resulting SPH particles, reflecting these interactions, are presented in Figure 3c.
The mesh-free particle technique is exploited to model the dry, loose soil in the virtual performance solution software, allowing for the simulation of soil property parameters. The mesh-free particle method involves a finite number of particles generated from an FEM mesh, as shown in Figure 3. Each particle is simulated to represent the center of an FEM square. The decision to transform the FEM soil model into the mesh-free particle technique, as described by [4], is motivated by the “sponge effect”. This effect refers to the attachment of soil elements and their limited interaction with elements outside their immediate vicinity, rendering FEM models inadequate for simulating soil undergoing significant deformation, as noted by [29]. As noted by [30], SPH presents a major advantage when modeling substantial non-cohesive materials like soil, liquid, and gas, especially when deformation or mixing is expected. All surrounding particles are impacted by particles within a certain range called the smoothing length. The mesh-free particle models can quickly solve large deformations and do not have fixed connections like FEM models do.
The virtual performance solution software includes SPH as a built-in module within its explicit finite element approach. The mass and momentum relationships, as outlined in the literature [4], and are expressed in Equations (1) and (2).
D ρ D t = 1 ρ v α x α  
D v α D t = 1 ρ σ α β x β + f α
where “α” and “β” represent the cartesian components in “x”, “y”, and “z” with the Einstein notation, “ρ” is the density, “v” is the velocity, “σαβ” is the total stress tensor of the particle, and “fα” is the component of acceleration due to an external force. The “D/Dt” operator is defined by Equation (3).
D D t = t + v α x α  
The total stress tensor is normally divided into two parts, the isotropic hydro-static pressure p, and deviatoric shear stress.
σ α β = p δ α β + s α β
The Kronecker’s delta, denoted as “δαβ”, equals one when α = β and zero when α ≠ β. The material behavior of the particle is often approximated using an “equation of state” that depends on density change. On the other hand, deviatoric shear stress is typically purely viscous and dependent on fluid models alone. The equation of state is determined by the material type defined in the virtual performance solution software. Material 7, known as isotropic elastic plastic hydrodynamic for solid and SPH elements in the virtual performance solver, is utilized in this research. This material is also known as a hydrodynamic elastic–plastic material. The hydrodynamic behavior of the soil particles can be described by the equation of state proposed by [4], international [31]:
p = c 0 + c 1 μ + c 2 μ 2 + c 3 μ 3 + ( c 4 + c 5 μ + c 6 μ 2 ) E i
Here, “c0” to “c6” are material constants, “Ei” represents internal energy, and μ = ρ ρ 0     1 is the ratio of current to initial mass density. Setting all “ci” to zero except for “c1” results in an elastic material with a bulk modulus of “c1”, as recommended by previous studies [4]. It is advised to maintain a particle smoothing length to a radius ratio between 1.3 and 2.1, a minimum smoothing length of 1, and a maximum smoothing length of 100. Additional viscosity-defining variables such as “Q1” quadratic bulk viscosity coefficient, “Q2” linear bulk viscosity coefficient, and “Q3” hourglass viscosity coefficient are listed in the material card.
Elastic bulk modulus (K) and shear modulus (G) can be calculated as follows:
K = E 3 1 2 ν
a n d
G = E 2 ( 1 + ν )
where Poisson’s ratio ( v ) is expressed. Prior to comprehending how non-pneumatic tires and dry, loose soil interact, shear strength and pressure–sinkage tests must be used to calibrate the simulant soil parameters. These tests are necessary for validating computational soil models as well as virtual testing to parameterize terramechanics models. In both tests, SPH materials are used to enhance predictions and outcomes. However, the FEM soil model has built-in limitations, especially when it comes to penetration during the shear-strength test. The pressure–sinkage test is used to calibrate the soil in the normal stress direction and the final material properties are shown in Table 2.
The physical characteristics of dry, loose soil which is presumptively dry with a moisture content of less than 0.5% can be observed in Figure 2. The characteristics serve as a reference point for adjusting the soil behavior.

3.1. Pressure–Sinkage Test and Results

The outcome of applying force on the surface of a plate is termed sinkage. In this investigation, SPH dry, loose soil particles are evenly dispersed across an 800 mm cubic region. A sturdy, rigid circular plate with a diameter of 150 mm is placed atop the soil container, subjecting it to pressures spanning from 0 kPa to 200 kPa. To establish a stable condition, the pressure is promptly applied, and the experiment continues for 0.4 s. The correlation between pressure and sinkage is subsequently established by fitting a curve to the collected sinkage data across different pressure levels. Figure 4 shows the soil box and the cut portion. The pressure–sinkage correlations are provided by earlier terramechanics research [3]. Given that soil is thought of as a homogeneous terrain, [31] proposed describing it using Equation (8).
p = k c b + k θ z n
The pressure–sinkage simulation results are compared with the solution from Equation (8), incorporating the terramechanics characteristics outlined in Table 3, which represent the properties of dry, loose soil as described by the literature [3]. Here, “z” represents the vertical displacement of the plate in millimeters, while “n”, “kc”, and “kθ” are parameters related to pressure–sinkage. Additionally, “p” denotes the pressure in kilopascals, and b signifies the smaller dimension of the contact patch, which could be either the width of a rectangular plate or the radius of a circular plate in millimeters. A graphical representation is presented in Figure 5, illustrating the pressure–sinkage relationship of both measured and simulated tests for dry, loose soil. The comparison reveals a similar trend between the two sets of data, as shown in Figure 5.

3.2. Shear Strength Test and Results

The interface between the non-pneumatic tire and the terrain involves shearing during rotation. It is crucial to understand how shear stress and shear translation of the terrain are related to predicting vehicle traction performance and side slip. Cohesion refers to the force binding particles in a material, while frictional cohesion requires normal pressure to keep particles together. The outcome of direct shear tests illustrates the relationship of shear strength. In dry, loose soil, shear stress initially rises quickly with shear displacement before stabilizing as displacement increases. The shear strength of dry soil also increases with normal load. An exponential function described in the literature [3] depicts this shear stress–shear displacement relationship.
τ = τ m a x ( 1 e j / k )
τ = ( c + σ t a n ) ( 1 e j / k )
Here, “k” is the shear deformation modulus, representing the shear displacement required to reach maximum shear stress, thus determining the shape of the shear curve. “τ” is shear stress, “j” is shear displacement, and “e” and “∅” are the cohesion and angle of internal shearing resistance of the terrain, respectively. The slope of the shear curve at the origin can be determined by differentiating “τ” with respect to “j” in Equation (10):
d τ d j   j = 0 = τ m a x k
τ m a x = c + σ t a n
Here, τ m a x presents the highest shear strength.
As depicted in Figure 6, the shear-strength test entails creating a rectangular box (400 × 200 × 240 mm) that is filled with soil particles. This box consists of three plates: a top plate subjected to pressure, an upper sliding plate, and a lower plate that is immobilized. The top plate undergoes a known pressure increment (50 kPa) up to 200 kPa, followed by a ramp displacement (10 mm/s) of the upper and top plates until the top box movement achieves 100 mm, from which the shearing force is estimated. The results obtained for the simulation are compared to experimental results obtained from the literature [3].
Figure 7 depicts a graph illustrating the relationship between shear strength and applied pressure in the shear-strength test. The measured values align closely with the simulated values, demonstrating an expected trend. The shear-strength test results show a good agreement between the measured and simulated results. The simulated internal friction angle is 27 degrees, while the measured angle is 28 degrees. The simulated cohesion coefficient is 4.5 kPa, whereas the measured value is 1 kPa. This difference can be attributed to the SPH particle definition, and further optimization is required to capture the proper cohesion. In general, dry sand is considered a non-cohesive soil and the cohesion is neglected for the purpose of this study.

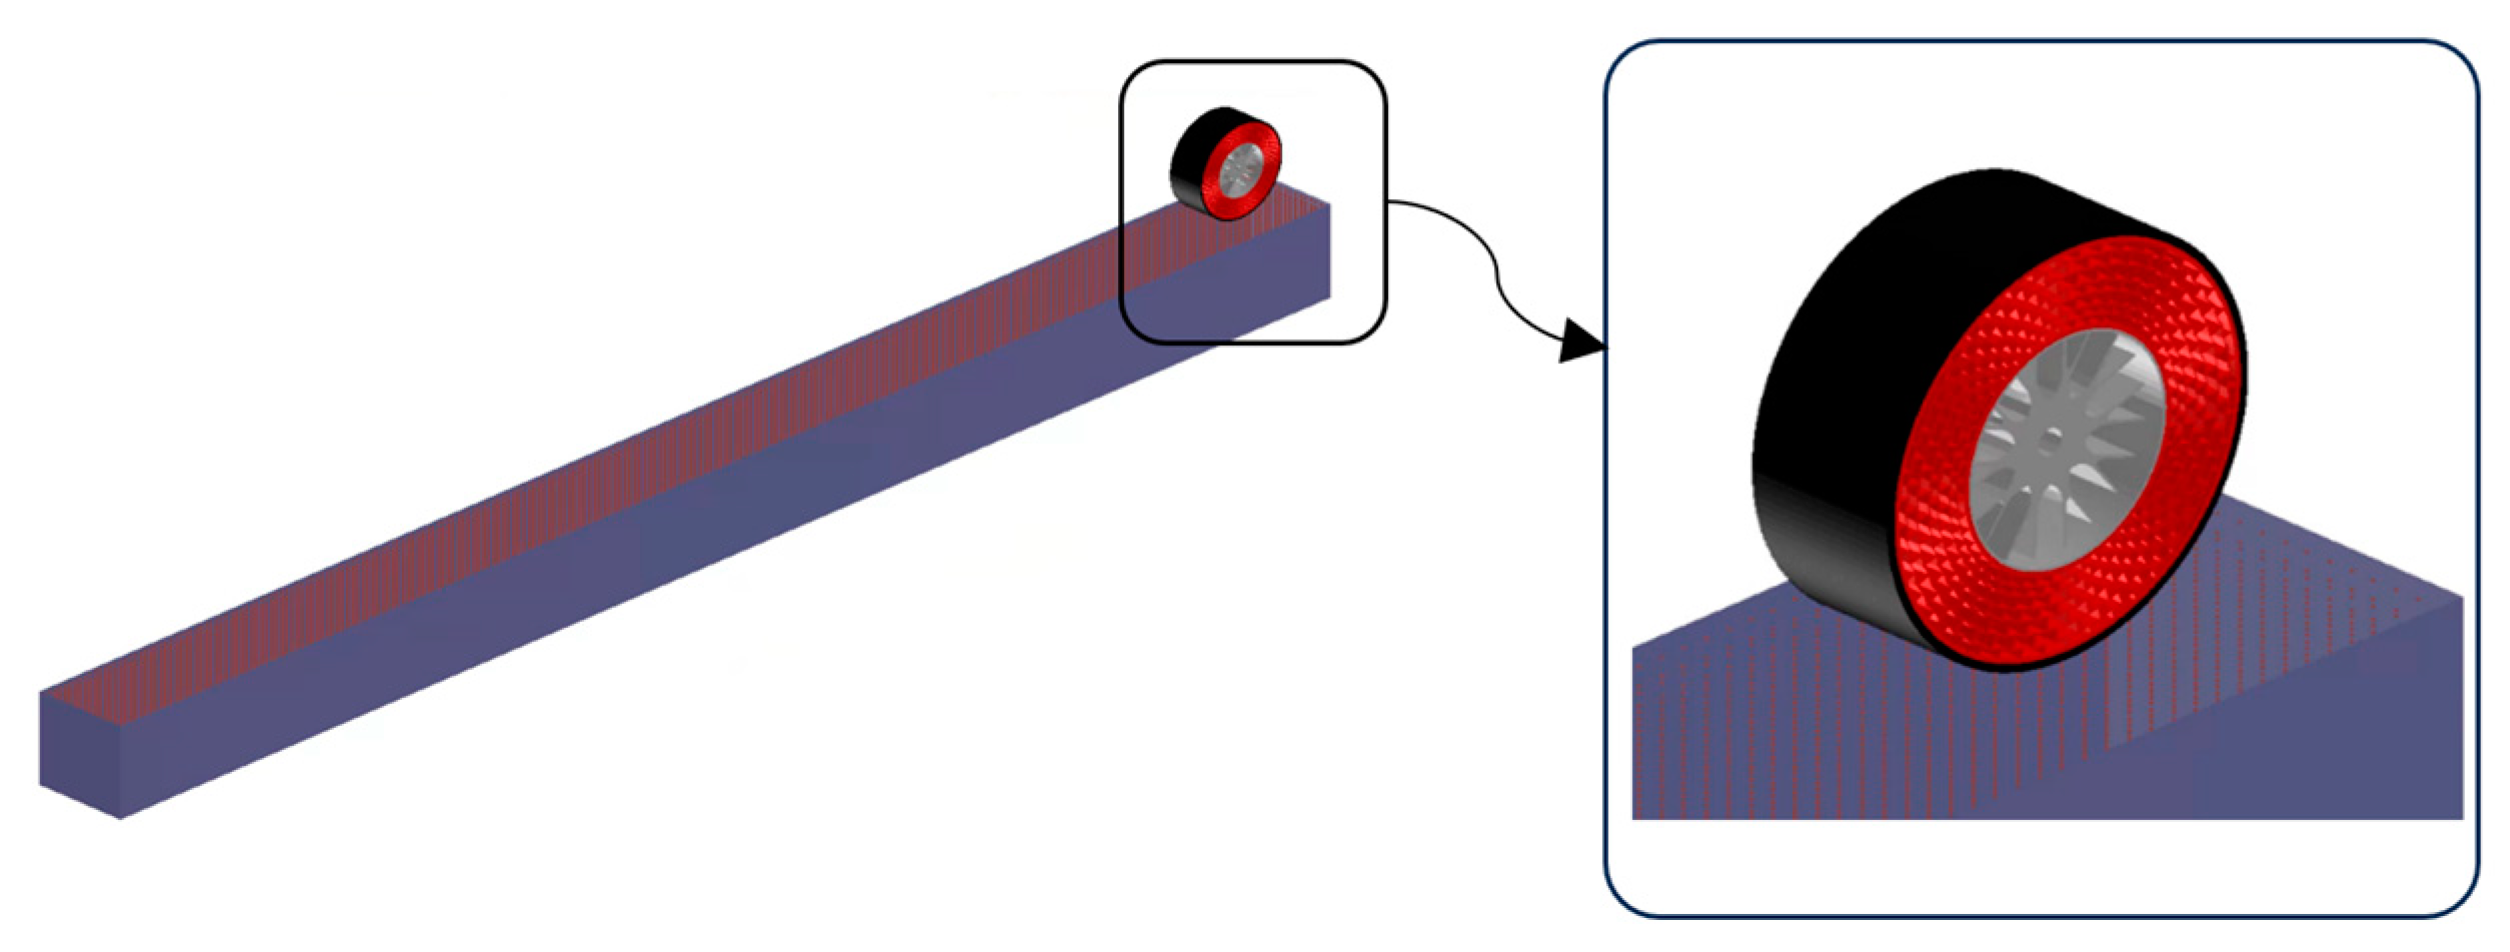
4. Non-Pneumatic Tire–Soil Interaction

Figure 8 shows the tire–soil interaction setup used to determine the motion resistance coefficient of the tire–soil interaction.
Both the non-pneumatic tire and dry, loose soil are inclined to deformation in the tire–terrain footprint when the tire revolves on the surface around its central axis. However, due to the tire’s elasticity, more tire material enters the contact patch during rotation. The normal force applied to the tire causes these spokes and tread to deform vertically within the contact footprint, but it returns to its original shape once it exits the patch depending on the tire speed and required recovery distance. The energy needed to deform the tire material is partly regained upon returning to its original shape, thanks to the tire material’s damping properties. Motion resistance, which opposes the vehicle’s movement, represents this energy loss. Thus, investigating the motion resistance in the non-pneumatic tire–terrain interaction with dry, loose soil is vital.
A model using the virtual performance solution software was developed to forecast the motion resistance coefficient in this interaction, as shown in Figure 8. The validated non-pneumatic tire model from [1] was integrated and placed on top of the container holding the dry, loose soil, as depicted in Figure 8.
In this simulation, the contact between the non-pneumatic tire and the dry, loose soil is defined as a non-symmetric node-to-segment contact with edge treatment. This type of contact modeling involves the interaction between a node and a segment, where the segment represents a linear entity—in this case, the tire. Edge treatment refers to how contact is handled along edges or lines in a mesh. In non-symmetric contact with edge treatment, specific methods are used to account for the asymmetry or non-uniformity of the contact conditions along these edges. This modeling approach is crucial for scenarios where the interaction between nodes and segments is not symmetrical, leading to varying conditions on either side of the contact interface. The edge treatment aspect ensures that these differences are properly addressed in the analysis. This is typically achieved by employing specialized algorithms or techniques to handle such non-symmetric contact situations accurately.
In this simulation setup, the tire is designated as the master component, while the soil is identified as the slave. A friction coefficient of 0.6 is applied between the tire and the soil, which simulates rubber-to-soil friction values. Initially, the tire settles on the soil to establish a solid contact patch. Subsequently, longitudinal velocity is applied to the tire’s center, allowing it to rotate over the loose soil. The tire can move along the longitudinal and normal axes (x-axis and z-axis) and turn about the lateral axis (y-axis).
In a motion resistance test, a normal force is applied at the centroid of the tire wheel, allowing it to stabilize on the terrain bin prior to applying a constant longitudinal velocity (2.7 m/s (10 kph), 4.2 m/s (15 kph), and 5.5 m/s (20 kph)) at the same tire centroid. The simulation is repeated under diverse conditions, including different velocities and normal forces (2 kN, 4 kN, and 6 kN). During the simulation, the tire revolves freely along an 8 m long road for 2 s, as shown in Figure 7. Data on the longitudinal force ( F X ) and normal force ( F Z ) were recorded over time at the contact patch between the tire and the terrain. The motion resistance coefficient (MRC) is determined by dividing ( F X ) by ( F Z ). The test is repeated at different operating conditions and for all four spoke types to investigate the influence of spoke design on motion resistance.
Figure 9 illustrates the density changes in dry, loose soil due to a modified honeycomb tire design running at 4.2 m/s under varying normal forces. Figure 9a depicts the density change at 2 kN of applied normal force, Figure 9b shows the change at 4 kN, and Figure 9c displays the change at 6 kN. It is important to note that the initial density of the dry soil was 1.44 × 10⁻⁹ ton/mm3. The maximum density recorded during the simulation was approximately 1.7 × 10⁻⁹ ton/mm3, observed at 6 kN of normal force towards the simulation’s end. For the non-pneumatic tire running with a 2 kN normal force, the maximum recorded density was about 1.5 × 10⁻⁹ ton/mm3. The change in soil density is primarily attributed to compaction and shear deformation induced by tire contact. The tire’s weight applies pressure on the soil surface, leading to compaction, which is evident across different applied normal forces. As the tire moves over the soil, it introduces shear forces that prompt soil particles to rearrange and deform. This deformation can cause soil densification, particularly in the areas of the highest pressure near the tire’s contact region.

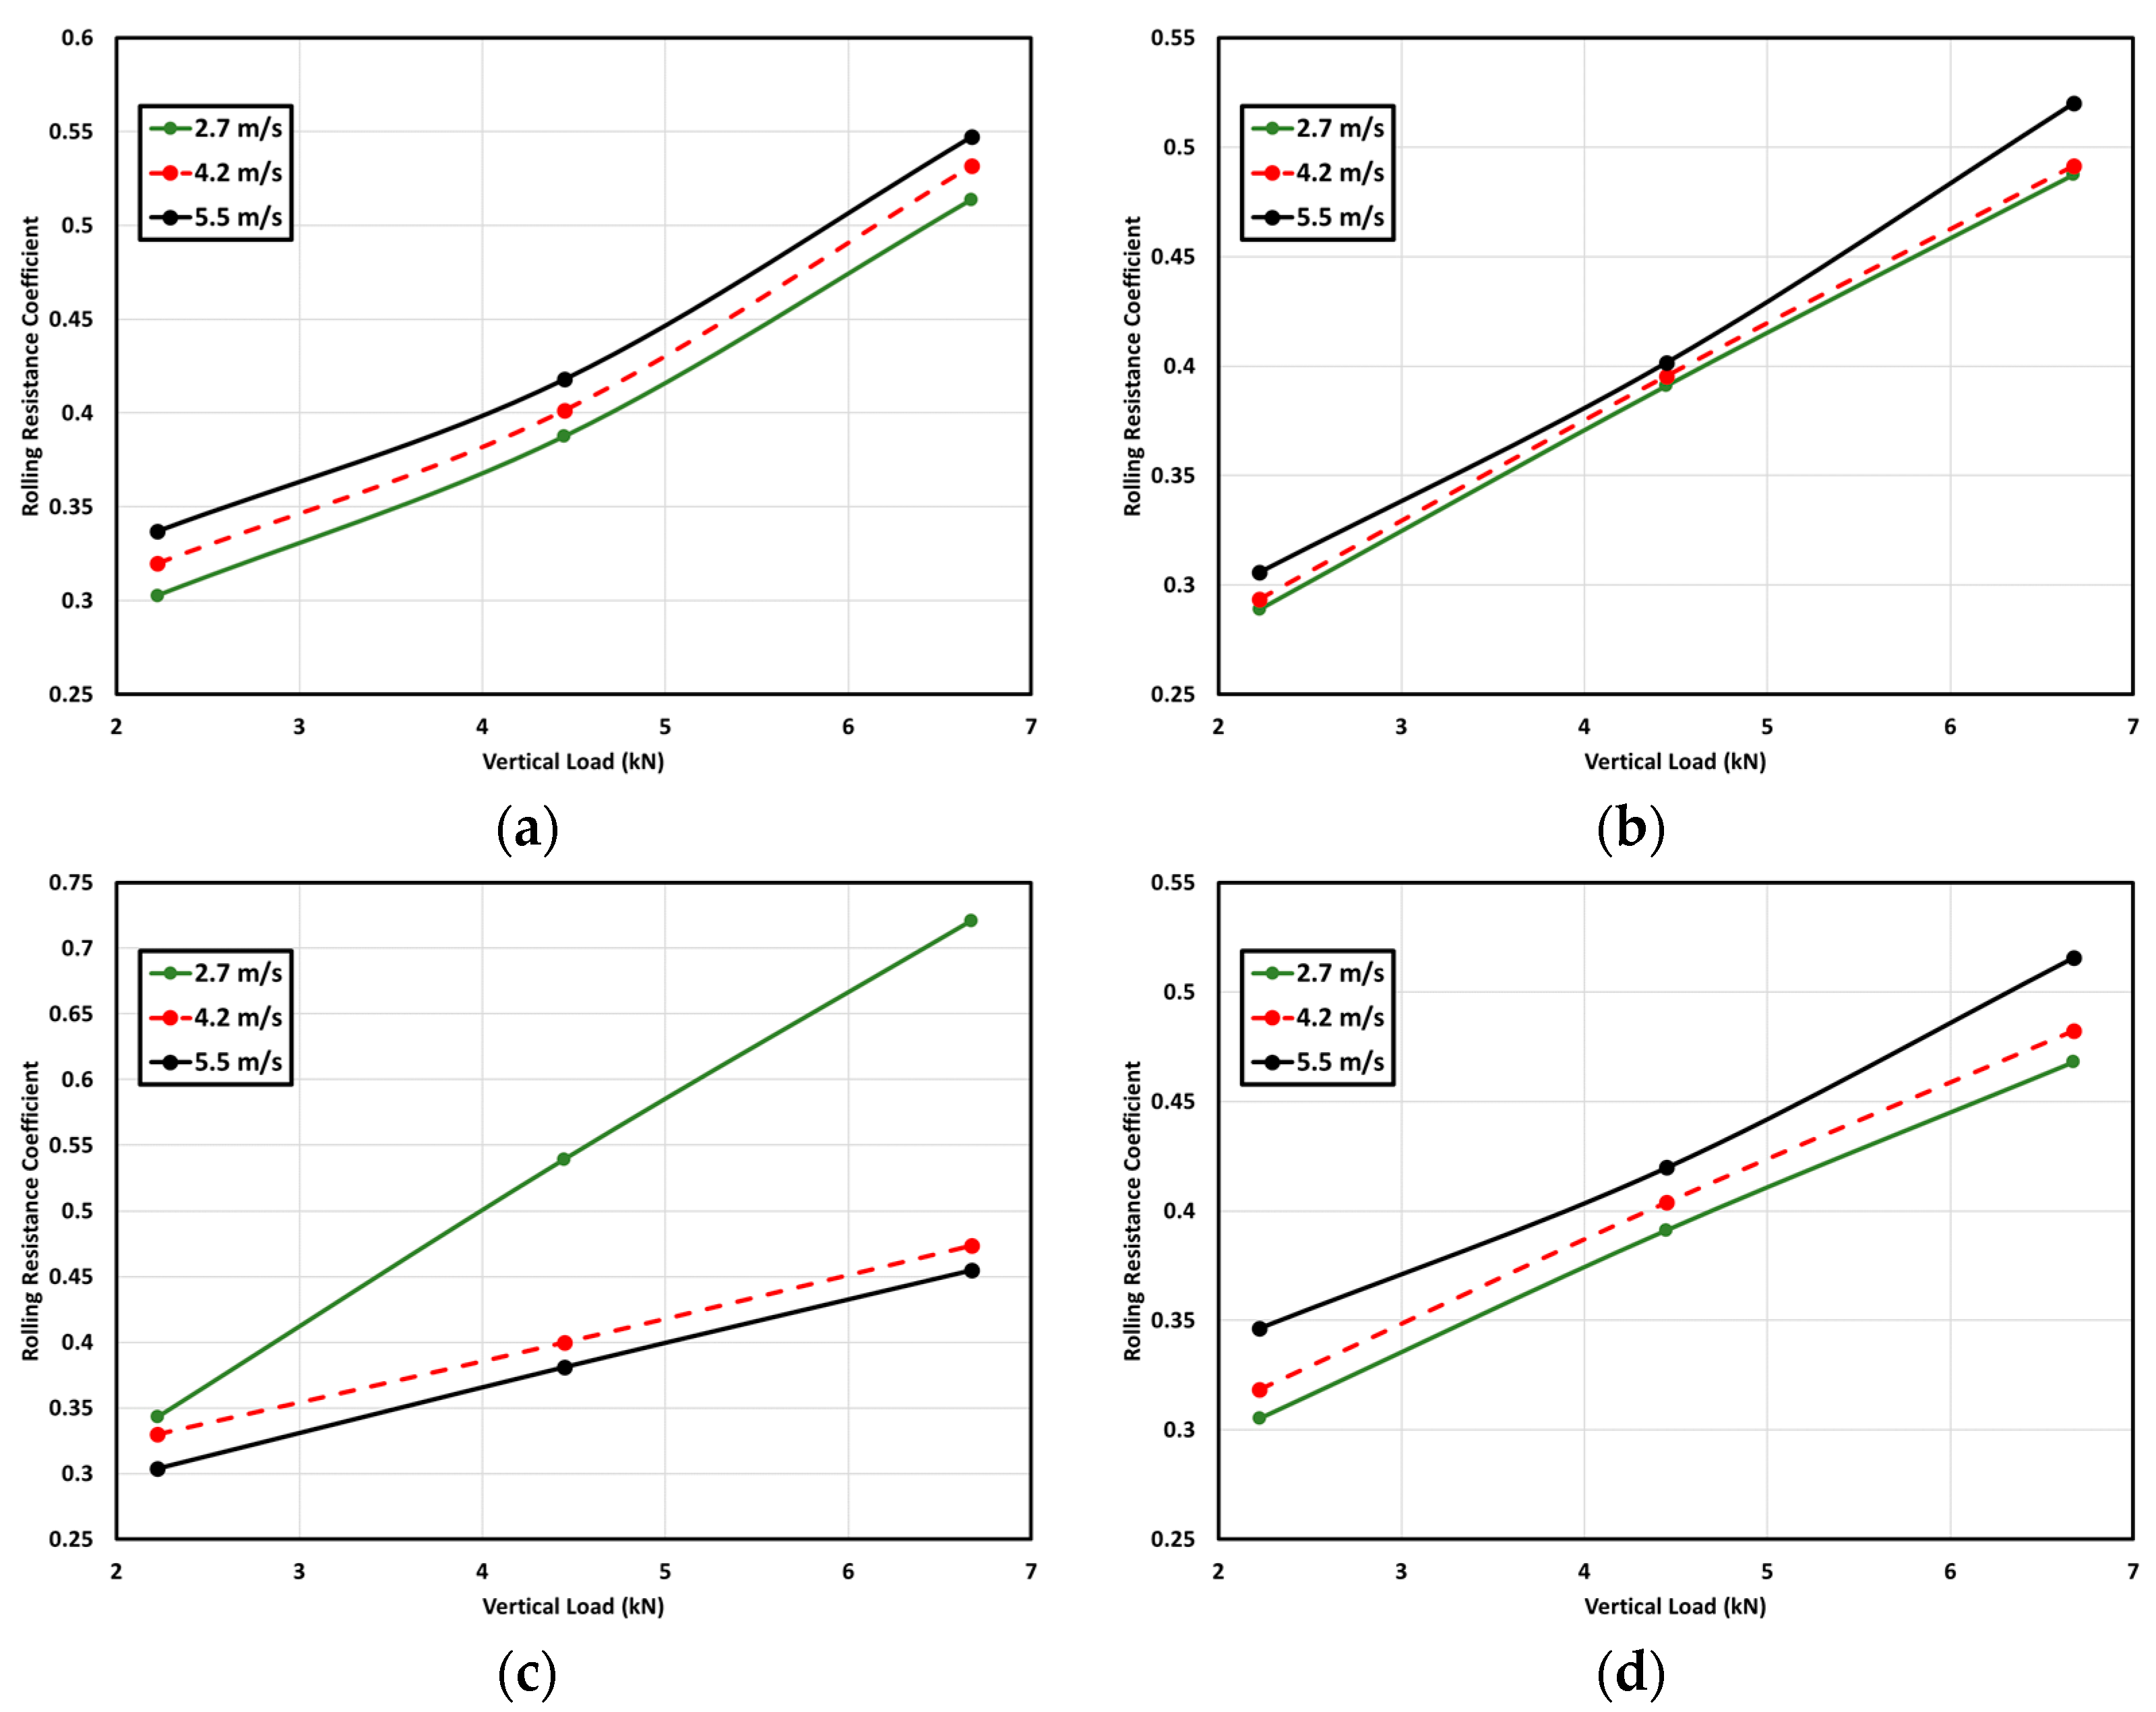
4.1. Effect of Normal Force and Velocity

In this section, the effect of normal force and linear velocity on the tire–soil interaction is investigated. Figure 10 illustrates how the motion resistance coefficient varies with normal force at different velocities.
The honeycomb spoke design shown in Figure 10a indicates that as the normal force on a non-pneumatic tire rises at a given velocity, the motion resistance coefficient also rises. For instance, at a velocity of 2.7 m/s, the normal force varies from 2 kN to 6 kN, resulting in motion resistance coefficients ranging from 0.3 to 0.51. Doubling the normal force to 4 kN at this velocity causes the motion resistance coefficient to increase by approximately 23% (from 0.31 to 0.38). A similar trend is observed at a velocity of 4.2 m/s, where the normal force varies from 2 kN to 6 kN, leading to motion resistance coefficients varying from 0.325 to 0.525. Doubling the normal force to 4 kN at this velocity results in a 23% increase in the motion resistance coefficient (from 0.325 to 0.4).
The modified honeycomb spoke design in Figure 10b demonstrates a similar trend where, as the normal force on a non-pneumatic tire rises at a given velocity, the motion resistance coefficient also rises. For example, at a velocity of 2.7 m/s, when the normal force is tripled to 6 kN, the motion resistance coefficient increases by 70% (from 0.28 to 0.48). Doubling the normal force to 4 kN at this velocity causes the motion resistance coefficient to increase by approximately 46% (from 0.28 to 0.38). A similar pattern is observed at velocities of 4.2 m/s and 5.5 m/s. It was noted that in the case of the modified honeycomb spoke design the effect of velocity was less than that compared to the traditional honeycomb spoke design. This could be attributed to the higher stability of the modified honeycomb spoke design. Another major contributor to the motion resistance coefficient is the amount of soil that enters the spokes; in the case of the honeycomb design, the cell has a 31.5 ° angle while the modified honeycomb has a wider angle of about 47°.
The re-entrant honeycomb spoke design in Figure 10c partially follows a comparable pattern, showing that as the normal force increases at a given velocity, the motion resistance coefficient increases. At lower velocities, such as 2.7 m/s, the increase in the motion resistance coefficient with normal force doubling is substantial, around 100%. However, at higher velocities, such as 5.5 m/s, the increase is less pronounced, about 50%. The re-entrant honeycomb spoke design is auxetic and has a negative Poisson ratio. The higher motion resistance forces noted at high normal forces and low longitudinal velocities may be due to the tire sinkage in the soil and the bulldozing effect. This observation is only applicable to the re-entrant honeycomb model at low velocities and high normal forces.
Finally, the straight spoke conventional Tweel design in Figure 10d exhibits a similar behavior, where an increase in normal force at a given velocity leads to an elevation in the motion resistance coefficient. The percentage increase in the coefficient with doubled normal force is around 52% to 55% across different velocities. In the case of the straight spoke design the effect of velocity on the motion resistance coefficient is in agreement with the modified honeycomb spoke design.
Overall, the honeycomb spoke design variants demonstrated varying degrees of sensitivity to normal force changes, with the re-entrant honeycomb design showing the most significant increase in motion resistance coefficient with increased normal force, especially at lower velocities. Moreover, the modified honeycomb design showed the least sensitivity to velocity which would make it more suitable for higher-velocity off-road applications. The effect of vertical loads on all models remains similar, proving that the stiffness of these tires is almost constant over soil.

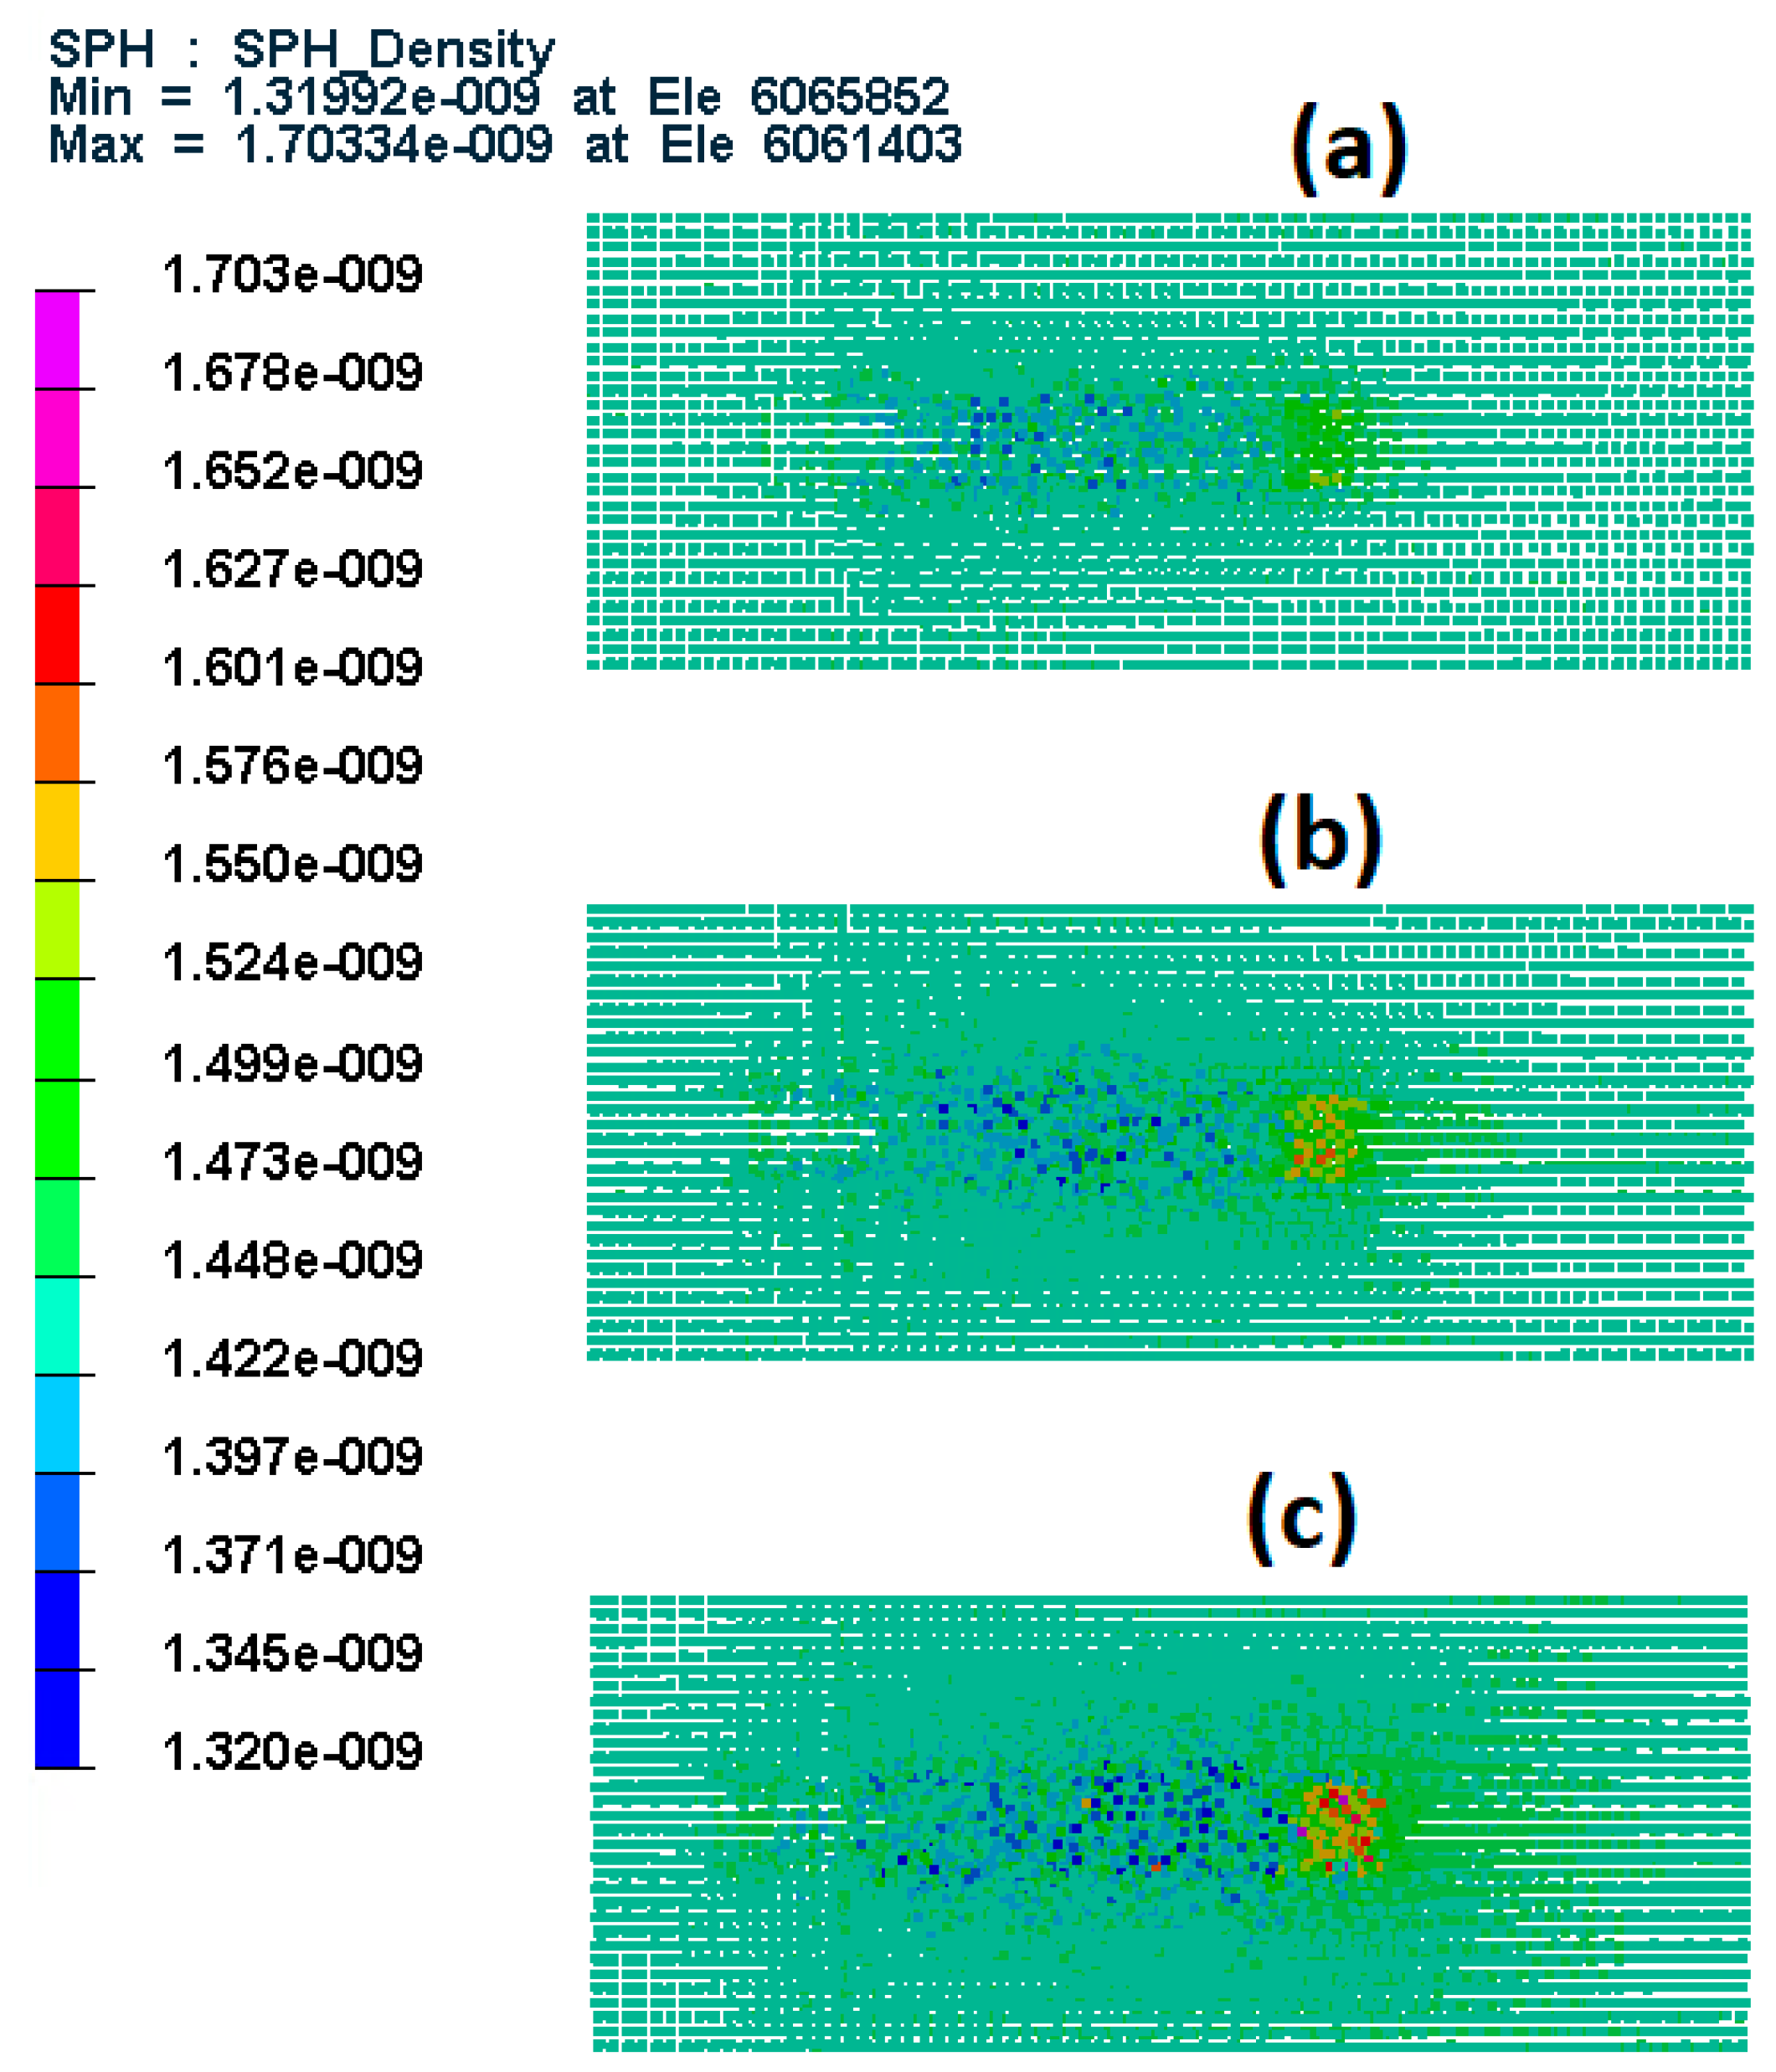
4.2. Tire Penetration in Soil

Figure 11 illustrates the soil penetration of tires under a normal force of 6 kN and a longitudinal velocity of 5.5 m/s, showcasing variations in penetration between the different spoke designs. It should be noted that the tire penetration in the soil is highly affected by the spokes’ geometric design and less affected by the tire stiffness, as all these tires exhibited a similar vertical stiffness. The non-pneumatic tires with honeycomb spokes penetrated the soil by 68.75 mm, while those with modified honeycomb spokes showed a slightly lesser penetration of 62.83 mm. The re-entrant honeycomb spokes resulted in a penetration depth of 65 mm, whereas the straight spoke Tweel design exhibited a penetration of 61 mm.
Furthermore, issues were noted with the straight spoke Tweel design, including spoke distortion and the formation of standing waves. These issues could potentially impact tire performance and durability, particularly in off-road conditions. These findings underscore the significant role that spoke design plays in non-pneumatic tire performance in off-road settings. The study emphasizes the importance of optimizing spoke configurations to enhance energy efficiency, reduce motion resistance, and improve tire performance overall. These insights could prove valuable for automotive manufacturers aiming to enhance the design of non-pneumatic tires for off-road use.

5. Conclusions

The study investigated the motion resistance of non-pneumatic tires on dry, loose soil, focusing on the effect of tire design, normal force, and longitudinal velocity. A simulation model using the virtual performance solution software was developed to predict the motion resistance coefficient, considering different tire designs like honeycomb, modified honeycomb, re-entrant honeycomb, and straight spoke Tweel. The non-pneumatic tire models were developed using finite element methods, while the dry soil was modeled using the smoothed particle hydrodynamics technique.
The findings revealed that the non-pneumatic tire’s elasticity permits additional tire material to enter the contact patch as it turns, leading to deformation that is partially recovered due to the tire’s damping properties. This deformation and recovery process contributes to motion resistance, which is crucial to understanding non-pneumatic tire performance. The study showed that the motion resistance coefficient can vary between 10% and 100% depending on the operating conditions and the spoke design selected. The study found that the motion resistance coefficient generally increases with normal force and tire velocity. However, the relationship varies depending on the tire design. For instance, the re-entrant honeycomb design showed a unique behavior with an initial decrease in motion resistance coefficient with velocity before reaching a given value, unlike the other designs which showed a steady increase.
Overall, the study provides valuable insights into the complex interaction between non-pneumatic tires and dry, loose soil, highlighting the importance of considering tire design, normal force, and velocity in predicting motion resistance. Also, it can be seen that the re-entrant honeycomb spoke design is a promising choice for non-pneumatic tires in off-road applications. Its performance in soil penetration, stability, and potential motion resistance tests makes it a strong candidate for further development and optimization in non-pneumatic tire design. Further research and testing could provide more insights into its performance and advantages over other spoke designs. These findings can inform the development of more efficient non-pneumatic tire designs for various applications, potentially leading to improvements in vehicle performance and energy efficiency.

Author Contributions

Conceptualization, Z.E.-S.; methodology, C.S.; validation, C.S.; formal analysis, C.S.; investigation, Z.E.-S.; writing—original draft, Z.E.-S. All authors have read and agreed to the published version of the manuscript.

Funding

This research received no external funding.

Data Availability Statement

The original contributions presented in the study are included in the article, further inquiries can be directed to the corresponding authors.

Conflicts of Interest

The authors declare no conflict of interest.

References

  1. Sidhu, C.; El-Sayegh, Z.; El-Gindy, M. Non-Pneumatic Tire-Road Interaction Using Finite Element Analysis. Int. J. Veh. Syst. Model. Test. 2023, 17, 52–66. [Google Scholar]
  2. Sidhu, C.; El-Sayegh, Z.; Ly, A. Non-pneumatic Tire-Mars Soil Interaction Using Advanced Computational Techniques. In Proceedings of the WCX SAE World Congress Experience, Detroit, MI, USA, 18–20 April 2023. [Google Scholar]
  3. Wong, J.Y. Theory of Ground Vehicles, 5th ed.; John Wiley & Sons: Hoboken, NJ, USA, 2022. [Google Scholar]
  4. El-Sayegh, Z.; El-Gindy, M.; Johansson, I.; Öijer, F. Improved tire-soil interaction model using FEA-SPH simulation. J. Terramech. 2018, 78, 53–62. [Google Scholar] [CrossRef]
  5. El-Sayegh, Z.; El-Gindy, M.; Johansson, I.; Öijer, F. Off-Road Soft Terrain Modeling Using Smoothed Particle Hydrodynamics Technique. In Proceedings of the ASME 2018 International Design Engineering Technical Conferences and Computers and Information in Engineering Conference, Quebec City, QC, Canada, 26–29 August 2018. Volume 3: 20th International Conference on Advanced Vehicle Technologies; 15th International Conference on Design Education, V003T01A030. [Google Scholar] [CrossRef]
  6. Phromjan, J.; Suvanjumrat, C. Non-pneumatic tire with curved isolated spokes for agricultural machinery in agricultural fields: Empirical and numerical study. Heliyon 2023, 9, e18984. [Google Scholar] [CrossRef] [PubMed]
  7. Sardinha, M.; Fátima Vaz, M.; Ramos, T.R.P.; Reis, L. Design, properties, and applications of non-pneumatic tires: A review. Proc. Inst. Mech. Eng. Part L J. Mater. Des. Appl. 2023, 237, 2277–2297. [Google Scholar] [CrossRef]
  8. Islam, M.R.I.; Ganesh, K.V.; Patra, P.K. On the equivalence of Eulerian Smoothed Particle Hydrodynamics, Total Lagrangian Smoothed Particle Hydrodynamics and molecular dynamics simulations for solids. Comput. Methods Appl. Mech. Eng. 2022, 391, 114591. [Google Scholar] [CrossRef]
  9. Andriya, N.; Dutta, V.; Vani, V.V. Study on 3D printed auxetic structure-based non-pneumatic tyres (NPT’S). Mater. Manuf. Process. 2022, 37, 1280–1297. [Google Scholar] [CrossRef]
  10. Liang, C.; Wei, W.; Mousavi, H.; Chen, K.; Asafo-Duho, B.; Wang, G. Investigation on static grounding analysis model of non-pneumatic tire with nonlinear spokes. AIP Adv. 2021, 11, 015303. [Google Scholar] [CrossRef]
  11. Sim, J.; Hong, J.; Cho, I.; Lee, J. Analysis of Vertical Stiffness Characteristics Based on Spoke Shape of Non-Pneumatic Tire. Appl. Sci. 2021, 11, 2369. [Google Scholar] [CrossRef]
  12. Wang, J.; Yang, B.; Lin, X.; Gao, L.; Liu, T.; Lu, Y.; Wang, R. Research of TPU Materials for 3D Printing Aiming at Non-Pneumatic Tires by FDM Method. Polymers 2020, 12, 2492. [Google Scholar] [CrossRef] [PubMed]
  13. Phromjan, J.; Suvanjumrat, C. The modification of steel belt layer of airless tire for finite element analysis. IOP Conf. Ser. Mater. Sci. Eng. 2020, 773, 012047. [Google Scholar] [CrossRef]
  14. Du, X.; Zhao, Y.; Wang, Q.; Fu, H.; Lin, F. Grounding Characteristics of a Non-Pneumatic Mechanical Elastic Tire in a Rolling State with a Camber Angle. J. Mech. Eng./Stroj. Vestn. 2019, 65, 10. [Google Scholar] [CrossRef]
  15. Jin, X.; Hou, C.; Fan, X.; Sun, Y.; Lv, J.; Lu, C. Investigation on the static and dynamic behaviors of non-pneumatic tires with honeycomb spokes. Compos. Struct. 2018, 187, 27–35. [Google Scholar] [CrossRef]
  16. Mohan, A.; Johny, C.A.; Tamilarasu, A.; Bhasker, J.P.; Ravi, K. Design and analysis of non-pneumatic tyre. IOP Conf. Ser. Mater. Sci. Eng. 2017, 263, 062061. [Google Scholar] [CrossRef]
  17. Sugiura, K.; Inutsuka, S.-i. An extension of Godunov SPH II: Application to elastic dynamics. J. Comput. Phys. 2017, 333, 78–103. [Google Scholar] [CrossRef]
  18. Marrone, S.; Di Mascio, A.; Le Touzé, D. Coupling of Smoothed Particle Hydrodynamics with Finite Volume method for free-surface flows. J. Comput. Phys. 2016, 310, 161–180. [Google Scholar] [CrossRef]
  19. Valizadeh, A.; Monaghan, J.J. A study of solid wall models for weakly compressible SPH. J. Comput. Phys. 2015, 300, 5–19. [Google Scholar] [CrossRef]
  20. Monaghan, J.J.; Kajtar, J.B. SPH particle boundary forces for arbitrary boundaries. Comput. Phys. Commun. 2009, 180, 1811–1820. [Google Scholar] [CrossRef]
  21. Morris, J.P.; Fox, P.J.; Zhu, Y. Modeling Low Reynolds Number Incompressible Flows Using SPH. J. Comput. Phys. 1997, 136, 214–226. [Google Scholar] [CrossRef]
  22. Adami, S.; Hu, X.Y.; Adams, N.A. A generalized wall boundary condition for smoothed particle hydrodynamics. J. Comput. Phys. 2012, 231, 7057–7075. [Google Scholar] [CrossRef]
  23. Molteni, D.; Colagrossi, A. A simple procedure to improve the pressure evaluation in hydrodynamic context using the SPH. Comput. Phys. Commun. 2009, 180, 861–872. [Google Scholar] [CrossRef]
  24. Antuono, M.; Colagrossi, A.; Marrone, S. Numerical diffusive terms in weakly-compressible SPH schemes. Comput. Phys. Commun. 2012, 183, 2570–2580. [Google Scholar] [CrossRef]
  25. Litvinov, S.; Hu, X.Y.; Adams, N.A. Towards consistence and convergence of conservative SPH approximations. J. Comput. Phys. 2015, 301, 394–401. [Google Scholar] [CrossRef]
  26. Adami, S.; Hu, X.Y.; Adams, N.A. A transport-velocity formulation for smoothed particle hydrodynamics. J. Comput. Phys. 2013, 241, 292–307. [Google Scholar] [CrossRef]
  27. Swegle, J.W.; Hicks, D.L.; Attaway, S.W. Smoothed Particle Hydrodynamics Stability Analysis. J. Comput. Phys. 1995, 116, 123–134. [Google Scholar] [CrossRef]
  28. Rhyne, T.B.; Cron, S.M. Development of a Non-Pneumatic Wheel. Tire Sci. Technol. 2006, 34, 150–169. [Google Scholar] [CrossRef]
  29. Dhillon, R.S. Development of Truck Tire-Terrain Finite Element Analysis Models. Master’s Thesis, University of Ontario Institute of Technology, Oshawa, ON, Canada, 2013. [Google Scholar]
  30. Bui, H.; Fukagawa, R.; Sako, K.; Ohno, S. Lagrangian mesh-free particle method (SPH) for large deformation and post-failure of geomaterial using elastic-plastic soil constitutive model. Int. J. Numer. Anal. Methods Geomech. 2008, 32, 1537–1570. [Google Scholar] [CrossRef]
  31. Bekker, M.G. Introduction to Terrain-Vehicle Systems. Part I: The Terrain. Part II: The Vehicle; DTIC Document; University of Michigan Press: Ann Arbor, MI, USA, 1969. [Google Scholar]
Figure 1. Bald non-pneumatic tire assembly.
Geotechnics 04 00030 g001
Figure 2. Different non-pneumatic spoke tire designs. (a) Honeycomb. (b) Modified honeycomb. (c) Re-entrant honeycomb. (d) Straight spokes conventional Tweel.
Geotechnics 04 00030 g002
Figure 3. FEM to SPH conversion for a square structure. (a) FEM mesh. (b) Element center nodes. (c) Mesh-free particles.
Geotechnics 04 00030 g003
Figure 4. Simulation setup of the pressure–sinkage test.
Geotechnics 04 00030 g004
Figure 5. Measured and simulated results for dry, loose soil during a pressure–sinkage test.
Geotechnics 04 00030 g005
Figure 6. Direct shear-strength test simulation setup.
Geotechnics 04 00030 g006
Figure 7. Shear-strength relationship of measured and simulated test for dry, loose soil.
Geotechnics 04 00030 g007
Figure 8. Three-dimensional mesh representing the interaction between non-pneumatic tires and SPH dry, loose soil bin, conducted to assess motion resistance (refer to the online version for color illustrations).
Geotechnics 04 00030 g008
Figure 9. Soil density change for a modified honeycomb tire model running at 4.2 m/s (a) 2 kN (b) 4 kN and (c) 6 kN.
Geotechnics 04 00030 g009
Figure 10. Motion resistance coefficient test as a function of normal force at different operating velocities for (a) honeycomb spokes, (b) modified honeycomb, (c) re-entrant honeycomb, (d) straight spoke Tweel (refer to the online version for color illustrations).
Geotechnics 04 00030 g010
Figure 11. Tire penetration under of normal force of 6 kN and 5.5 m/s longitudinal velocities: (a) honeycomb spokes, (b) modified honeycomb, (c) re-entrant honeycomb, (d) straight spoke Tweel (refer to the online version for color illustrations).
Geotechnics 04 00030 g011
Table 1. Critical frequency and damping coefficient of different spoke shapes based on simulation results.
Spoke DesignCritical Frequency (Hz)Damping Coefficient
Honeycomb spokes251.57
Modified honeycomb322.01
Re-entrant honeycomb221.38
Straight spoke Tweel483.02
Table 2. Material properties for dry, loose soil (source: [4] El-Sayegh, 2018).
Material Type ρ (ton/mm3)σ (MPa)E (MPa)K
(MPa)
G
(MPa)
Loose soil1.44 × 10−90.01617117
Table 3. Terramechanics characteristics of dry, loose soil [3].
Soil Typenkckθc
(Units) k N / m n + 1 k N / m n + 2 kPadeg
Loose soil1.10.991528.431.0428
Disclaimer/Publisher’s Note: The statements, opinions and data contained in all publications are solely those of the individual author(s) and contributor(s) and not of MDPI and/or the editor(s). MDPI and/or the editor(s) disclaim responsibility for any injury to people or property resulting from any ideas, methods, instructions or products referred to in the content.

