Article

Experimental Study of Scouring and Deposition Characteristics of Riprap at Embankment Toe Due to Overflow

by
Abu Raihan Mohammad Al-Biruni
1,
Md Masum Billah
1 and
Junji Yagisawa
2,*
1
Bangladesh Water Development Board, Dhaka 1205, Bangladesh
2
Graduate School of Science and Engineering, Saitama University, Shimo-okubo, Sakura-ku, Saitama 338-8570, Japan
*
Author to whom correspondence should be addressed.
Geotechnics 2024, 4(3), 773-785; https://doi.org/10.3390/geotechnics4030040
Submission received: 9 June 2024 / Revised: 5 July 2024 / Accepted: 12 July 2024 / Published: 16 July 2024

Abstract

:
In this study, the effects of the grain size and gradation of riprap, the overtopping flow depth, and the downstream slope of the embankment on the scouring and deposition characteristics at the downstream toe of the embankment were investigated. For the experiment, three different downstream slopes (1:2, 1:3, and 1:4), three different overflow depths (1, 2, and 3 cm), and three different sizes of riprap particles (d50 of 16.41 mm, 8.48 mm, and 3.39 mm, herein referred to as coarse gravel, medium gravel, and granule, respectively) were used in the laboratory. The experimental results demonstrated that the scour depth and deposition height increased with increasing energy head for each downstream slope condition. Among the three particle sizes, coarse gravel shows the lowest scour depth and the highest deposition height. For the 1:2 slope, the coarse gravel particle size was 62% and 75% less resistant to scouring than the medium gravel and granule particles, respectively. For the 1:3 slope case, this was 31% and 46%, and for the 1:4 slope case, this was 39% and 49% less than the medium gravel and granule size particles, respectively.

1. Introduction

Overtopping is a more prevalent concern than other embankment failures worldwide. It is the most common mode of failure, accounting for 40–48% of the reported cases of embankment failure up to 1986 and 34% to date [1]. Failures caused by overtopping are never predictable, and if not controlled promptly or protected properly, an overtopping event can lead to a catastrophic embankment failure quickly, resulting in huge damage to lives and properties in the communities that are located on the downstream side of the embankment [2]. Thus, the prediction of local scour at the toe and subsequent headcut migration is important for embankment breakage. Since the time required to form a complete breaching is key to flood preparedness and evacuation plans, accurate prediction of scour is very important [3].

1.1. Factors Affecting Scour at Embankment Toe

Scouring at the landside toe of the embankment during overtopping flow is one of the main reasons for the fragility of the embankment slope and levee breakage [4,5]. The initial scour depth, plunge pool height, and subsequent headcut migration are responsible for the breakage mechanism of the embankment and the total time required for the complete failure of the embankment [6,7]. Several factors affect this scour, and from previous studies, the energy of the flow (dependent on overtopping depth and velocity) and the geometry of the structure are important factors for understanding the extent of the scour hole [5,8]. Ravindra Jayaratne et al. stated that several factors, such as overtopping height, soil permeability, levee geometry, and landside slope, are responsible for toe scour and subsequent levee failure. A mild slope reduces the scour depth and length at the toe [8]. The tailwater depth and plunge pool adjacent to the scour hole can play vital roles in dissipating energy and the subsequent headcut migration speed [6,9].
In summary, the steepness or mildness of the downstream slope of an earthen embankment significantly affects the velocity of flowing water and the strength of the hydraulic jump near the toe. Thus, the position and nature of hydraulic jumps play key roles in developing scour hole depth and the extent of scour. The embankment material properties, such as particle size and interlocking, contribute to this scour phenomenon in addition to flow shear stress [8,10,11,12].

1.2. Local Scour Protection with Ripraps

Scour protection at the toe can be designed using static or dynamic solutions by different protection materials and techniques [13]. Riprap is a permanent covering of large, angular stones, cobbles, or boulders used to armor, stabilize, and protect the soil surface against erosion and scour in regions of intense flow or wave activity. By understanding the scour characteristics, scour countermeasures are proposed to prevent the fragility of embankment landside slopes in the future [10]. Johnson et al. compared the effectiveness of four types of scour protection, riprap, coreloc, riprap with an underlayer, and coreloc with an underlayer, to determine the scour characteristics and concluded that riprap combined with underlayer showed a significant improvement in minimizing the scour hole. Researchers have also used grade control structures, block ramps, and other ground improvement techniques to minimize scouring and settlement [14,15]. One structural measure that has successfully solved the scour problem worldwide is constructing a block ramp structure in a stream [16]. They also observed that rock sills performed better than other tested sills and dentated sills and observed that the riprap can significantly affect scour depth and shape. Several studies have been conducted to investigate scouring characteristics and reduce the scour caused by overtopping. Several studies have been conducted on scouring by focusing on different variables, but the combination of several variables in a single study is rare. The tailwater depth and plunge pool adjacent to the scour hole can play vital roles in dissipating energy and the subsequent headcut migration speed [6,9]. Farhoudi and Smith investigated the similarity between scour profiles downstream of a hydraulic jump. The bed load sediment was removed and deposited adjacent to the scour hole to form a dune and create a plunge pool. The coarser sand caused a gradual decrease in dune height over time. However, when using finer materials, the dune is not clearly produced, resulting in no plunge pool formation [17].
Stein et al. and Dargahi investigated the scour at equilibrium, the scour profiles, and the rate of scour hole growth by considering the effect of jet diffusion on sediment separation. It was observed from the experiment that the scour depth increased faster in the early stages of scour development and slowed over time. Deposition of sand was observed near the scour hole transported by the reversed flow. However, tailwater depth was not considered for scour depth prediction. Stein et al. and Dargahi concluded that the quantity of scour holes was dependent on the bed material and flow discharge [18,19].
Sustainable protection measures are only possible if the location and depth of scour downstream are accurately estimated and well understood [20].
In this study, the effects of different hydraulic, geotechnical, and geometrical variables on downstream toe scouring and particle deposition were incorporated to better understand the scouring phenomenon and its countermeasures.

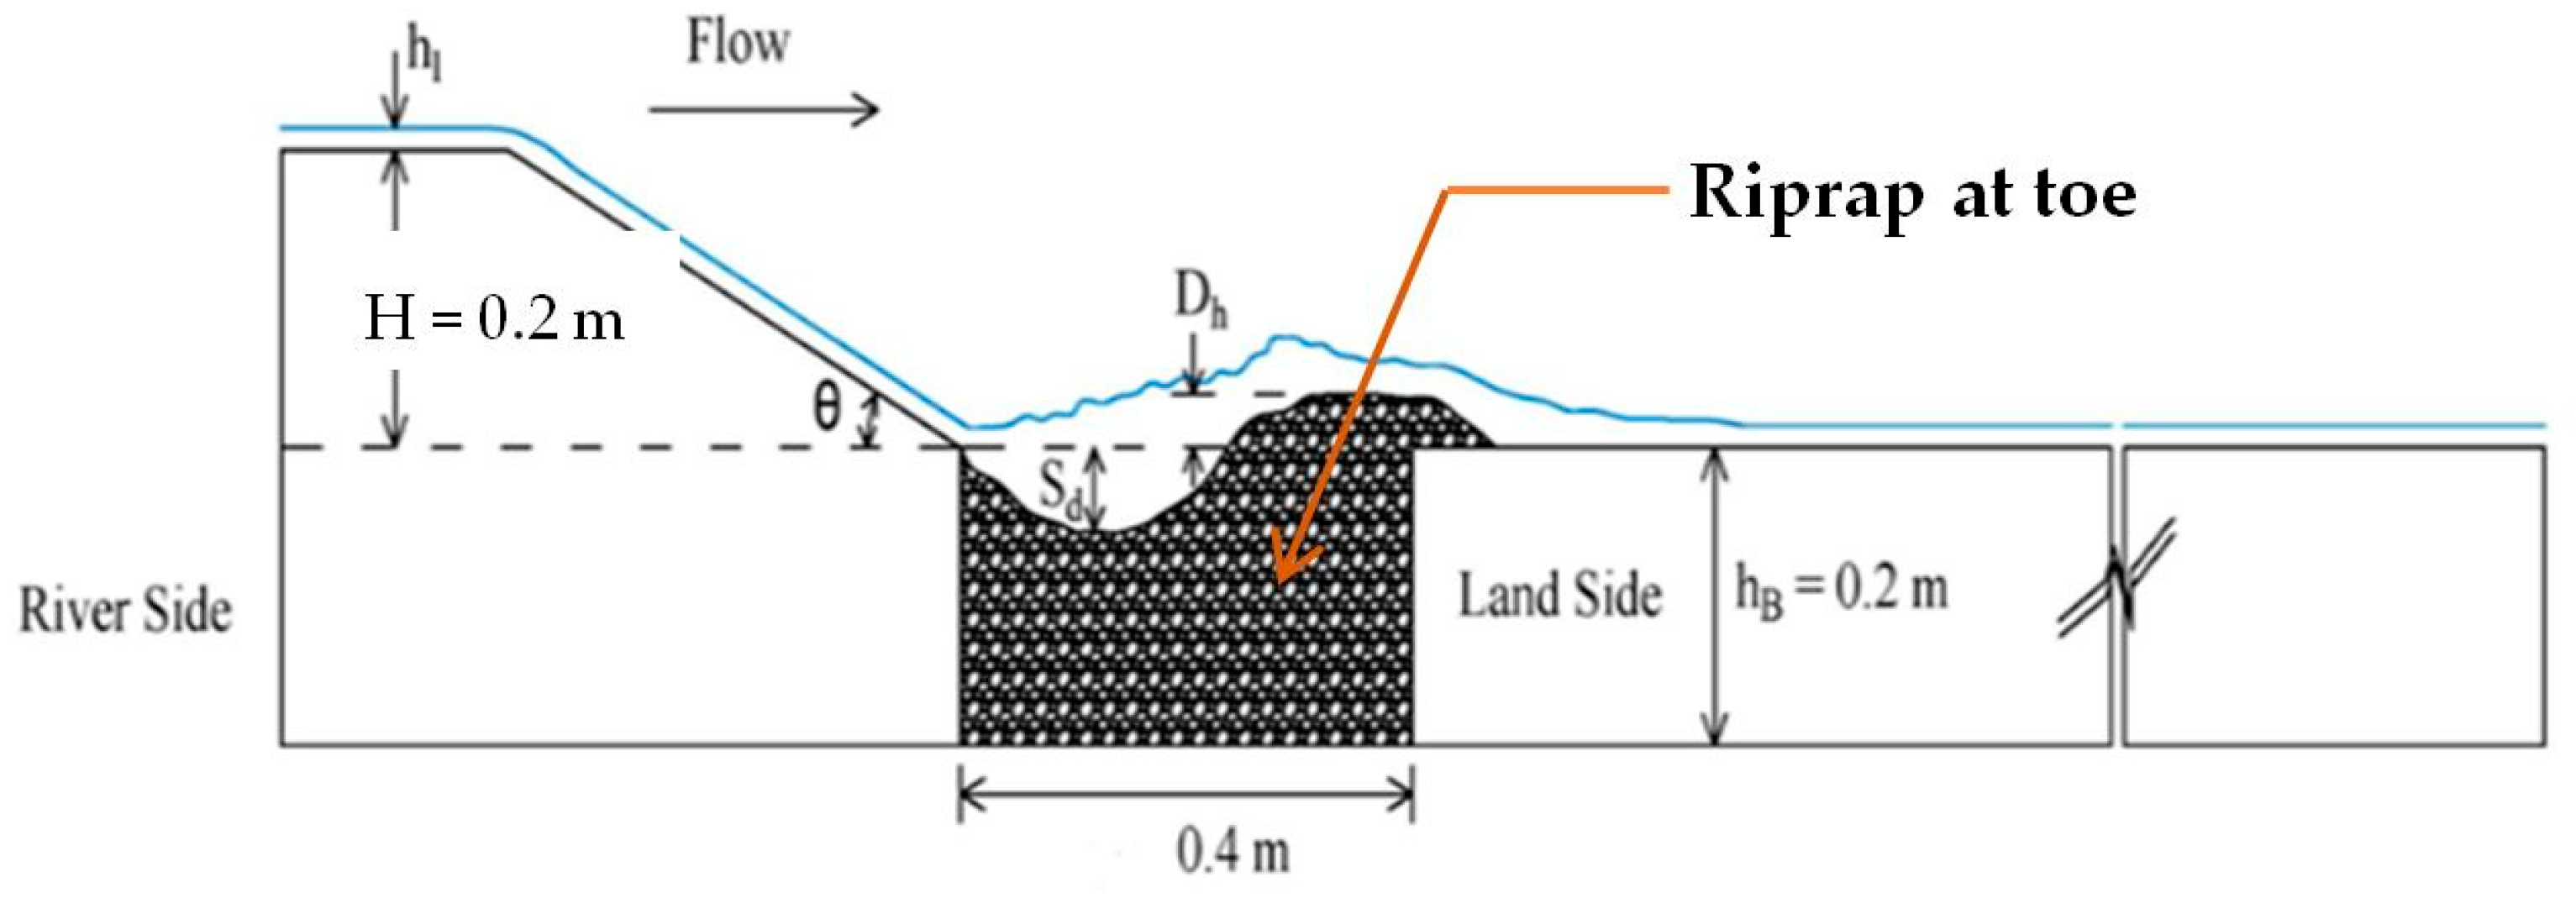
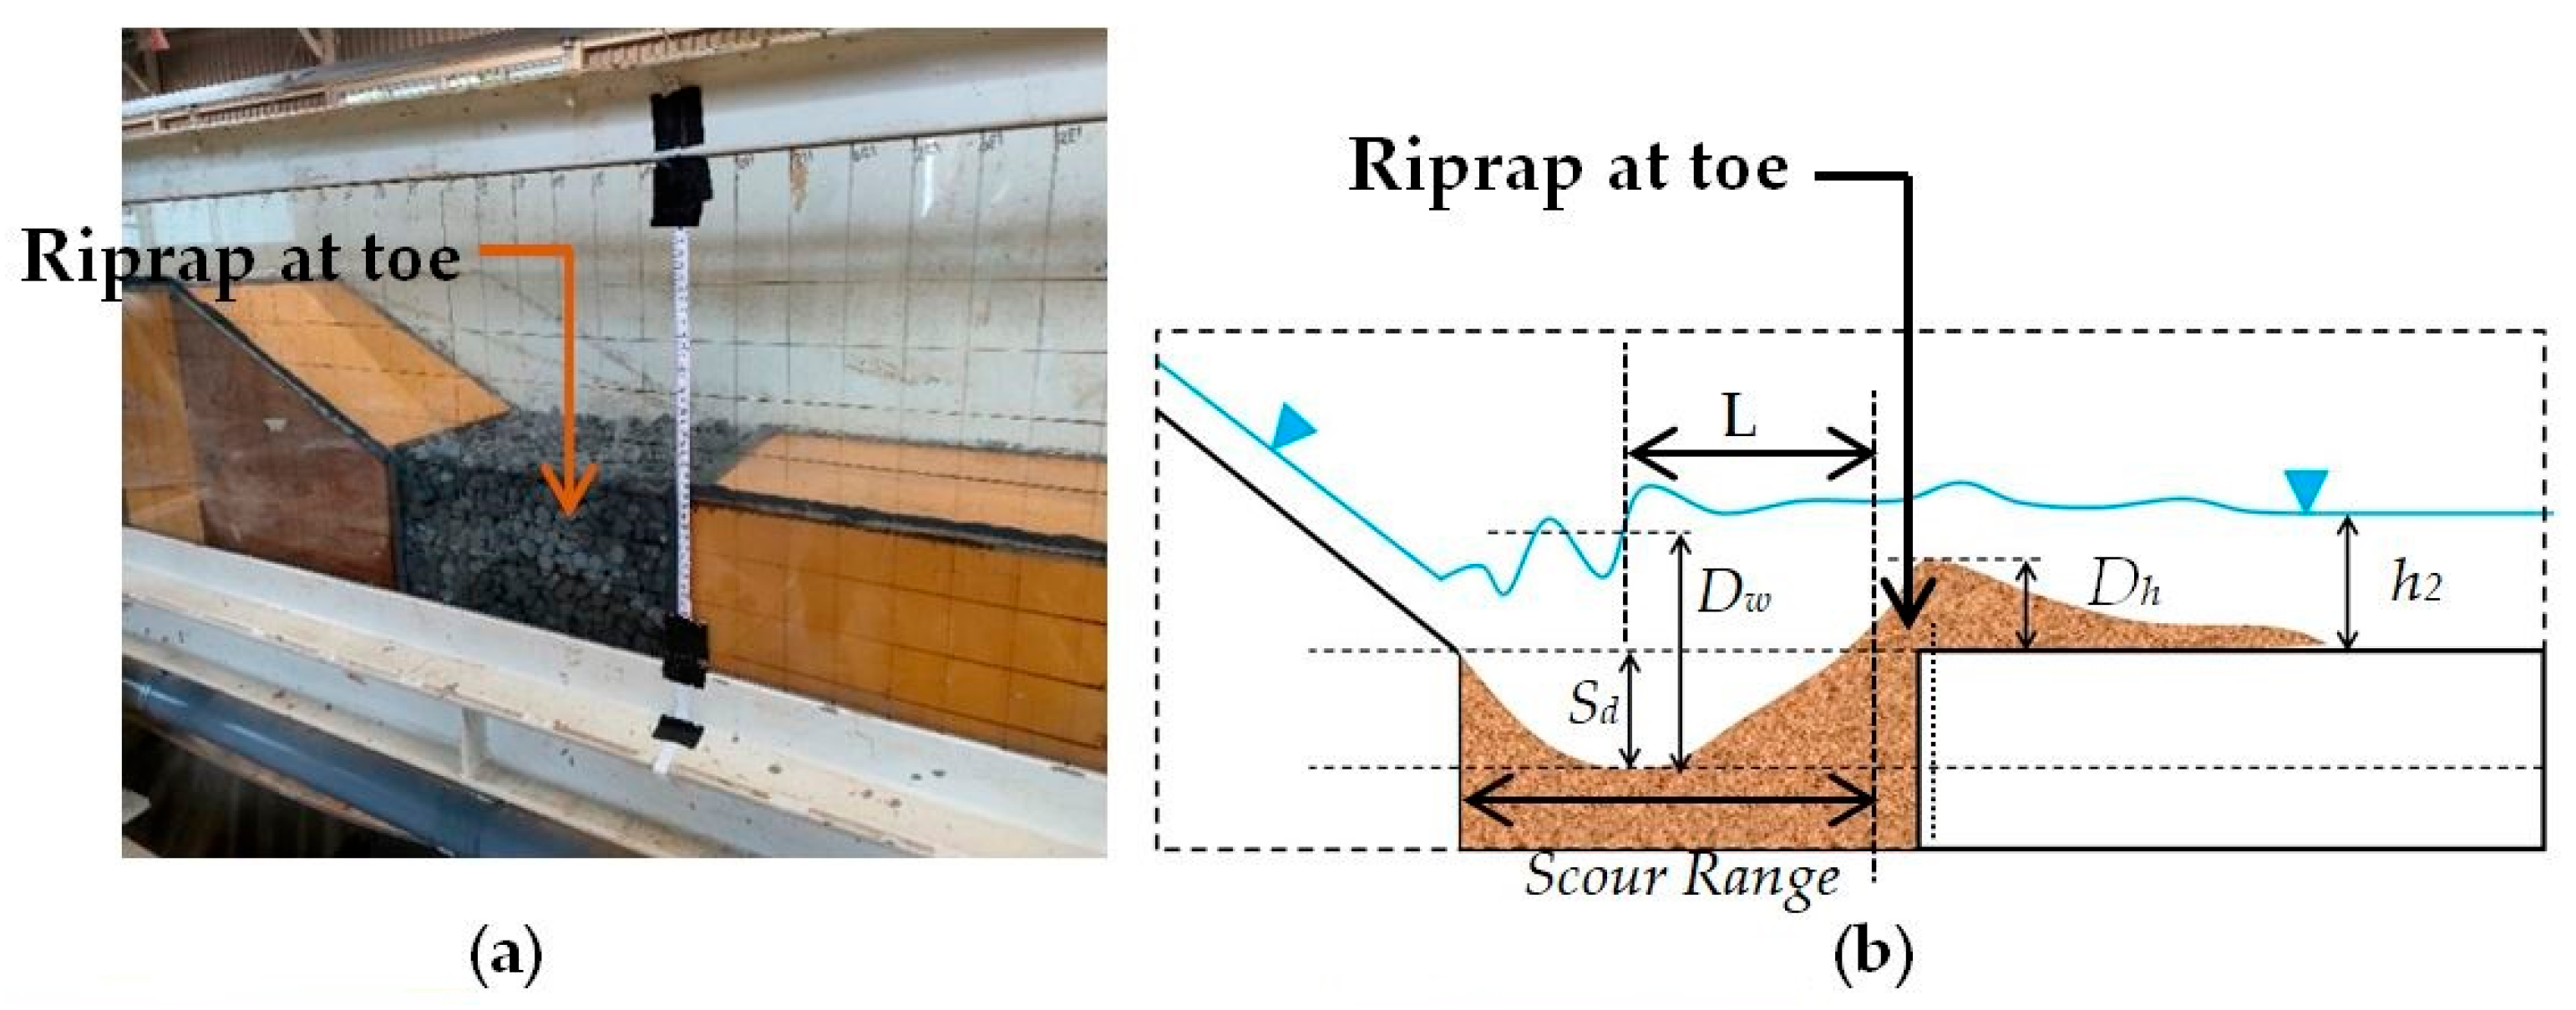
2. Materials and Methods

Experiments were conducted at the Hydraulic Engineering Laboratory of Saitama University, Japan. A recirculating flume was used in the laboratory. The flume was 15 m long, 0.30 m wide, and 0.6 m high. Figure 1 shows a typical diagram of the experimental channel setup.
The embankment model was constructed using plywood. Checking the water level at three different points, namely downstream, in the center, and upstream of the crest, ensured that the crest of the embankment was always completely horizontal. Three different downstream slopes of the embankment were prepared: 1V:2H, 1V:3H, and 1V:4H. The specific downstream slopes were selected based on practical earthen embankment configurations both in Japan and other countries. The height of the embankments was maintained at 20 cm for all cases, and the overtopping flow depth during all experimental cases was ensured to be 1, 2, and 3 cm. Throughout the experiment, a constant water flow was maintained using an intake pump. The experimental setup used in the laboratory is shown in Figure 2a. Ripraps were used at the downstream toe of the embankment model.
To calculate the relative energy loss, the initial energy head (E1) at the middle of the embankment crest and the final energy head (E2) after the hydraulic jump were considered. Considering the datum is on the soil surface (across the embankment downstream slope toe), the energy heads E1 and E2 were calculated as
E 1 = H + h 1 + V 1 2 2 g
E 2 = h 2 + V 2 2 2 g = h 2 + Q 2 2 g B h 2 2
where
  • h2 = water depth at the section after the scour hole;
  • h1 = hc = critical water depth;
  • V2 = flow velocity corresponding to h2, and B is the channel width;
  • V1 = flow velocity at the end of the embankment crest;
  • g = gravitational acceleration.
So, the velocity (V1) can be expressed in terms of the overtopping flow depth, h1, and the flow discharge, Q, as
  • Q = Q/b = flow discharge per unit width;
  • b = B = embankment width or channel width.
In addition, the scour hole depth (Sd), deposition height (Dh), plunge pool depth (Dw), and tailwater depth, shown in Figure 2b, were measured during and after each experimental run.

Materials and Equipment

Three different sizes of riprap particles were used at the downstream toe of the embankment model. In fixing the riprap size for the experiment, a scale factor (1:15) was applied to practical riprap sizes. Also, the shear stress of scaled flow was considered so that it moves under scaled flow in the experimental channel. To determine the median diameter and gradation curve for each riprap particle, three samples were collected. The riprap particles’ median diameters were found to be 16.41 mm, 8.48 mm, and 3.39 mm, herein referred to as coarse gravel or No. 5 size, medium gravel or No. 6 size, and granule or No. 7 size, respectively. The gradation curves of the three types of riprap are shown in Figure 3.
For this study, a total of 27 experimental cases were performed, as listed in Table 1, and overflow was continued until equilibrium was achieved. The experimental cases were decided so that the varying effects of overtopping depths, riprap sizes, and embankment configurations could be well understood. In reality, the overtopping depths, riprap sizes, and downstream slopes vary depending on extreme flood events and design considerations, respectively.
During the experiment, when erosion and deposition reached equilibrium, the water pump was stopped.
The depth of the scour hole (Sd), the plunge pool depth (Dw), and the height of deposition (Dh) shown in Figure 2b were measured from the 3D contours of the embankment models obtained from a 2D laser scanner with light detection and technology (model: LJ-V7300, manufacturer: Keyence, Osaka, Japan) for each experimental case. A point gauge was used to measure the tailwater surface inside the channel with a measurement accuracy of 1 mm. The bed profile was measured along the centerline of the channel using a 2D laser scanner. The measurement accuracy of the 2D laser scanner was 5 µm in the vertical direction and 60 µm in the horizontal direction. For each case, the topographic data were acquired at an interval of 2 cm along the downstream direction.

3. Results

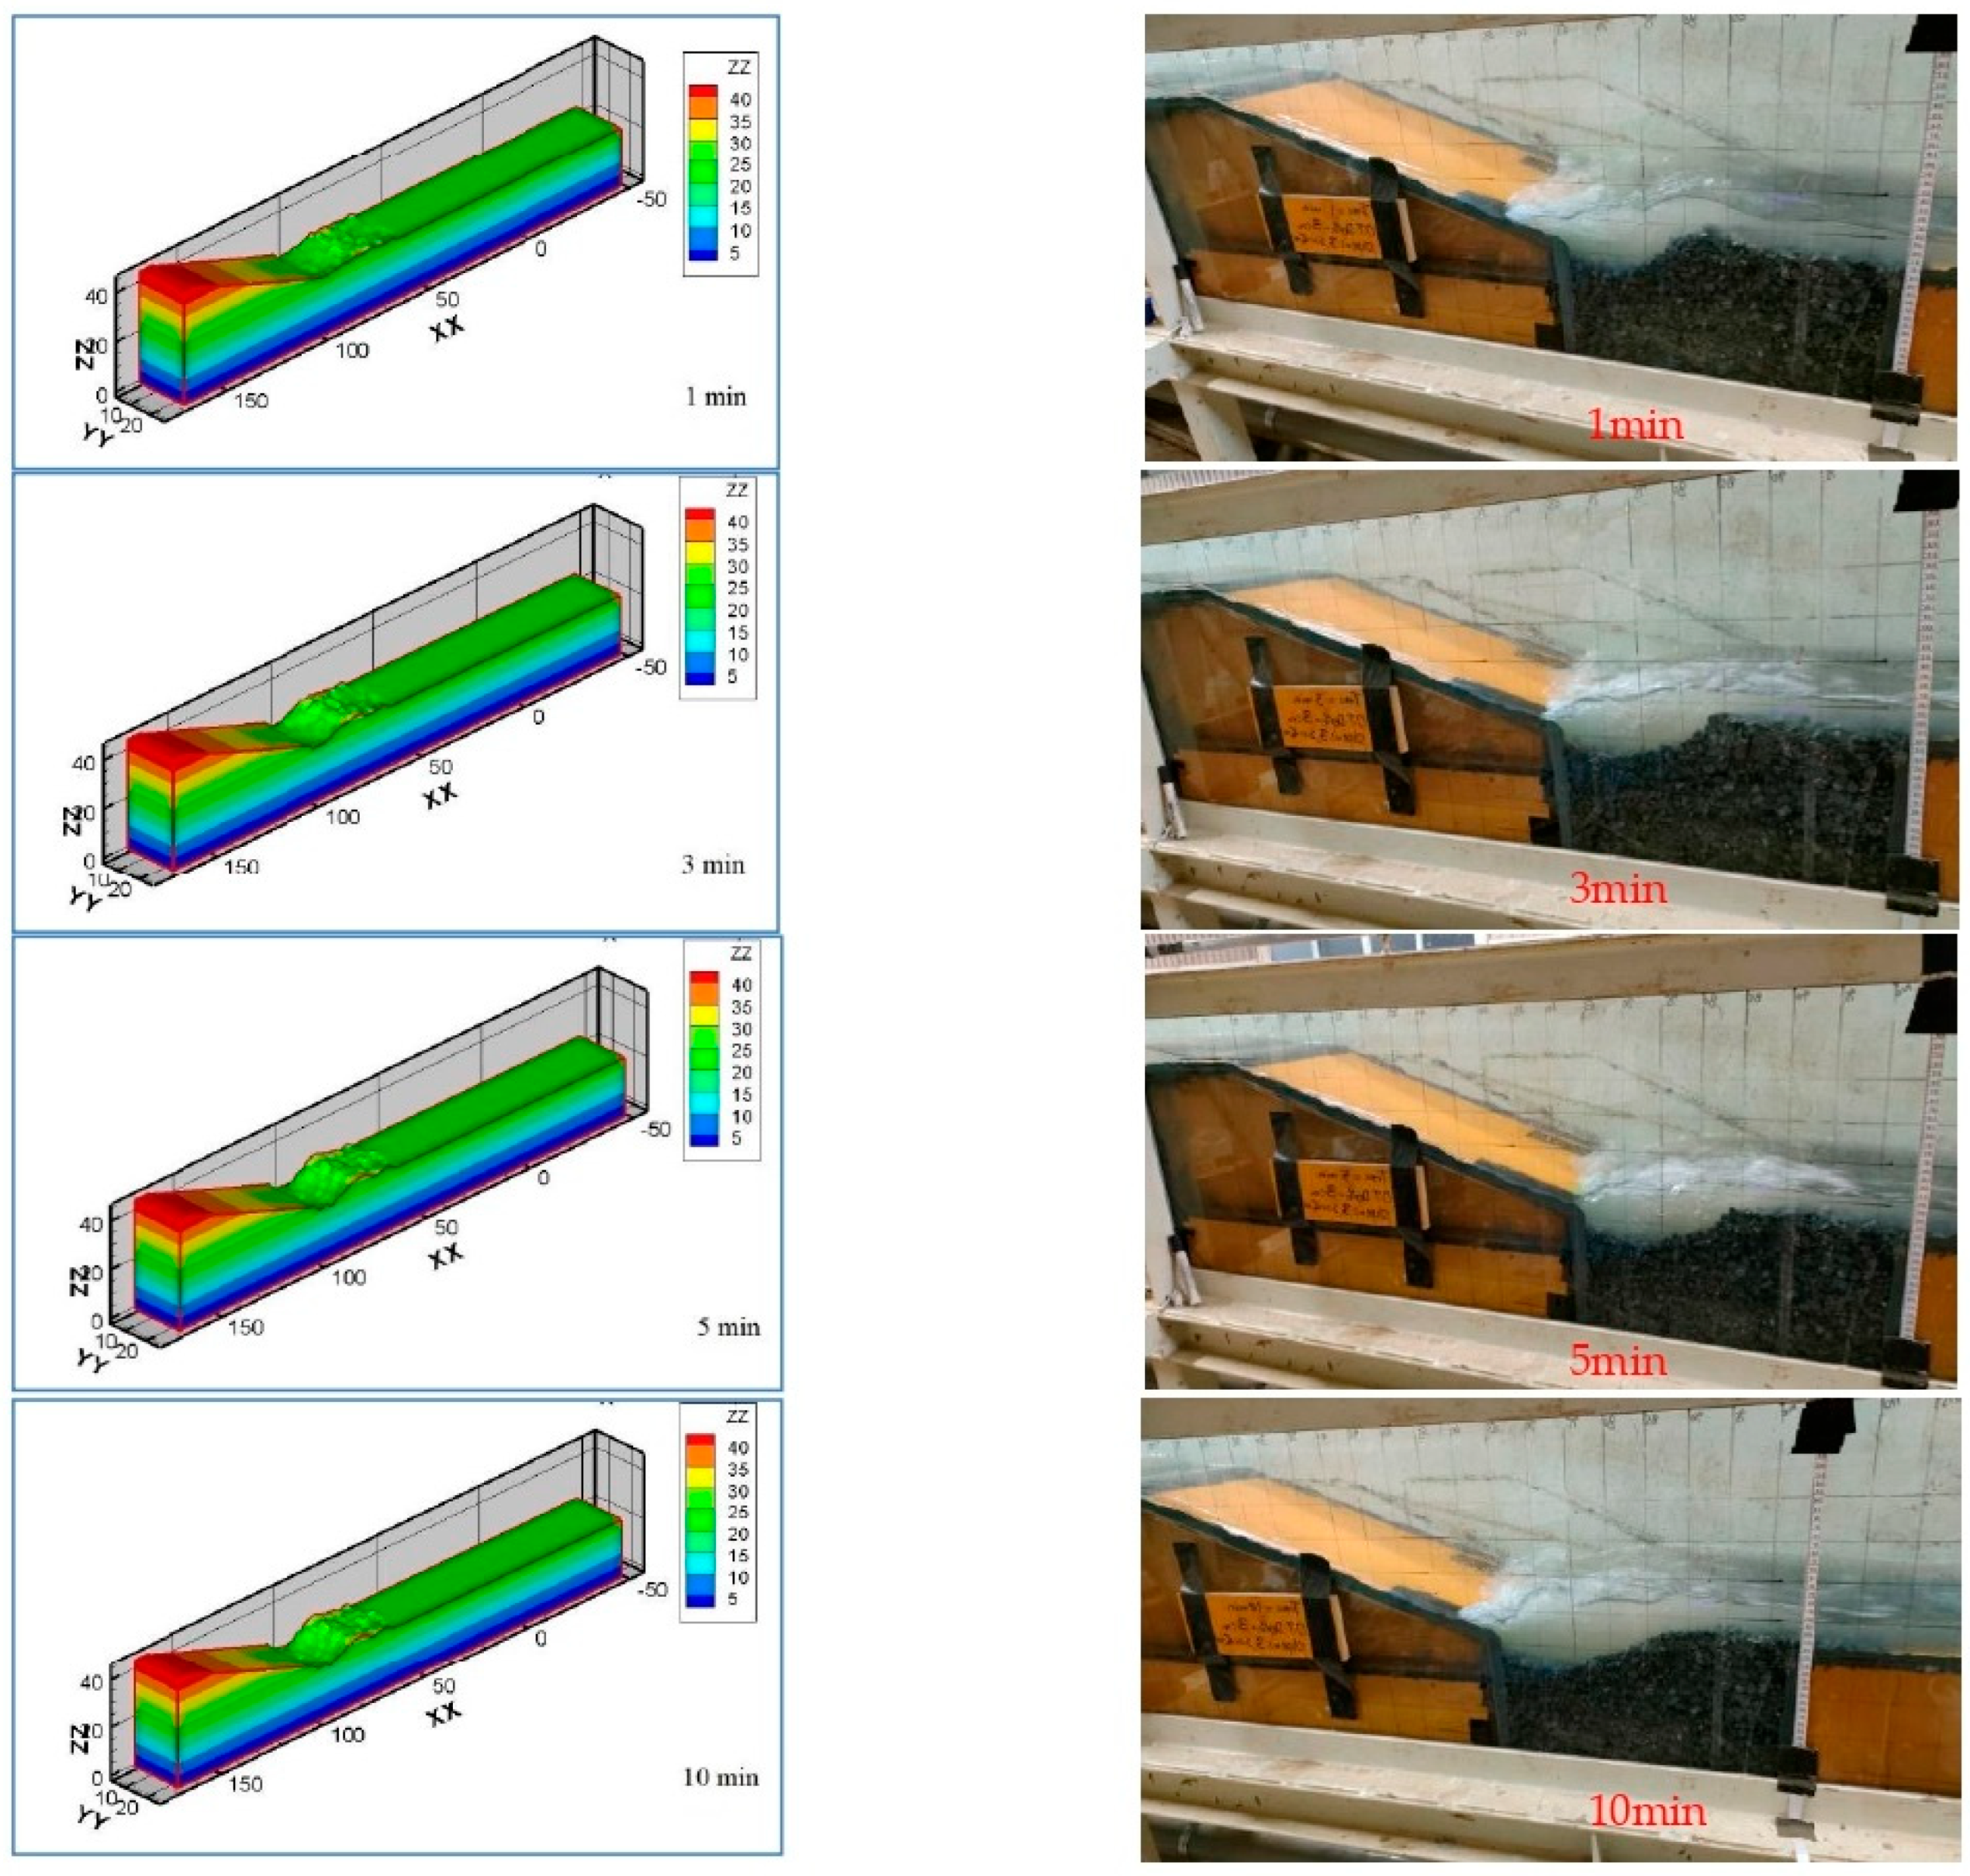
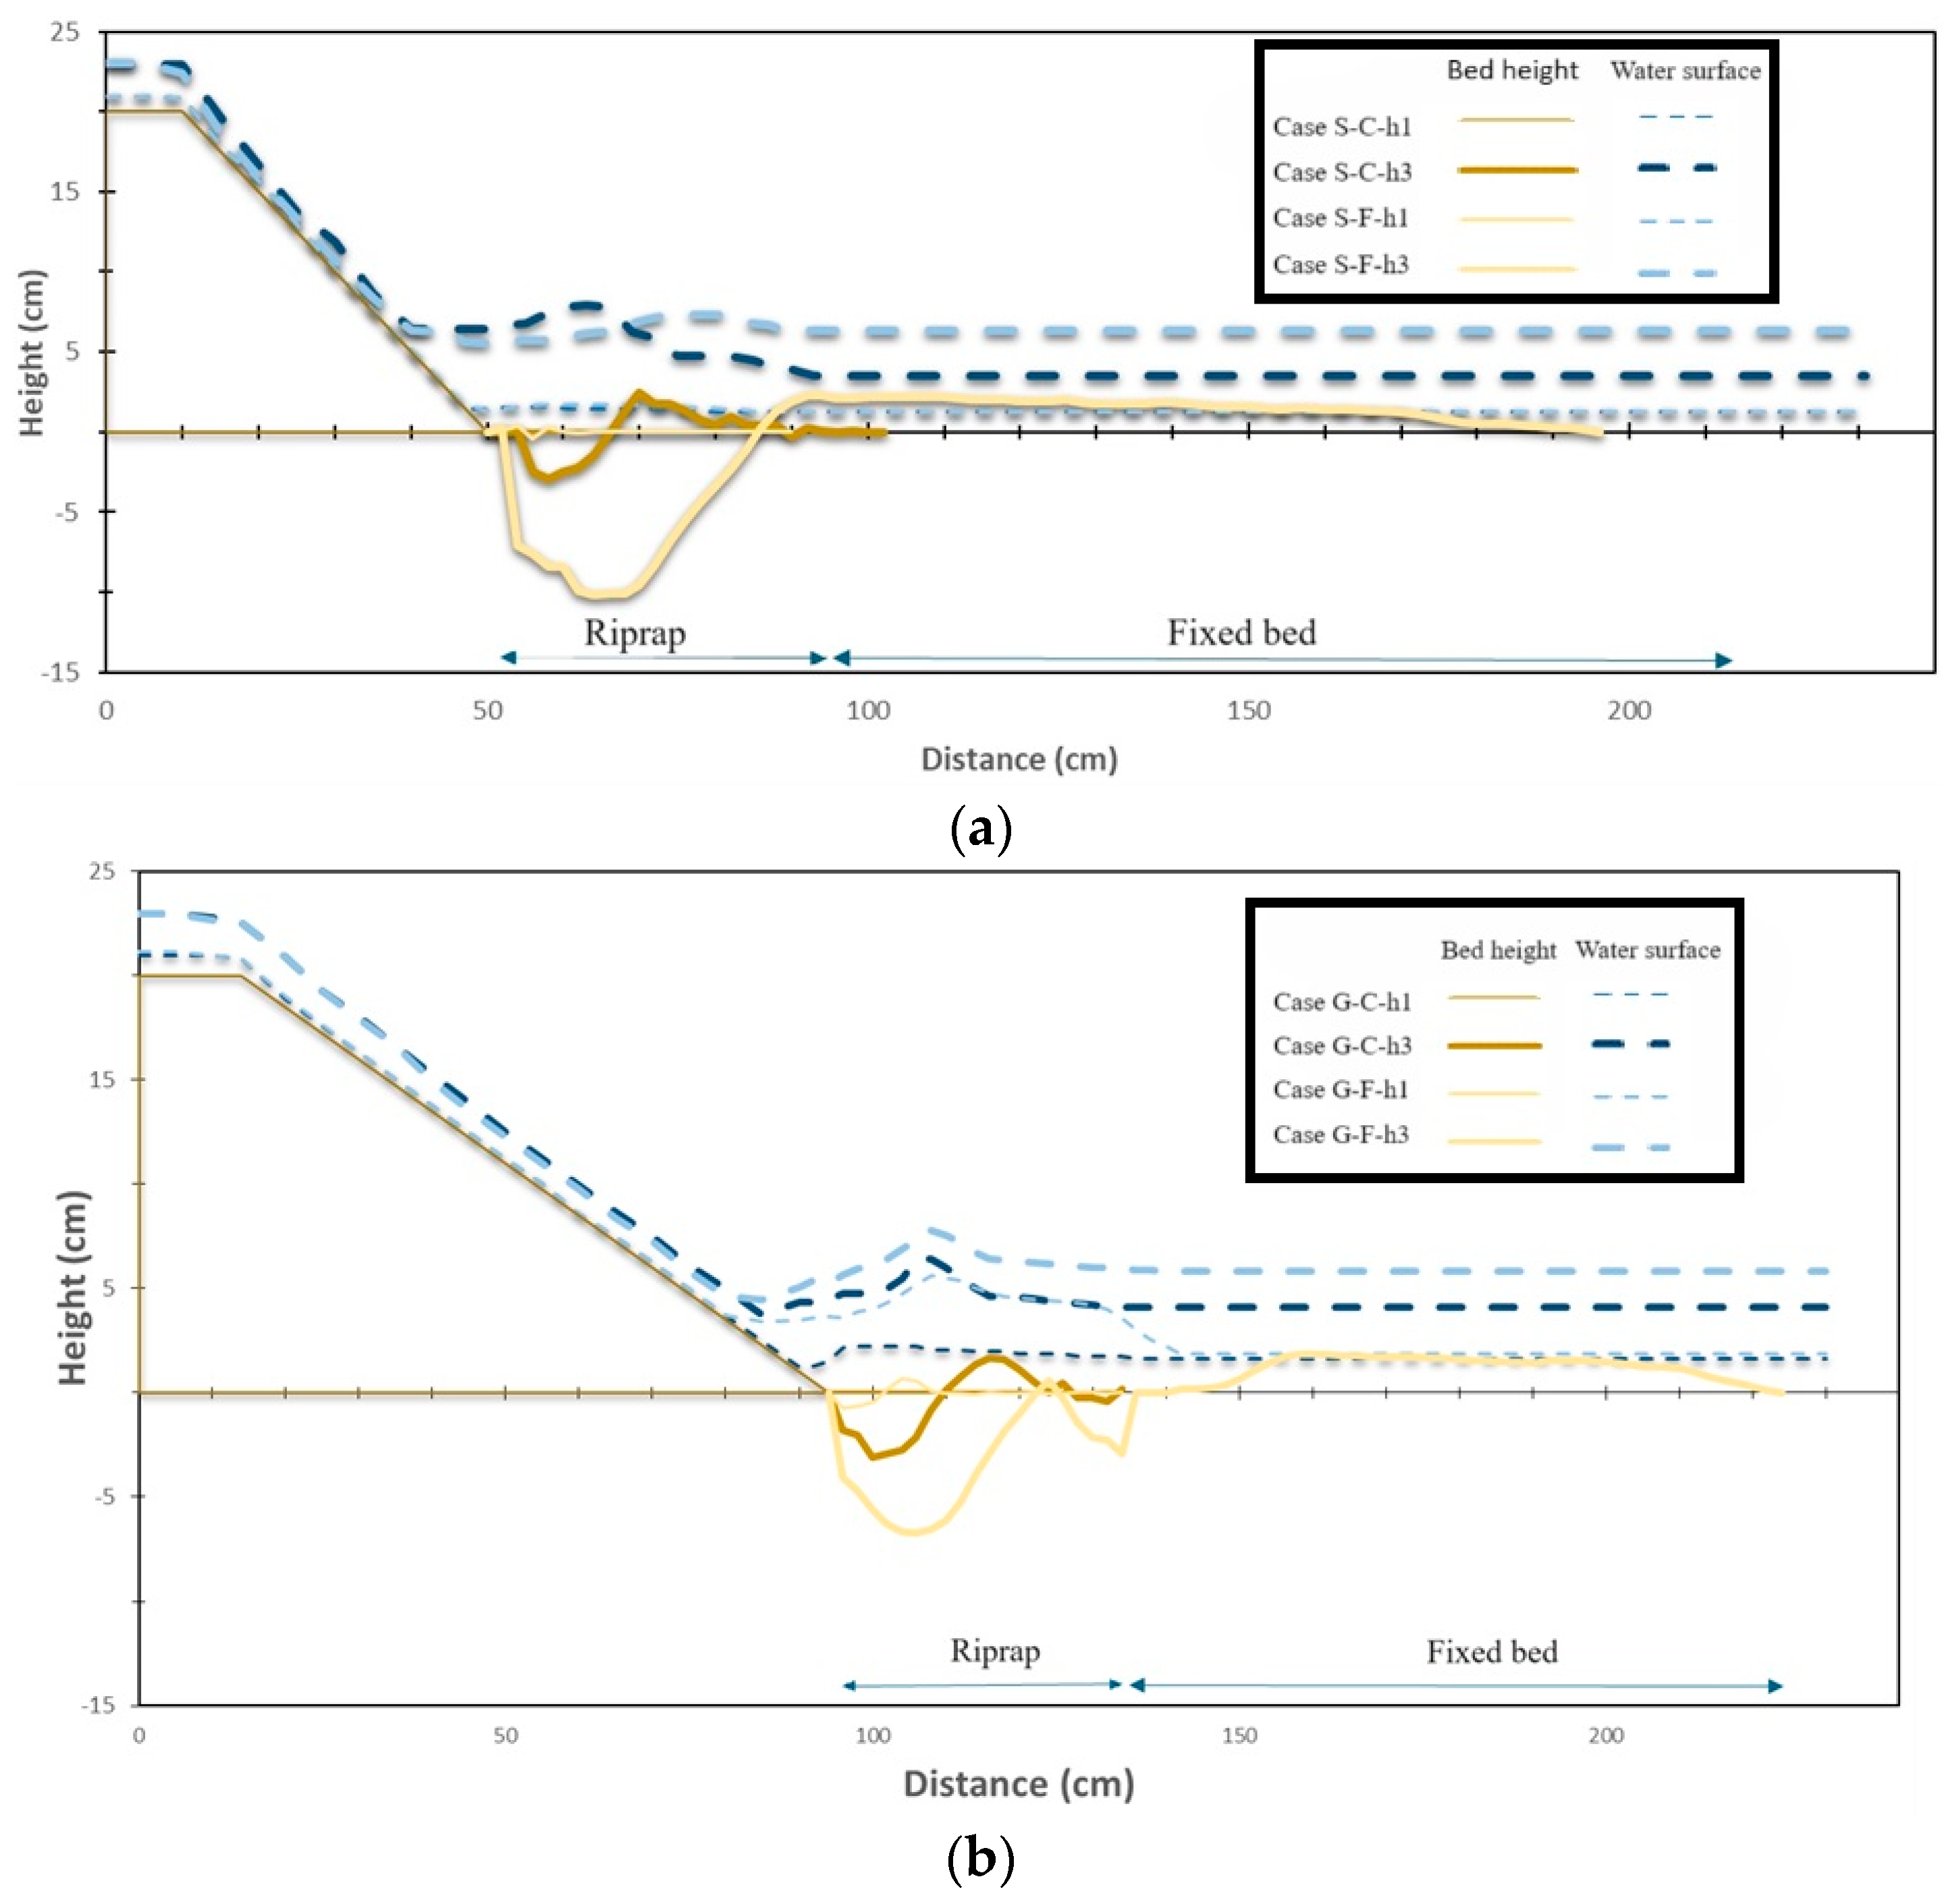
3.1. Typical Development of Scour and Deposition Characteristics

The maximum scour depth and deposition height were monitored and measured over time. Figure 4 shows the typical development of the scour and deposition. As a representative example, the development process of scour and deposition of ripraps for the M-C-h3 case is shown. The figure shows that the development of scour and deposition was faster in the early stage of the flow (1 min) and continued up to the second stage (2 min). In this time period, as the water level was low, the sheet flow of the water impinged the riprap directly, causing quick movement of the riprap particles. As soon as the particles moved from the toe, a pool was created, resulting in a reduction in the erosion process. Thus, the reduced energy of the water due to the plunge pool also contributed to the development of deposition.
In the third stage (3 min), the scour and deposition rates decreased as the pool depth increased. In the fourth stage (5 min), the scour and deposition of the riprap particles reached an equilibrium state, which was confirmed by the development of the fifth stage (10 min). In this stage, the energy of the water after the hydraulic jump was found to be insufficient to cause more erosion. This trend was similar for all the other cases. Based on this, 15 min was considered the time required to attain equilibrium.
It was also observed that the maximum scour occurred for a 3 cm overtopping depth, and riprap particle size No. 7 gave the highest scour depth. On the other hand, particle No. 5 had the lowest scouring depth and highest deposition height compared with the other sized particles for all the experimental cases.

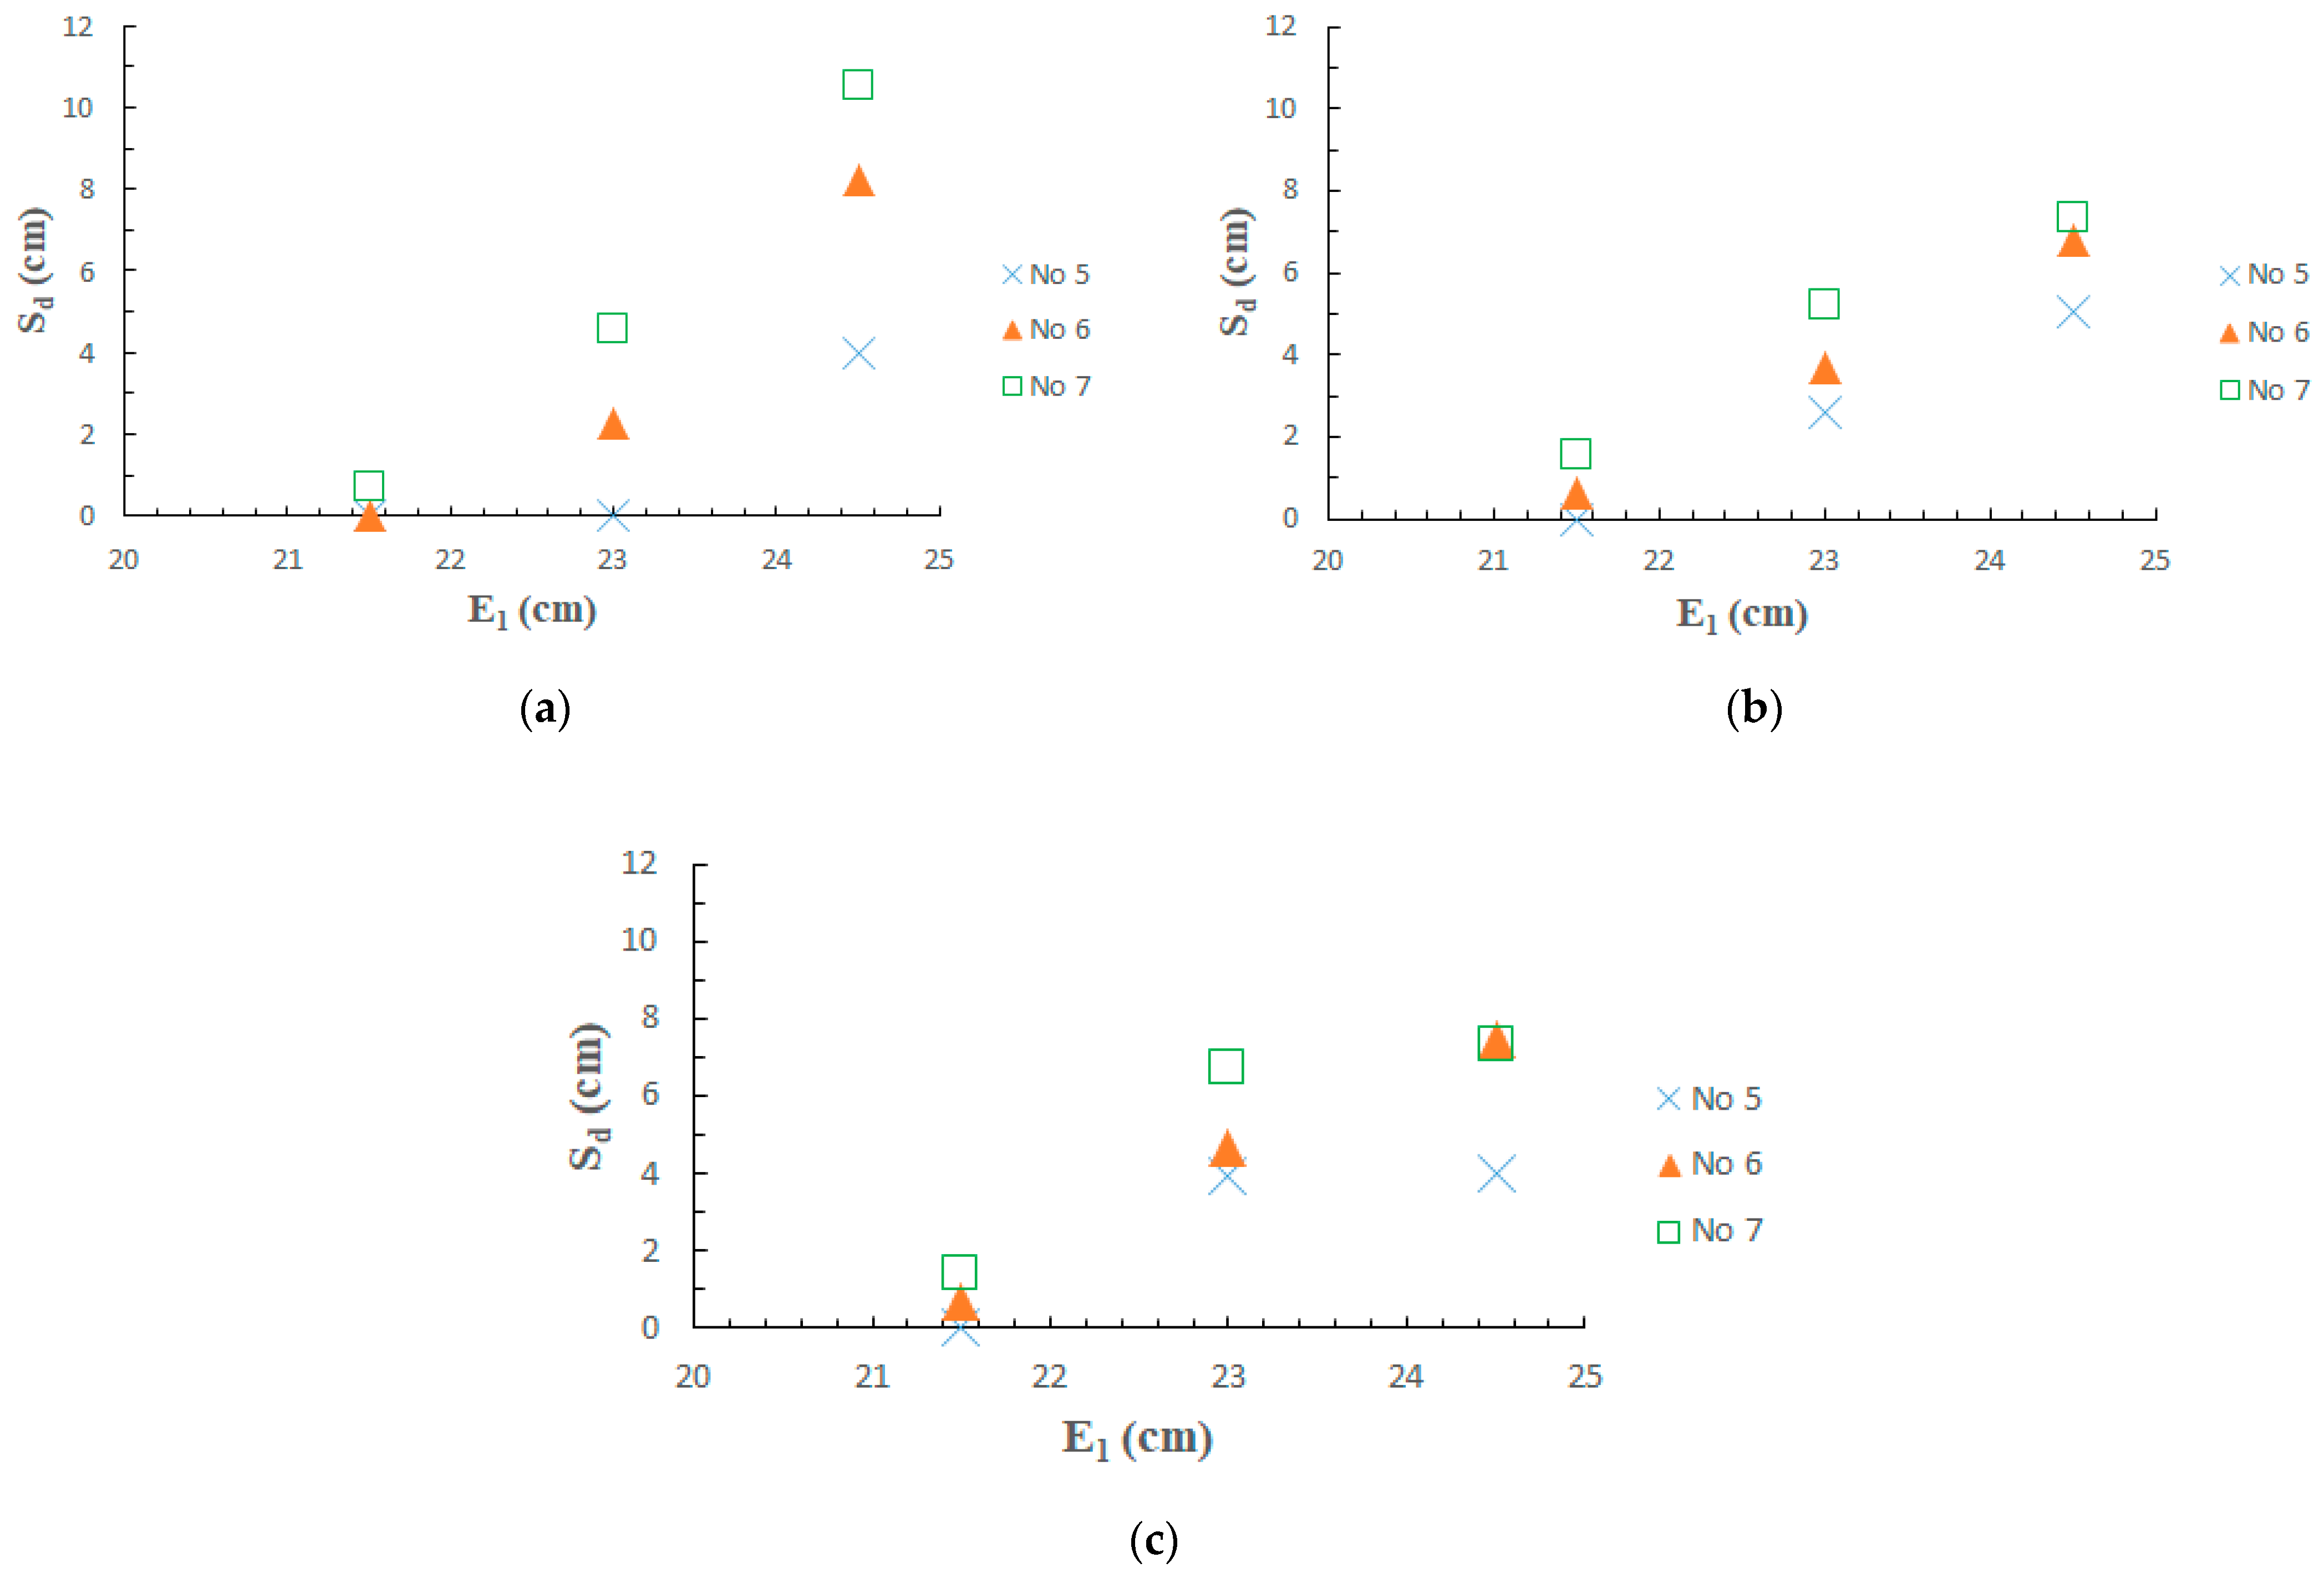
3.2. Effect of Energy Head on Scour Depths

From Figure 5, it is observed that the scour depth (Sd) increases with an increase in the energy head for riprap particles of the same size. For the same energy head, the scour depth increased with a decrease in particle size, and the other two slope conditions also showed the same results. For the steep slope (1:2) case, with an increase in E1 (dependent on overflow depth), the scour depth (Sd) also increases irrespective of the riprap size. On the other hand, in the case of the gentle slope (1:4), the development of scour depth (Sd) slowed despite the increase in E1. The reasons behind this different scenario were the change in flow pattern depending on the steepness or mildness of the downstream slope and the creation of a larger plunge pool depth. On average, for the 1:2 slope case, No. 5 size particles can develop scour up to 62% and 75% less than No. 6 and No. 7 particles, respectively. Subsequently, for the 1:3 slope case, this is 31% and 46%, and for the 1:4 slope case, this is 39% and 49% less than that for the No. 6 and No. 7 sized particles, respectively.

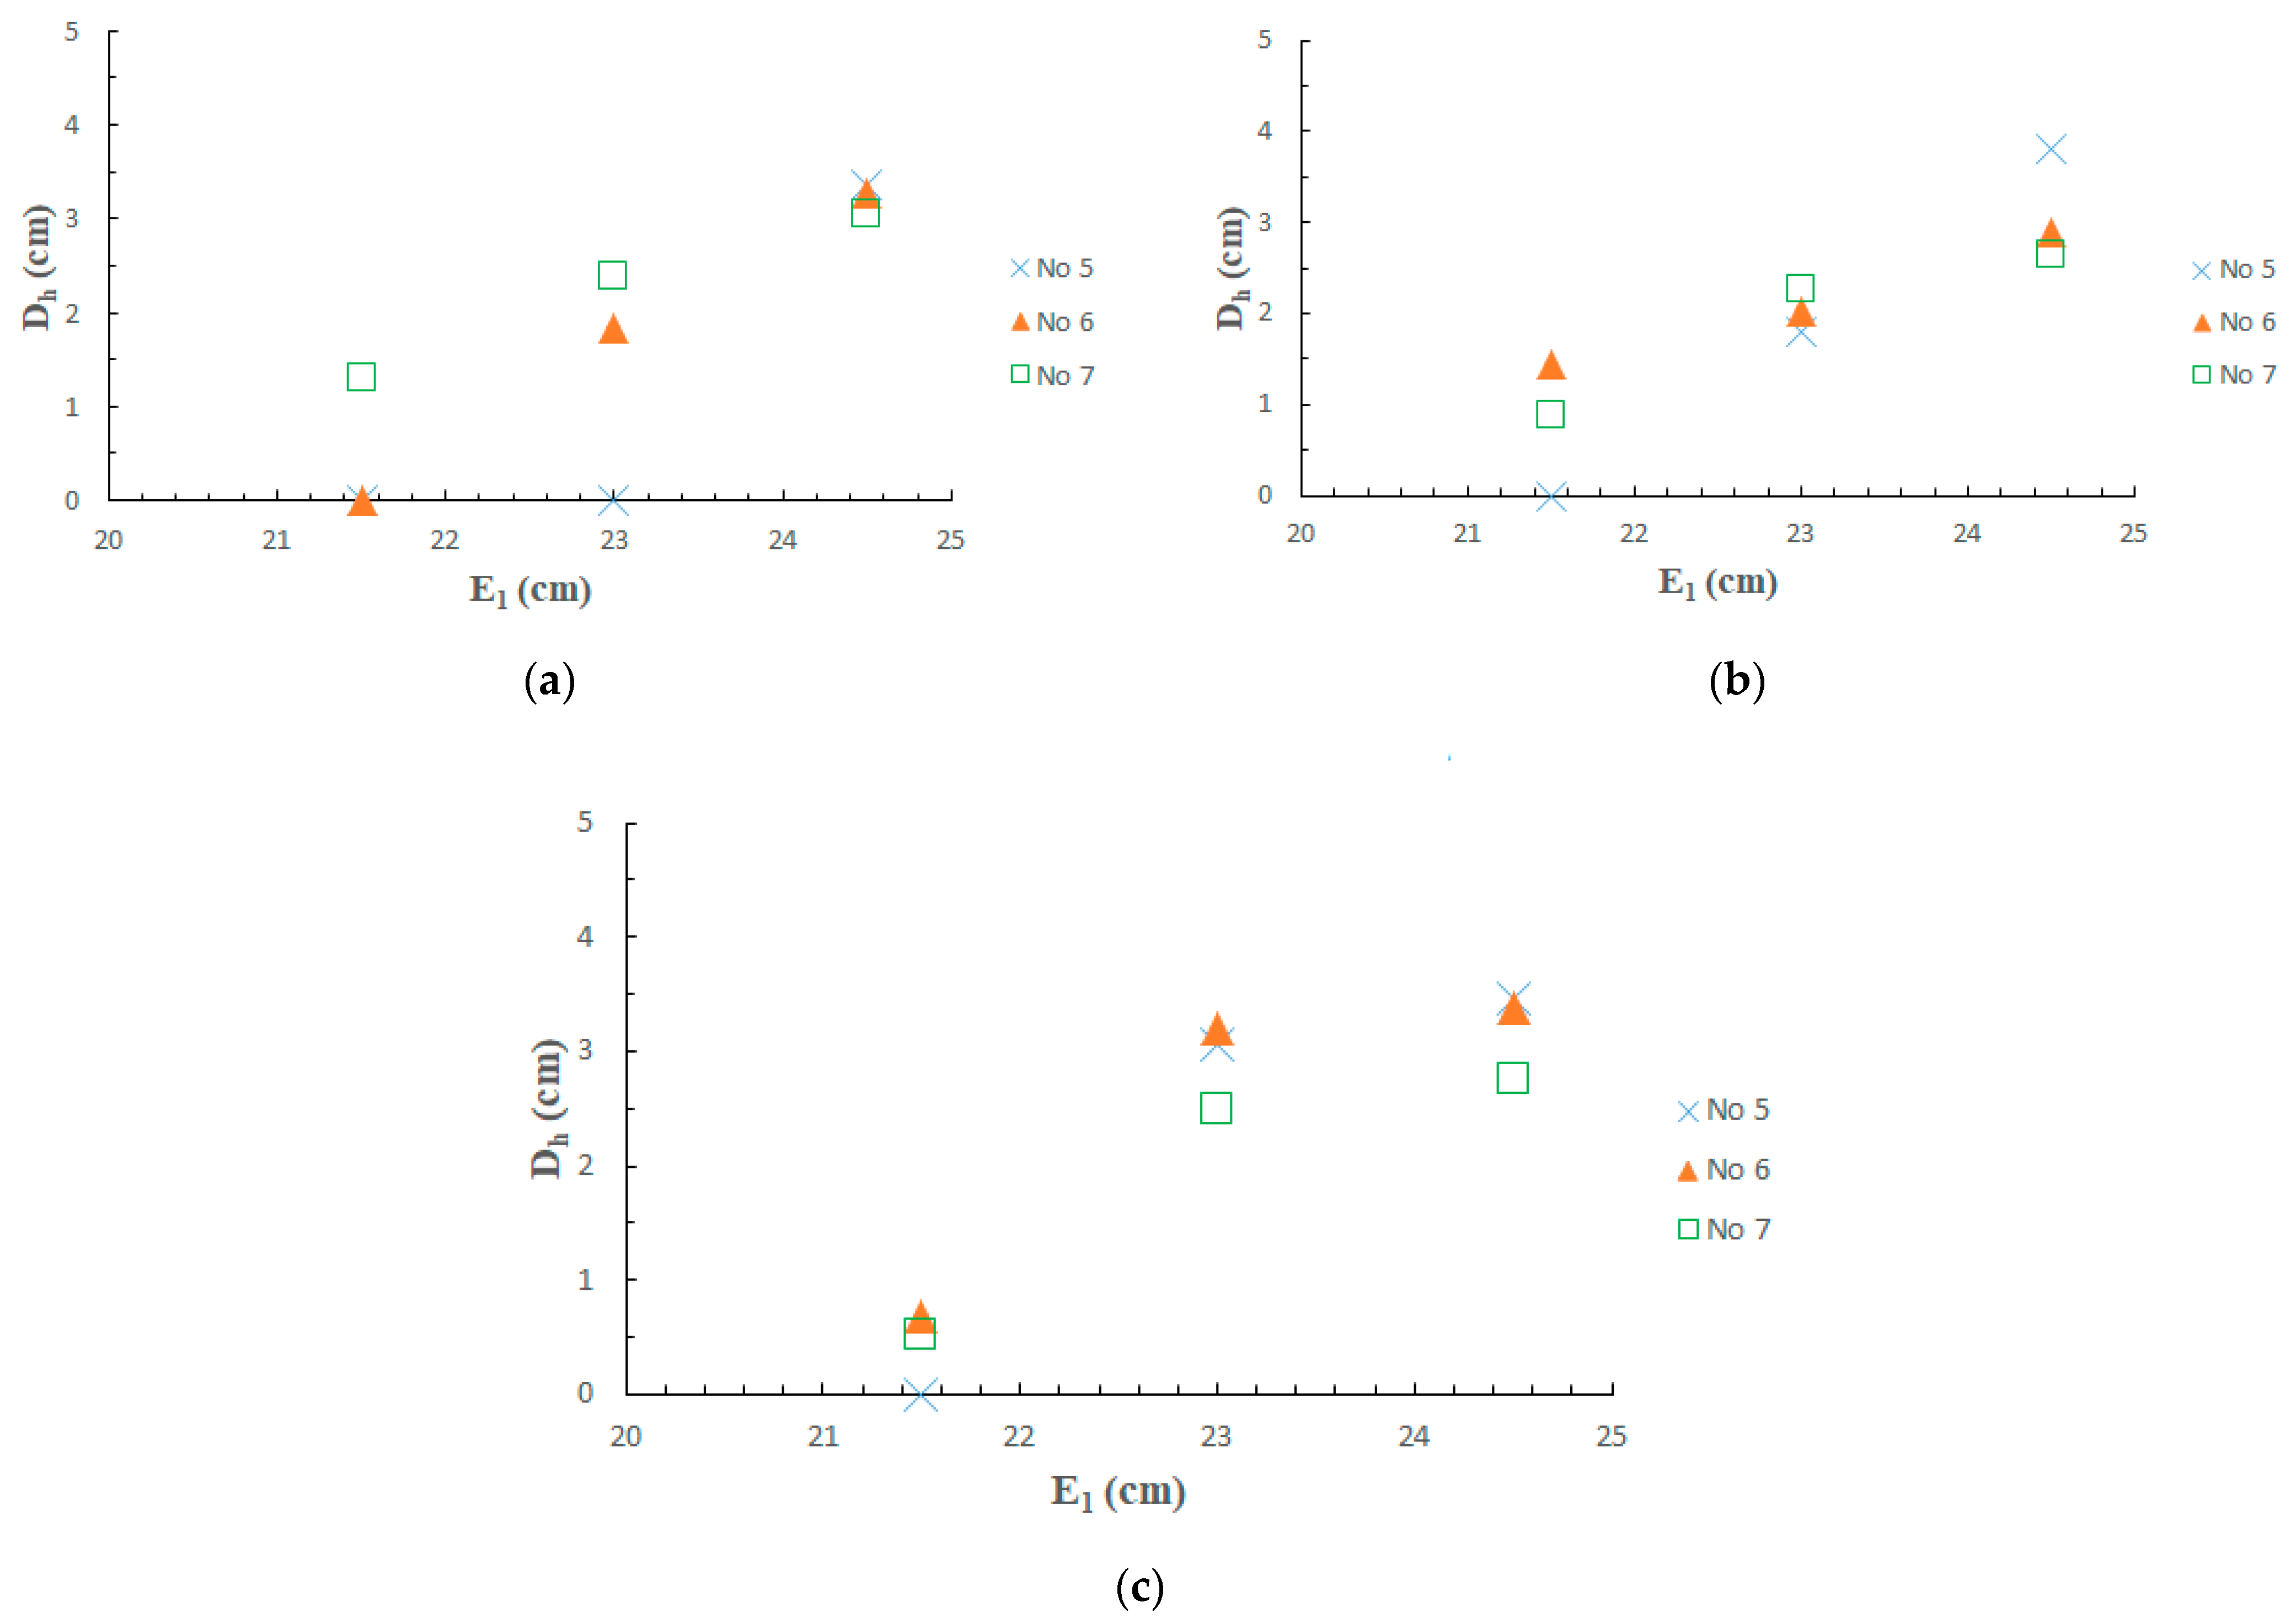
3.3. Effect of Energy Head on Deposition Height

Figure 6 shows that for all particle sizes, the deposition height (Dh) increases with an increase in the energy head. The deposition height gap between the 2 and 3 cm overtopping depths for the particles was higher for the 1:2 and 1:3 slope conditions. However, for the 1:4 slope condition, this difference was low, and the values were 2 cm and 3 cm for the No. 5 size particles, 3.06 cm and 3.46 cm for the No. 6 size particles, and 3.19 cm and 3.38 cm for the No. 7 size particles, respectively. This is because, for this slope, the flow of water is faster, and with scouring, the particle is blown downstream owing to the horizontal component of the flow. As the critical shear stress is dependent on particle sizes, particle unit weight, and flow conditions, increased flow velocity over a steeper slope causes the smaller particles to be displaced by the flowing water. This is why the deposition was not very high with the eroded particles. In all slope cases with a 3 cm overtopping depth, particle No. 5 had the highest deposition height. The No. 5 particle size can create 10% and 20% more height of deposition compared to the No. 6 size and No. 7 size particles, respectively.

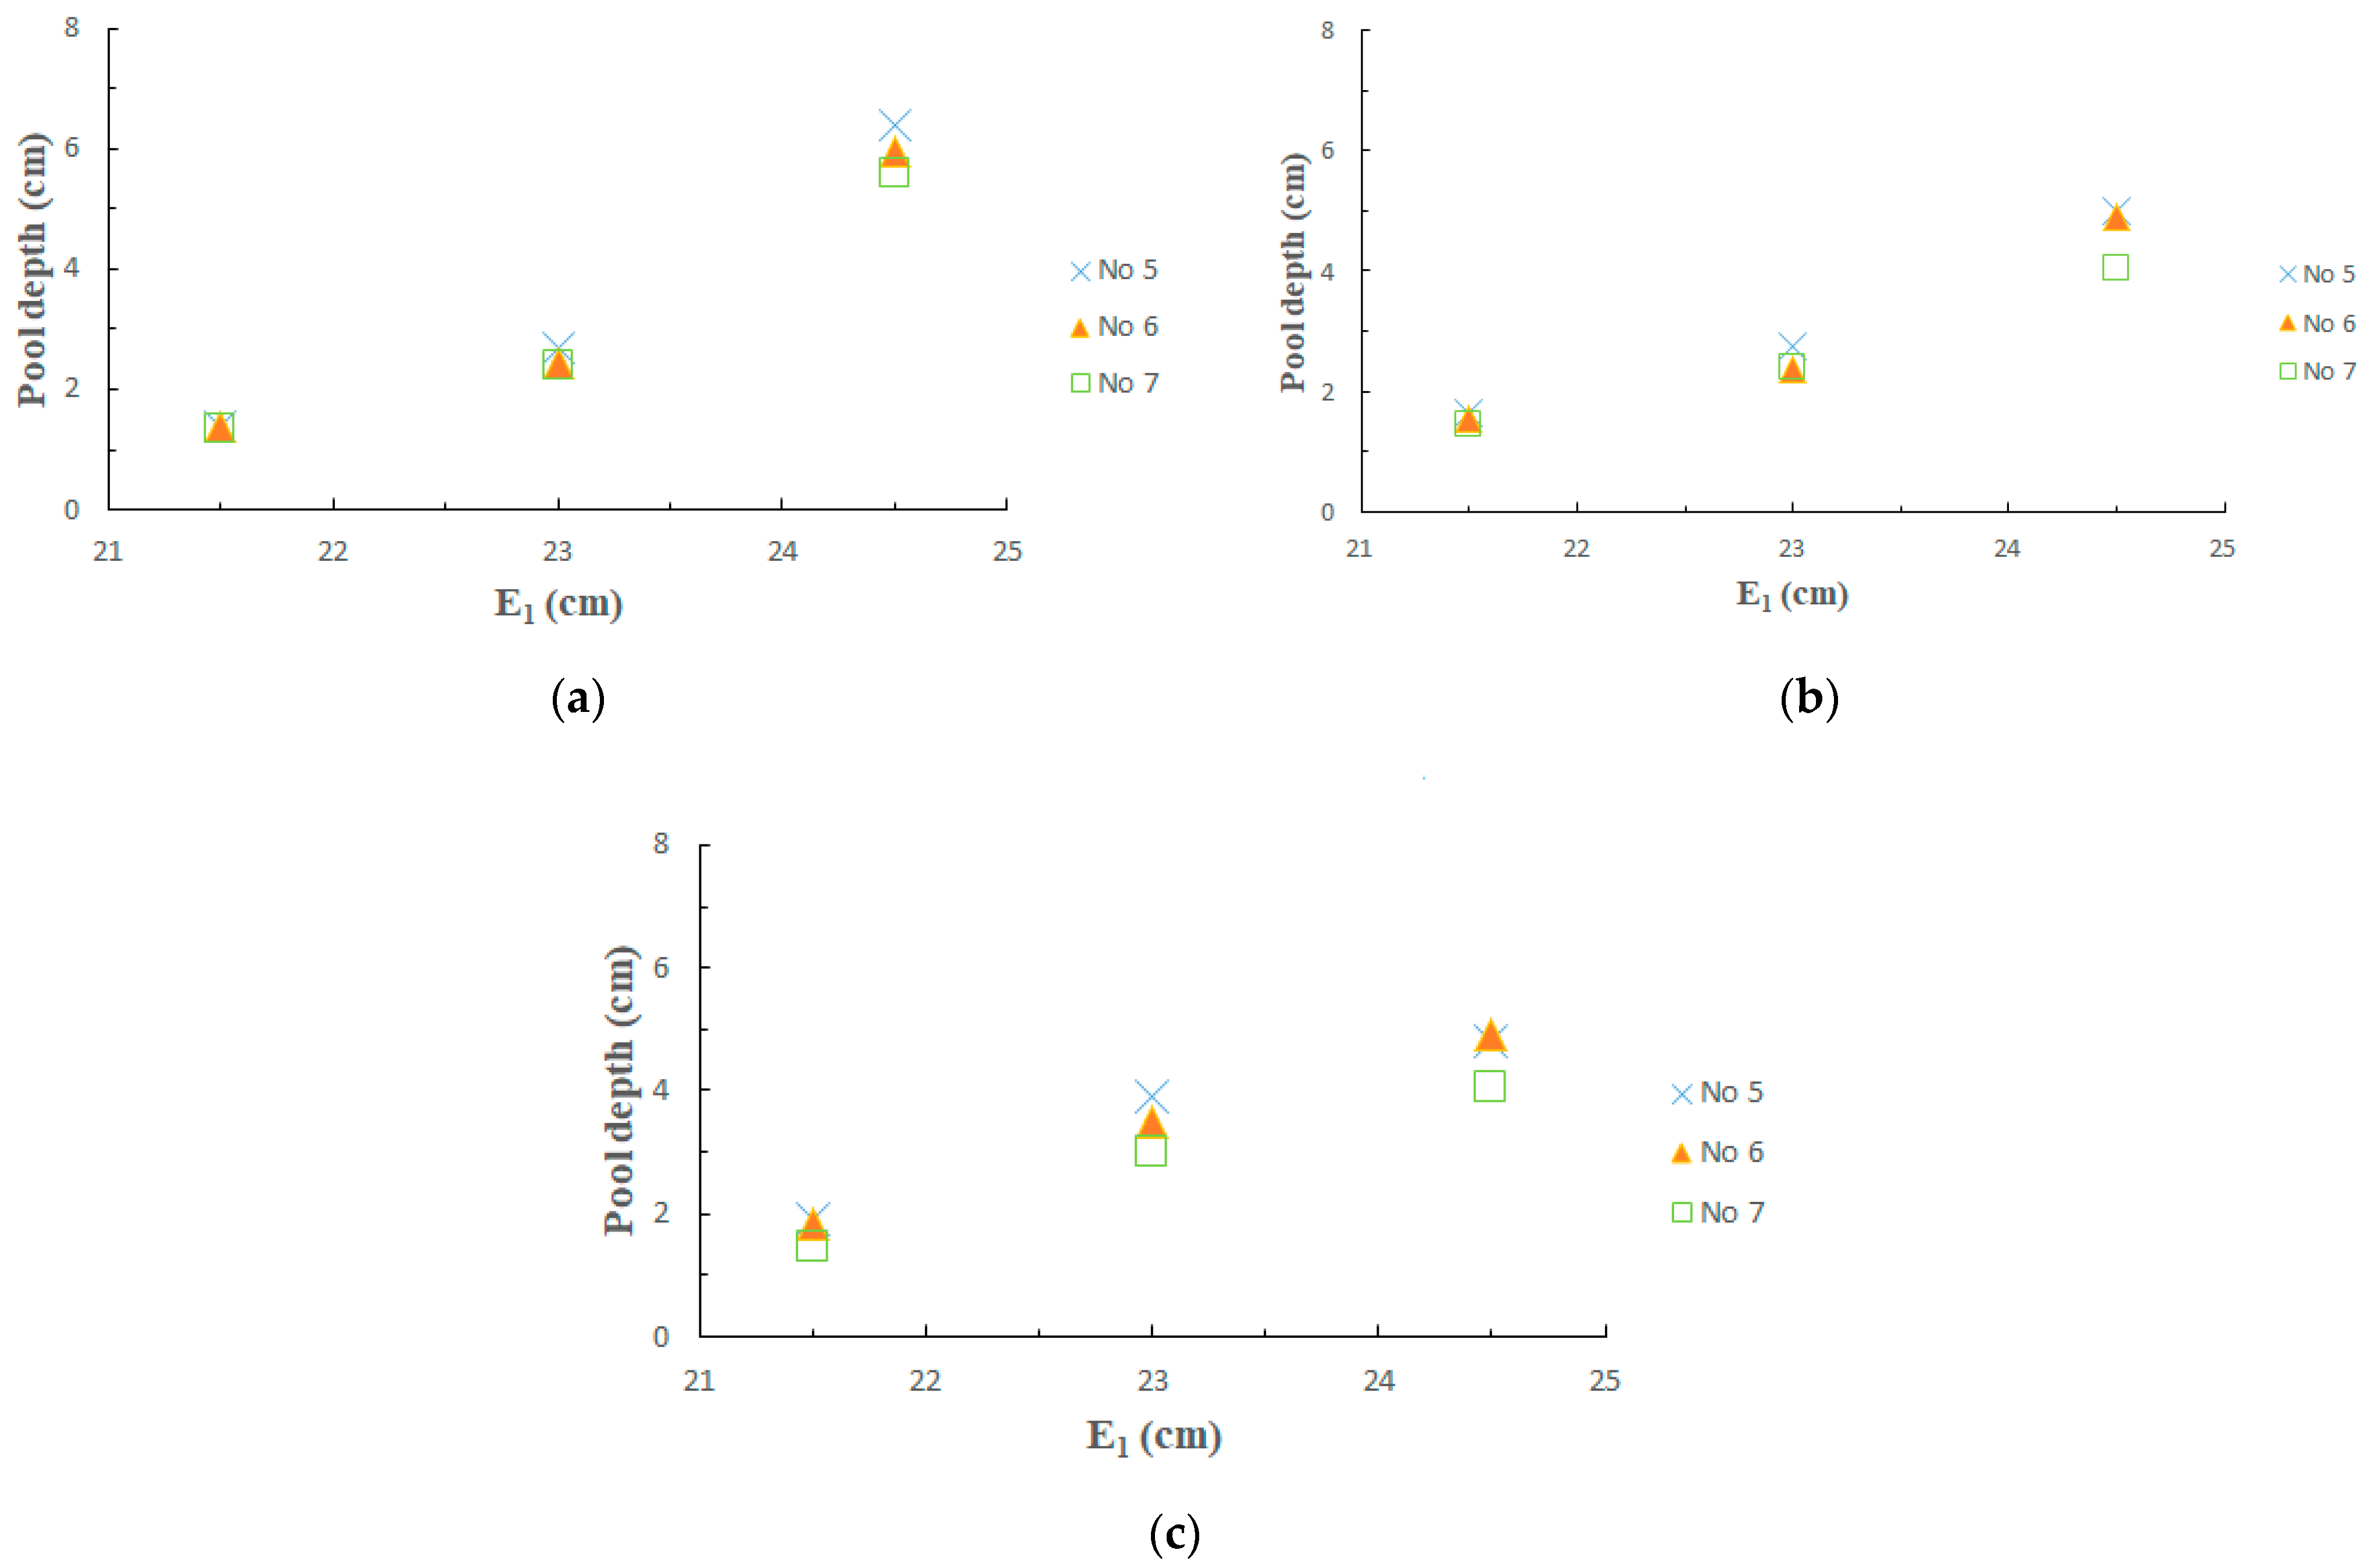
3.4. Effect of Energy Head on Plunge Pool Depth

Figure 7 shows that the plunge pool depths increase as the energy heads increase. Among all the slope conditions, particle No. 5 showed the highest depth of the plunge pool, and particle No. 7 had the lowest depth. The coarser ripraps resisted the water flow as they had a higher critical shear stress to move. Thus, the energy of the water was unable to dislocate the coarser particles and spread over the channel bed, which contributed to creating a heave near the scour hole, resulting in a large pool depth. However, finer particles possess a small critical shear stress, and the energy of water is sufficient to move the No. 7 particles and spread over the channel bed, resulting in smaller pool depths. Therefore, for the same energy head and slope, larger-sized particles create large plunge pool water depths and dissipate more energy than the other two types of particles. On average, No. 5 size particles can create a 5% deeper water pool compared to No. 6 size particles and a 15% deeper water pool compared to No. 7 size particles for all slopes and overtopping depth conditions.

4. Discussion

4.1. Effect of Riprap Size, Tailwater, and Flow Structure on Scour Phenomenon

Figure 8 shows that the scour depths and extent of scouring differ depending on the downstream slope and riprap size. The steeper slope (1:2) causes deeper scour depth extending from 2.96 cm to 10.12 cm depending on ripraps size, as shown in Figure 8a. The coarser ripraps showed a lower scour depth. In Figure 8b, it is observed that for the gentle slope (1:4) case, the maximum scour depth was found to be 6.74 cm. The scour hole also showed a wider top width with an increase in the flow depth and sharpness of the slopes. It was also observed that the maximum depth of scours appeared closer to the embankment toe for the steeper slope 1:2 case compared with the gentle slope 1:4 case because of the sharpness of the impinging angle of the flowing water nappe and positions of hydraulic jumps. Despite the maximum scour depth for the granule or No. 7 size ripraps, the pool depth was smaller because the flowing water blew small-sized particles and spread over the channel bed, as shown in Figure 8. On the other hand, riprap No. 5 showed a shallower scour depth but a higher plunge pool, which caused more energy to dissipate as a heave of riprap was created near the scour hole. Depending on the position of maximum scour depth and maximum deposition height, the hydraulic jumps appeared to change the position and its strength.
Hence, the ratio of maximum deposition height (Dh) to maximum deposition position (Dh/L) determines the hydraulic jump position and its strength. The strong hydraulic jump for No. 5 size particles resulted from a Dh/L value of 0.3, while the very weak jump for No. 7 size particles resulted from a Dh/L value of 0.04.
In the case of gravel-size (No. 5) ripraps, irrespective of downstream slopes, the deposition height contributed to energy dissipation in addition to the plunge pool. The deposition also attenuated the turbulence of the flow, resulting in a more stable tailwater profile downstream of the deposition.

4.2. Relationship between Energy Head and Energy Dissipation

From Figure 9, it can be observed that for the 1:4 downstream slope condition, the energy dissipation increases with an increase in the size of the particles for the same overtopping depth. A similar relationship was found for the 1:2 and 1:3 slope conditions. Figure 9 also demonstrates that irrespective of the downstream slopes and E1 conditions, the energy dissipation was found to be larger in the case with a large riprap grain size (No. 5).
It was also observed that a higher tailwater depth resulting from riprap deposition contributed to more energy dissipation for coarser ripraps (No. 5). In contrast, finer No. 7 size ripraps showed the opposite phenomenon, resulting in more scour and lower energy dissipation, irrespective of the downstream slope of the embankment. The difference is particularly large for the 1:4 gradient case compared with the other grain sizes. A possible reason for this can be found in Section 3.2. For the 1:2 and 1:3 slope cases, when El was small, the effect of grain size on energy dissipation was small. On the other hand, as El increased, the change in energy dissipation with grain size increased. This occurred because, with the increase in initial energy, a large scour depth, as well as higher deposition near the scour hole, was created, which caused a large plunge pool.
On average, quantitatively, No. 5 size particles can dissipate 4% and 7% more energy than No. 6 and No. 7 size particles, respectively, irrespective of the slope and overtopping depth conditions. Therefore, it can be concluded that particle No. 5 has the highest efficiency for energy dissipation.
As mentioned earlier, the initial scour depth around the toe of the embankment significantly affects headcut erosion and the complete breach of the embankment. Hence, it can be concluded that to delay the progression of embankment erosion during overtopping flow, it is important to ensure the plunge pool depth necessary for energy dissipation of overflowing water energy by reducing the amount of scour around the slope and by depositing riprap near the slope.
From this point of view, it was found that the case of a larger grain size (No. 5) could control the progression of embankment slope erosion due to overtopping. At the same time, it was also found that coarser grain size ripraps (No. 5) were the most stable case in reducing the loss of the embankment body under a wide range of overtopping and embankment slope conditions. In reality, the common practice of using ripraps as a scour protection measure must consider good gradation in addition to its size. Gradation contributes to good interlocking and minimum voids in riprap pitching layers, which is important for robust design. The maximum and minimum size of ripraps is fixed based on D50. The recommended maximum riprap size is twice the D50, and the recommended minimum size is one-third the D50 [21,22]. Based on the findings of this study, practically, larger size particles should be included more compared to the minimum size determined by design guidelines.
In this study, the influence of different hydraulic, geotechnical, and geometrical parameters on scour, deposition, and energy reduction characteristics was investigated. In the future, different parameter combinations can be used for a clearer understanding. The movable bed may provide different outputs compared to this study under fixed bed conditions. Therefore, further analysis of movable beds is required in the future. Additionally, real cases of toe protection with riprap data should be used to validate the experimental results. Also, an experimental uncertainty analysis needs to be carried out by means of repetitive tests. This work and future studies would contribute to a more sustainable and economical scour protection design.

5. Conclusions

Different particle sizes have different impacts on scour and deposition formation, as well as energy reduction characteristics subject to different slopes and overtopping flow depth conditions. Among these three different sizes of riprap particles, the largest in size (coarse gravel) reduces the scour depth and generates a higher deposition height to create a larger plunge pool depth, resulting in more energy dissipation. On the other hand, granules or finer particles showed maximum scour depth and shallower pool depth. In reality, the severity and time of embankment breakage depend on the initial scour depth and plunge pool depth during overtopping flow. Owing to the overtopping of the embankment during any extreme flood events, the toe of the downstream embankment is first affected, and riprap particles can be used to minimize scouring at the toe and subsequent headcut migration. Despite the overtopping phenomenon practically taking place under movable bed conditions, the overall results regarding scouring and deposition characteristics found in this study remain similar to fixed bed conditions as the principles of the scouring phenomena do not change.
Finally, it can be concluded that to protect the embankment from breaching, practically a riprap with a larger particle size is needed at the downstream toe to decrease the energy of water and minimize the scour depth and subsequent headcut migration.

Author Contributions

Conducting experiments, data analysis, and writing—original draft preparation: A.R.M.A.-B. Data explanation and writing—original draft preparation: M.M.B. Supervision and writing—review and editing: J.Y. All authors have read and agreed to the published version of the manuscript.

Funding

This work was supported by JSPS KAKENHI Grant Number 19K04611.

Data Availability Statement

The data supporting the findings of this study are available from the corresponding author upon request.

Acknowledgments

We would like to express our gratitude to all those who supported us in this study.

Conflicts of Interest

The authors declare no conflicts of interest.

References

  1. Schmocker, L. The failure of embankment dams due to overtopping. J. Hydraul. Res. 2009, 47, 288. [Google Scholar] [CrossRef]
  2. Cestero, J.A.F.; Imran, J.; Chaudhry, M.H. Experimental Investigation of the Effects of Soil Properties on Levee Breach by Overtopping. J. Hydraul. Eng. 2015, 141, 04014085. [Google Scholar] [CrossRef]
  3. Billah, M.M.; Yagisawa, J. Applicability of Energy Based and Stress Based Headcut Migration Model to Earthen Embankment with Stratified Sub-surface. In Proceedings of the ICCESD 2022, KUET, Khulna, Bangladesh, 10–12 February 2022; p. 136. [Google Scholar]
  4. Liu, Z.; Li, T.; Ding, Y.; Jiang, S. A soil tensile strength based headcut migration model of breach side slope. Water 2020, 12, 2666. [Google Scholar] [CrossRef]
  5. Afreen, T.; Binh, Y. Investigation of Scour Pattern Downstream. J. Jpn. Soc. Civ. Eng. Ser. B1 (Hydraul. Eng.) 2015, 59, 175–180. [Google Scholar]
  6. Billah, M.; Yagisawa, J. Headcut Migration in Earthen Embankment Induced by Varying Sub-surface and Seepage State under Overflow. Geotech. Geol. Eng. 2023, 41, 4659–4676. [Google Scholar] [CrossRef]
  7. Billah, M.; Yagisawa, J. Experimental investigation on effect of initial phreatic line position inside earthen embankment on headcut migration during overtopping flow. J. Jpn. Soc. Civ. Eng. Ser. B1 (Hydraulic Eng.) 2020, 76, I_565–I_570. [Google Scholar] [CrossRef] [PubMed]
  8. Jayaratne, M.P.R.; Premaratne, B.; Adewale, A.; Mikami, T.; Matsuba, S.; Shibayama, T.; Esteban, M.; Nistor, I. Failure mechanisms and local scour at coastal structures induced by Tsunami. Coast. Eng. J. 2016, 58, 1640017. [Google Scholar] [CrossRef]
  9. Zhao, G.; Visser, P.J.; Peeters, P.; Vrijling, H.K. Prediction of Headcut Erosion Development on the Breach Slope. In Proceedings of the ICSE6, Paris, France, 27–31 August 2012; pp. 1257–1264. [Google Scholar]
  10. Johnson, E.B.; Testik, F.Y.; Ravichandran, N.; Schooler, J. Levee scour from overtopping storm waves and scour counter measures. Ocean Eng. 2013, 57, 72–82. [Google Scholar] [CrossRef]
  11. Nishikawa, S.; Yagisawa, J. Effect of Hard-Erodible Soil Layer on Scour Around Embankment Toe Due to Overtopping Flow. J. Jpn. Soc. Civ. Eng. Ser. B1 (Hydraul. Eng.) 2020, 76, 1165–1170. (In Japanese) [Google Scholar] [CrossRef] [PubMed]
  12. Elalfy, E.; Tabrizi, A.A.; Chaudhry, M.H. Numerical and Experimental Modeling of Levee Breach Including Slumping Failure of Breach Sides. J. Hydraul. Eng. 2018, 144, 04017066. [Google Scholar] [CrossRef]
  13. Sarmiento, J.; Guanche, R.; Iturrioz, A.; Ojanguren, T.; Ávila, A.; Yanes, C. Experimental evaluation of dynamic rock scour protection in morphodynamic environments for offshore wind jackets. Energies 2021, 14, 3379. [Google Scholar] [CrossRef]
  14. Pham, M.-T.; Pham, D.-D.; Vu, D.-L.; Dias, D. Embankments Reinforced by Vertical Inclusions on Soft Soil: Numerical Study of Stress Redistribution. Geotechnics 2023, 3, 1279–1293. [Google Scholar] [CrossRef]
  15. Pagliara, S.; Palermo, M.; Carnacina, I. Live-bed scour downstream of block ramps for low densimetric Froude numbers. Int. J. Sediment Res. 2012, 27, 337–350. [Google Scholar] [CrossRef]
  16. Pagliara, S.; Kurdistani, S.M. Scour downstream of cross-vane structures. J. Hydro-environ. Res. 2013, 7, 236–242. [Google Scholar] [CrossRef]
  17. Farhoudi, J.; Smith, K.V.H. Local scour profiles downstream of hydraulic jump. J. Hydraul. Res. 1985, 23, 343–358. [Google Scholar] [CrossRef]
  18. Stein, O.R.; Julien, P.Y.; Alonso, C.V. Mechanics of jet scour downstream of a headcut. J. Hydraul. Res. 1993, 31, 723–738. [Google Scholar] [CrossRef]
  19. Taylor, P.; Dargahi, B. Scour development downstream of a spillway. J. Hydraul. Res. 2003, 41, 417–426. [Google Scholar] [CrossRef]
  20. Hameed, M.M.; Khaleel, F.; Alomar, M.K.; Razali, S.F.M.; AlSaadi, M.A.; Al-Ansari, N. Introducing high-order response surface method for improving scour depth prediction downstream of weirs. Appl. Water Sci. 2024, 14, 120. [Google Scholar] [CrossRef]
  21. Lagasse, P.F.; Clopper, P.E.; Zevenbergen, L.W.; Ruff, J.F. Riprap Design Criteria, Recommended Specifications, and Quality Control. Natl. Coop. Highw. Res. Progr. Rep. 2008, 568, 226. Available online: https://hdl.handle.net/20.500.11970/100041 (accessed on 10 July 2024).
  22. Ruh-Ming, L.; MacArthur, R.; Cotton, G. Sizing riprap for the protection of approach embankments & spur dikes and limiting the depth of scour at bridge piers & abutments. Lit. Rev. Arizona Case Hist. 1989, 1, 3–25. [Google Scholar]
Figure 1. Schematic diagram of experimental setup.
Geotechnics 04 00040 g001
Figure 2. (a) Experimental setup in the laboratory. (b) Definition sketch of Sd, Dh, Dw, L, and Sd.
Geotechnics 04 00040 g002
Figure 3. Cumulative grain size frequency plot of ripraps.
Geotechnics 04 00040 g003
Figure 4. Three-dimensional topography evolution (left side) obtained from LiDAR data and images during the experiment (right side) at different time intervals for Case M-C-h3. (The units used in the 3D contour are centimeters).
Geotechnics 04 00040 g004
Figure 5. Relationship between scour depth (Sd) and energy head (E1) for (a) 1:2 slope, (b) 1:3 slope, and (c) 1:4 slope cases.
Geotechnics 04 00040 g005
Figure 6. Relationship between deposition height and energy head for (a) 1:2 slope, (b) 1:3 slope, and (c) 1:4 slope cases.
Geotechnics 04 00040 g006
Figure 7. Relationship between plunge pool depth due to hydraulic jump and energy head during experimental run for (a) 1:2 slope, (b) 1:3 slope, and (c) 1:4 slope cases.
Geotechnics 04 00040 g007
Figure 8. Demonstration of scouring shape and fluctuation of water through longitudinal profile of water surface and riprap bed during experimental run for (a) 1:2 slope and (b) 1:4 slope cases.
Geotechnics 04 00040 g008
Figure 9. Relationship between energy head and relative energy dissipation due to presence of ripraps for (a) 1:2 slope, (b) 1:3 slope, and (c) 1:4 slope cases.
Geotechnics 04 00040 g009
Table 1. Experimental cases.
Case No.Height of EmbankmentDownstream
Slope of Embankment
RiprapOvertopping
Flow Depth
Case ID
(Slope—Riprap—Flow Depth)
H (cm)(V:H)Sized50 (mm)h (cm)
1201:2 (Steep)No. 5 (coarse gravel)16.411S-C-h1
22S-C-h2
33S-C-h3
4No. 6 (medium gravel)8.481S-M-h1
52S-M-h2
63S-M-h3
7No. 7 (fine or granule)3.391S-F-h1
82S-F-h2
93S-F-h3
10201:3 (Moderate)No. 516.411M-C-h1
112M-C-h2
123M-C-h3
13No. 68.481M-M-h1
142M-M-h2
153M-M-h3
16No. 73.391M-F-h1
172M-F-h2
183M-F-h3
19201:4 (Gentle)No. 516.411G-C-h1
202G-C-h2
213G-C-h3
22No. 68.481G-M-h1
232G-M-h2
243G-M-h3
25No. 73.391G-F-h1
262G-F-h2
273G-F-h3
Disclaimer/Publisher’s Note: The statements, opinions and data contained in all publications are solely those of the individual author(s) and contributor(s) and not of MDPI and/or the editor(s). MDPI and/or the editor(s) disclaim responsibility for any injury to people or property resulting from any ideas, methods, instructions or products referred to in the content.

