Case Report

Drone-Borne LiDAR and Photogrammetry Together with Historical Data for Studying a Paleo-Landslide Reactivated by Road-Cutting and Barrier Construction outside Jerusalem

1
Neev Center for Geoinfomatics, The Fredy & Nadine Herrmann Institute of Earth Sciences, The Hebrew University of Jerusalem, Jerusalem 9190401, Israel
2
Enso Geospatial, Ein Vered 4069600, Israel
*
Author to whom correspondence should be addressed.
Geotechnics 2024, 4(3), 786-806; https://doi.org/10.3390/geotechnics4030041
Submission received: 3 April 2024 / Revised: 27 July 2024 / Accepted: 30 July 2024 / Published: 9 August 2024

Abstract

:
Assessment of landslide hazards often depends on the ability to track possible changes in natural slopes. To that end, historical air photos can be useful, particularly when slope stability is compromised by visible cracking. Undocumented landsliding rejuvenates a paleo-landslide on a busy motorway connecting Jerusalem to a small Jewish settlement. Recently, a plan for broadening the motorway was approved, and we were asked to study the hazards of the road by Israeli NGOs and Palestinian residents of the area. We captured high-resolution topography around the unstable slope using drone-borne photogrammetry and LiDAR surveys. The modern data allow us to analyze historic air photos and topo maps to assess the level of sliding prior to and during modern landscaping. Our results indicate horizontal offsets of ~0.9–1.8 m and vertical offsets of 1.54–2.95 m at selected sites. We next assess the possible role of anthropogenic versus natural factors in compromising slope stability. We analyze monthly rain records together with seismic catalogs spanning several decades. Shortly after the motorway construction in 1995, a January 1996 rainstorm triggered a massive rockfall. The rockfall blocked traffic with up to 4 m-diameter boulders. We found that while a certain level of rain is a necessary condition for mobilizing the rock mass, it is the anthropogenic intervention that caused the rockfall in this site. We conclude that the recent plan for broadening the motorway jeopardizes the lives of vehicle passengers and the lives of future residents should the development materialize.

Graphical Abstract

1. Introduction

Background

Since late 1995, Motorway 385 has connected the Jewish settlement Har-Giloh, on the outskirts of Bethlehem, West Jerusalem (Figure 1). The road was disrupted by a rockfall at the end of January 1996, shortly after it was constructed. Huge boulders were dislodged onto the motorway, endangering lives and stopping traffic (Figure 2). The rockfall originated from a massive landslide following a rainstorm and shortly after the regional earthquake of magnitude Mw7.2 in the Gulf of Aqaba, on 22 November 1995.
We identify the activity as rejuvenating a massive paleo-landslide associated with rockfalls and crevasses over an area of about 0.03 Km2.
Such rejuvenation in the same geological setting had been reported from the vicinity [1,2]. The potential for further landsliding (and rockfalls) has serious implications for the safety of the motorway and its users, planned upgrading of the road’s traffic capacity, access to cultural heritage sites, and the politics of the Jewish settlements on Palestinian lands.
This project was initiated when our team was approached by two NGOs, assisting the local villagers Bimkom–Planners for planning Rights (bimkom.org) and ‘Ir Amim’ (Ir-amim.org.il/en). They sought a pro bono expert opinion with regard to geological stability of Motorway 385, planned to be widened on Palestinian villagers’ land by the Israeli military.
The main objective of the research is to measure the development of crevasses thoroughly and understand the mechanisms behind the whole complex, which includes landslides, rockfalls, and crevasses. This research aims to delve into the complex processes that lead to these natural hazards, shedding light on their underlying causes and potential triggers. By exploring the characteristics and behavior of rockfalls and crevasses, the study seeks to enhance our comprehension of these phenomena, ultimately contributing to improved risk assessment, mitigation strategies, and overall safety in regions prone to such events. In particular, we address the role of anthropogenic intervention in destabilizing the slope relative to meteorological and seismic loads. This should have ramifications on a plan to broaden the road and significantly increase its traffic capacity.

2. Meteorological, Geological, and Geotechnical Background

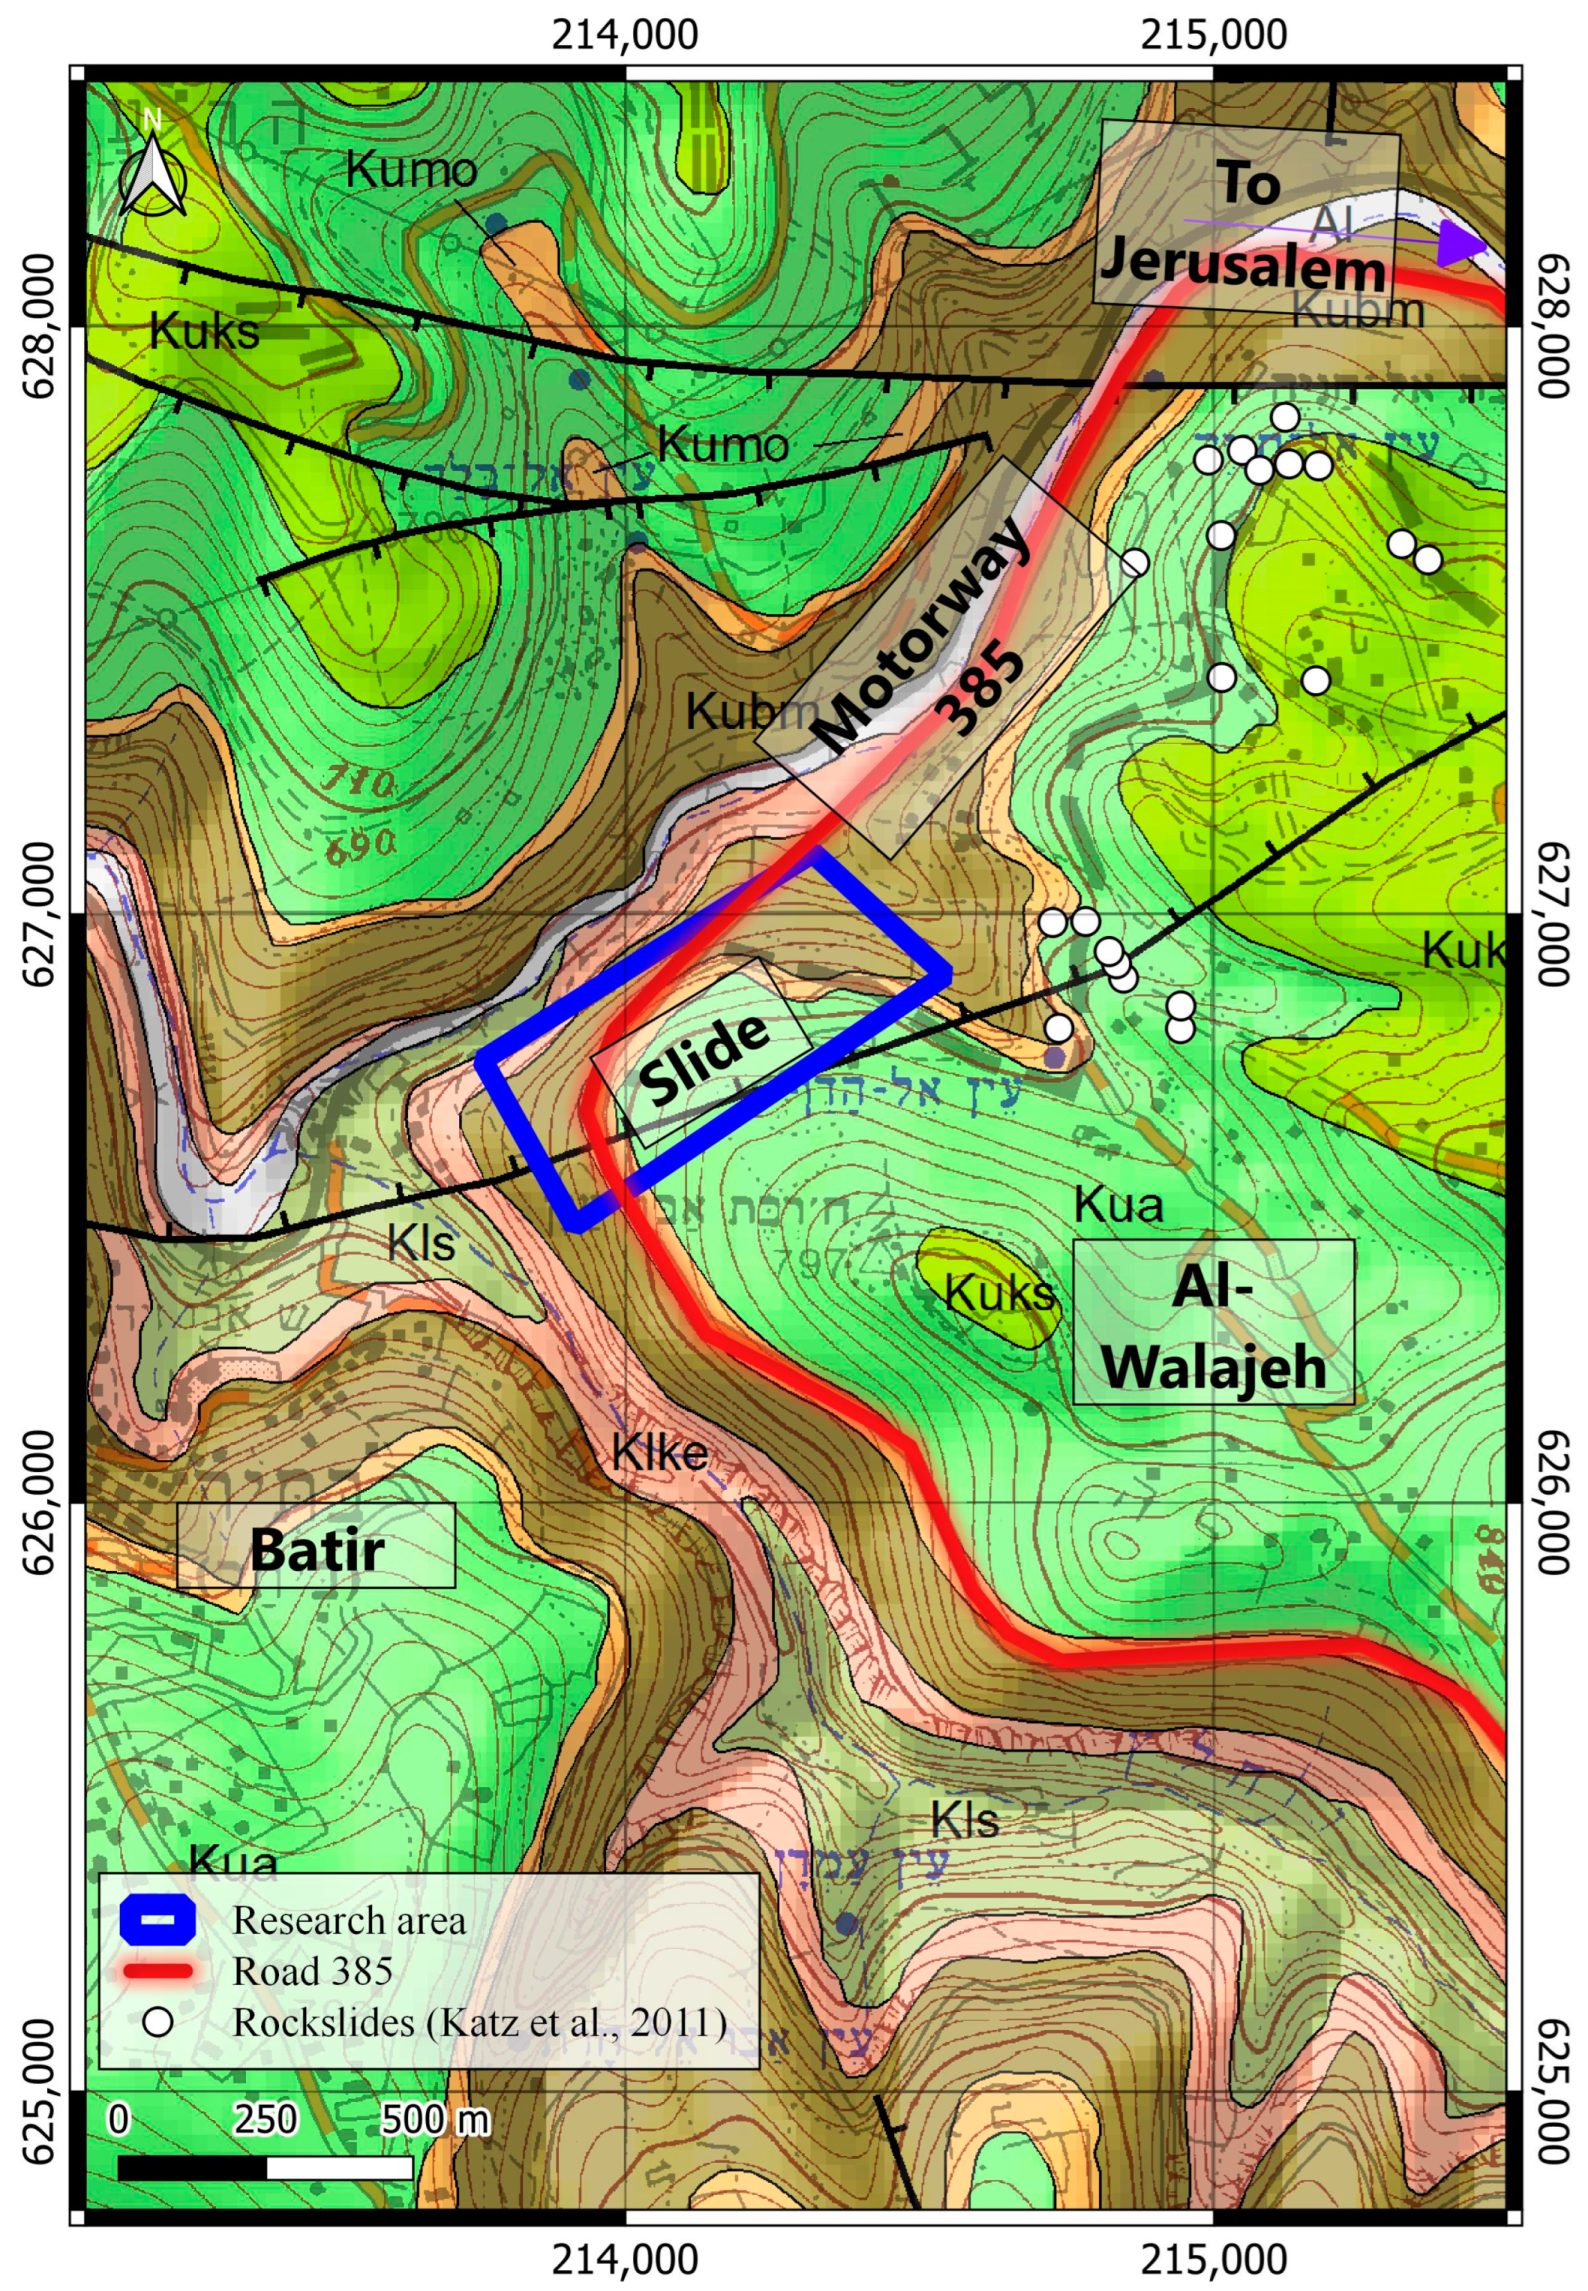
2.1. The Natural Environment

The research area lies in the Judean Hills, at an elevation of around 700 m above sea level. Precipitation is around 600 mm/yr [3], where the rainy months are typically from October to March, with monthly precipitation up to ~440 mm according to data made accessible by the Israel Meteorological Service for the years 1967–2023 (Appendix A). Vegetation is dominated by shrubs, with a young and significant population of young pine trees (A. Shmida, personal communication). The margins of the area are cultivated for olive groves, with remnants of ancient rock-carved presses (apparently for olives and grapes—Appendix B).
The rocks exposed in the research area are chiefly Cretaceous marine carbonates of the Judea Group (Figure 3 and Figure 4), some of which were fragmented and mobilized downslope earlier during the Cenozoic. Later, calcrete formation indurated the fragments to form a massive breccia, with boulders up to 1 m in diameter [1,2]. The two particular formations involved in the sliding are from Lower Cenomanian: the marly Motza Formation (decollement) and a breccia originating from the Aminadav Formation. We use the geological 1:50,000 map of Sneh and Avni (2011) [4] (Figure 3), where locally, we interpret their Aminadav Formation as the calcrete-cemented Cenozoic breccia.

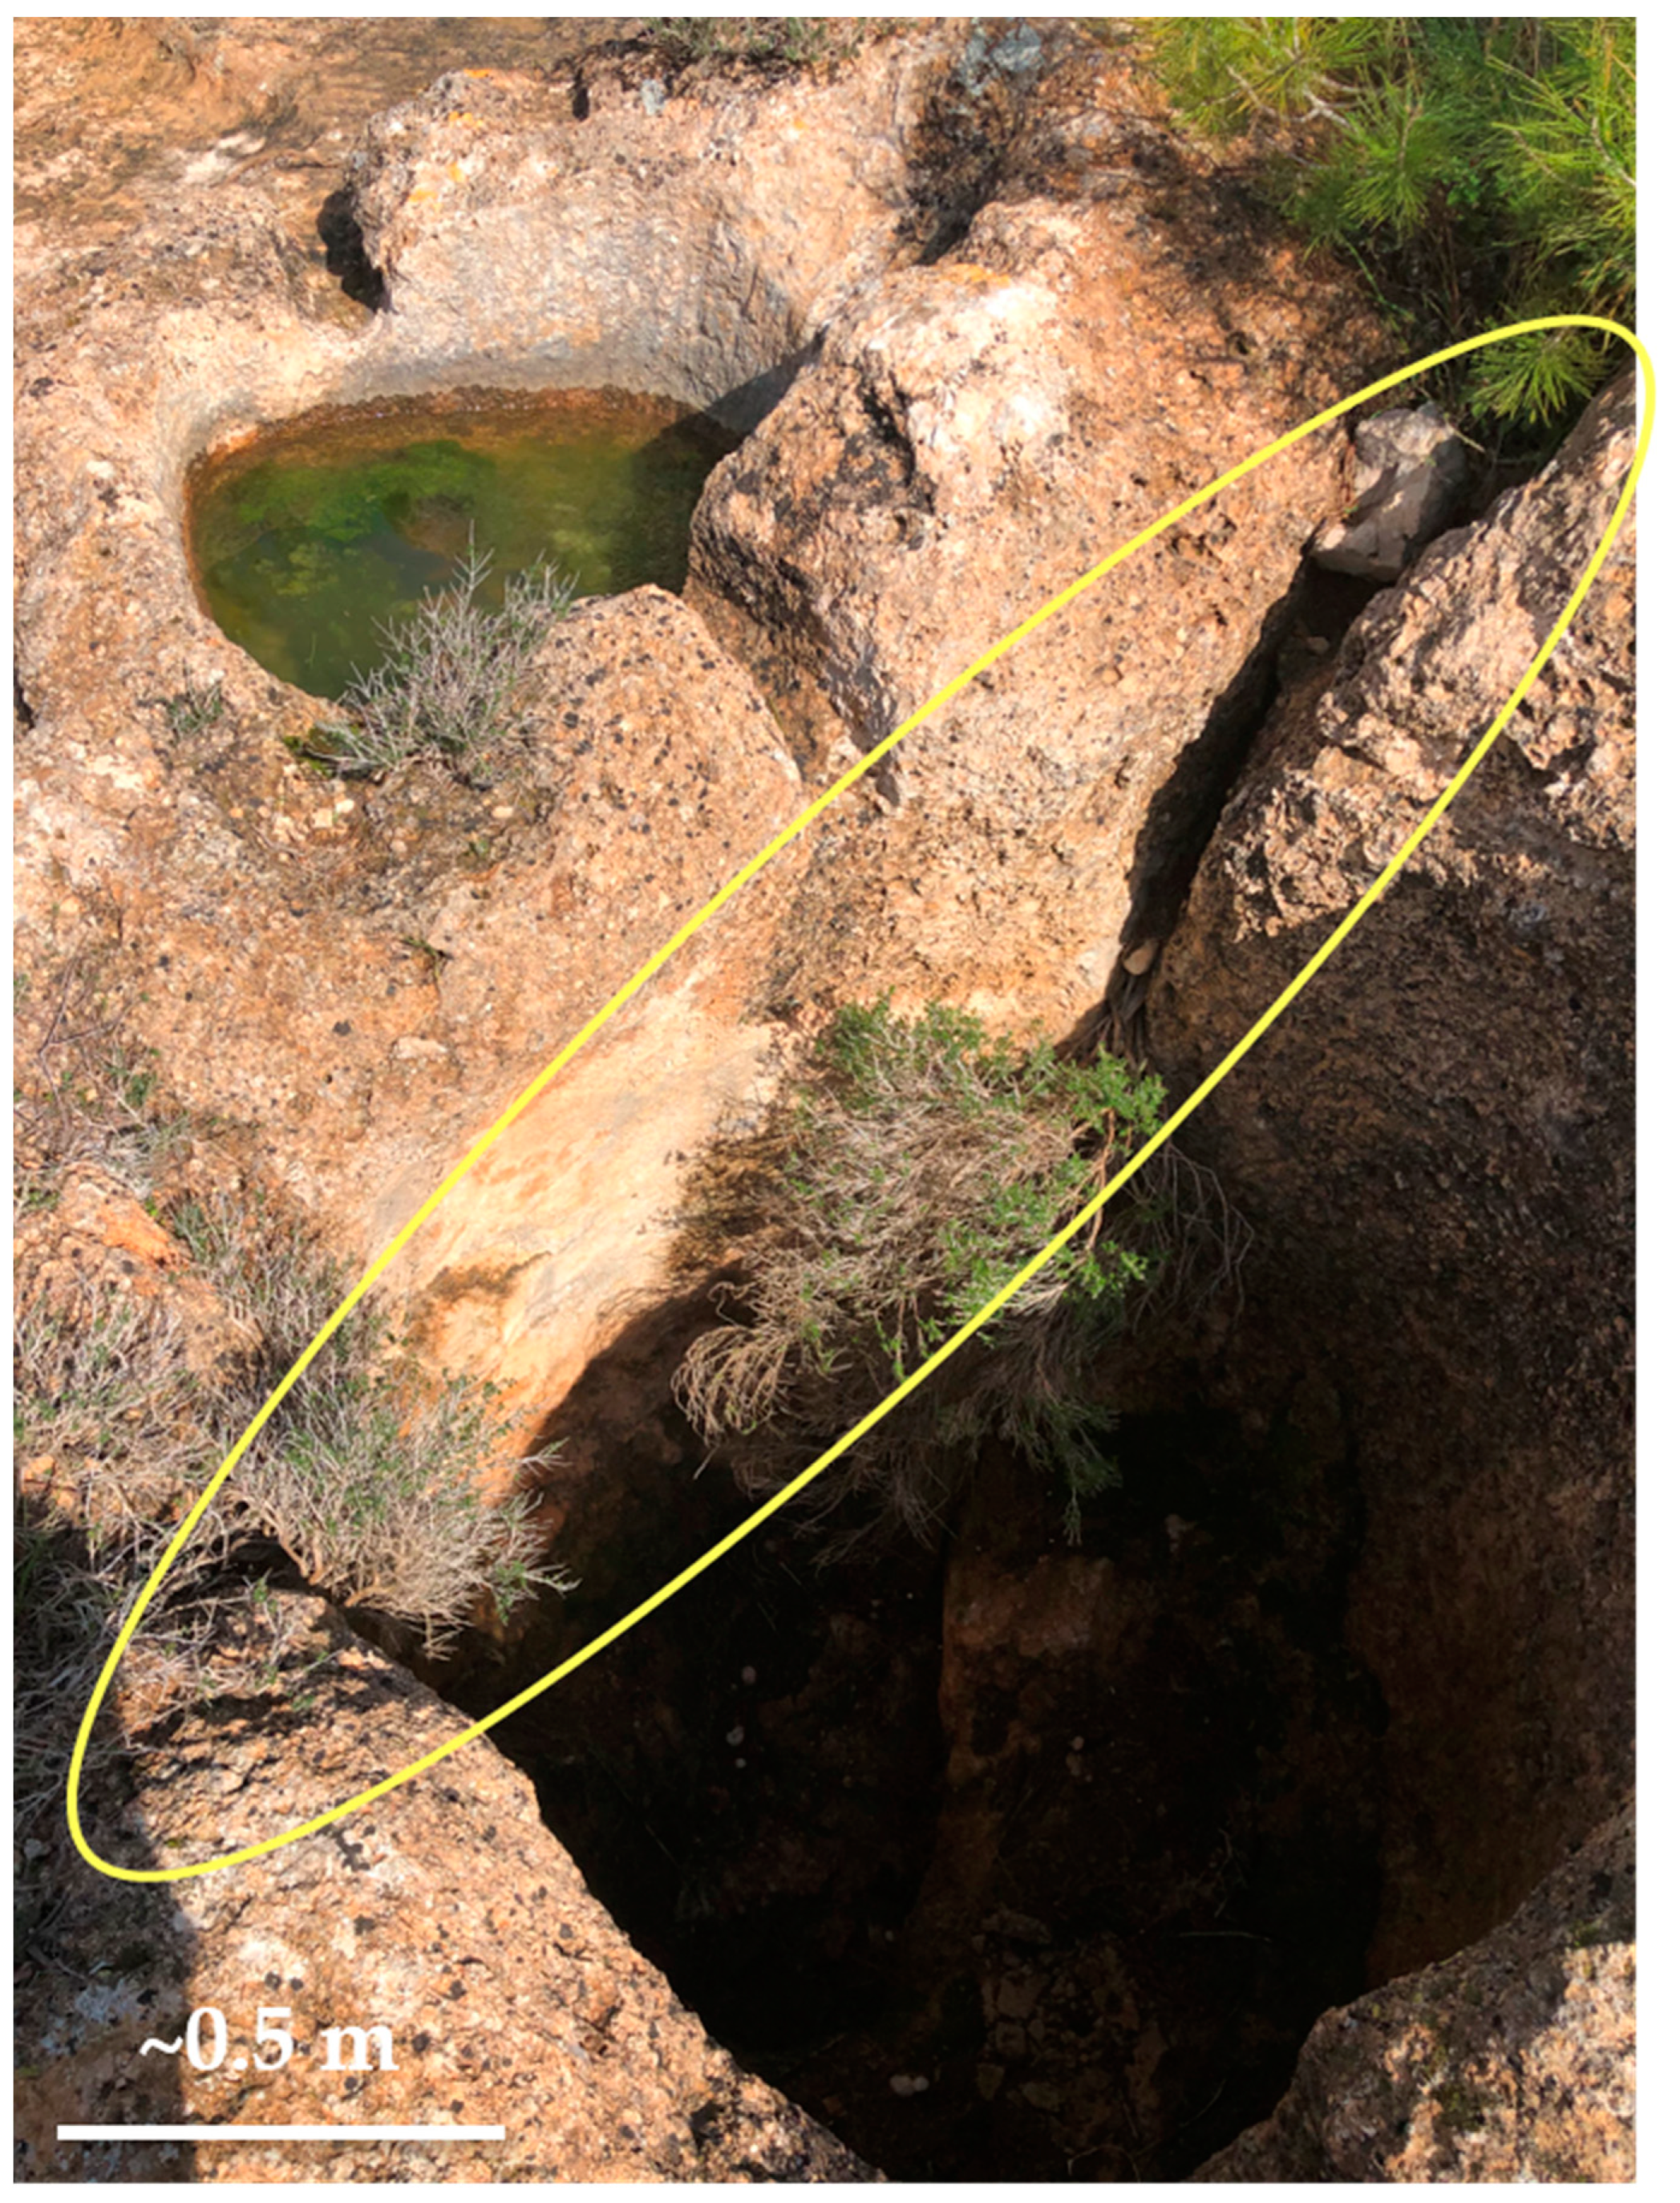
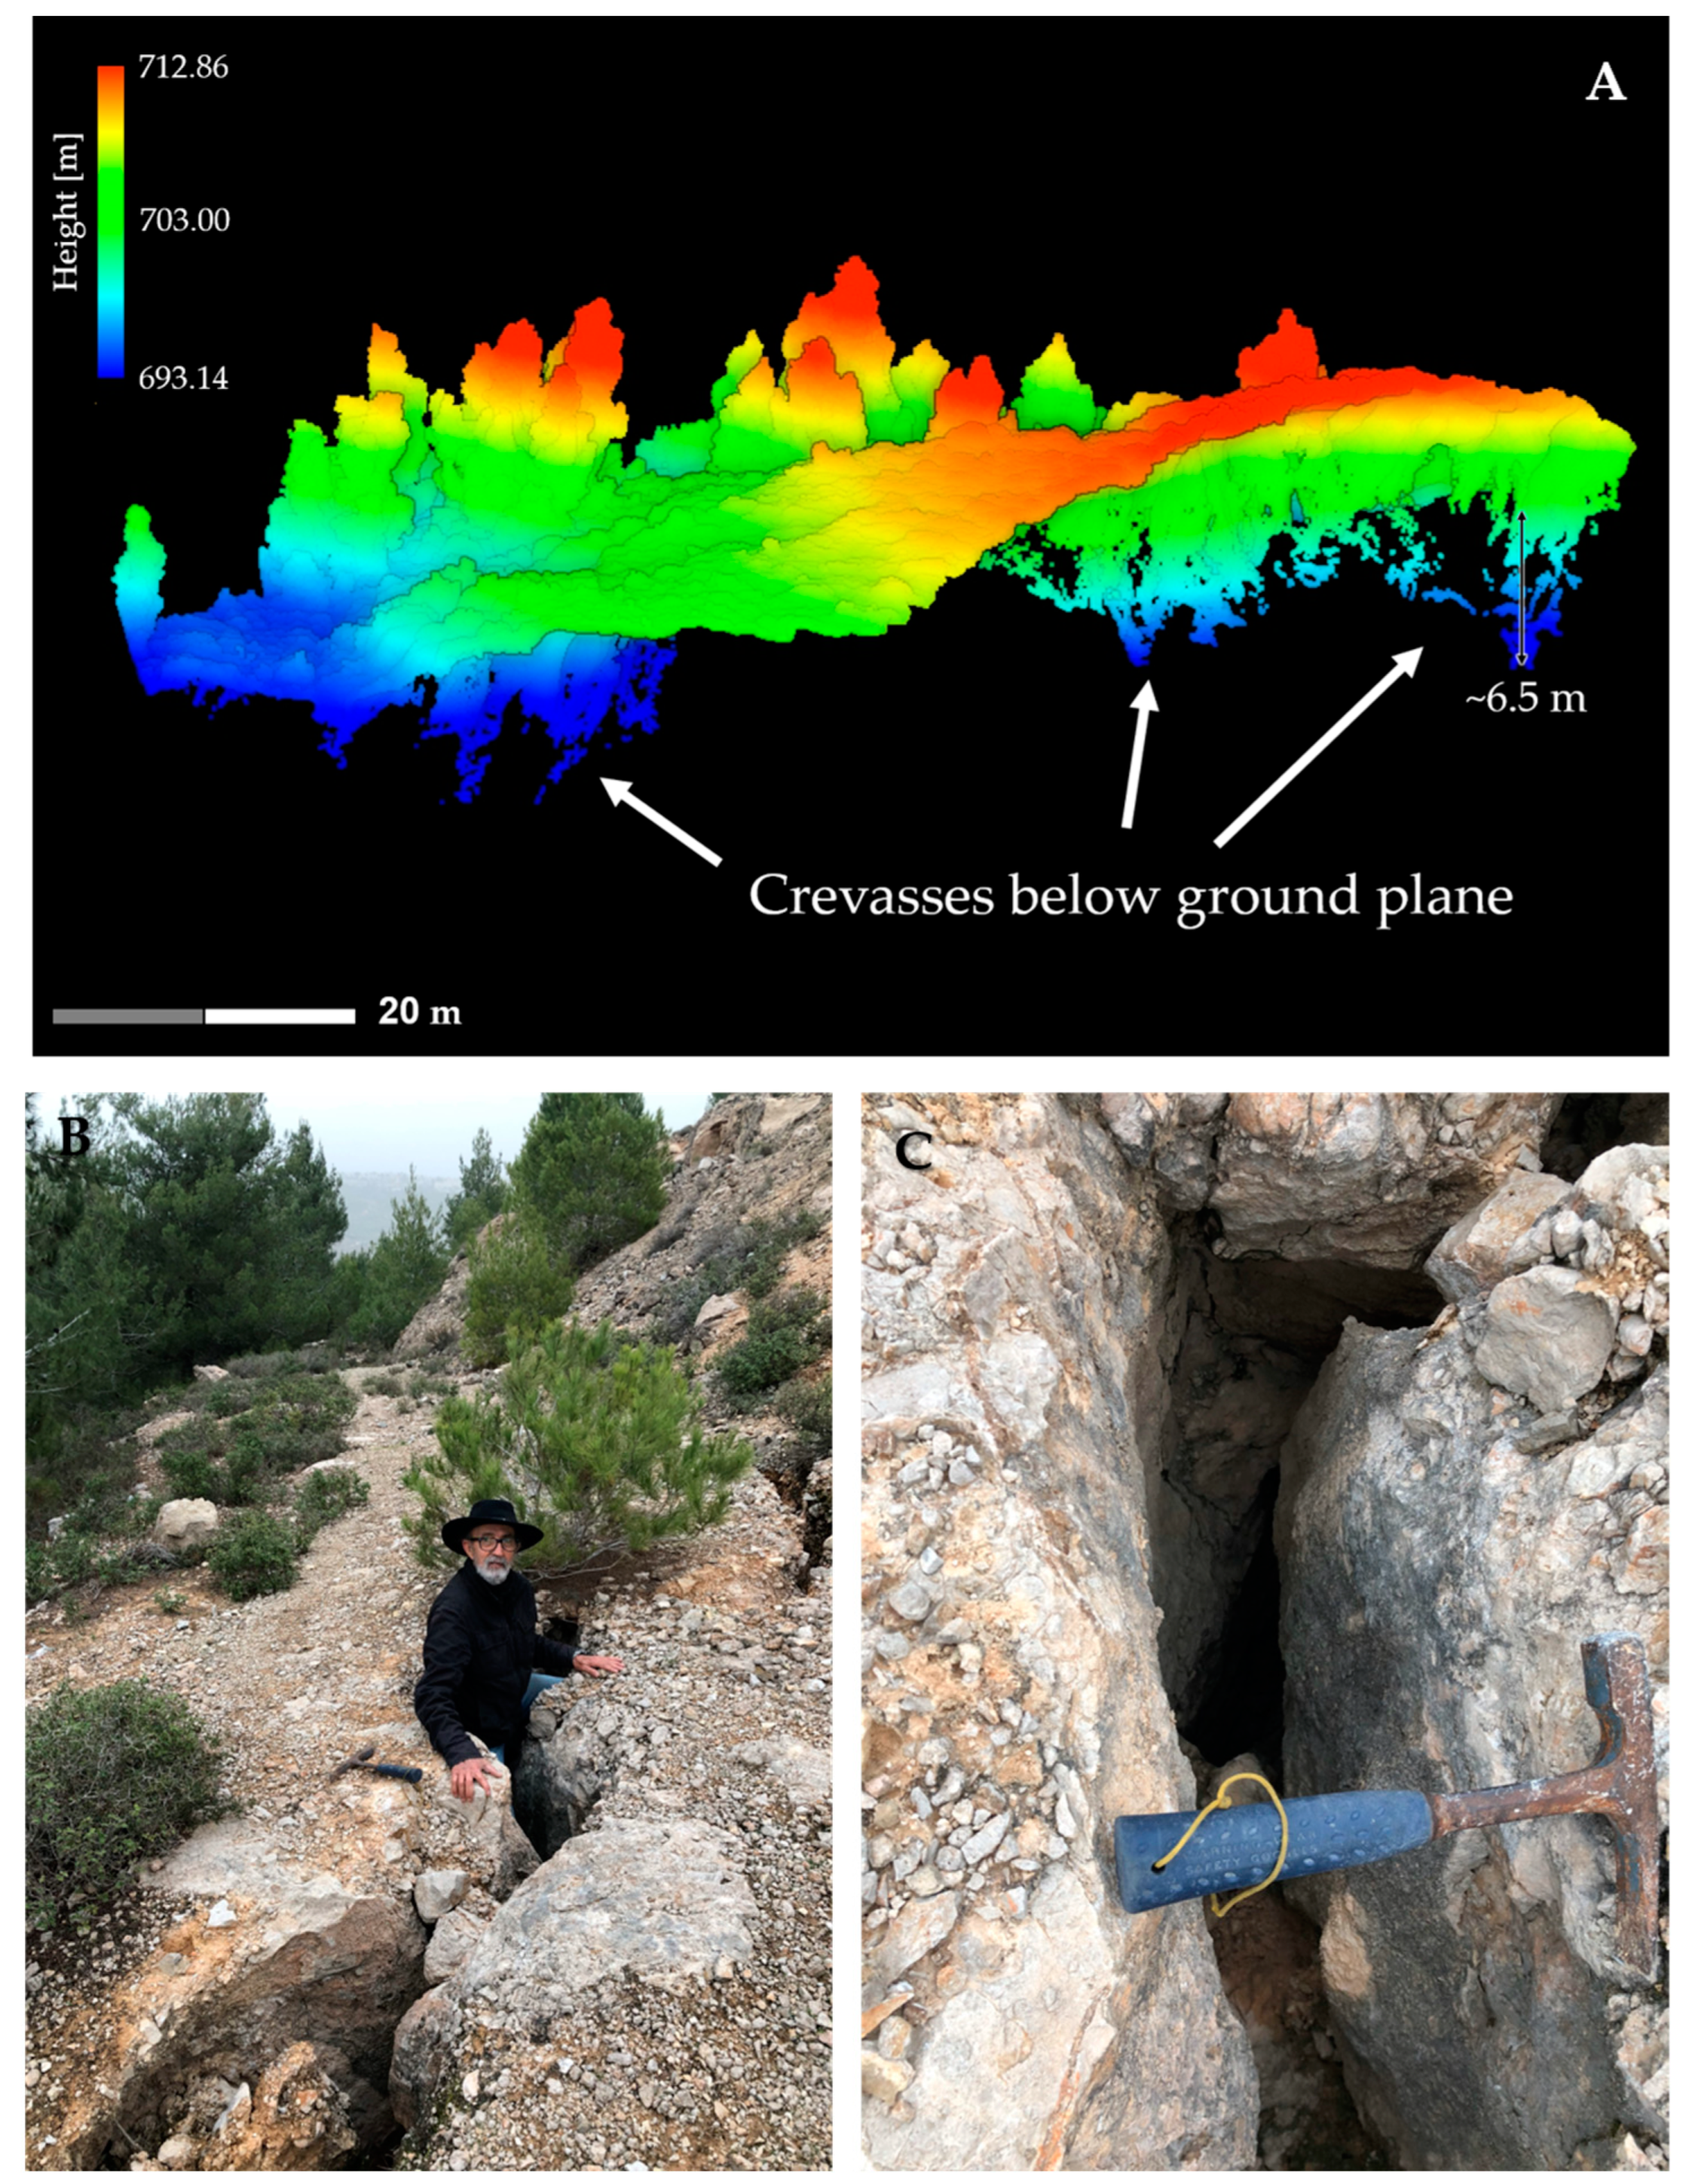
2.2. Crevasses and Gravity Sliding

In January 1996, a massive rockfall blocked Road 385 following a large storm. The largest rock rolling down onto the road was on the order of 100 cubic meters in volume (estimated weight ~200 metric tons) (Figure 2).
At present, looking upslope from the road, three indicators of instability stand out: debris piles reaching downhill to the road, an arcuate head-scarp, and an echelon array of open crevasses, likely initiating a future stage of the head-scarp.
The depth of the open crevasses reaches up to ~7 m, as seen on the LiDAR-based side view (under Eye-Dome Lighting mode) of crevasses (Figure 5). These crevasses form with the detachment of the sliding mass, likely over surfaces in the Motza Formation. Secondary crevasses form with the ongoing detachment of the sliding mass.

3. Methods

To track the evolution of the crevasses, we used historical data together with the latest technological methods for monitoring using drones.

3.1. Historical Data

The historical data used in this study comprise topographic, meteorological, and seismological data. We have used several aerial photos taken since 1970, together with a 25 m digital terrain model (DTM) of Israel based on historical contours mapped since 1970 [5]. The historic air photos were orthorectified using AgisoftPro software 1.8.5 (under an academic agreement).
We acquired two ground photos of the 1996 rockfall, one from a newspaper and the other courtesy of a local resident (an environmental activist). The meteorological and the seismological historical data are described in Appendix A.

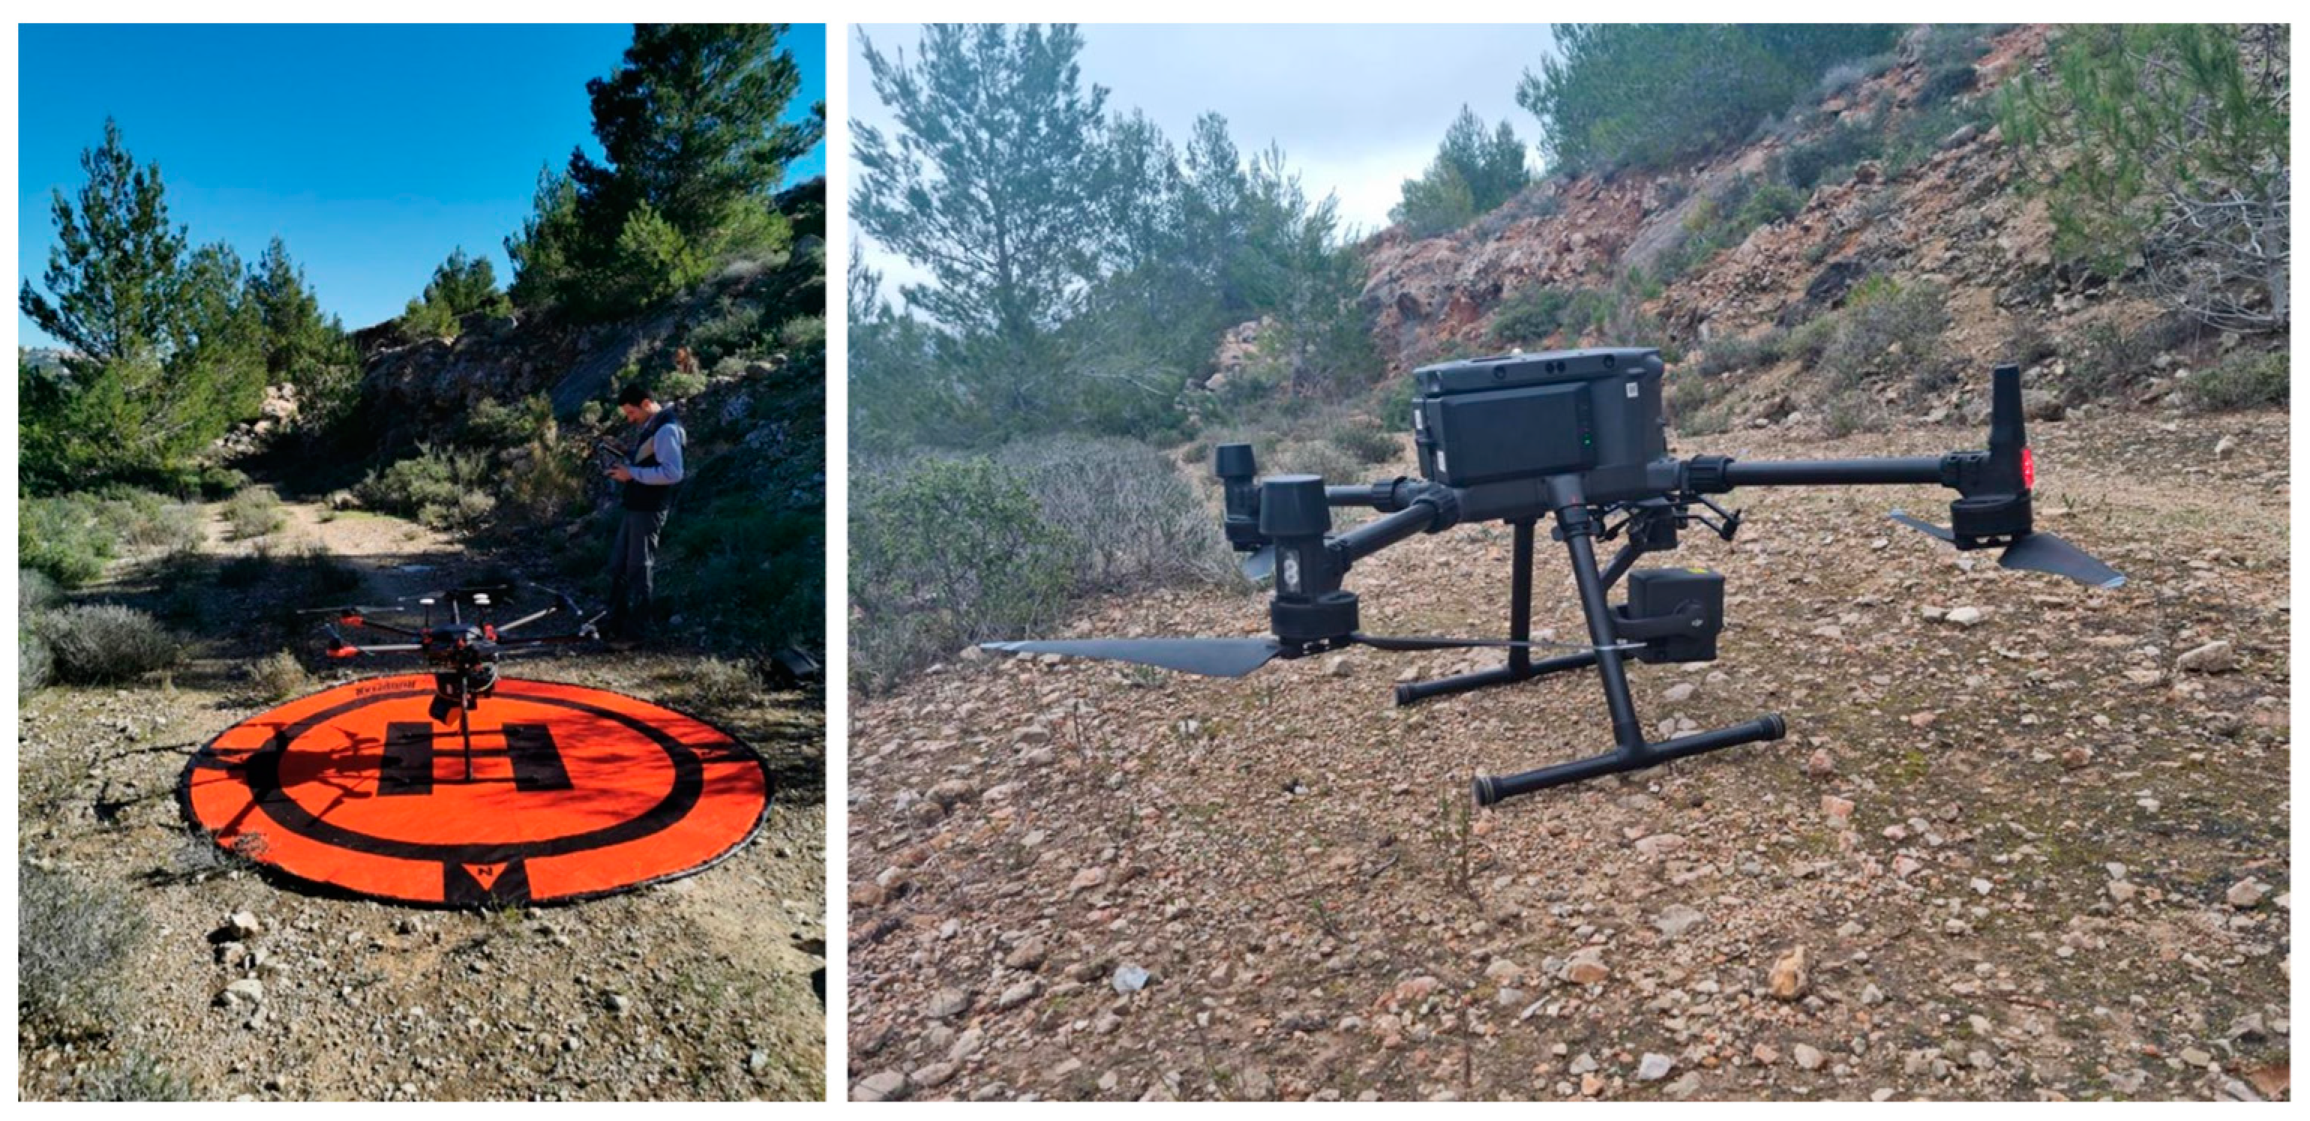
3.2. Recent Technologies

Aerial photogrammetry and Light Detection and Ranging (LiDAR) conducted by Unmanned Aerial Systems (UAS) have revolutionized the field of remote sensing and geospatial data collection. Aerial photogrammetry involves capturing detailed images of the Earth’s surface from aerial platforms, such as drones or aircraft, and using these photos to create accurate 3D models and maps. LiDAR, on the other hand, utilizes laser pulses to measure distances to the Earth’s surface, providing highly precise elevation data and creating detailed topographic maps. When combined with UAS technology, both aerial photogrammetry and LiDAR offer a cost-effective and efficient way to collect geospatial information for various applications, including land surveying, urban planning, environmental monitoring, and disaster management.
Monitoring took place over a period of two years (2021 and 2022). For the first year, we used a GeoSlam Zeb Horizon LiDAR system mounted on a Matrice 600 Pro UAV (Figure 6). The GeoSlam sensor maps its surroundings based on a SLAM (Simultaneous Localization and Mapping) algorithm, meaning it does not require a GPS to obtain a position. The absolute position of the derived point cloud was achieved via a Topcon HiPer 16 ground-based RTK GPS system connected to a network and checked using black-and-white grids for ground targets. A total of five targets and ground points were used. The accuracy of the GPS RTK system is ±1.5 cm. The relative accuracy of the Geoslam system is ±3 cm. The following year, the scan was conducted via a DJI L1 LiDAR system mounted on a Matrice 300 RTK UAV (Figure 6). At the time of scanning, this system required full-time RTK connectivity to obtain a geometric solution.
The accuracy was validated via the same Topcon Hiper 16 ground-based GPS RTK system. The relative vertical accuracy of the L1 system was between 8–15 cm, depending on the location within the dataset (this corresponds to the “fuzziness” of the point cloud). Hard surfaces obviously yielded better vertical accuracy than more natural areas. The drone’s RTK system has an absolute accuracy of about ±5 cm.
During 2022, we also derived a point cloud from photogrammetric data collected with the DJI P1 camera mounted on the Matrice 300 RTK UAV. The relative accuracy of this point cloud on hard surfaces is better than 2 cm; however, its relative accuracy cannot be assured in vegetated areas and in shaded areas such as deeper cracks. Hence, it is best used for comparisons on the XY plane. The absolute accuracy of this point cloud is under ±5 cm.

4. Results

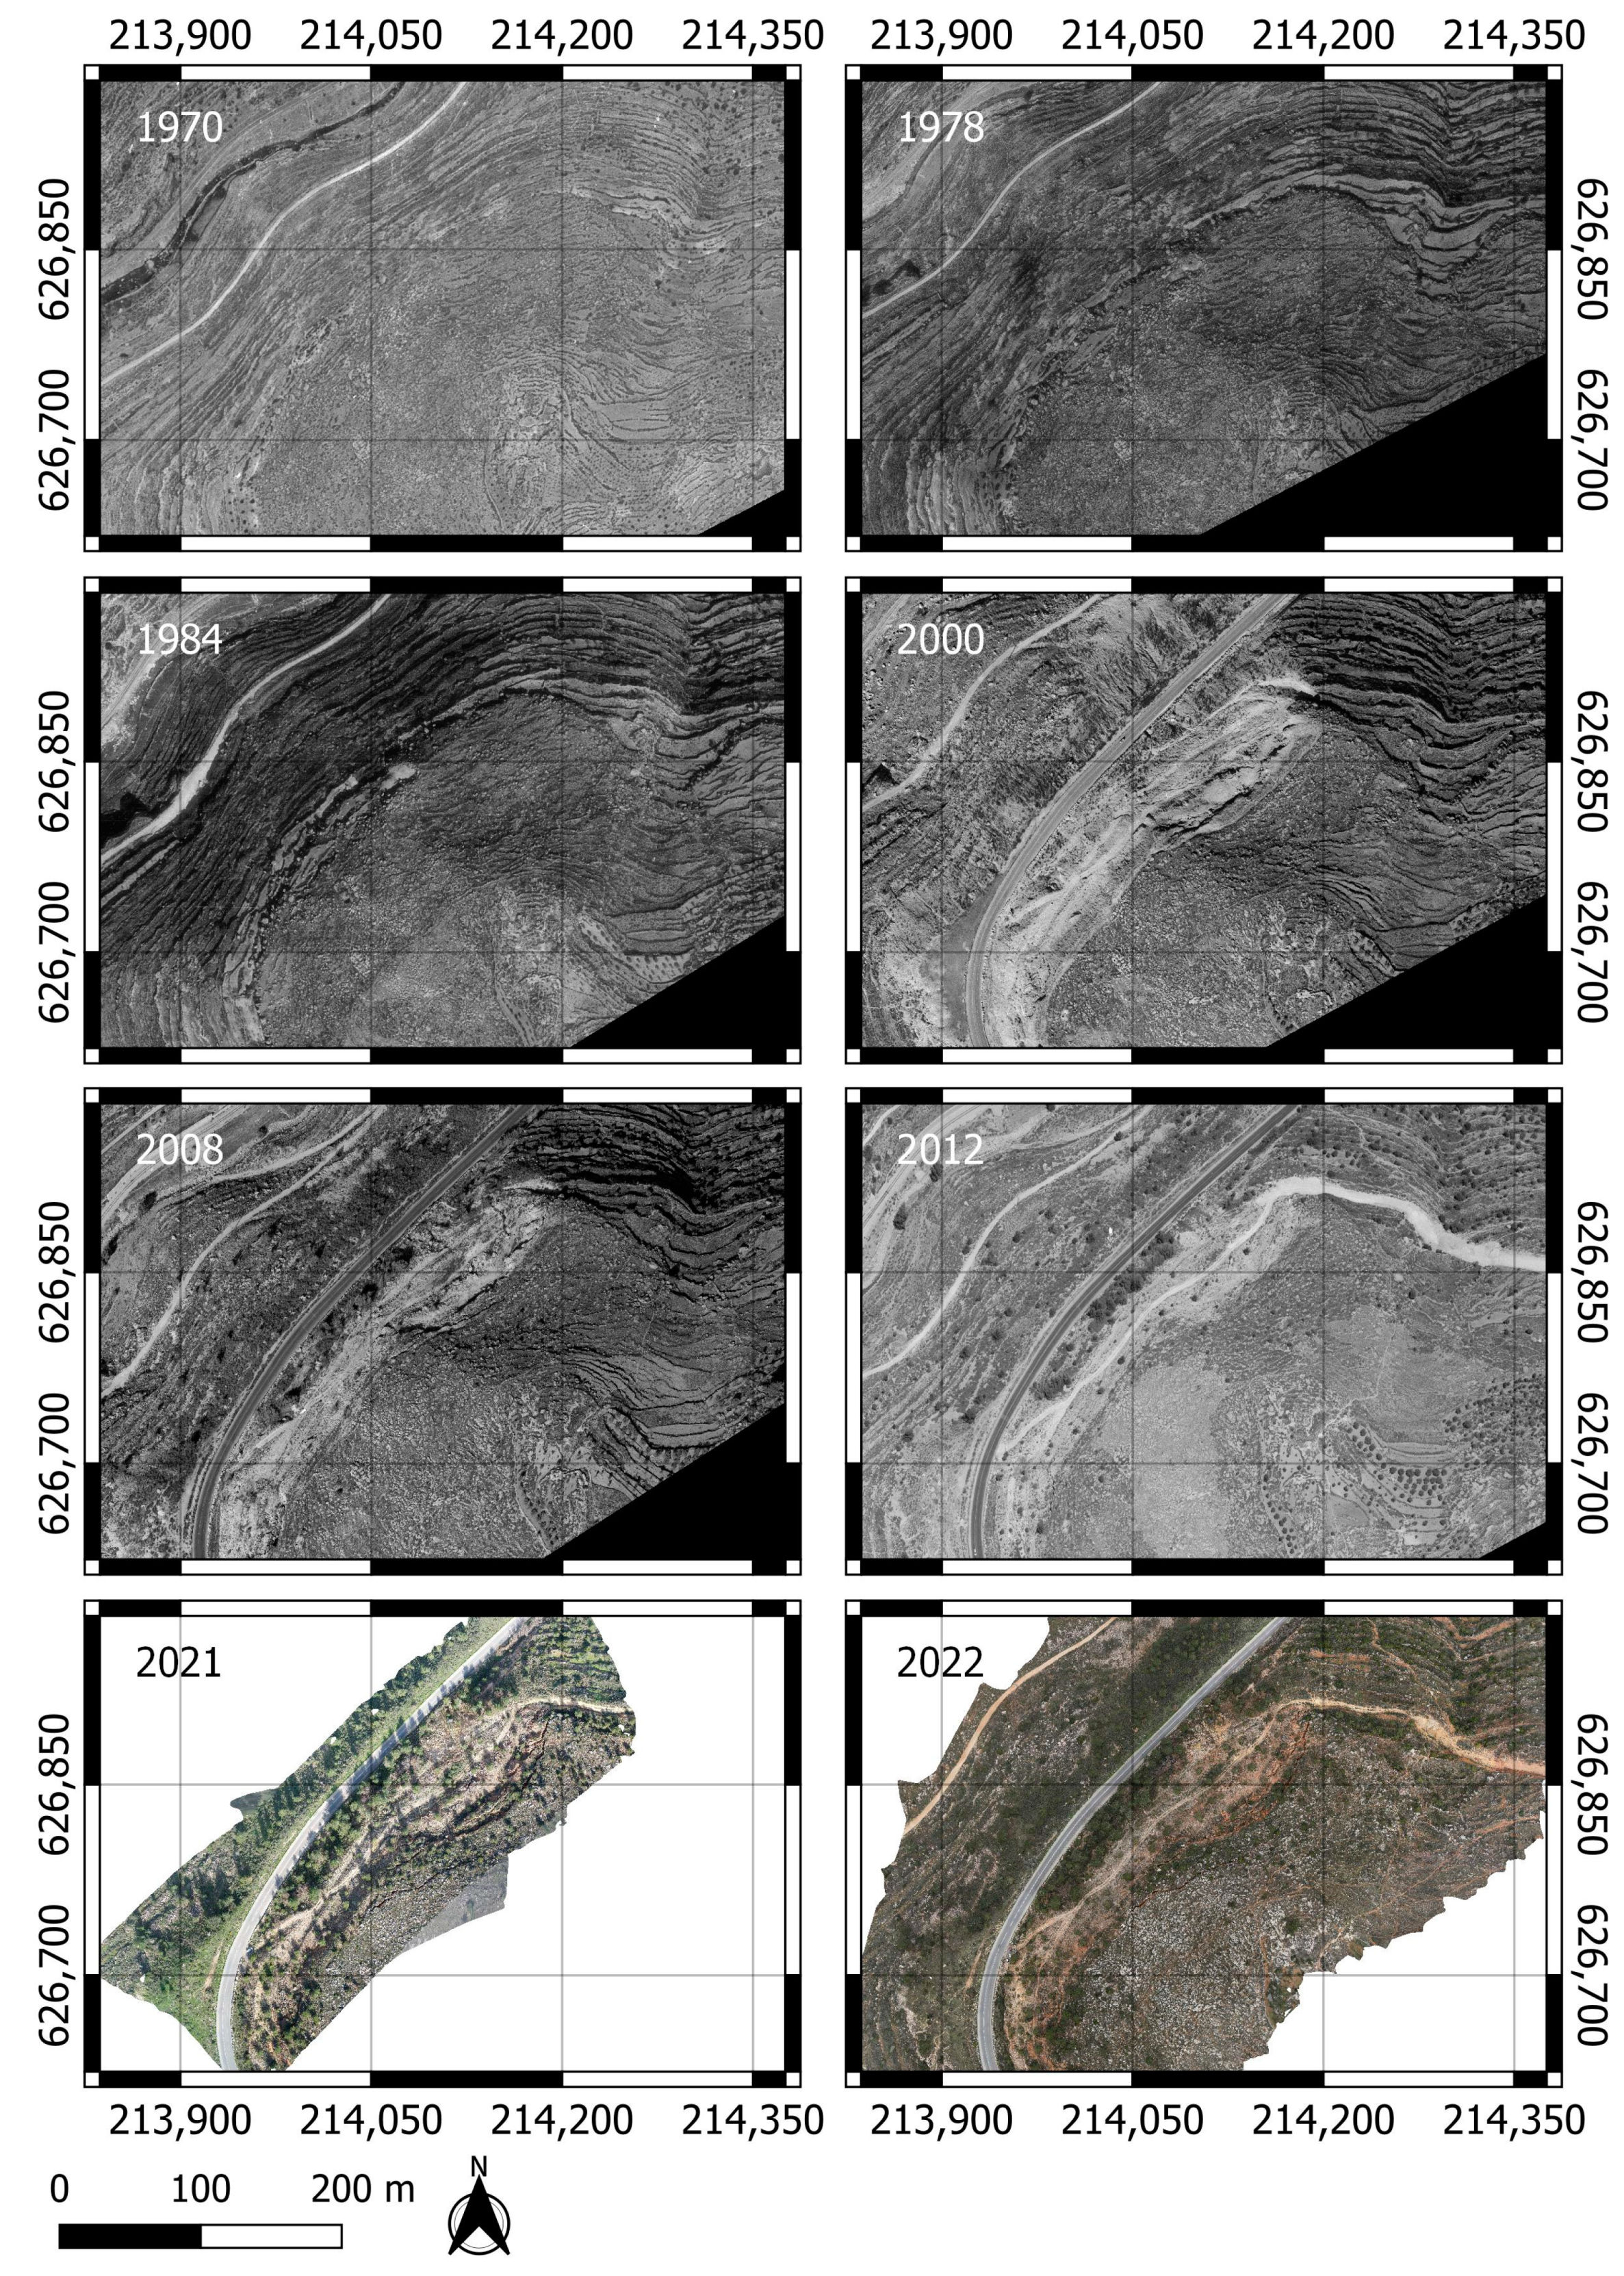
4.1. Photogrammetry and Historical Data Comparison

The series of orthophotos presented in Figure 7 shows the evolution of the sliding mass over five decades. The 1970 photo shows a terraced downward slope on the east and rocky ground on the western plateau. Photogrammetric datasets from the UAV images were processed and derived via Agisoft Metashape 1.8.5, DJI Terra, and Bentley Context capture software suites.
The arcuate shape of the slide’s uphill contact is evident even in the early photos, yet its deformation seems to have accelerated between the years 1984 and 2000. In the 1984 photo, earthworks appear to have damaged the ground at the foot of the landslide (Motza Fm.). According to Katz et al. (2011) [1] and Ryb et al. (2013) [2], such activities rejuvenate paleo-landslides in the marly Motza Fm., which provides a decollement surface.
Figure 8 compares three publicly available topo maps: the top one from British Mandate time and the other two (150,000 scale) from the popular Amudanan.co.il website. Figure 8B is dubbed the “Classical” map, whereas Figure 8C is the currently used digital map. The landslide site is marked with a yellow ellipse. The elevation contours in the top map are downhill (northward convex), while a certain concavity appears in the bottom map. This concavity is clearly related to the head scarp of the slide, as is evident in our drone-derived maps and even in the 5 m contours of the Israel Mapping Center national mapping site (govmap.gov.il).

4.2. LiDAR and Photogrammetry Comparison

All point clouds were compared/correlated and georeferenced via the LiDAR 360 and CloudCompare software suites. Both LiDAR 360 and CloudCompare have powerful tools that allow the transformation, classification, and visualization of point clouds. Within these software suites, we generated cross-sections and used measurement tools within the software; likewise, rasters derived from point clouds (within LiDAR 360) were later compared within the QGIS software using raster subtraction. Orthophotos were visually compared using QGIS software and embedded measurement tools. A “remove outliers” filter was used on both point clouds to remove stray points mainly generated by birds and the drone itself. We opted not to use a noise filter on the datasets, as we found this filter to remove too many points from the point cloud, de facto slightly changing the geometry of the point cloud in some areas. It could be argued that the amount of noise also “smooths” out some geometry, which would be valid to an extent, but the person viewing the data can at least manually choose where to measure, based on his/her knowledge of the area.
A comparison of the datasets reveals several sites with anomalies. While we can see the XY plane offsets also in the photogrammetry datasets, using LiDAR for comparison, we are also able to witness offsets on the Z plane. A comparison of the datasets underscores five different areas where the movement has been recognized (Figure 9).
Areas 1 and 2 (Figure 9 and Figure 10) represent two types of movement deformation. Area 1 shows the removal of material and filling of a crevasse, while area 2 shows the removal or piling up of material, thus altering the topography. These displacements appear in the photogrammetry model (Figure 11) as evidence of the fall inside the crevasses.
The LiDAR data in Area 3 (Figure 12) show a vertical and horizontal displacement. These displacements seem apparent in the photogrammetry model (Figure 11) as evidence of the collapse of the front of the crevasses and the fall of a large rock of about 2.5 m.
The LiDAR data in Area 5 (Figure 13) show a vertical displacement of about ~3 m. From the photogrammetry model (Figure 11), this displacement seems to be boulders that fell into the crevasses and blocked the southwest of it. The LiDAR data show that the boulder did not fall into the crevasse from the southeast, but from another direction.
Figure 11 compares our two consecutive drone-borne orthophotos in some of the areas (Figure 9). The comparison in the three areas shows small landslides and rockfalls (up to 2.5 m). Table 1 summarizes the offsets that were measured within the LiDAR point cloud.

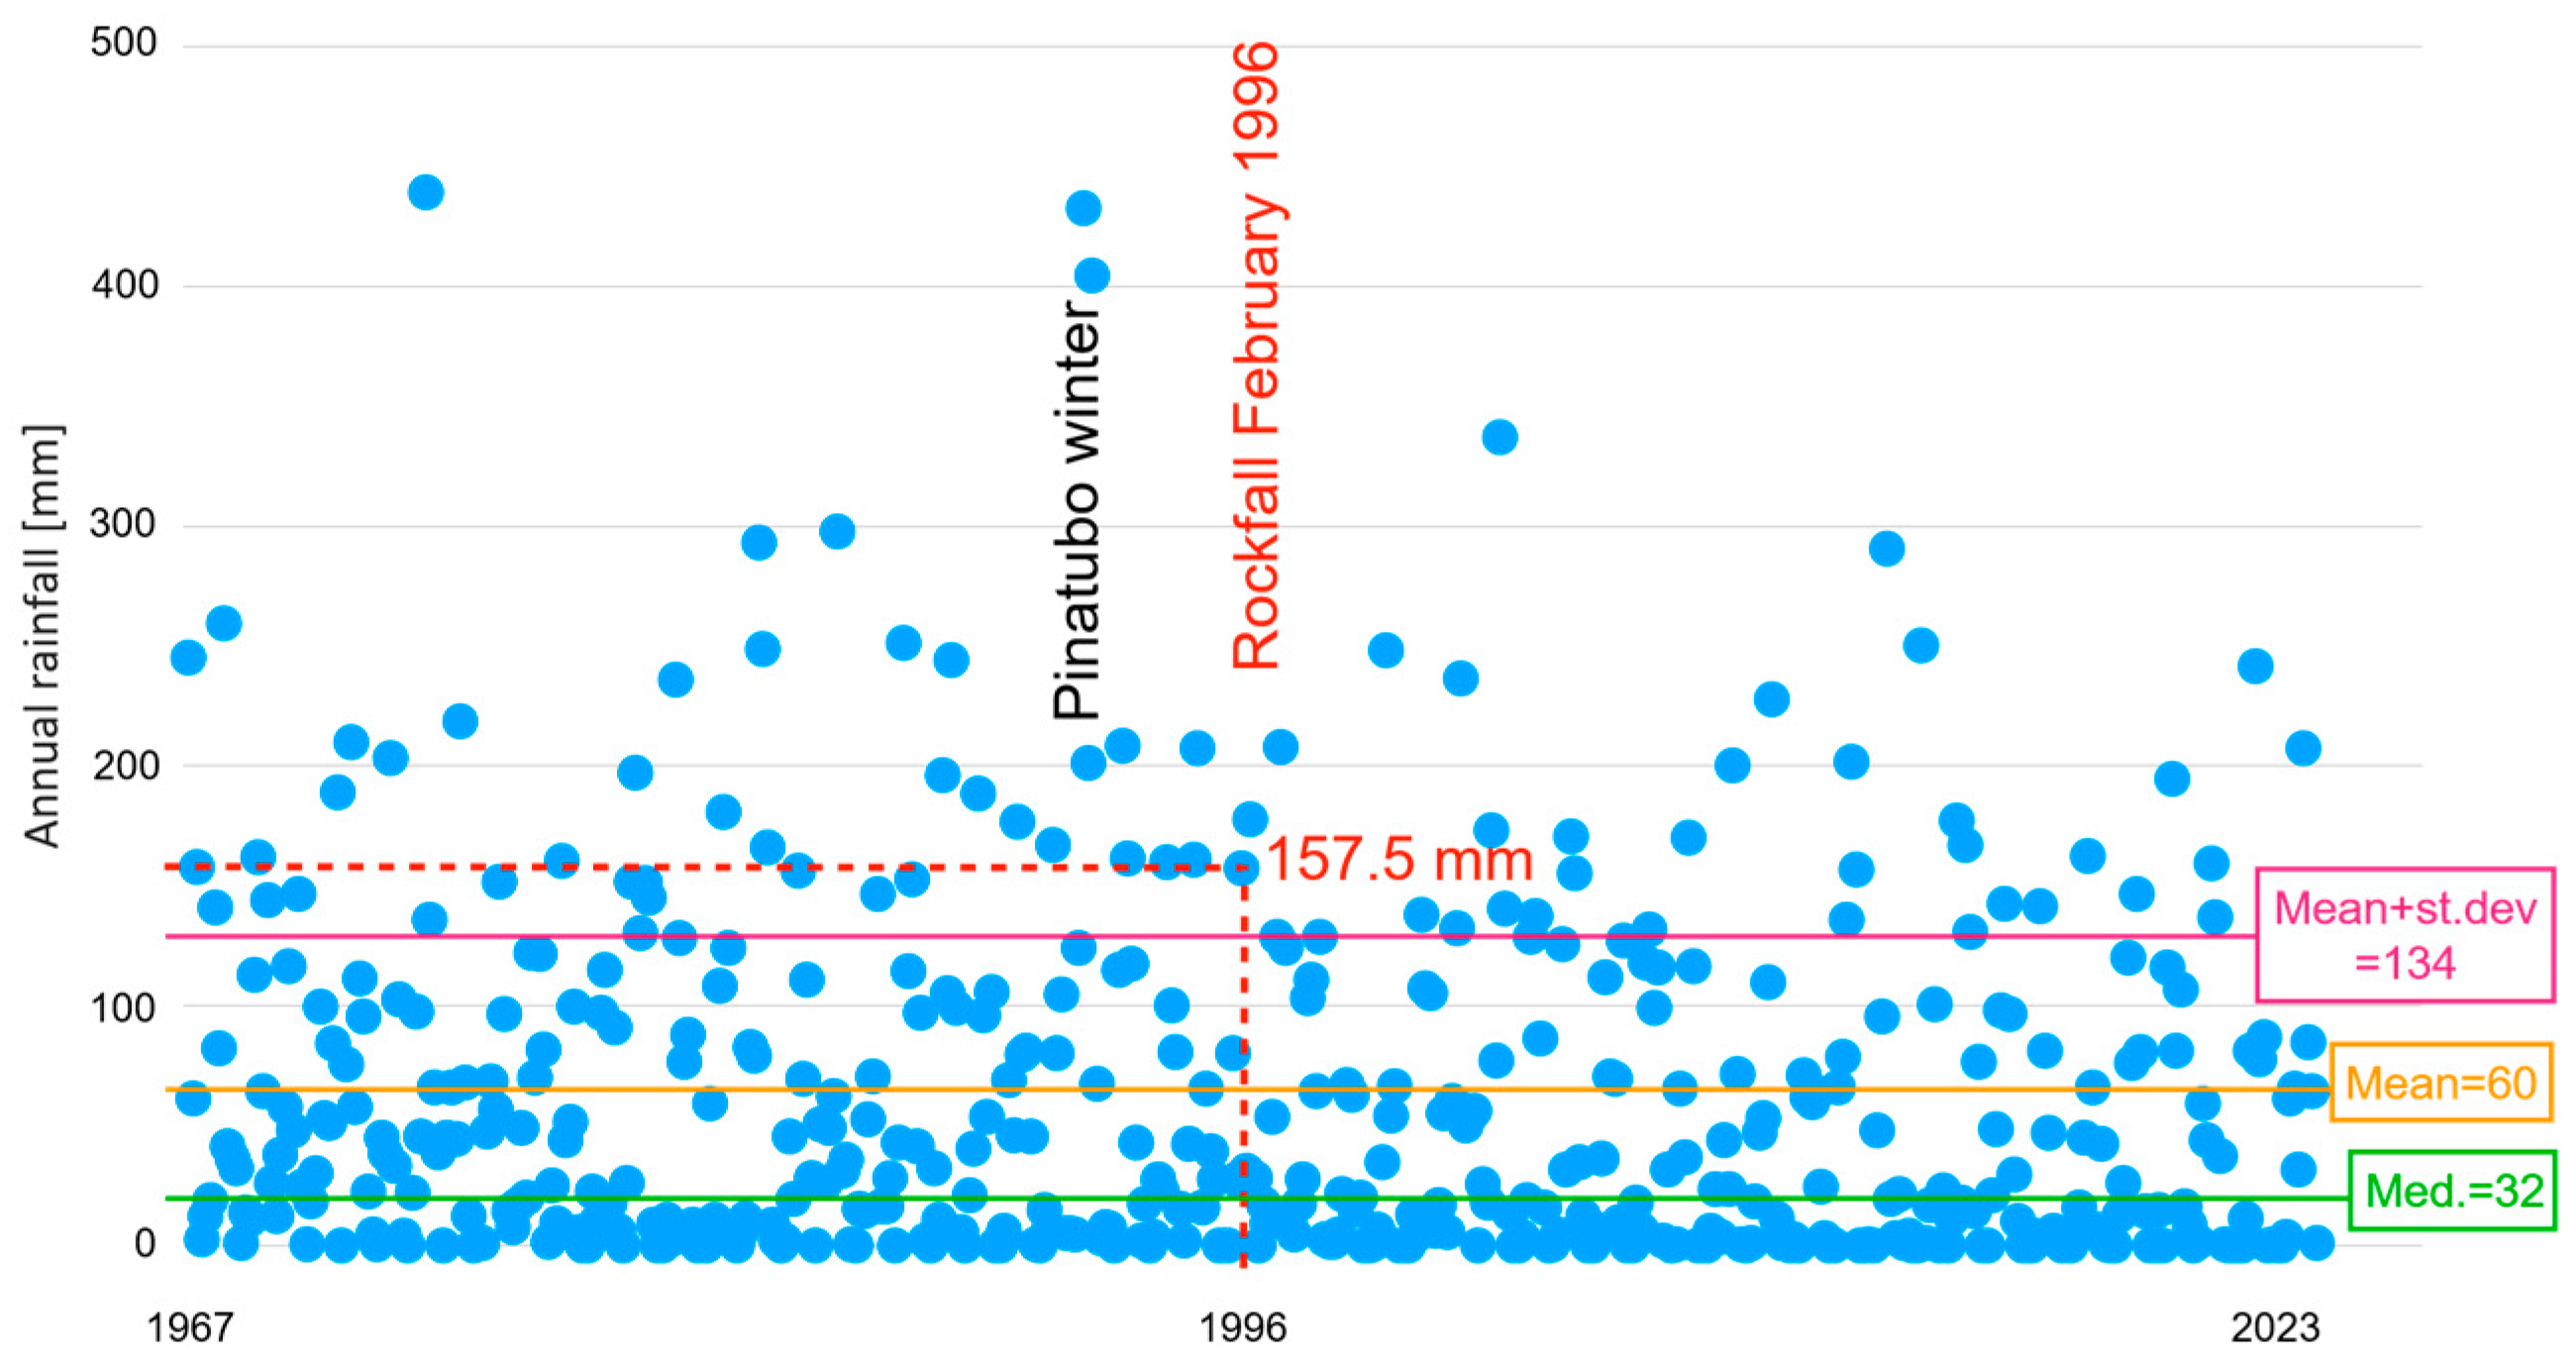
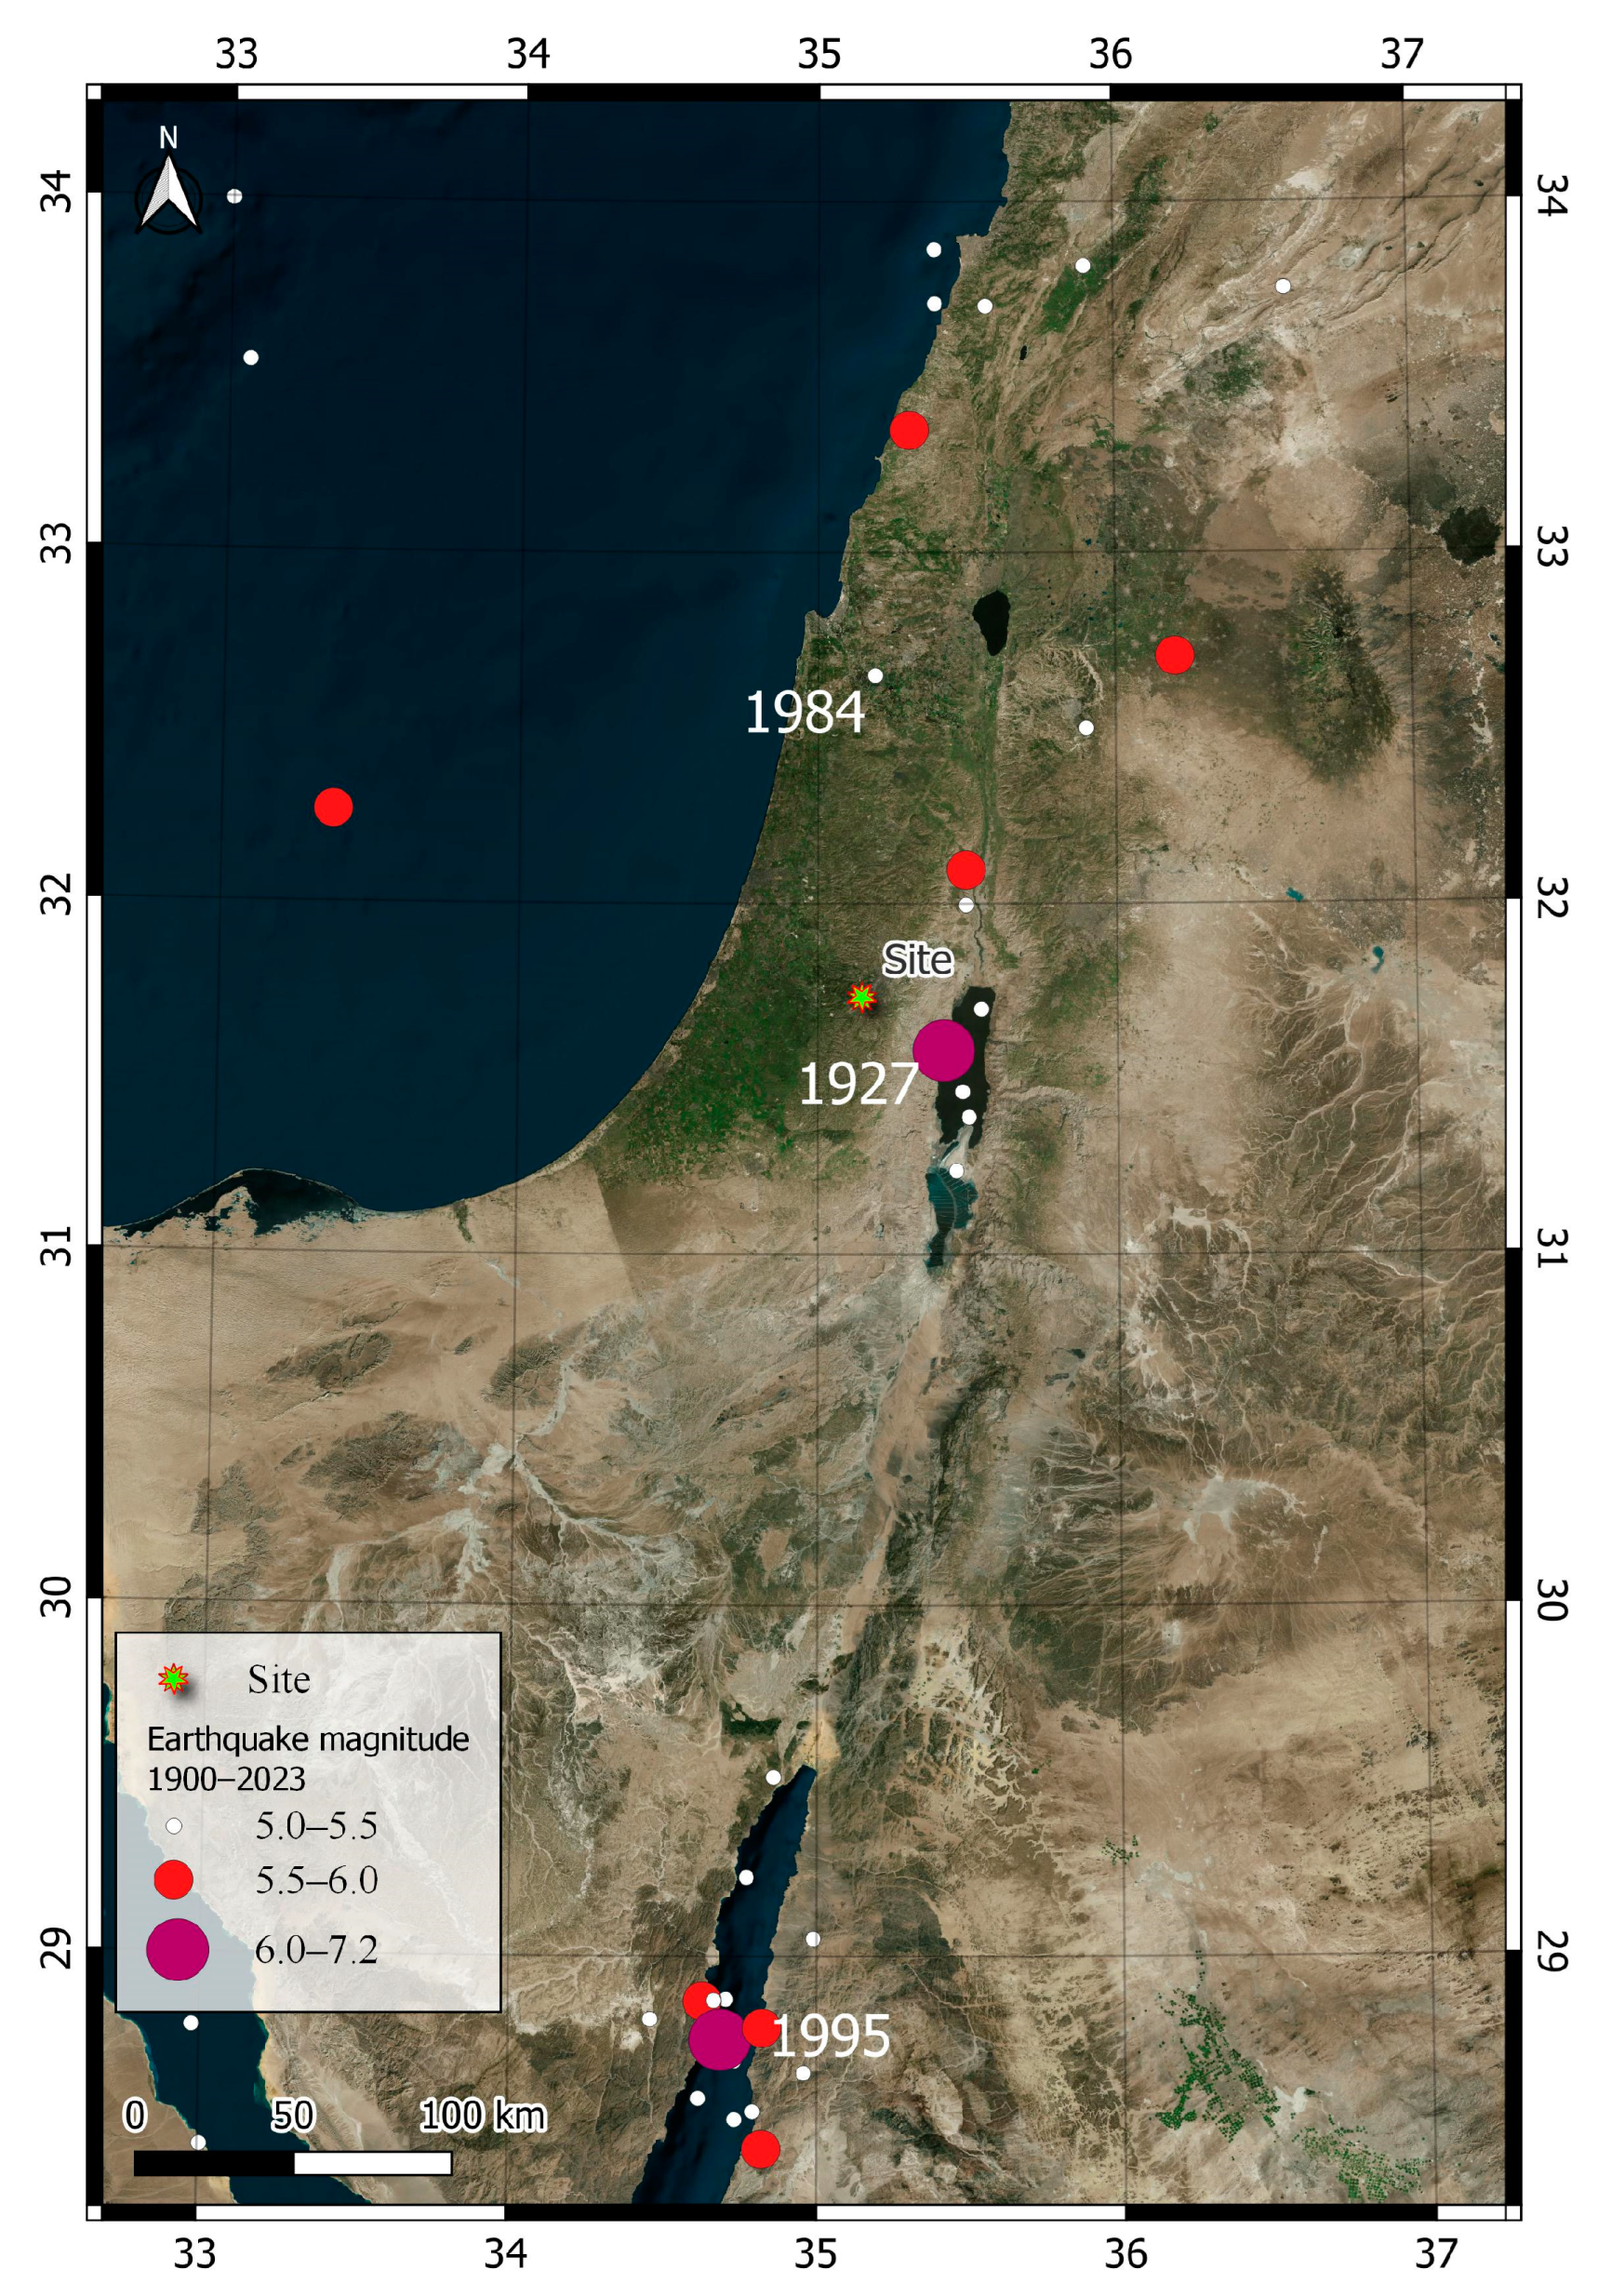
4.3. Historical Data: Aerial Photos, Topographic Maps, Rain History, and Local Earthquakes

Reviewing historical data, in light of the modern data (including our newly acquired drone-borne data), indicates that the landslide in the research area was rejuvenated after the cutting of Motorway 385 in 1995. This is deduced from considering the alternatives; natural rather than anthropogenic, triggering mechanisms for the spectacular slope failure.
First, we consider the effect of rain, as the Jerusalem area is subject to ~550–600 mm of rain annually; the rainy season is rather short, mainly between October and March (ims.gov.il). Slope failure occurred at the peak of the rainy season, in the last week of January (source—Yediot Aharonot newspaper, Figure 2). However, as the monthly record of six decades shows (1967–2023), January 1996 was not extremely rainy (158 mm), about 1.5 standard deviations above the mean (60 mm per month). For that 56-year period, three months exceeded 400 mm of rain, almost three times the amount of rain during the month of the slide. If monthly rain of 157.5 mm would be sufficient for destabilizing the slope, one would expect to see sliding every few years, and perhaps larger slides for months with >400 mm of rain.
Locals report that within the study area during 1995 (www/amudanan.co.il [in Hebrew]), water started to seep at the slide’s toe, on the westernmost reach of the motorway. If so, it may indicate either elevated pore pressure leading to failure, or the initiation of cracks that allowed new patches for groundwater accumulation. While pore pressure in the underlying rocks could certainly assist the landslide, it would not have led to failure without human intervention via road cutting, given the six-decade record discussed above.
We now turn our attention to the other candidate mechanism for triggering the slide, namely earthquake shaking. The slide area lies about 30 km east of the Dead Sea Fault, an active plate boundary where destructive earthquakes have been reported since early history, e.g., [7,8,9]. The vicinity of the urban area of Jerusalem has ground conditions considered suitable for amplification of seismic waves [10]; indeed, the hillslope studied has been mapped as exhibiting “intermediate potential for ground amplification” (Figure A4). The only instrumental earthquakes to damage Jerusalem were the 11 July 1927 M6.2 Jericho and the 11 February 2004 Northern Dead Sea M5.1 events. The local intensity from the M6.2 1927 event ranged around VII [7], whereas the M5.1 2004 event yielded intensities around VI in Jerusalem and Bethlehem [9].
The strongest seismic shaking experience around Jerusalem in modern times occurred on 11 July 1927, the Jericho M6.2 earthquake. The epicentral location has been constrained based on limited instrumental data with distances between ~30 and 38 km, with local intensities of 6.5 to 7.5 reported around Jerusalem [7,11]. Considering that the site intensities are predicted to be amplified due to the marly Motza Formation and the slope (10°–20°) [10], an intensity of 7.0–7.5 is reasonable, given that [12] in their Figure 2, validated these predictions versus Avni’s (1999) macroseismic data [13].
We predicted site intensities at the slide for two well-recorded earthquakes: the 1995 M7.2 earthquake in the Gulf of Aqaba-Eilat (epicentral distance 300 km [14]), and the 11 February 2004 Northern Dead Sea M5.1 earthquake (epicentral distance 35 km) [9]. For both earthquakes, the attenuation relation of [7,15] yields intensities between V and VI around Jerusalem (Appendix A). We infer that even if the 22 November 1995 earthquake contributed to the triggering of the January 1996 slide, the cutting of the motorway during 1995 was still an essential component of the process. Otherwise, we would expect remobilization of some sort after the 2004 earthquake. Considering here the compounded effects of shaking and rain strengthen this inference somewhat, the pair of months preceding the earthquake (December 2003 and January 2004) accumulated 267 mm of rain, compared with 185 mm in the corresponding months before the rockfall of January 1996.
Regarding the 1927 earthquake, with its 7.0–7.5 intensities in amplifying sites such as the slide [8,13], even greater mass movements might be expected. Yet the evidence suggests that since its Pleistocene mobilization and stabilization, the slope has been stable until 1996 [2]. An interesting comparison can be made with a published case study [1]: an analysis of rock falls related to the sliding of an identical stratigraphic section associated with the 1927 earthquake. Landslides hit the same catchment (Soreq-Refaim Creeks) and blocked the railway to Jerusalem [13]. These authors mapped conspicuous rock fall blocks in four "squares" in the Judean Hills west of Jerusalem, based on high-quality stereographic airphotos from 1945, prior to the growth of much of the present vegetation cover. One of these squares (Hanya) includes the slide site (Figure 3). The white circles in Figure 3 mark the blocks mapped on the 1945 photos [1]. Note that the mapped blocks closest to the slide are 0.25 km away (east of the blue polygon demarcating the slide). Simulations of block sliding under accelerations expected to result from a M6 Jericho-like earthquake compare favorably with the distribution of mapped blocks [1]. This suggested that the majority of the blocks could have been destabilized under the 1927 earthquake conditions. A potential site was identified that matches macroseismic reports by the railway company for rockfalls that damaged the railway along a 50 m section [1]. Note that the 2004 M5.1 earthquake seemed not to have triggered any rockfalls in the entire catchment [1].

5. Discussion

Using four different sources of historical data, we studied the possibility that the landslide was initiated by an exceptional rainy period, with or without a significant earthquake, or by the building of the motorway.
The air photos (Figure 7) clearly show the evolution of landsliding along with human landscaping that triggered the phenomenon. In particular, the cutting of roads and destabilization of the decollement (Motza Fm.) are tied together, supporting earlier studies on the phenomenon. The evidence in the contour maps is more subtle, but detectable changes can be attributed to landscaping.
Much of the change in the topo contours is recent and can be tied to the massive rockfall of early 1996, briefly following the installation of Motorway 385.
We have also explored the rain history of the area between 1967–2003 and integrated it with studies of historical earthquakes. Rain data from that time, and the entire six decades before the present, suggest that the rainy month preceding the slide was not unusual (Appendix A). Indeed, January 1996 was rainy and had 157mm of rain, but it is not unusual for the month of January in the area, and other years have seen much more rainfall during January.
We have explored the possibility that the landslide was initiated by the Gulf of Aqaba Mw 7.2 22 November 1995 earthquake that hit the region several weeks before the rockfall. However, the epicenter is over 300 km away [14]. Locally derived attenuation relations predict a local intensity around VI at a magnitude of 7.2 and a source distance of 300 km [7]. Accounting for site variability, we estimate the expected local intensity at such distances to be in the range of V-VI [15]. This agrees with Al-Dabeek and El-Kelani (2004) [9], who report Intensity VI according to damaged structures in Jerusalem and Bethlehem, based on questionnaires distributed shortly after the event. A local earthquake with a very similar predicted local intensity at the site occurred on 11 February 2004, with Mw 5.1, at a 35 km distance from the site [16] (Figure A3).
Therefore, the most significant factor for triggering massive sliding is clearly the cutting of the slope for constructing Motorway 385 shortly before the dramatic rockfall of January 1996.

5.1. LiDAR and Photogrammetry 2021/2022

Utilizing airborne LiDAR is a powerful tool for witnessing landscape changes over time. The advantages of LiDAR compared to photogrammetry are that it is capable of mapping the ground under vegetation, and in cases of cracks, steep changes in elevation and areas that feature “depth”—the LiDAR has no other issues, and if best practices are followed, a complete, high-resolution scan of the area of interest is obtained. This “digital twin” of the terrain allows for many different kinds of analysis in change detection, be it in 3D, on the point cloud itself, or in 2D via the derived rasters. That being said, LiDAR lacks the “sharpness” and resolution of images and their derived photogrammetric products. We have found that utilizing a high-resolution orthomosaic, side-by-side with LiDAR adds much-needed context and the ability to see small details and conduct 2D measurements.
The combined errors due to relative and absolute accuracy between the two years created a certain challenge in comparing the two datasets regarding the detection of smaller-scale changes within these errors (less than ~20 cm). The main challenge arose from the absolute accuracy discrepancies, mainly in the Georeferencing of the GeoSlam dataset compared to the other datasets and the “fuzziness” of the L1 LiDAR data. That being said, as we are primarily looking for relative changes between years, we were able to circumvent this issue by re-aligning the datasets to each other and then conducting the comparison. While this might not be the best approach, it is definitely sufficient for witnessing changes that are markedly larger than the combined relative accuracy of both datasets being compared.

5.2. Future Work

In the coming years, the best way to assure similar errors in absolute accuracy between datasets, even if they are derived from different sensors and systems, would be to (a) create permanent ground control points across the entire site and (b) use the same flight paths and parameters each year. This would essentially solve the issue of absolute localization and accuracy, making the comparison of datasets far more straightforward.

6. Conclusions

Historical maps and photos (aerial in particular), together with information gathered with modern aids—LiDAR carried by drones—allow reconstruction of ongoing dynamics on scales ranging from centimeters to kilometers. In this study, we focused on a site where planning was haphazard due to myriad political circumstances.
The use of state-of-the-art airborne LiDAR surveying, drone photogrammetry, and meteorological and seismic records allowed us to identify the road works as the chief cause for slope failure. Landscaping for a motorway triggered landsliding and rockfalls that have jeopardized vehicle passengers’ lives. Further widening the motorway without proper heed to the landsliding and rockfalls will exacerbate the hazards.

Author Contributions

Conceptualization, Y.D. and A.A.; methodology, A.A., Y.D., E.R., B.L. and I.S.; investigation, Y.D., A.A., E.R., B.L. and I.S.; draft preparation, A.A., J.K.H. and Y.D.; visualization, Y.D., B.L. and I.S.; project administration, Y.D.; All authors have read and agreed to the published version of the manuscript.

Funding

This research received no external funding.

Data Availability Statement

The data presented in this study are available on request from the corresponding author. The data are not publicly available due to extremely large files.

Acknowledgments

We appreciate the aid of Oded Katz and Zeev Reches, who each accompanied us in the field and contributed encouragement and insights. We are indebted to Aviv Tatarsky for introducing us to spectacular collapse structures that ignited our interest in the site.

Conflicts of Interest

The authors declare no conflicts of interest.

Appendix A

Appendix A.1. Natural Triggering of Landsliding and a Rockfall: Storms and Earthquakes

Rainstorms and earthquakes are commonly considered as triggers for landslides and rockfalls, e.g., [17,18,19,20]. We characterized the loads on the sliding slope in terms of mm of rain and seismic ground motion, with particular emphasis on the period preceding the rockfall.
Figure A1 shows monthly rain data from Jerusalem, provided by Israel Meteorological Service (www.ims.gov.il), from 1967 to 2023.
Figure A1. The amount of monthly rain (only for rainy months) measured in Jerusalem between 1967 and 2023. Median, average, and average + standard deviation are marked green, orange, and violet, respectively. The storm preceding the rockfall is outlined (Jan 1996, 157.5 mm). While this storm was significant, it was far from unusual (as compared to the Pinatubo winter marked—1991/2). We suggest that the combination of the storm together with the landscaping and road cutting for Motorway 385, with possible contribution of a regional earthquake, triggered the rock fall. Data from Israel Meteorological Service (IMS).
Geotechnics 04 00041 g0a1
In January 1996, the Jerusalem Meteorological Station measured a rain load of 157.5, significantly above the median and the average for almost 56 years. These statistics for all non-zero rain loads are respectively marked by a green (32 mm rain) and an orange (60 mm rain) horizontal line. The violet line marks one standard deviation above the average (134 mm). Note that for 51 out of 487 months (that exhibited non-vanishing rain) within these 56 years, the rain load exceeded the January 1996 amount (157.5 mm). So, on average, almost every year exhibited a month with more rain than the month of the dramatic rockfall. In January 2013, the station at Jerusalem recorded 290 mm, and for 18 years of our 56-year sample (32%), the January rain measured in Jerusalem exceeded the value of the year 1996. This supports our conclusion that while rain is required to trigger sliding, it was the landscaping associated with Motorway 385 that enabled the triggering of the massive rockfall.
Figure A2 supports the above theme by inspecting the annual average rain in Jerusalem. The winter of 1995–1996 was slightly below average, and yet this is the only winter when a massive rockfall occurred.
Figure A2. Annual average of rain measured in Jerusalem. The winter of 1995/6 was slightly below average. Also shown (top) are the years for which we present air photos (Figure 7). Data from Israel Meteorological Service (IMS).
Geotechnics 04 00041 g0a2

Appendix A.2. Earthquakes

The slide area lies about 30 km east of the Dead Sea Fault, an active plate boundary where destructive earthquakes have been recorded since early history, e.g., [8]. During the last two millennia, 15 earthquakes were sufficiently strong to cause damage to buildings in Jerusalem [21]. The vicinity of the urban area of Jerusalem has been considered susceptible to amplification of seismic amplitudes by ground conditions [10]; indeed, the hillslope studied has been mapped as exhibiting “intermediate potential for ground amplification” (Figure A4). The only instrumental earthquakes to damage Jerusalem were the 11 July 1927 M6.2 Jericho and the 11 February 2004 Northern Dead Sea M5.1 events. The local intensity from the M6.2 1927 event ranged around VII [13], whereas the M5.1 2004 event yielded intensities around VI in Jerusalem and Bethlehem.
The lack of evidence for mobilization of the slide following the 2004 M5.1 Northern Dead Sea earthquake suggests that moderate ground shaking is not sufficient for triggering the landslide. This implication is somewhat strengthened when considering the rain conditions: the pair of months preceding the earthquake (December 2003 and January 2004) accumulated 267 mm of rain, compared with 185 mm in the corresponding months before the rockfall of January 1996.
The average recurrence interval (ARI) of damaging earthquakes around Jerusalem thus appears to be 130 years; the standard deviation is 62 years. This can be compared with the calculated probability of exceedance of 0.25 g in 50 years by Maiti and Kamai (2020) [22].
Figure A3. Epicenters of earthquakes with a magnitude larger than 5.0 around the study site (yellow star) between 1900 and 2023. The largest earthquake (M7.2) hit the Gulf of Aqaba on 22 November 1995. Data from the Geological Survey of Israel https://eq.gsi.gov.il/earthquake (accessed on 2 March 2024).
Geotechnics 04 00041 g0a3
Figure A4. (Left): A portion of a map (1:50,000) marking intermediate potential for ground amplification during earthquakes [10], with the landslide site marked by a blue star. The potential was calculated based on slope and lithology. The semi-circular band about the site is formed by the marly-clayey Motza Formation (Figure 4). The blue square and star, respectively, mark the sloping hill and the slide. (Right): A portion of the geological map (Figure 3) where the blue square is marked for ease of orientation between panels. The inscriptions in Hebrew symbolize ancient sites, springs and streams.
Geotechnics 04 00041 g0a4
In summary, the historical data on rain and earthquakes do not seem to support a purely natural trigger for the rockfall of January 1996. It was the combination of cutting the road, rain, and perhaps ground shaking that caused the devastation.

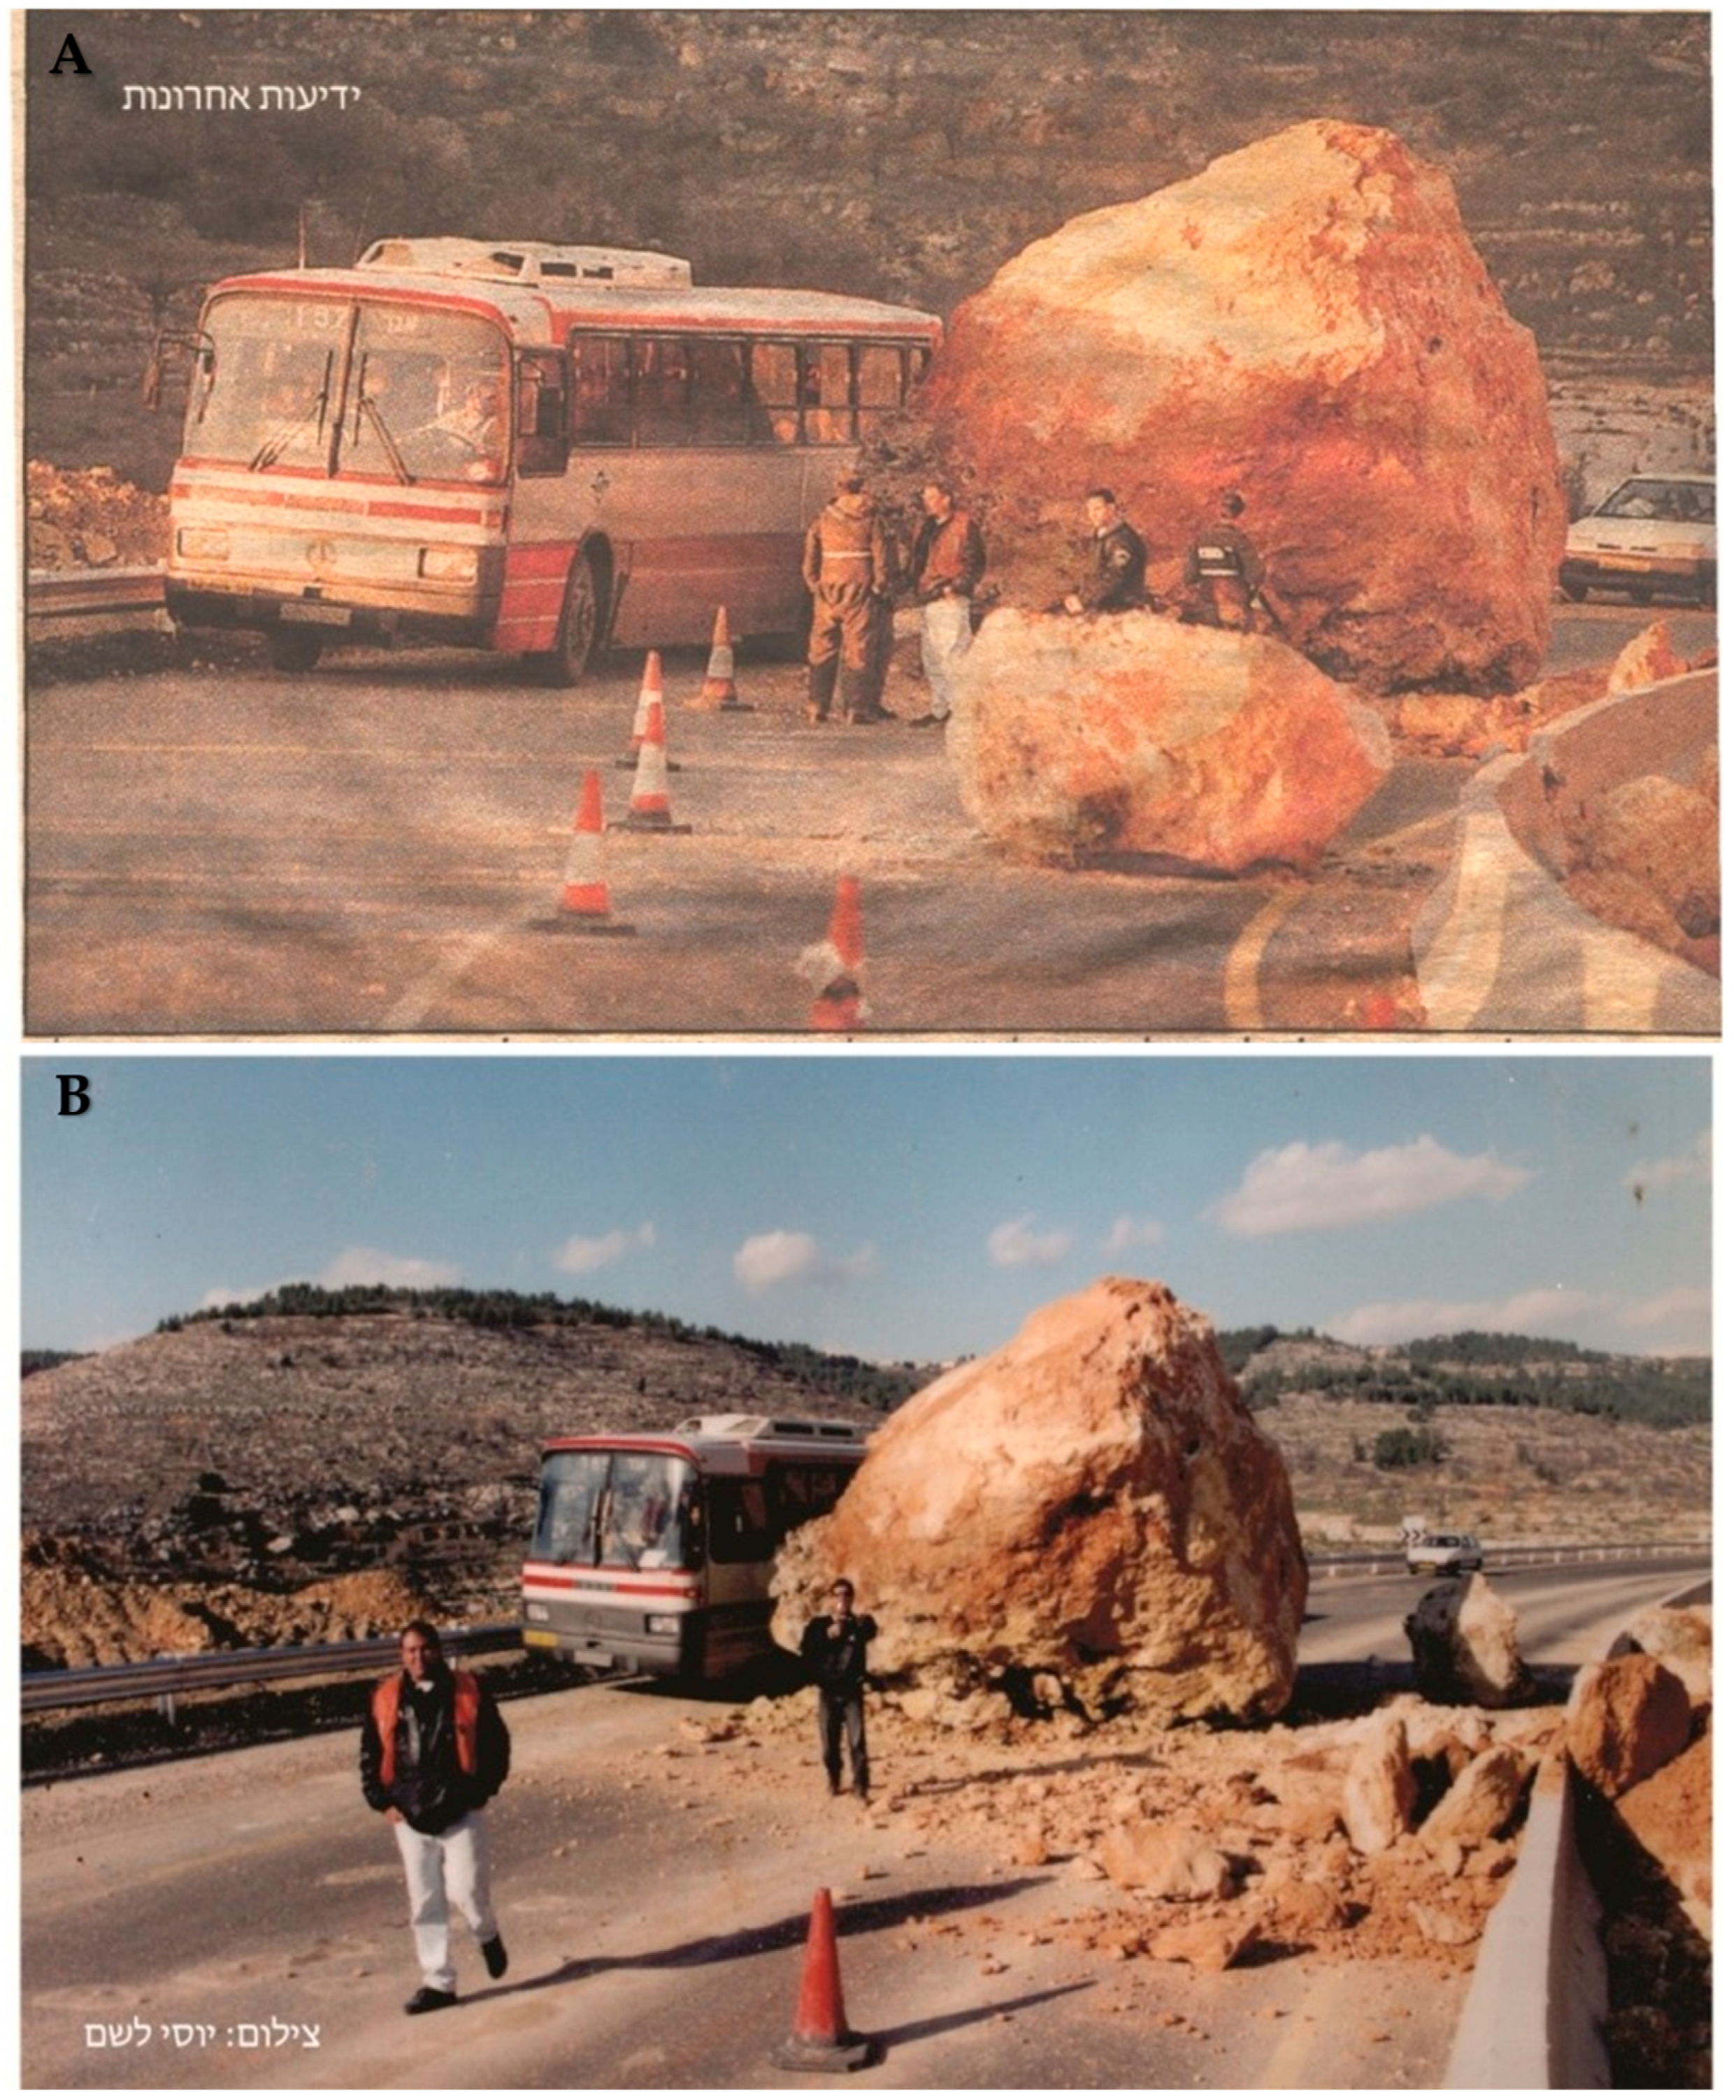
Appendix B. Cultural Values Damaged by Landsliding

Figure A5 shows collection pools from one of two ancient press installations cut in the bedrock. The pools are damaged by sliding and cracking. Realization of the Motorway widening plan will further damage them.
Figure A5. A traditional agricultural installation carved in the carbonate cemented breccia (likely an olive or grape press), Coord. 31.731274/35.148377. A crack is cutting through the stone-carved installation (yellow ellipse). We suggest that this is a part of the ongoing cracking triggered by the landscaping related to Motorway 385 and the pedestrian barrier.
Geotechnics 04 00041 g0a5

Appendix C

Figure A6. Field photos.
Geotechnics 04 00041 g0a6

References

  1. Katz, O.; Reichenbach, P.; Guzzetti, F. Rock fall hazard along the railway corridor to Jerusalem, Israel, in the Soreq and Refaim valleys. Nat. Hazards 2011, 56, 649–665. [Google Scholar] [CrossRef]
  2. Ryb, U.; Matmon, A.; Porat, N.; Katz, O. From mass-wasting to slope stabilization–putting constrains on a tectonically induced transition in slope erosion mode: A case study in the Judea Hills, Israel. Earth Surf. Process. Landf. 2013, 38, 551–560. [Google Scholar] [CrossRef]
  3. Morin, E.; Ryb, T.; Gavrieli, I.; Enzel, Y. Mean, variance, and trends of Levant precipitation over the past 4500 years from reconstructed Dead Sea levels and stochastic modeling. Quat. Res. 2019, 91, 751–767. [Google Scholar] [CrossRef]
  4. Sneh, A.; Avni, Y. Geological maps of Israel (1:50,000) Sheet 11-II: Jerusalem - Sneh Amihai, Avni Yoav, 2011 (Partly revised, 2013). 2011. [Google Scholar]
  5. Hall, J.K. The 25-m DTM (digital terrain model) of Israel. Isr. J. Earth Sci. 2008, 57, 145–147. [Google Scholar] [CrossRef]
  6. Gadot, Y.; Davidovich, U.; Avni, G.; Avni, Y.; Piasetzky, M.; Faershtein, G.; Golan, D.; Porat, N. The formation of a Mediterranean terraced landscape: Mount Eitan, Judean Highlands, Israel. J. Archaeol. Sci. Rep. 2016, 6, 397–417. [Google Scholar] [CrossRef]
  7. Hough, S.E.; Avni, R. The 1170 and 1202 CE Dead Sea Rift earthquakes and long-term magnitude distribution of the Dead Sea Fault Zone. Isr. J. Earth Sci. 2011, 58, 295–308. [Google Scholar] [CrossRef]
  8. Agnon, A. Pre-instrumental earthquakes along the Dead Sea Rift. In Dead Sea Transform Fault System: Reviews; Springer: Berlin/Heidelberg, Germany, 2014; pp. 207–261. [Google Scholar]
  9. Al-Dabeek, J.N.; El Kelani, R.J. Dead Sea earthquake of 11 February 2004, ML 5.2 post earthquake damage assessment in the west bank, Pallestine. In Proceedings of the International Earthquake Engineering Conference, Tokyo, Japan, 7–8 March 2005; An-Najah University: Nablus, Palestine, 2005. [Google Scholar]
  10. Salamon, A.; Katz, O.; Crouvi, O. Zones of required investigation for earthquake-related hazards in Jerusalem. Nat. Hazards 2010, 53, 375–406. [Google Scholar] [CrossRef]
  11. Zohar, M.; Marco, S. Re-estimating the epicenter of the 1927 Jericho earthquake using spatial distribution of intensity data. J. Appl. Geophys. 2012, 82, 19–29. [Google Scholar] [CrossRef]
  12. Orr, Z.; Erblich, T.; Unger, S.; Barnea, O.; Weinstein, M.; Agnon, A. Earthquake preparedness among religious minority groups: The case of the Jewish ultra-Orthodox society in Israel. Nat. Hazards Earth Syst. Sci. 2021, 21, 317–337. [Google Scholar] [CrossRef]
  13. Avni, R. The Jericho Earthquake, Comprehensive Macroseismic Analysis Based on Contemporary Sources; Ben-Gurion University of the Negev: Beersheba, Israel, 1927; Volume 203, p. 1999. [Google Scholar]
  14. Shamir, G.; Baer, G.; Hofstetter, A. Three-dimensional elastic earthquake modelling based on integrated seismological and InSAR data: The M w= 7.2 Nuweiba earthquake, Gulf of Elat/Aqaba 1995 November. Geophys. J. Int. 2003, 154, 731–744. [Google Scholar] [CrossRef]
  15. Darvasi, Y.; Agnon, A. Calibrating a new attenuation curve for the Dead Sea region using surface wave dispersion surveys in sites damaged by the 1927 Jericho earthquake. Solid Earth 2019, 10, 379–390. [Google Scholar] [CrossRef]
  16. Hofstetter, R.; Gitterman, Y.; Pinsky, V.; Kraeva, N.; Feldman, L. Seismological observations of the northern Dead Sea basin earthquake on 11 February 2004 and its associated activity. Isr. J. Earth Sci. 2008, 57, 101–124. [Google Scholar] [CrossRef]
  17. Wachs, D.; Levitte, D. Earthquake risk and slope stability in Jerusalem. Environ. Geol. Water Sci. 1984, 6, 183–186. [Google Scholar] [CrossRef]
  18. Crouvi, K.O. The geotechnical effects of long human habitation (2000 < years): Earthquake induced landslide hazard in the city of Zefat, northern Israel. Eng. Geol. 2007, 95, 57–78. [Google Scholar]
  19. Wechsler, N.; Katz, O.; Dray, Y.; Gonen, I.; Marco, S. Estimating location and size of historical earthquake by combining archaeology and geology in Umm-El-Qanatir, Dead Sea Transform. Nat. Hazards 2009, 50, 27–43. [Google Scholar] [CrossRef]
  20. Wust-Bloch, H.; Wachs, D. Seismic triggering of unstable slopes in northern Israel. Isr. J. Earth Sci. 2000, 49, 103–109. [Google Scholar] [CrossRef]
  21. Belferman, M.; Agnon, A.; Katsman, R.; Ben-Avraham, Z. Identifying plausible historical scenarios for coupled lake level and seismicity rate changes: The case for the Dead Sea during the last 2 millennia. Nat. Hazards Earth Syst. Sci. 2022, 22, 2553–2565. [Google Scholar] [CrossRef]
  22. Maiti, S.K.; Kamai, R. Interaction between fault and off-fault seismic sources in hazard analysis—A case study from Israel. Eng. Geol. 2020, 274, 105723. [Google Scholar] [CrossRef]
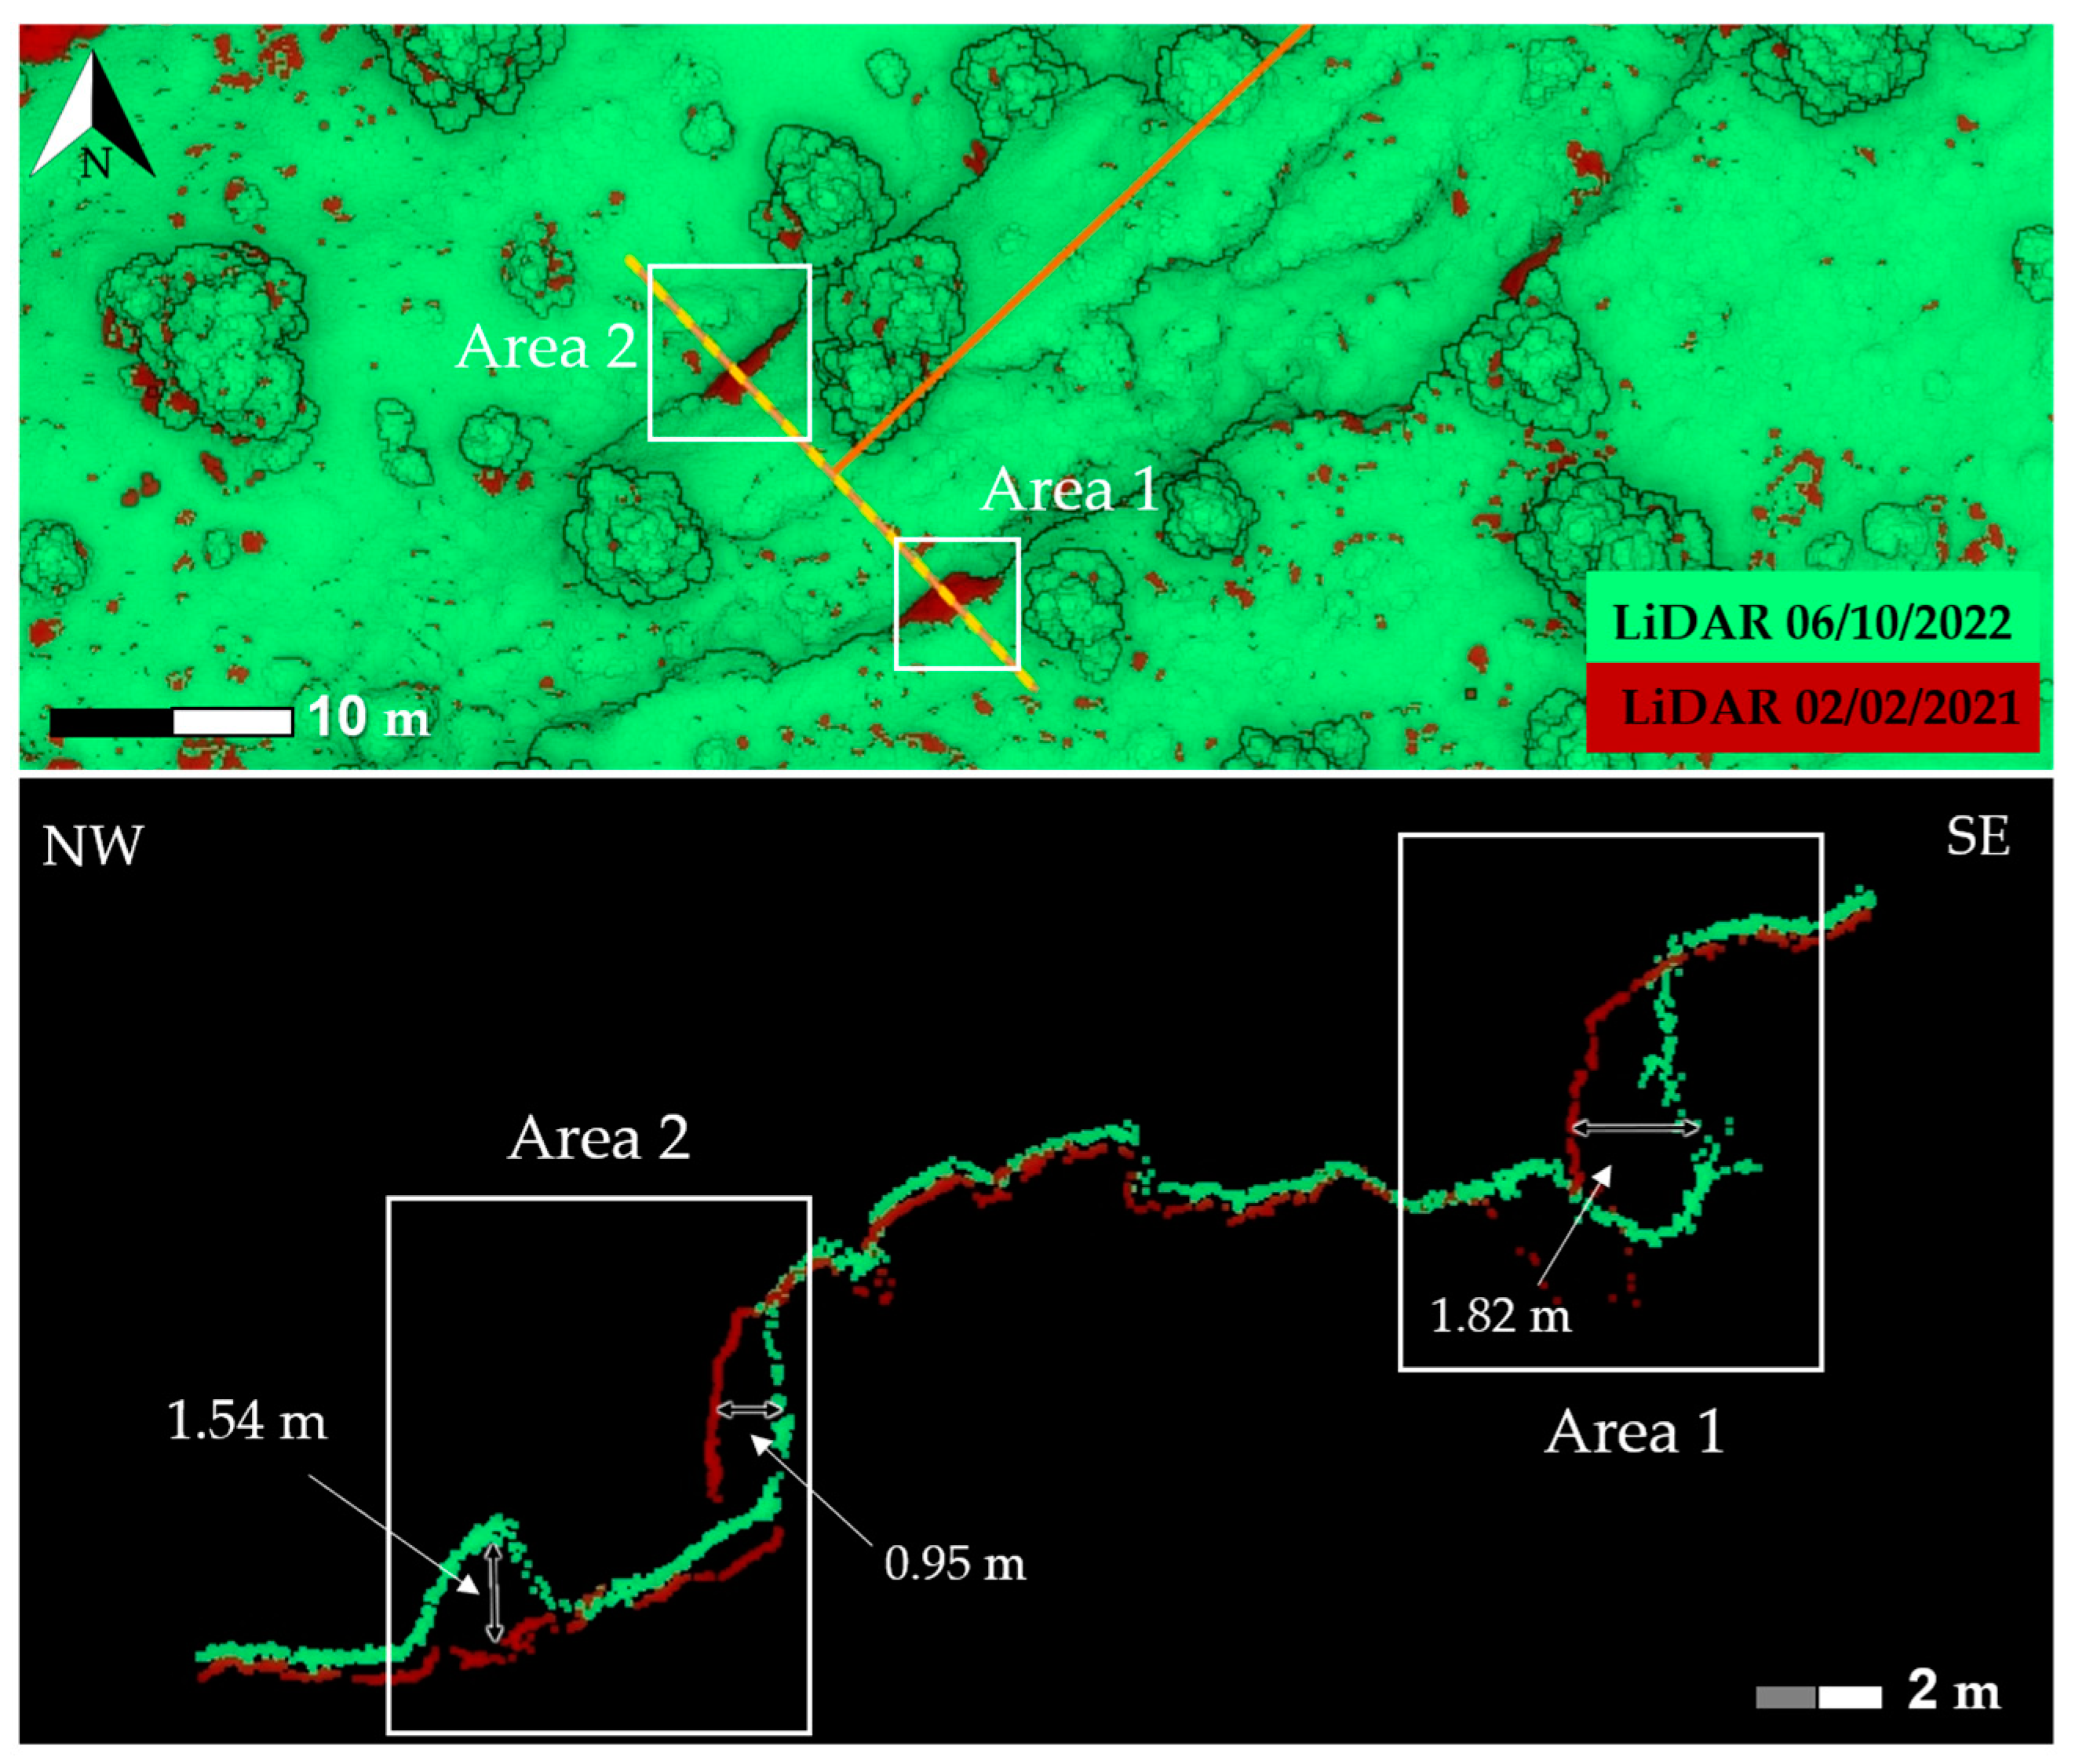
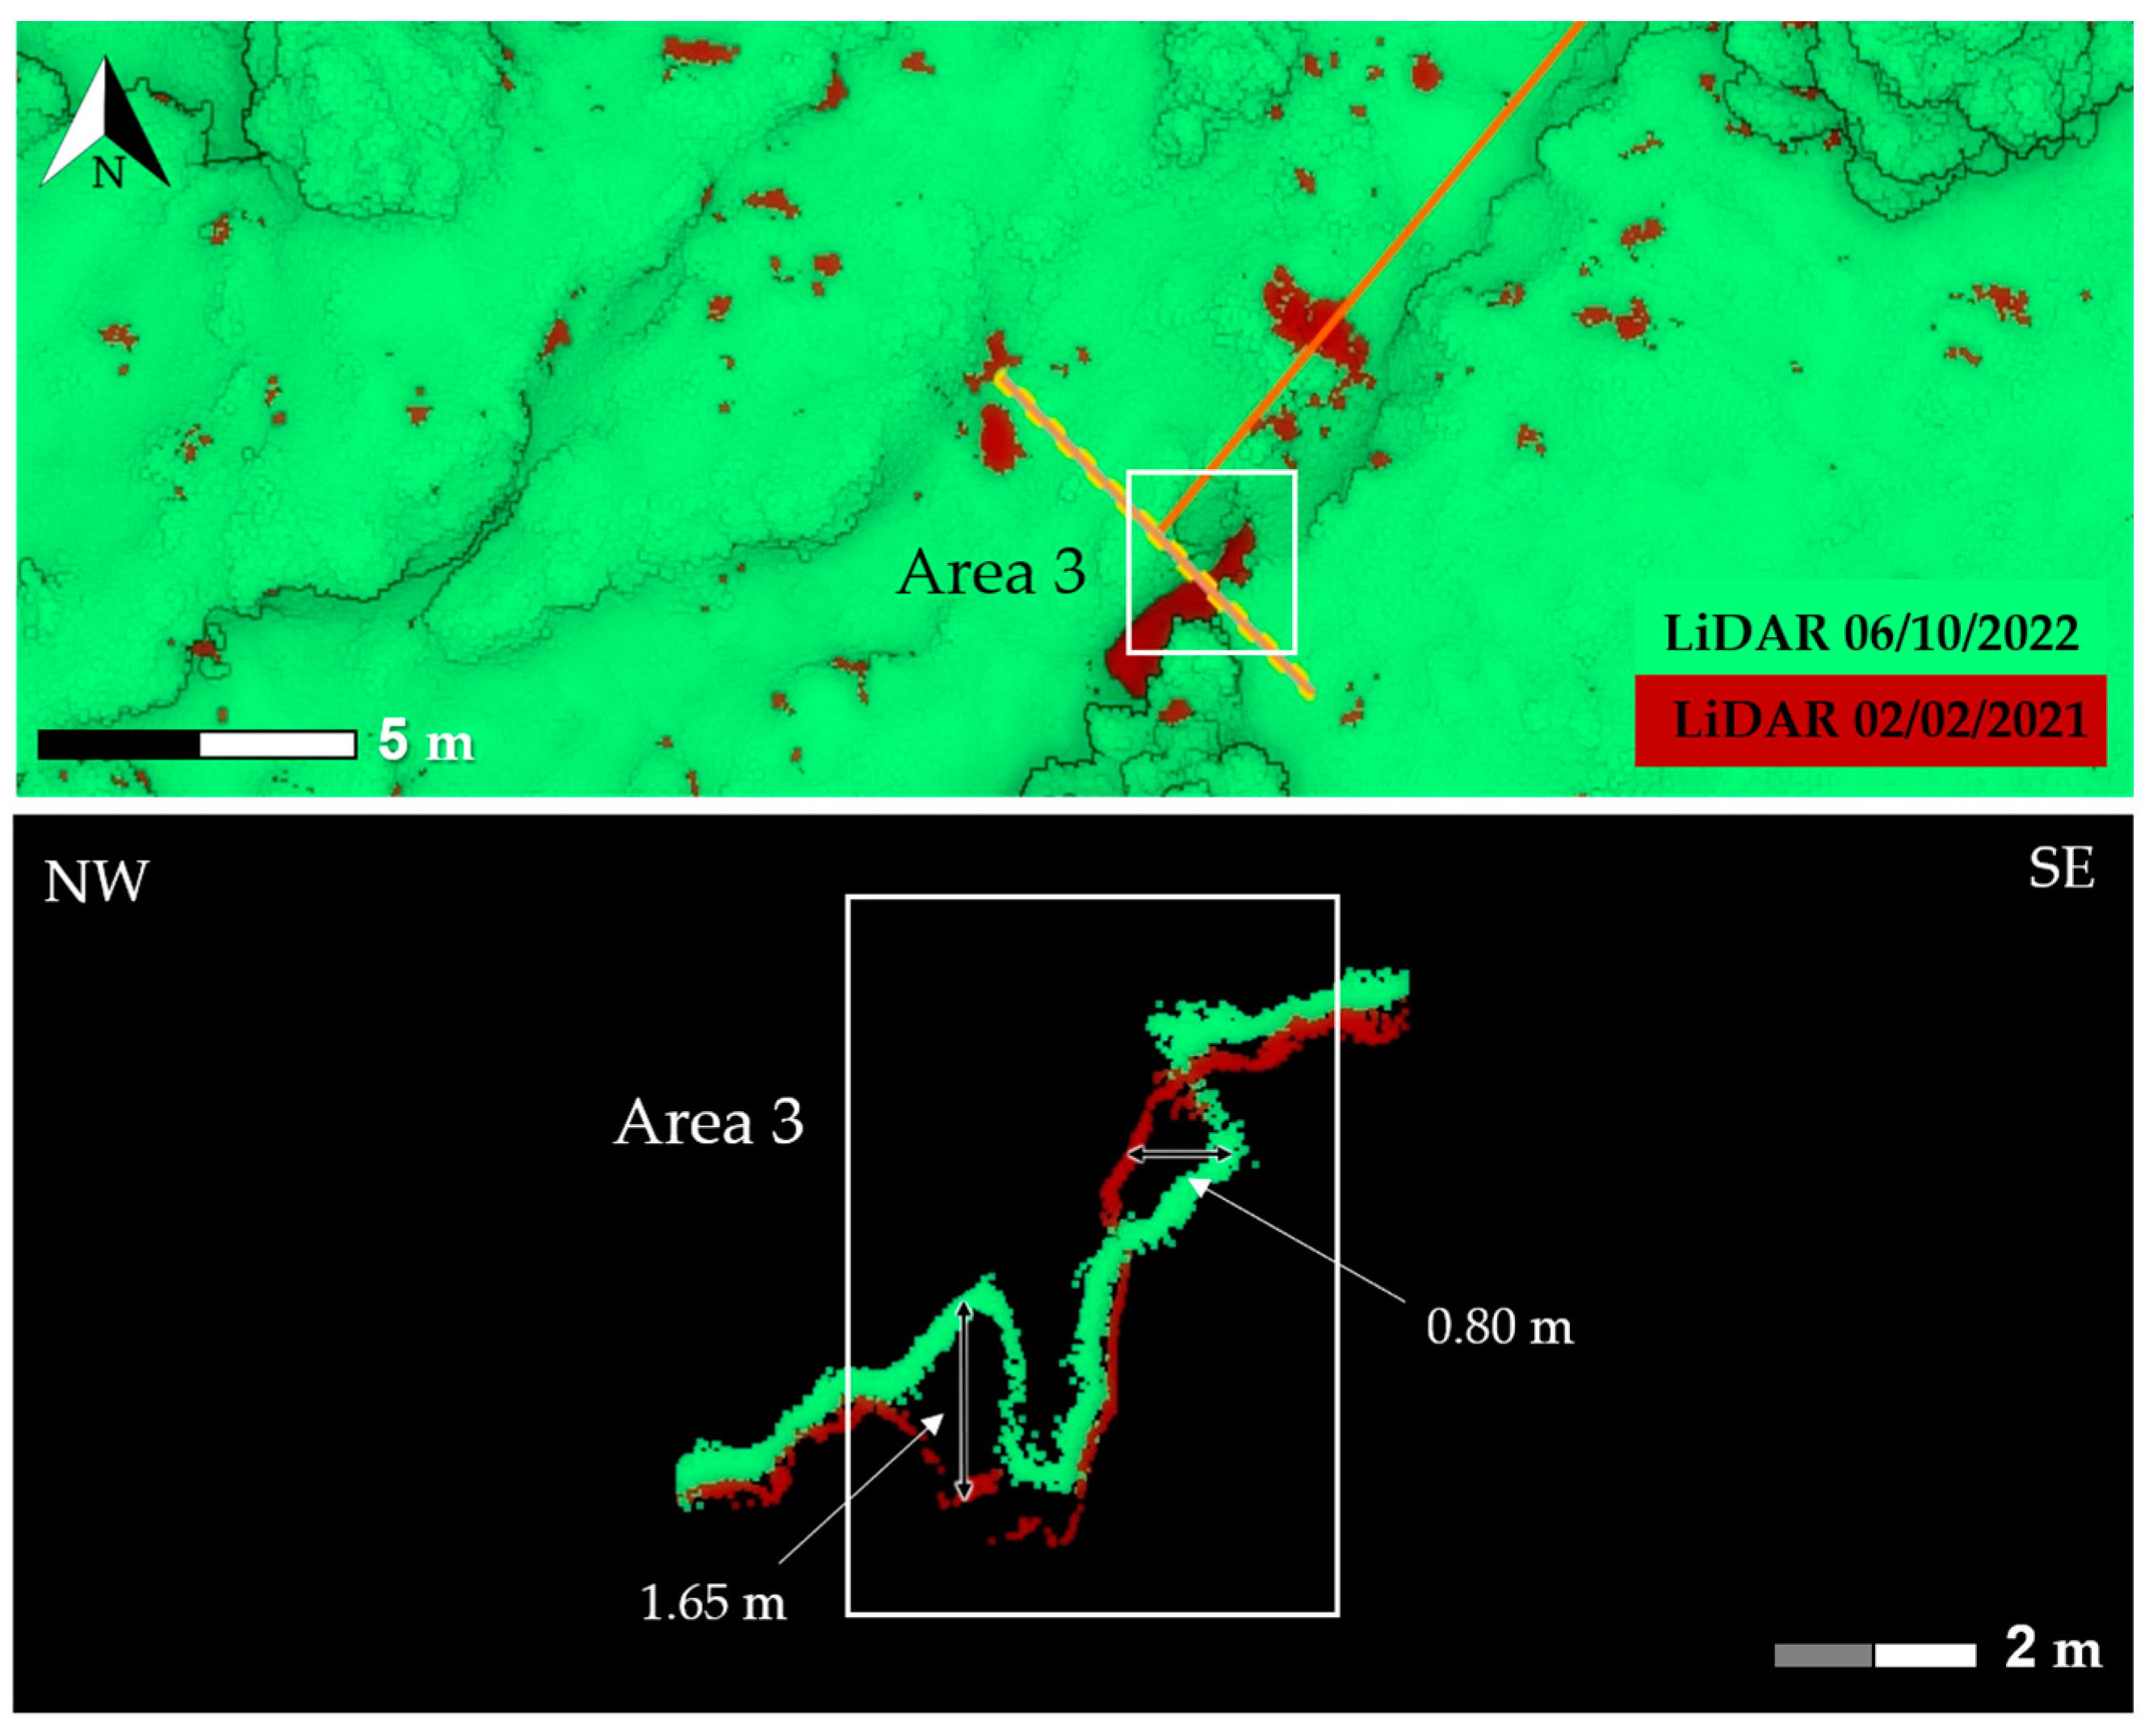
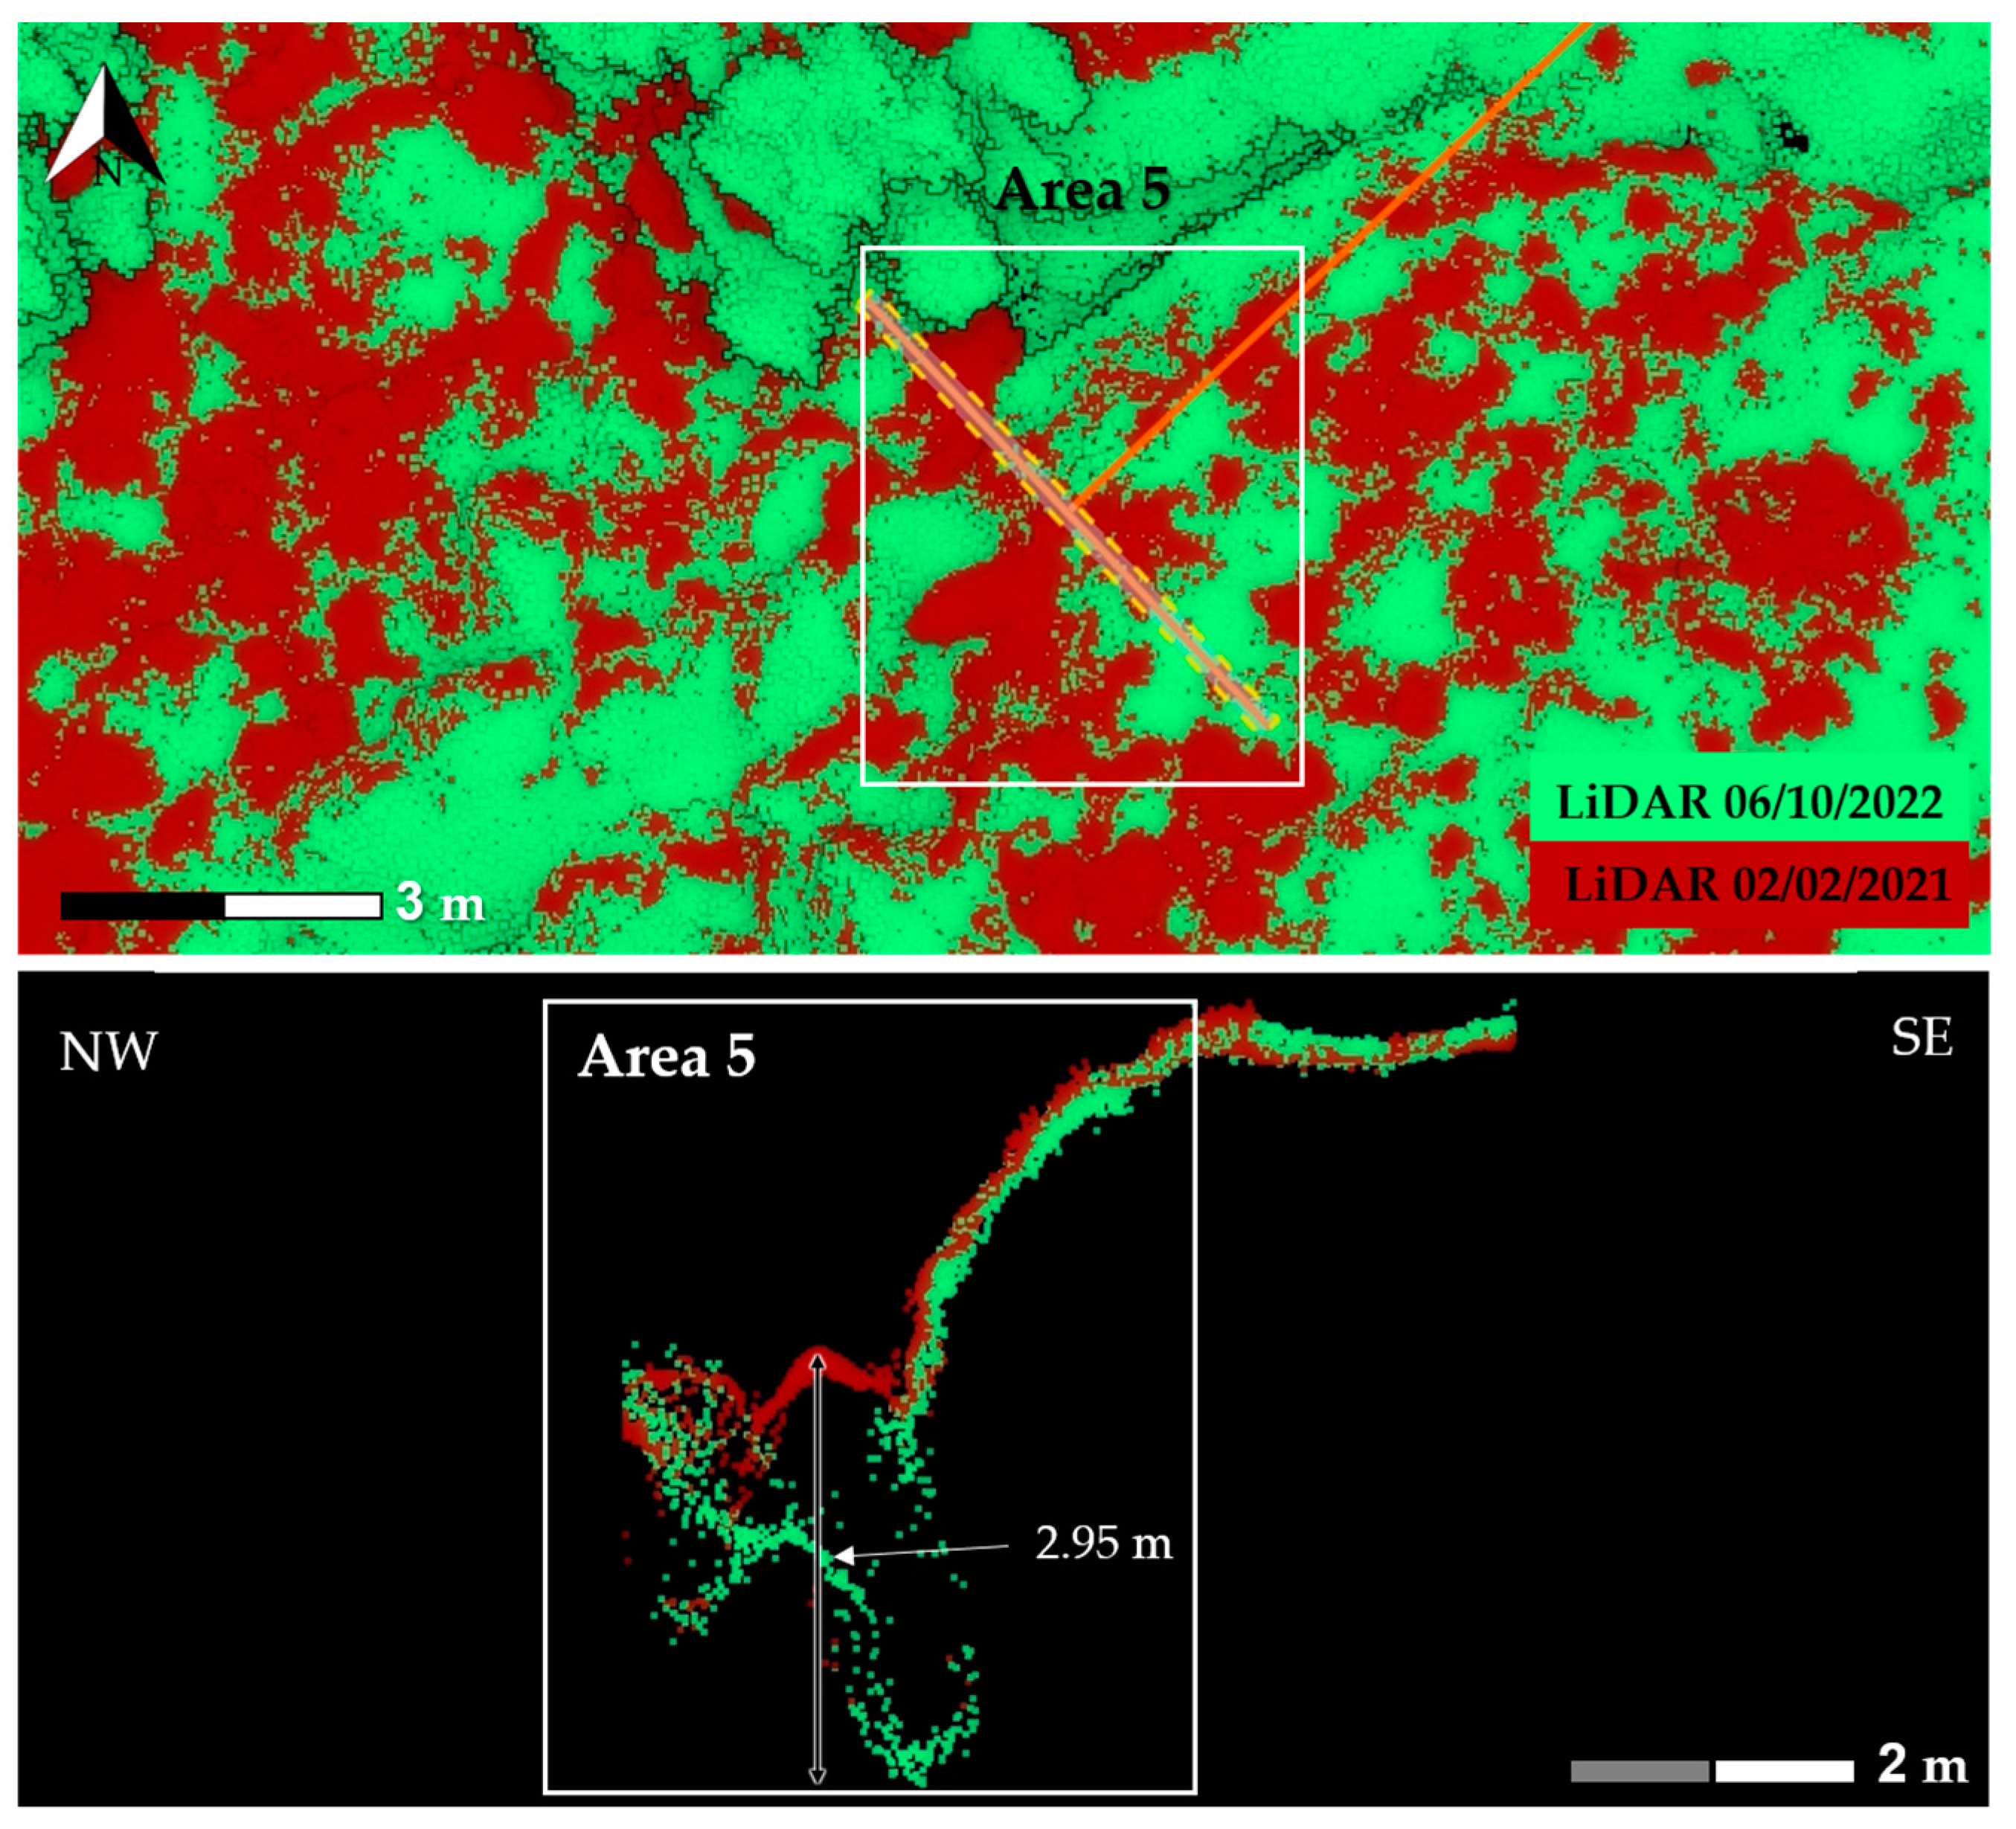
Figure 1. Location map (the source of the two upper maps is Open Topo Map). The aerial photo (bottom) was taken by a drone, and the map was compiled with QGIS software 3.22).
Geotechnics 04 00041 g001
Figure 2. The rockfall of 24 January 1996, shortly after Motorway 385 was completed. (A) From a news release on the daily Yedi’ot A’hronot; (B) slightly later, after the 3 m-wide boulder in the foreground (rolled through the protective concrete wall) was shattered for removal (photo by Yossi Leshem). The newspaper (from the day following the fall) noted that a real disaster was prevented when a four-metric-ton rock rolled onto the road, as traffic had been stopped earlier when smaller rocks fell; residents and Society for Nature Protection people had warned that, due to the haste to evacuate Bethlehem, the road was poorly constructed and was dangerous for traffic.
Geotechnics 04 00041 g002
Figure 3. 1:50,000 Geological map [4]. Stratigraphic and lithological symbols are given in Figure 4. The blue quadrangle demarcates the slide site. Motorway 385 is red. White circles mark rock fall blocks mapped by Katz et al., 2011 [1]. the inscriptions in Hebrew symbolize ancient sites, springs and streams.
Geotechnics 04 00041 g003
Figure 4. Stratigraphy [4].
Geotechnics 04 00041 g004
Figure 5. (A). A LiDAR point cloud of an open crevasse with depth reaching up to ~6.5 m. (B,C) An open crack in a dirt road, cut for installing a barrier around 2012; (B) A person halfway within the crevasse. (C) Zoom-in with a 0.4 m geological pick for scale. Notice the paleo-boulder within the breccia rock mass, split open by the new crevasse (photos taken 15 December 2020).
Geotechnics 04 00041 g005
Figure 6. LiDAR sensors: (Left), GeoSlam Zeb Horizon LiDAR system mounted on a Matrice 600 Pro UAV. (Right), DJI L1 LiDAR system mounted on a Matrice 300 RTK UAV.
Geotechnics 04 00041 g006
Figure 7. Orthophotos since 1970. The 1970 photo shows mild terracing, a traditional method practiced by farmers for soil accumulation and preservation (e.g., [6]).
Geotechnics 04 00041 g007
Figure 8. Contour maps: The yellow ellipse marks the area where the slide has modified the shapes of the contour map. (A) Contours traced from British Mandate (pre-1948) maps by Hall (2008) (25 m DTM) [5], superimposed on an orthophoto acquired by the drone. (B,C) are from https://amudanan.co.il/ (1:50,000). Contours in the more recent map (C) show inverted concavity where the slide intercepted the surface. This concavity controlled by the landslide head scarp is more pronounced on the 5 m contour map of the Israel Mapping Center.
Geotechnics 04 00041 g008
Figure 9. Orthophoto with the five main areas where movements have been recognized.
Geotechnics 04 00041 g009
Figure 10. LiDAR 2021/2022 comparison of areas 1 and 2 indicate the difference in topography (location in Figure 9).
Geotechnics 04 00041 g010
Figure 11. Photogrammetry 2021/2022 comparison of main differences (location in Figure 9).
Geotechnics 04 00041 g011
Figure 12. LiDAR 2021/2022 comparison of area 3 indicates the difference in topography (location in Figure 9).
Geotechnics 04 00041 g012
Figure 13. LiDAR 2021/2022 comparison of area 5 indicates the difference in topography (location in Figure 9).
Geotechnics 04 00041 g013
Table 1. Summarized offsets that were measured within the LiDAR point cloud.
Area\Offset [m]12345
Horizontal1.820.950.90--
Vertical1.911.541.651.612.95
Disclaimer/Publisher’s Note: The statements, opinions and data contained in all publications are solely those of the individual author(s) and contributor(s) and not of MDPI and/or the editor(s). MDPI and/or the editor(s) disclaim responsibility for any injury to people or property resulting from any ideas, methods, instructions or products referred to in the content.

