1. Introduction
A geomembrane is a polymeric or bituminous sheet manufactured by industry with a very low permeability coefficient that is applied as a barrier or separation element [
1,
2]. The high-density polyethylene (HDPE) geomembrane is the most widely used geosynthetic, and is used as a liner in liquid and waste containment facilities [
3,
4].
Using HDPE geomembranes in construction works results in aging or degradation. The degradation mechanisms can occur due to UV radiation, thermal exposure, oxidative degradation, or chemical degradation. These mechanisms can act in isolation or work simultaneously, changing the polymer’s morphology [
5,
6].
The formulation of high-density polyethylene geomembranes comprises 96–98% of resin, 2–3% of carbon black, and 0.25–1.0% of additives as antioxidants and stabilizers. Additives and carbon black are used in the blend to protect the resin, retarding the polymer degradation to UV radiation and thermal degradation [
7,
8].
Chain scission and cross-linking are the mechanisms of degradation involved in chemical aging, and they cause a modification in the polyethylene chains and changes the material’s mechanical behavior [
9].
Gulec et al. [
10] evaluated an HDPE geomembrane sample of 1.5 mm thickness in contact with synthetic acidic mine drainage at 20, 40, and 60 °C for 88 weeks. The authors compared the results with the same sample that had been in contact with acidic water and deionized water at the same temperatures. The melt flow index test (MFI), oxidative induction time (OIT), and Fourier transform infrared spectroscopy (FTIR) were performed to evaluate the sample. The test results showed only slight effects on the geomembrane properties for the MFI and FTIR. The OIT depletion decreased for all substances with the time of the exposure. The depletion rate increased when the temperature rose. The highest OIT depletion occurred for the sample in contact with synthetic acidic mine drainage. No changes in the polymer structure were noted.
Abdelaal et al. [
11] analyzed a high-density polyethylene geomembrane sample (1.5 mm of thickness) in contact with an acidic solution (pH = 0.5), which represents many mine solutions such as uranium, copper, and nickel. The estimation of the antioxidant depletion time was 9 years at 60 °C, 16 years at 50 °C, and 28 years at 40 °C.
The study of a 1.5 mm-thick HDPE geomembrane’s chemical compatibility when immersed in a low pH solution (pH = 0.5) was performed by Zhang et al. [
12]. The authors measured the crystallinity, melt flow index, oxidative induction time (standard and high-pressure methods), and tensile properties until 1.6 years of exposure at different temperatures. There was a tendency for the crystallinity to increase during exposure time. Using the Arrhenius method to estimate the antioxidant depletion time, the authors estimated 11 years to deplete the antioxidants at 50 °C and 250 years at 20 °C, both using the OIT standard test method.
Samples of HDPE geomembranes with 0.8 and 2.5 mm of thicknesses were immersed in a niobium solution with 60% concentration for 120 days at 23 and 50 °C by Lodi et al. [
13]. The variation in tensile properties after exposure was not significant. The melt flow index (MFI) test results showed an increase in the thicker sample. According to the authors, this increase indicates a chain scission in the polymer.
Rowe and Ewais [
14] exhumed a high-density polyethylene geomembrane (1.5 mm thick) from an Argentinian mining facility after sixteen years of service. The samples were exhumed from the slopes of the mining freshwater dam. The results of the stress cracking resistance test showed low values, especially for the north-facing collection pond, which had more hours a day of sun exposure than the west-facing freshwater dam, obtaining a value less than 150 h.
Santos and Gardoni [
15] compared virgin, laboratory aged, and exhumed samples of high-density polyethylene with 1.5 mm thick. The exhumed sample was taken from a Brazilian tailing dam, and it was in contact with cyanide fluid and exposed to the weather. The laboratory aged sample was immersed in cyanide fluid and ultraviolet radiation. Different tests were carried out to compare the behavior of the samples. The results showed a tendency to decrease deformability and increase stiffness for the laboratory and exhumed samples. The authors observed some cavities and cracks on the exhumed samples’ surface, showing a significant degree on its surface.
HDPE geomembranes are usually applied as a liner in the environmental protection of mining facilities. This work evaluated two exhumed HDPE geomembrane samples from Brazilian mining facility constructions with 1.0 mm of thickness. The MIN sample was exhumed from a pond for water use for the iron ore process after 7.92 years of exposure. The MIN2 sample was exhumed from a spillway channel of a ferronickel tailing dam after 10.08 years of service. This work compared the samples’ physical property values with the American standard minimum values to analyze the samples’ final conditions. The physical tests were carried out to determine the thickness, density, carbon black content, viscosity, amount of antioxidants’ different groups, tensile properties (resistance and elongation), and stress crack resistance (brittle behavior tendency) of the materials. Moreover, thermal analyses such as thermogravimetry (TG/DTG), differential thermal analysis (DTA), and differential scanning calorimetry (DSC) were performed to complement the physical analyses in terms of the polymer’s behavior, providing new thermoanalytical data for HDPE geomembranes after field exposure. These analyses aim to collaborate with the durability knowledge of this geosynthetic, which is used in worldwide environmental applications.
2. Materials and Methods
2.1. Materials
The present work studied two HDPE geomembrane samples exhumed from different mining facilities in Brazil. The first sample, called MIN, was taken from a pond for water use for the iron ore process after 7.92 years of exposure.
Table 1 presents, as a reference, the mining iron ore effluent’s characterization parameters of mining in Minas Gerais, Brazil. The second sample, MIN2, was exhumed from a spillway channel of a ferronickel tailing dam after 10.08 years of service.
Table 2 shows, as a reference, the chemical composition of a nickel waste disposed of in a tailing dam. Both samples present 1.0 mm of nominal thickness, sample dimensions of 1.5 m of width and 2.0 m of length, and were stored in a covered place without contamination immediately after collection until transportation to the laboratory. The MIN sample was exhumed from a mining facility in Minas Gerais state, the southwest region of Brazil. The MIN2 sample was exhumed from a mining facility in Goiás state, the midwest region of Brazil. In both locations, tropical semi-humid weather predominates. Both samples were taken from the slopes of the geotechnical structures, and they were exposed to environmental conditions, such as sun radiation, rain, wind, and moisture. Moreover, the locations of the slopes from which the samples were taken provided the contact of the samples with the effluents due to the effluents’ level variation throughout the exposure field time.
2.2. Materials Characterization Methodology
The materials of this study were characterized using physical tests and thermal analyses. The physical tests used were the thickness determination [
18], density determination [
19], carbon black content [
20], melt flow index [
21], oxidative-induction time [
22,
23], tensile properties [
24], and stress crack resistance [
25]. The thermal analyses were performed by thermogravimetry (TG/DTG), differential thermal analysis (DTA), and differential scanning calorimetry (DSC).
2.2.1. Physical Properties
The HDPE geomembrane’s thickness was determined using a dead-weight loading gauge (200 ± 0.2 kPa) by measuring the difference between the dead-weight loading gauge with and without the specimen, with a precision of 0.001 mm.
The test performed to determine the HDPE geomembrane’s density uses the Archimedes’ principle by measuring the immersed mass of the specimen (1.0 ± 0.1 g) in isopropyl alcohol at 21 ± 0.1 °C. The specimen’s mass was determined using an analytical balance with a precision of 0.0001 g. The specimen was measured before and after the immersion in a vessel and beaker.
The carbon black content (CBC) was determined by measuring the HDPE geomembrane’s specimen mass (1.0 ± 0.1 g) with a precision of 0.0001 g by an analytical balance before and after burning at 605 ± 5 °C in a muffle furnace.
The melt flow index (MFI) test was performed using a 5 ± 0.01 kg-dead-weight load to extrude an HDPE geomembrane’s specimen at 190 ± 0.08 °C for 10 ± 0.01 min in a smooth bore (2.095 ± 0.005 mm in diameter and 8.000 ± 0.025 mm long). The mass was determined using an analytical balance with a precision of 0.0001 g.
This study utilized two tests to determine the oxidative-induction time (OIT) of the HDPE geomembrane samples. Standard OIT (Std. OIT) and high-pressure OIT (HP OIT) tests were performed. Both tests can search the different antioxidants in the material’s blend. DSC equipment was used to perform the tests, model Q20, manufactured by TA Instruments in New Castle, DE, USA, using a sample mass of 5 ± 0.5 mg inside an aluminum crucible. The standard OIT test was performed at 200 ± 2 °C with an oxygen constant pressure of 140 ± 5 kPa, a heating rate of 20 ± 1 °C·min−1, and a flow rate of 50 ± 5 mL·min−1. The high-pressure OIT test was conducted at 150 ± 0.5 °C with an oxygen constant pressure of 3.4 ± 0.06 MPa and a heating rate of 20 ± 1 °C·min−1.
The tensile test was performed using a universal machine manufactured by EMIC in São José dos Pinhais, PR, Brazil, model DL 3000, with a 2-kN load cell, a test speed of 50 ± 1 mm·min−1, and the type IV dog bone specimen. The tensile strength and tensile elongation were recorded for the material’s machine direction.
The stress crack resistance (SCR) (mean rupture time of 5 specimens with the precision of 1 s) was determined using a deadweight load of 30% of the yield tensile strength of the samples (precision of 10 g) and a notch of 20% of the specimen thickness (precision of 0.001 mm). The test was performed using equipment manufactured by WT Indústria at São Carlos, SP, Brazil. The specimens were immersed in a solution with 10 ± 0.1% of Igepal CO 630 and 90 ± 0.1% of water at a constant temperature of 50 ± 1 °C.
2.2.2. Thermal Analyses
The thermogravimetric analyses (TG/DTG and DTA) were performed using SDT 2960 equipment, manufactured by TA Instruments at New Castle, DE, USA. A heating rate of 10 ± 1 °C·min−1 was used under synthetic air purge gas with a 100 ± 5 mL·min−1 of flow. The sample support used was alpha alumina and the mass for each analysis was around 7 ± 0.5 mg.
The DSC equipment utilized in this study was manufactured by Mettler Toledo (DSC1 Stare model) at Columbus, OH, USA, using an aluminum crucible with temperature ranges of −80 to 200 ± 2 °C and 200 to 25 ± 2 °C in a nitrogen gas environment with a flow of 50 ± 5 mL·min−1 and heating rate of 10 ± 1 °C·min−1. The sample support used was aluminum, and the mass for each analysis was around 3 ± 0.5 mg.
3. Results
3.1. Physical Evaluations
During the exposure period, the geomembrane samples were able to experience the exposure of environmental agents in the field, such as ultraviolet radiation and thermal variations. Moreover, chemical contact occurred between the samples with the effluents. These agents can change the samples’ properties, modifying the materials’ performance as an environmental protection liner.
The criteria utilized as a reference to compare the physical characterization of high-density polyethylene geomembranes are determined by the American standard GRI-GM13 [
26], which specify the minimum property values for the product’s manufacturing quality control.
Table 3 and
Table 4 present the results of the physical tests for both exhumed HDPE geomembrane samples studied and GRI-GM13’s minimum property values [
26], except for the MFI minimum value, which is not considered in the American standard.
According to Islam and Rowe [
27], the geomembrane thickness influences the mechanical properties and the durability of the product. The thickness mean values of both exhumed samples were lower than the nominal value (1.0 mm). The MIN sample presented a thickness mean value 10% lower than the nominal value, whereas the MIN2 sample showed a thickness value 6% lower than 1.0 mm. This non-compliance of the minimum thickness mean value required by the manufacturer can prematurely decrease the material’s properties and, consequently, decrease the product’s lifetime.
The density test results showed values higher than 0.940 g·cm
−3, which is the minimum required value for GRI-GM13 [
26]. The density of polyethylene influences the physical and mechanical properties. In general, medium-density polyethylene (MDPE) is more useful for liners, because it presents better chemical resistance, high strength, and low permeability when compared to linear low-density polyethylene (LLDPE). However, HDPE, which is a semi-crystalline structure polymer, is susceptible to stress cracking. The HDPE geomembrane is formed by MDPE resin added with carbon black and additives, making the density higher than 0.940 g·cm
−3 [
28,
29]. The test results demonstrate the use of adequate resin of MDPE in the blend of both geomembrane samples.
The GRI-GM13 [
26] prescribes a range of 2–3% of carbon black content in the product. Both samples obtained values according to the American standard. The exhumed samples tested presented lower MFI values than 1.0 g·10·min
-1. However, the MIN2 sample obtained the highest MFI value of the samples studied, which was the double value of the MIN sample value. According to Muñoz Gómez [
30], high MFI values are related to the low molecular weights of HDPE geomembranes. A polymer with a wide molecular weight distribution presents a low viscosity and good stress crack resistance. Comparing both tested samples, the MIN sample showed a lower MFI value and higher stress crack resistance, demonstrating the same effect noted by Muñoz Gómez [
30].
Both samples tested obtained low values of Std. OIT, lower than 100 min. It is possible to understand that the amount of antioxidants has almost ended for antioxidants that work in the temperature range of 200 °C. Sample MIN2 presented the lowest Std. OIT. The OIT may have been influenced due to the longer exposure time of this sample. None of the tested samples presented HP OIT values equal to or higher than 400 min. The presence of HALS (hindered amine light stabilizer) in the additive package increases the HP OIT results because this test is performed at 150 °C. Probably none of the tested samples presented HALS in their blend. Three different stages can evaluate the HDPE geomembrane’s oxidation. The first stage is related to antioxidant depletion. The chain reaction and the molecular composition changes start at the second stage. The third stage is related to the free radical formations, and cross-linking occurs in the free radicals with high changes in the molecular composition. Therefore, the mechanical and stress cracking properties are decreased, increasing the susceptibility of the polymer to the degradation effects [
5,
6,
31]. It can be observed that the samples are still in the first stage of oxidation.
Lavoie et al. [
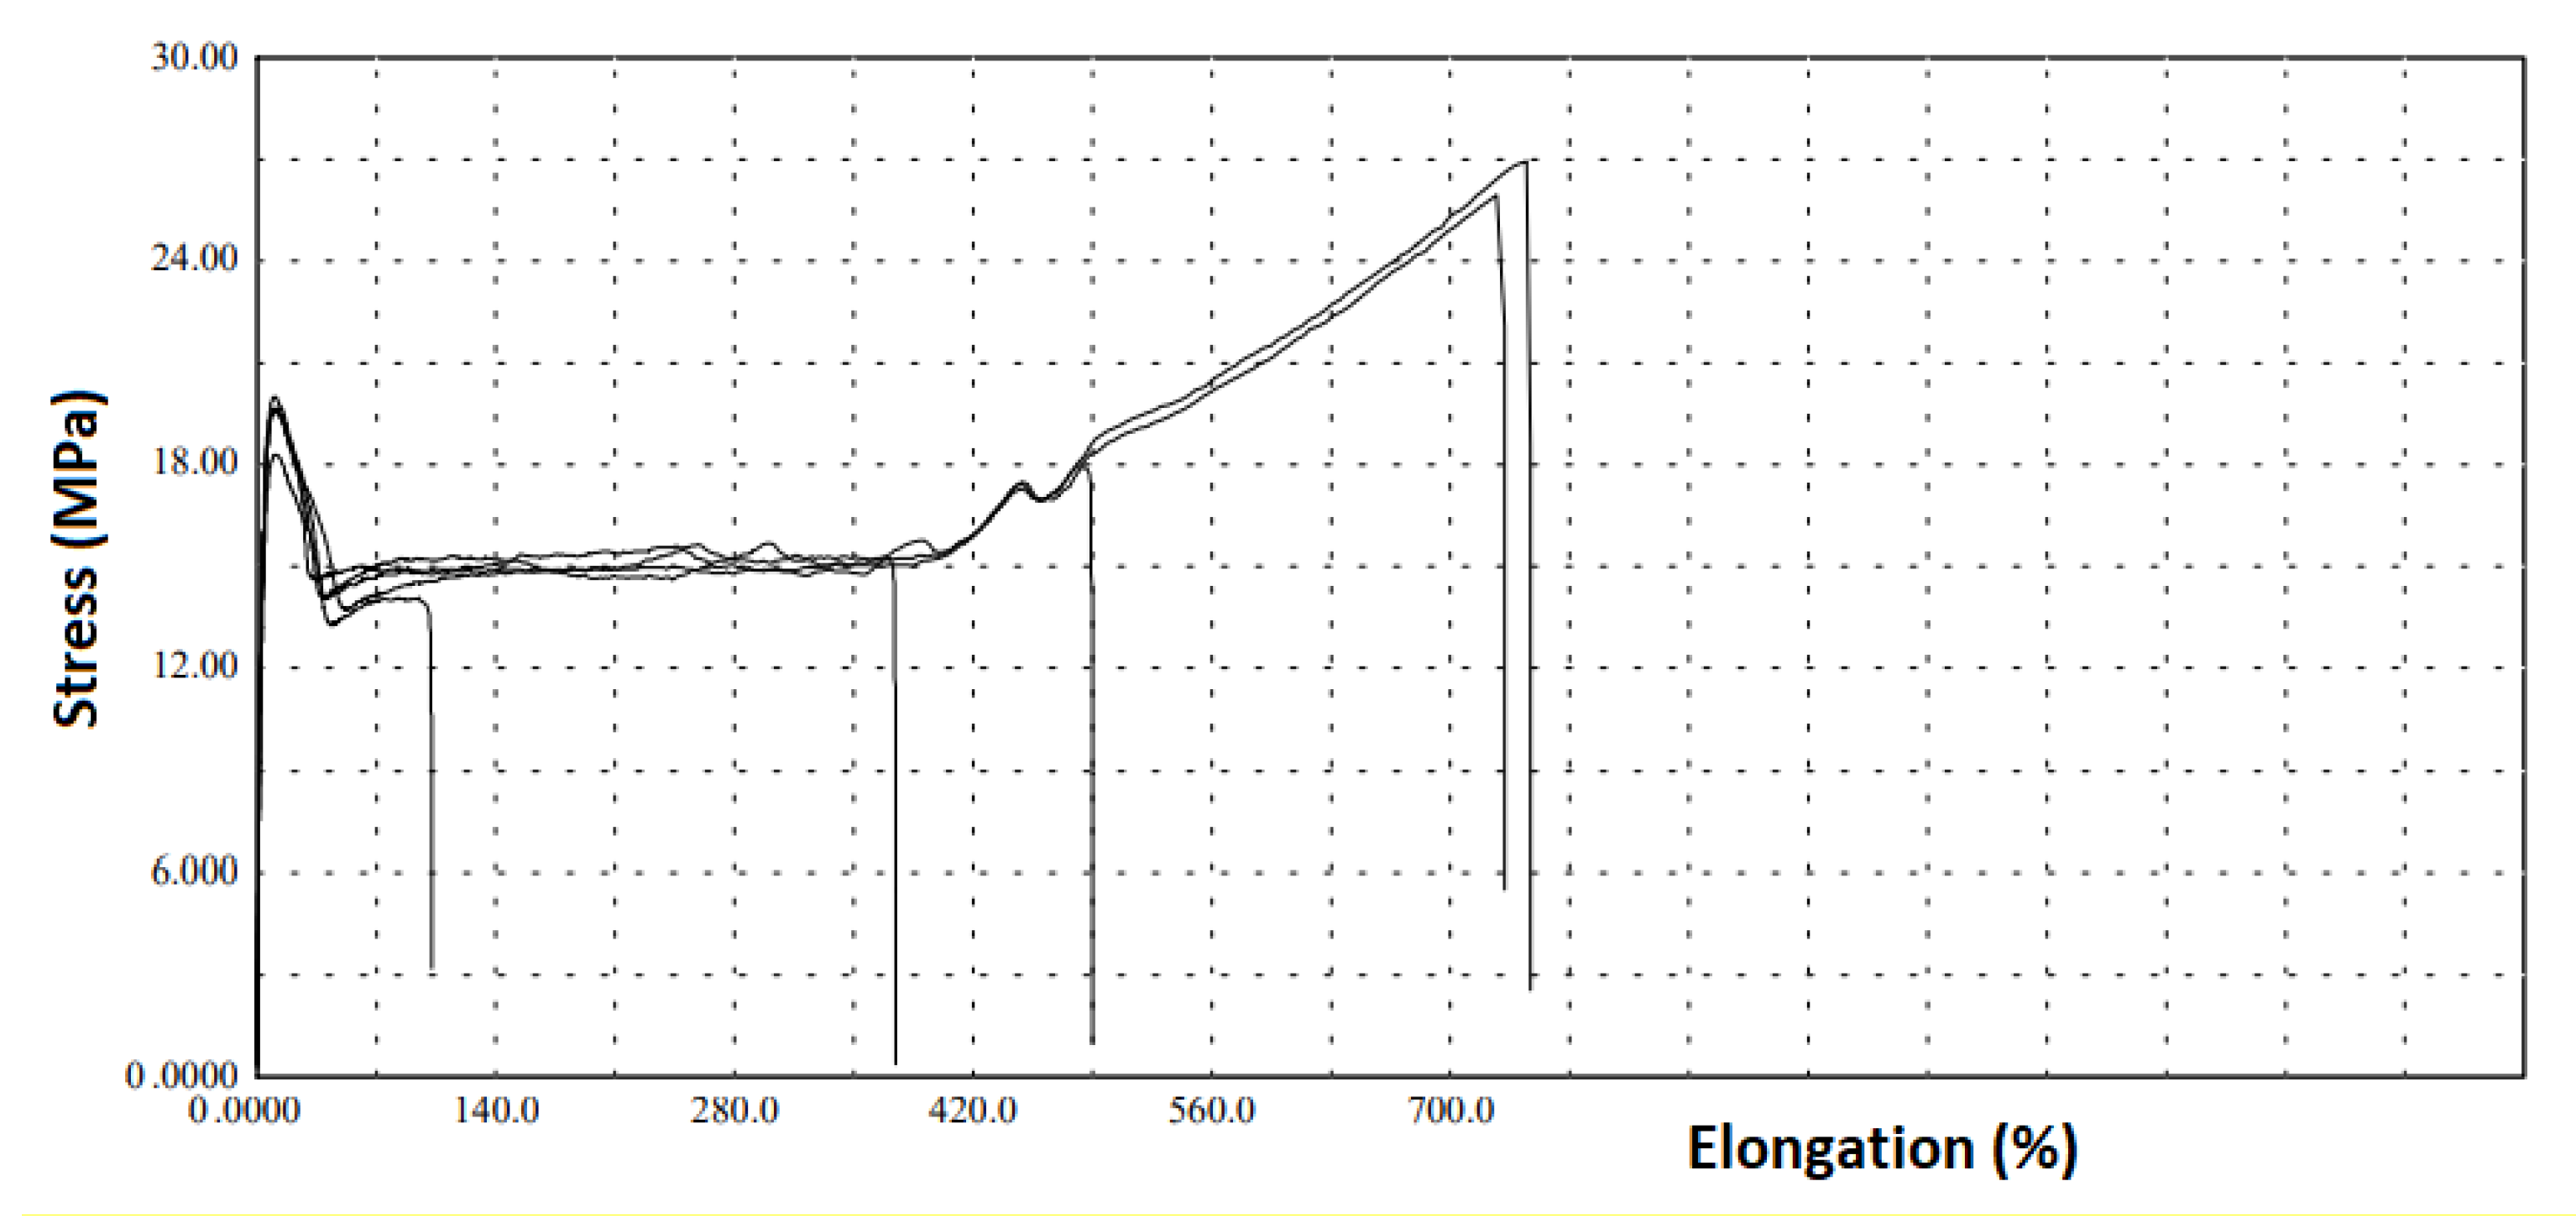
32] tested a virgin HDPE geomembrane with 1.0 mm of nominal thickness and obtained an expected ductile tensile behavior for all specimens tested. Otherwise, the MIN and MIN2 samples exhibited brittle tensile behavior for some of the specimens tested, demonstrating a variation among the specimens. The MIN sample presented specimens 1, 3, and 4 with elongations lower than 700%, otherwise specimens 2 and 5 presented elongations higher than 700%. MIN2 sample showed brittle behavior for specimens 2 and 5, while specimens 1, 3, and 4 presented elongations higher than 700%. This heterogeneity in the tensile elongation among the specimens for both samples analyzed demonstrates that changes occurred in the samples due to field exposition.
Figure 1 and
Figure 2 show the samples’ tensile curves. Both samples presented tensile resistance values lower than the minimum required value for the American standard. The MIN sample presented the lowest value between the samples, probably influenced by the lower thickness. The tensile elongation values obtained demonstrated, for both samples, lower values than the minimum required value for the GRI-GM13 [
26]. The MIN sample presented the lowest average tensile elongation value, lower than 350%, which is less than 50% of the minimum required for the GRI-GM13 [
26] for the tensile elongation value. It is interesting to note that, despite the consumption of antioxidants still being noticed (the first oxidation stage of the HDPE geomembrane), changes occurred in the tensile properties of the samples.
Stress cracking of polymers is a phenomenon caused by tensile stresses lower than mechanical strength, which promotes internal or external cracks. These cracks can be accelerated by the environment [
33]. According to the GRI-GM13 [
26], the minimum required value for the stress crack resistance is 500 h. Both samples presented stress crack resistance values lower than the minimum required value by the American standard, especially for the MIN2 sample, which presented the highest MFI value and the lowest stress crack resistance between the samples. The MIN and MIN2 samples presented similar behaviors between stress cracking and tensile parameters, with low tensile elongation values and low-stress crack resistance.
3.2. Thermoanalytical Evaluations
Figure 3 shows the TG/DTG curves with 10 °C·min
−1 of heating rate using synthetic air purge gas for the MIN and MIN2 samples. It can be observed that both samples did not show mass variation between the initial temperature and 245 °C. The MIN2 sample presented the first mass variation of 9.81% (until 380 °C), while the MIN sample presented the first mass variation of 8.18% (until 390 °C). The second mass variation occurred until 445 °C and showed variations of 76.13% and 74.22%, respectively, for the MIN and MIN2 samples. Furthermore, the MIN sample’s DTG curve at the second mass variation presented an acute behavior and a wider curve than the MIN2 sample. The mass variations’ difference observed can be attributed to the different field exposures between the samples. The final decomposition presented a similar behavior, with a mass variation of 14.97% and 14.54%, respectively, for the MIN and MIN2 samples. At the end of the decomposition, carbonaceous material was observed on the crucible for both samples.
Figure 4 shows the DTA curves for both samples. The endothermic peak can be observed in both curves, at 128 °C and 131 °C, respectively, for the MIN and MIN2 samples. This peak is attributed to the melting point of the materials in concordance with the DSC curves. The exothermic peaks can be seen at 260 °C (MIN2 sample) and 267 °C (MIN sample). These peaks are related to the samples’ first decomposition step. After 380 °C, there are two exothermic peaks for both samples at 417 °C and 462 °C due to the third and fourth thermal decomposition steps. These peaks represent the oxidative process of these materials and do not represent the materials’ combustion because the peaks are wide. The combustion process peak would present the acute peak in the curves.
Figure 5 and
Figure 6 show the DSC curves for the heating and cooling, respectively, at temperature ranges from −80 to 200 °C and 200 to 25 °C, with 10 °C·min
−1 as a heating rate. The purpose of using two temperature ranges was to verify the melting point and crystallization. For the melting point (
Figure 5), it can be observed that the difference between the peaks is low (134 °C for the MIN sample and 133 °C for the MIN2 sample), which shows that the geomembranes’ exposure conditions did not change the fusion behavior. Likewise, the samples’ crystallization peaks, seen in
Figure 6, present both peaks with temperatures of 110 °C for the MIN sample and 111 °C for the MIN2 sample.
4. Discussion
The exhumed HDPE geomembrane samples evaluated in this work presented some critical differences in their physical test values compared to the American standard GRI-GM13’s [
26] minimum property values.
The thickness test results showed that the samples’ mean values were lower than the nominal value, which can collaborate to decrease the tensile properties prematurely, reducing the material’s durability.
Both samples’ density and carbon black content test results demonstrated full compliance with the GRI-GM13 [
26]. Thereby, the correct raw materials were used, and the carbon black amount was correctly added in the geomembranes.
The MIN2 sample presented an MFI test value double that of the MIN sample. It was possible to note that the MIN2 sample showed a stress crack resistance value less than half of the MIN sample. This behavior corroborates the literature, which has shown that an HDPE geomembrane with a low viscosity can present high-stress crack resistance. However, both samples showed lower stress crack values than the GRI-GM13 [
26], demonstrating brittle behavior. Moreover, the MIN and MIN2 samples presented similar behaviors between stress cracking and tensile, with low tensile elongation values and low-stress crack resistance. Both samples demonstrated lower tensile values than the American standard’s minimum required values. This brittle behavior showed by both samples demonstrates changes in the polymer’s structure caused by mechanisms of degradation and can indicate that the end of the product’s life has been reached.
Both samples tested obtained lower values of OIT (Std. and HP) than the minimum required values of the American standard. It can be seen that the amount of antioxidants has been severely reduced for antioxidants that work in the temperature range of 200 °C, which represents the beginning of a chain reaction, and changes in molecular composition begin [
34]. The MIN2 sample, which presents the longer field exposure time, showed the lowest Std. OIT, lowest SCR, and lowest tensile elongation. It can be seen that the MIN2 sample presents a worse final condition than the MIN sample.
The thermal analyses did not demonstrate any considerable difference between the samples analyzed. The thermogravimetric (TG) analysis showed differences in the mass variations between the samples, which is attributed to the different field exposures.
5. Conclusions
This paper analyzed two different exhumed HDPE geomembranes that had been used in mining facilities in Brazil using physical and thermoanalytical evaluations. During exposure time, these samples could experience exposure to environmental agents and chemical contact with mining effluents. These exposures can change the material’s properties, influencing the product’s performance as an environmental protection synthetic barrier.
Both samples present thicknesses lower than the nominal value (1.0 mm), contributing to premature degradation of the materials. The MIN sample presented a lower thickness mean value (10% lower than the nominal value). The density test results showed values higher than 0.940 g·cm−3, which is the minimum required value for the American standard. The density test results demonstrated the use of adequate resin of MDPE in the blend of both geomembrane samples.
The exhumed samples tested presented lower MFI values than 1.0 g·10·min−1. However, the MIN2 sample obtained the highest MFI value of the samples studied, which was double the value of the MIN sample. Comparing both tested samples, the MIN sample showed lower MFI values and higher stress crack resistance.
The samples presented high antioxidant depletion at 200 °C, verified by the Std. OIT results. The MIN2 sample had the lowest Std. OIT value; the longer exposure time may have influenced this result. It can be seen that the amount of antioxidants is severely reduced for antioxidants that work in the temperature range of 200 °C. At 150 °C, HP OIT results showed that probably none of the samples had HALS in their additive packages. It can be observed that the samples are still in the first oxidation stage.
The samples showed brittle tensile behavior. The MIN sample presented the lowest tensile resistance value between the samples, probably influenced by the lower thickness. Furthermore, the MIN sample presented average tensile elongation values lower than 350%, which is less than 50% of the minimum required for the tensile elongation value. Both samples presented similar behaviors between stress cracking and tensile, with low tensile elongation values and low stress crack resistance. Interestingly, although antioxidant consumption was still being noticed, changes in the tensile properties of the samples were already taking place.
Both samples presented stress crack resistance values lower than the minimum required value by the American standard, especially for the MIN2 sample, which presented the highest MFI value and the lowest stress crack resistance of the two samples. The samples presented similar behaviors between stress cracking and tensile, with low tensile elongation values and low-stress crack resistance.
The thermoanalytical evaluation was carried out by TG-DTA, and DSC was used to determine the thermal stability, melting point, and crystallization. Thermogravimetry under synthetic air purge gas showed that both samples displayed similar behaviors during the evaluation but with high loss of mass. The MIN sample’s DTG curve at the second mass variation presented an acute behavior and a wider curve than the MIN2 sample. The mass variations’ difference observed can be attributed to the different field exposures between the samples. The results showed that exothermic and endothermic events occurred with mass loss and did not show any combustion event in the evaluated DTA curves. The DSC analysis showed that the melting point and crystallization point were similar for the samples evaluated, and that the effects of geomembrane exposures did not change the behavior of the samples.
Thus, the analyses conducted on the geomembrane samples, especially for the tensile, stress cracking, and viscosity properties, demonstrate that changes occurred in the polymer’s structure after exposures in the field, indicating that the product had reached the end of its lifespan.
Author Contributions
Conceptualization, F.L.L., M.K. and C.A.V.; methodology, F.L.L., M.K., C.A.V. and É.F.d.S.T.; validation, F.L.L., M.K., C.A.V., É.F.d.S.T., J.L.d.S. and M.d.L.L.; formal analysis, F.L.L., M.K., C.A.V. and É.F.d.S.T.; investigation, F.L.L., M.K., C.A.V. and É.F.d.S.T.; resources, F.L.L., M.K. and J.L.d.S.; data curation, F.L.L., M.K., C.A.V. and É.F.d.S.T.; writing—original draft preparation, F.L.L., M.K., C.A.V. and É.F.d.S.T.; writing—review and editing, F.L.L., J.L.d.S. and M.d.L.L.; visualization, F.L.L., M.K., C.A.V., J.L.d.S. and M.d.L.L.; supervision, F.L.L. and J.L.d.S.; project administration, F.L.L. and J.L.d.S.; funding acquisition, F.L.L. and J.L.d.S. All authors have read and agreed to the published version of the manuscript.
Funding
This research received no external funding.
Data Availability Statement
Data sharing is not applicable.
Conflicts of Interest
The authors declare no conflict of interest.
References
- Rollin, A.R.; Rigo, J.M. Geomembranes-Identification and Performance Testing, 1st ed.; Chapman and Hall: London, UK, 1991. [Google Scholar]
- Palmeira, E.M. Geossintéticos em Geotecnia e Meio Ambiente, 1st ed.; Oficina de Textos: São Paulo, Brazil, 2018. [Google Scholar]
- Hsuan, Y.G. Data base of field incidents used to establish HDPE geomembrane stress crack resistance specifications. Geotext Geomembr. 2000, 18, 1–22. [Google Scholar] [CrossRef]
- Koerner, R.M. Designing with Geosynthetics, 5th ed.; Prentice Hall: New Jersey, NJ, USA, 2005. [Google Scholar]
- Rowe, R.K.; Sangam, H.P. Durability of HDPE geomembranes. Geotext Geomembr. 2002, 20, 77–95. [Google Scholar] [CrossRef]
- Koerner, G.R.; Hsuan, Y.G.; Koerner, R.M. The durability of geosynthetics. In Geosynthetics in Civil Engineering, 1st ed.; Sarsby, R.W., Ed.; Woodhead Published Limited: Cambridge, UK, 2007; pp. 36–65. [Google Scholar]
- Lodi, P.C.; Bueno, B.S.; Vilar, O.M. The effects of weathering exposure on the physical, mechanical, and thermal properties of high-density polyethylene and poly (vinyl chloride). Mater. Res. 2013, 16, 1331–1335. [Google Scholar] [CrossRef] [Green Version]
- Ewais, A.M.R.; Rowe, R.K.; Scheirs, J. Degradation behaviour of HDPE geomembranes with high and low initial high-pressure oxidative induction time. Geotext. Geomembr. 2014, 42, 111–126. [Google Scholar] [CrossRef]
- Kay, D.; Blond, E.; Mlynarek, J. Geosynthetics durability: A polymer chemistry issue. In Proceedings of the 57th Canadian Geotechnical Conference, Quebec, QC, Canada, 24–26 October 2004. [Google Scholar]
- Gulec, S.B.; Edil, T.B.; Benson, C.H. Effect of acidic mine drainage on the polymer properties of an HDPE geomembrane. Geosynth. Int. 2004, 11, 60–72. [Google Scholar] [CrossRef]
- Abdelaal, F.B.; Rowe, R.K.; Smith, M.; Brachman, R.W.I.; Thiel, R. Antioxidant depletion from HDPE and LLDPE geomembranes without HALS in an extremely low ph solution. In Proceedings of the 2nd Pan American conference on geosynthetics, Lima, Peru, 6–9 May 2012. [Google Scholar]
- Zhang, L.; Bouazza, A.; Rowe, R.K.; Scheirs, J. Effects of a very low pH Solution on the properties of an HDPE geomembrane. Geosynth. Int. 2018, 25, 118–131. [Google Scholar] [CrossRef]
- Lodi, P.C.; Bueno, B.S.; Hamada, J.; de Oliveira, E.L.; da Silva, G.H.R. Evaluation of mechanical and thermal properties after chemical degradation of PVC and HDPE geomembranes. Electron. J. Geotech. Eng. 2013, 18, 1227–1236. [Google Scholar]
- Rowe, R.K.; Ewais, A.M.R. Ageing of exposed geomembranes at locations with different climatological conditions. Can. Geotech. J. 2015, 52, 326–343. [Google Scholar] [CrossRef] [Green Version]
- Santos, L.S.; Gardoni, M.G.A. Evaluation of geomembranes degradation aged in the laboratory and exposure to weathering. In Proceedings of the 3rd Pan American Conference on Geosynthetics, Miami, ME, USA, 10–13 April 2016. [Google Scholar]
- Ferreira, L.C.; Reis, E.C.; Vieira, N.M.R. Caracterização do Efluente da Etapa de Filtragem de um Concentrado de Minério de Ferro. In Proceedings of the 70th Congresso Anual da ABM (Associação Brasileira de Metalurgia, Materiais e Mineração), Rio de Janeiro, Brazil, 17–21 August 2015. [Google Scholar]
- Sosa, E.R. Caracterização e Aproveitamento dos Rejeitos Oriundos de Processos Hidrometalúrgicos do Níquel e Cobalto com um Enfoque Geoambiental. Ph.D. Thesis, University of Brasília, Brasília, Brazil, 2016. [Google Scholar]
- American Society for Testing and Materials (ASTM). ASTM D5199 Standard Test Methods for Measuring the Nominal Thickness of Geosynthetics; ASTM: West Conshohocken, PA, USA, 2019; p. 4. [Google Scholar]
- American Society for Testing and Materials (ASTM). ASTM D792 Standard Test Methods for Density and Specific Gravity (Relative Density) of Plastics by Displacement; ASTM: West Conshohocken, PA, USA, 2020; p. 6. [Google Scholar]
- American Society for Testing and Materials (ASTM). ASTM D4218 Standard Test Method for Determination of Carbon Black Content in Polyethylene Compounds by the Muffle-Furnace Technique; ASTM: West Conshohocken, PA, USA, 2020; p. 4. [Google Scholar]
- American Society for Testing and Materials (ASTM). ASTM D1238 Standard Test Methods for Melt Flow Rates of Thermoplastics by Extrusion Plastometer; ASTM: West Conshohocken, PA, USA, 2020; p. 17. [Google Scholar]
- American Society for Testing and Materials (ASTM). ASTM D3895 Standard Test Method for Oxidative-Induction Time of Polyolefins by Differential Scanning Calorimetry; ASTM: West Conshohocken, PA, USA, 2019; p. 7. [Google Scholar]
- American Society for Testing and Materials (ASTM). ASTM D5885 Standard Test Method for Oxidative Induction Time of Polyolefin Geosynthetics by High-Pressure Differential Scanning Calorimetry; ASTM: West Conshohocken, PA, USA, 2020; p. 7. [Google Scholar]
- American Society for Testing and Materials (ASTM). ASTM D6693 Standard Test Methods for Determining Tensile Properties of Nonreinforced Polyethylene and Nonreinforced Flexible Polypropylene Geomembranes; ASTM: West Conshohocken, PA, USA, 2020; p. 6. [Google Scholar]
- American Society for Testing and Materials (ASTM). ASTM D5397 Standard Test Method for Evaluation of Stress Crack Resistance of Polyolefin Geomembranes Using Notched Constant Tensile Load Test; ASTM: West Conshohocken, PA, USA, 2020; p. 7. [Google Scholar]
- Geosynthetic Research Institute (GRI). GRI-GM13 Test Methods, Test Properties and Testing Frequency for High Density Polyethylene (HDPE) Smooth and Textured Geomembranes; GRI: Folsom, PA, USA, 2021; p. 11. [Google Scholar]
- Islam, M.Z.; Rowe, R.K. Effect of HDPE geomembrane thickness on the depletion of antioxidants. In Proceedings of the 60th Canadian Geotechnical Conference and the 8th Joint CGS/IAH-CNC Groundwater Conference, Ottawa, ON, Canada, 21–24 October 2007. [Google Scholar]
- Scheirs, J. A Guide to Polymeric Geomembranes: A Practical Approach, 1st ed.; Wiley: London, UK, 2009. [Google Scholar]
- Hsuan, Y.G.; Schroeder, H.F.; Rowe, K.; Muller, W.; Greenwood, J.; Cazzuffi, D.; Koerner, R.M. Long-term performance and lifetime prediction of geosynthetics. In Proceedings of the 4th European Geosynthetics Conference, Edinburgh, UK, 7–10 September 2008. [Google Scholar]
- Muñoz Gómez, M. Geomembrane stress cracking resistance using various polymers. In Proceedings of the 3rd Pan American Conference on Geosynthetics, Miami, ME, USA, 10–13 April 2016. [Google Scholar]
- Abdelaal, F.B.; Morsy, M.S.; Rowe, R.K. Long-term performance of a HDPE geomembrane stabilized with HALS in chlorinated water. Geotext. Geomembr. 2019, 47, 815–830. [Google Scholar] [CrossRef]
- Lavoie, F.L.; Valentin, C.A.; Kobelnik, M.; da Silva, J.L.; Lopes, M.L. Study of an exhumed HDPE geomembrane used in an industrial water pond: Physical and thermoanalytical characterisations. Results Mater. 2020, 8, 100131. [Google Scholar] [CrossRef]
- Telles, R.W.; Lubowitz, H.R.; Unger, S.L. Assessment of Environmental Stress Corrosion of Polyethylene Liners in Landfills and Impoundments, 1st ed.; U.S. EPA: Cincinnati, OH, USA, 1984.
- Lavoie, F.L.; Kobelnik, M.; Valentin, C.A.; da Silva, J.L. Durability of HDPE geomembranes: An overview. Quim. Nova 2020, 43, 656–667. [Google Scholar] [CrossRef]
| Publisher’s Note: MDPI stays neutral with regard to jurisdictional claims in published maps and institutional affiliations. |
© 2021 by the authors. Licensee MDPI, Basel, Switzerland. This article is an open access article distributed under the terms and conditions of the Creative Commons Attribution (CC BY) license (https://creativecommons.org/licenses/by/4.0/).

 ,
, 


