Article

A Multi-Scale Numerical Simulation on Thermal Conductivity of Bio-Based Construction Materials

1
LMDC (Laboratoire Matériaux et Durabilité des Constructions), INSA, UPS, Université de Toulouse, 135 Avenue de Rangueil, 31077 Toulouse, France
2
UMR CNRS, IRCER, Université de Limoges, 12 rue Atlantis, 87068 Limoges, France
*
Author to whom correspondence should be addressed.
Constr. Mater. 2022, 2(3), 148-165; https://doi.org/10.3390/constrmater2030011
Submission received: 31 May 2022 / Revised: 21 June 2022 / Accepted: 29 June 2022 / Published: 4 July 2022
(This article belongs to the Special Issue Binders and Concretes for Low-Carbon Construction)

Abstract

:
Amid increasing concern about carbon emissions and ENERGY consumption in the building industry, bio-based construction materials are one of the solutions, especially considering their excellent thermal insulation. This study aims to develop a multi-scale numerical model to analyze the effect of microstructure on the thermal conductivity of a bio-based construction material. To achieve this, the size, shape, orientation, porosity, and water saturation of the bio-aggregate were considered in this study. The results show that the thermal conductivity of the bio-based material increases significantly and nonlinearly with water saturation, in contrast to the parallel thermal conductivity of the transversely isotropic bio-aggregate, which increases linearly. The thermal conductivity of the bio-based material shows an anisotropy in different directions and it obtains a maximum at water saturation of 0.4. Analysis of inclusions with different shapes shows that the thermal conductivity in the compaction direction is almost independent of the shape, but not in the direction perpendicular to the compaction. The finite element results show that the heat flow tends to transfer along the bio-aggregate rather than across it. These findings help to better understand the effect of microstructure on thermal conductivity and then promote the application of bio-based concrete as an insulation material in buildings.

1. Introduction

In recent years, there has been an increasing discussion on carbon emission, energy crisis, environmental protection, and sustainability. The building industry plays a vital role in these areas as global CO2 emissions from building increased by 50% from 1990 to 2019 [1]. Moreover, in developing countries, buildings account for about 15–25% of total energy consumption, while in developed countries it is 30–40% [2]. Further investigations show that space heating was the largest residential energy demand in Europe and Eurasia, exceeding 50% in 2019 [1].
The use of bio-based construction materials is one of the solutions to mitigate carbon emissions and energy consumption. This is due to the fact that bio-based construction materials have advantages over traditional concrete in these issues. On the one hand, plant aggregates have lower embodied carbon, which means lower CO2 emissions are associated with the processes of construction and materials throughout their whole lifecycle [3]. Moreover, they promote carbon sink in building materials since plants store considerable amounts of carbon in a relatively small volume [1,4]. On the other hand, the excellent performance of bio-based materials in thermal insulation can save the energy consumption of space heating as mentioned above. Especially considering the growing global interest in net-zero energy buildings (NZEBs), more and more countries have set their own goal for NZEBs [5,6,7]. Obviously, the study of thermal conductivity helps to improve the thermal performance of bio-based materials, which thereby promotes environmental protection and reduces energy consumption.
Several experimental studies [8,9,10] have shown the low thermal conductivity of bio-based concrete. This is due to the high intra-particle porosity in plant particles and macro porosity in bio-based materials [11,12]. Moreover, bio-based materials are used in buildings because of their role as a humidity regulator, absorbing moisture in high-humidity environments and releasing it in the opposite case [13,14,15]. Many studies [15,16,17,18,19,20] have shown that the effect of moisture on the thermal conductivity of bio-based materials cannot be ignored because of their strong water absorption capacity. The thermal conductivity of dry plant particles (e.g., hemp: axial: 0.122 W/mK, transverse: 0.08 W/Mk [21]) is much lower than that of water (0.598 W/mK [22]). It is significant to consider the effect of moisture in the modeling of bio-based materials. In addition, compaction in the casting of bio-based materials affects the orientation of the plant fibers, and the plant fibers tend to be distributed in a plane perpendicular to the direction of compaction [23,24]. In this case, the fact that the thermal conductivity of bio-based materials depends on the orientation has been confirmed in research [21,23,25].
Numerical simulation has been widely used in fiber-reinforced construction materials, but most of them are related to steel fiber-reinforced concrete. For example, Rezakhani et al. [26] investigated the effect of size, shape, and strength of steel fiber on the quasi-static properties of concrete. Naderi and Zhang [27] studied the compression and tensile fracture behavior of steel fiber-reinforced concrete by a 3D fine-scale modeling approach. Liang and Wu [28] developed a model for the thermal conductivity of steel fiber concrete and then investigated these parameters: model thickness, steel fiber diameter, and volume fraction (0.5%, 1%, and 2%). However, these methods cannot be completely used for modeling bio-based building materials since there are more complex microstructures in bio-based materials compared to steel fiber concrete. Some plant fibers such as hemp [29] and wheat straw [30] have a transversely isotropic structure compared to the isotropic steel fiber. The volume fraction of plant fiber in concrete is much higher than that of steel fiber, e.g., 55% in [12]. In addition, the porous structure leads to high water absorption of plant fiber [18,31], which affects the material properties, especially for thermal conductivity [16,17].
This paper aims to develop a multi-scale numerical model to investigate the effect of the microstructure of bio-based building materials on thermal conductivity. In this modeling, the bio-based material is considered to consist of three components, each of which can be subdivided into more components at the microscopic scale. The details of each component are as follows.
  • Binder: binder solid and micropores;
  • Bio-aggregates: intra-particle pores (air and water) embedded in a solid matrix;
  • Macropores.
This model considers the size, shape, orientation, porosity, and water saturation of plant fibers. From the microscopic to the macroscopic scale, the microstructural characteristics of each component are linked to the macroscopic property by a successive numerical homogenization. This link can promote the application of bio-based concrete as an insulation material in buildings. In addition, the study of various porosities and shapes of bio-aggregate helps the model to be applied to a wider range of bio-based construction materials.

2. Materials and Methods

2.1. Materials

The material used in this model is bio-based construction material. Initially, hemp was selected as an example, which is one of the most widely studied plant fibers in bio-based construction materials. Then, the approach explores the application of this model to other types of bio-based materials by varying the shape and porosity of the bio-aggregate in the model.
Hemp is a porous transversely isotropic material from the microstructure due to the arrangement of the pores, as shown in Figure 1 from the literature [12,32]. It is essential to investigate the internal structure of hemp before multi-scale modeling. The cross-section in Figure 1(A-1) illustrates two diameters of the conduit: about 50 μm for the vessel and about 20 μm for the tracheid [32], while the longitudinal section (see Figure 1(A-2,B-2)) shows the elongated tubular structure. Additionally, Figure 1(B-1) clearly presents the nearly circular cross-section of the pores. Some of the physical and thermal properties of dry hemp shiv are shown in Table 1. In Table 1, the first value in multiple options is selected for the model. Aggregates used by different researchers may vary because of their source and manufacturing process, especially in terms of length and width. For specific heat capacity and thermal conductivity, the differences in values from various literature (Table 1) are slight, so the choices have little effect on the results. For length and width, the study of shape in Section 3.3.4 will compensate for this selection preference.
Binders involving plant fibers are usually lime-based or metakaolin-based binders rather than cement. The former comes from high-temperature calcined limestone or kaolinite. At the microscopic scale, lime-based binder consists of binder solids and fine pores with most pore sizes distributed at 1 µm [38]. The physical and thermal properties are shown in Table 2.

2.2. Methods

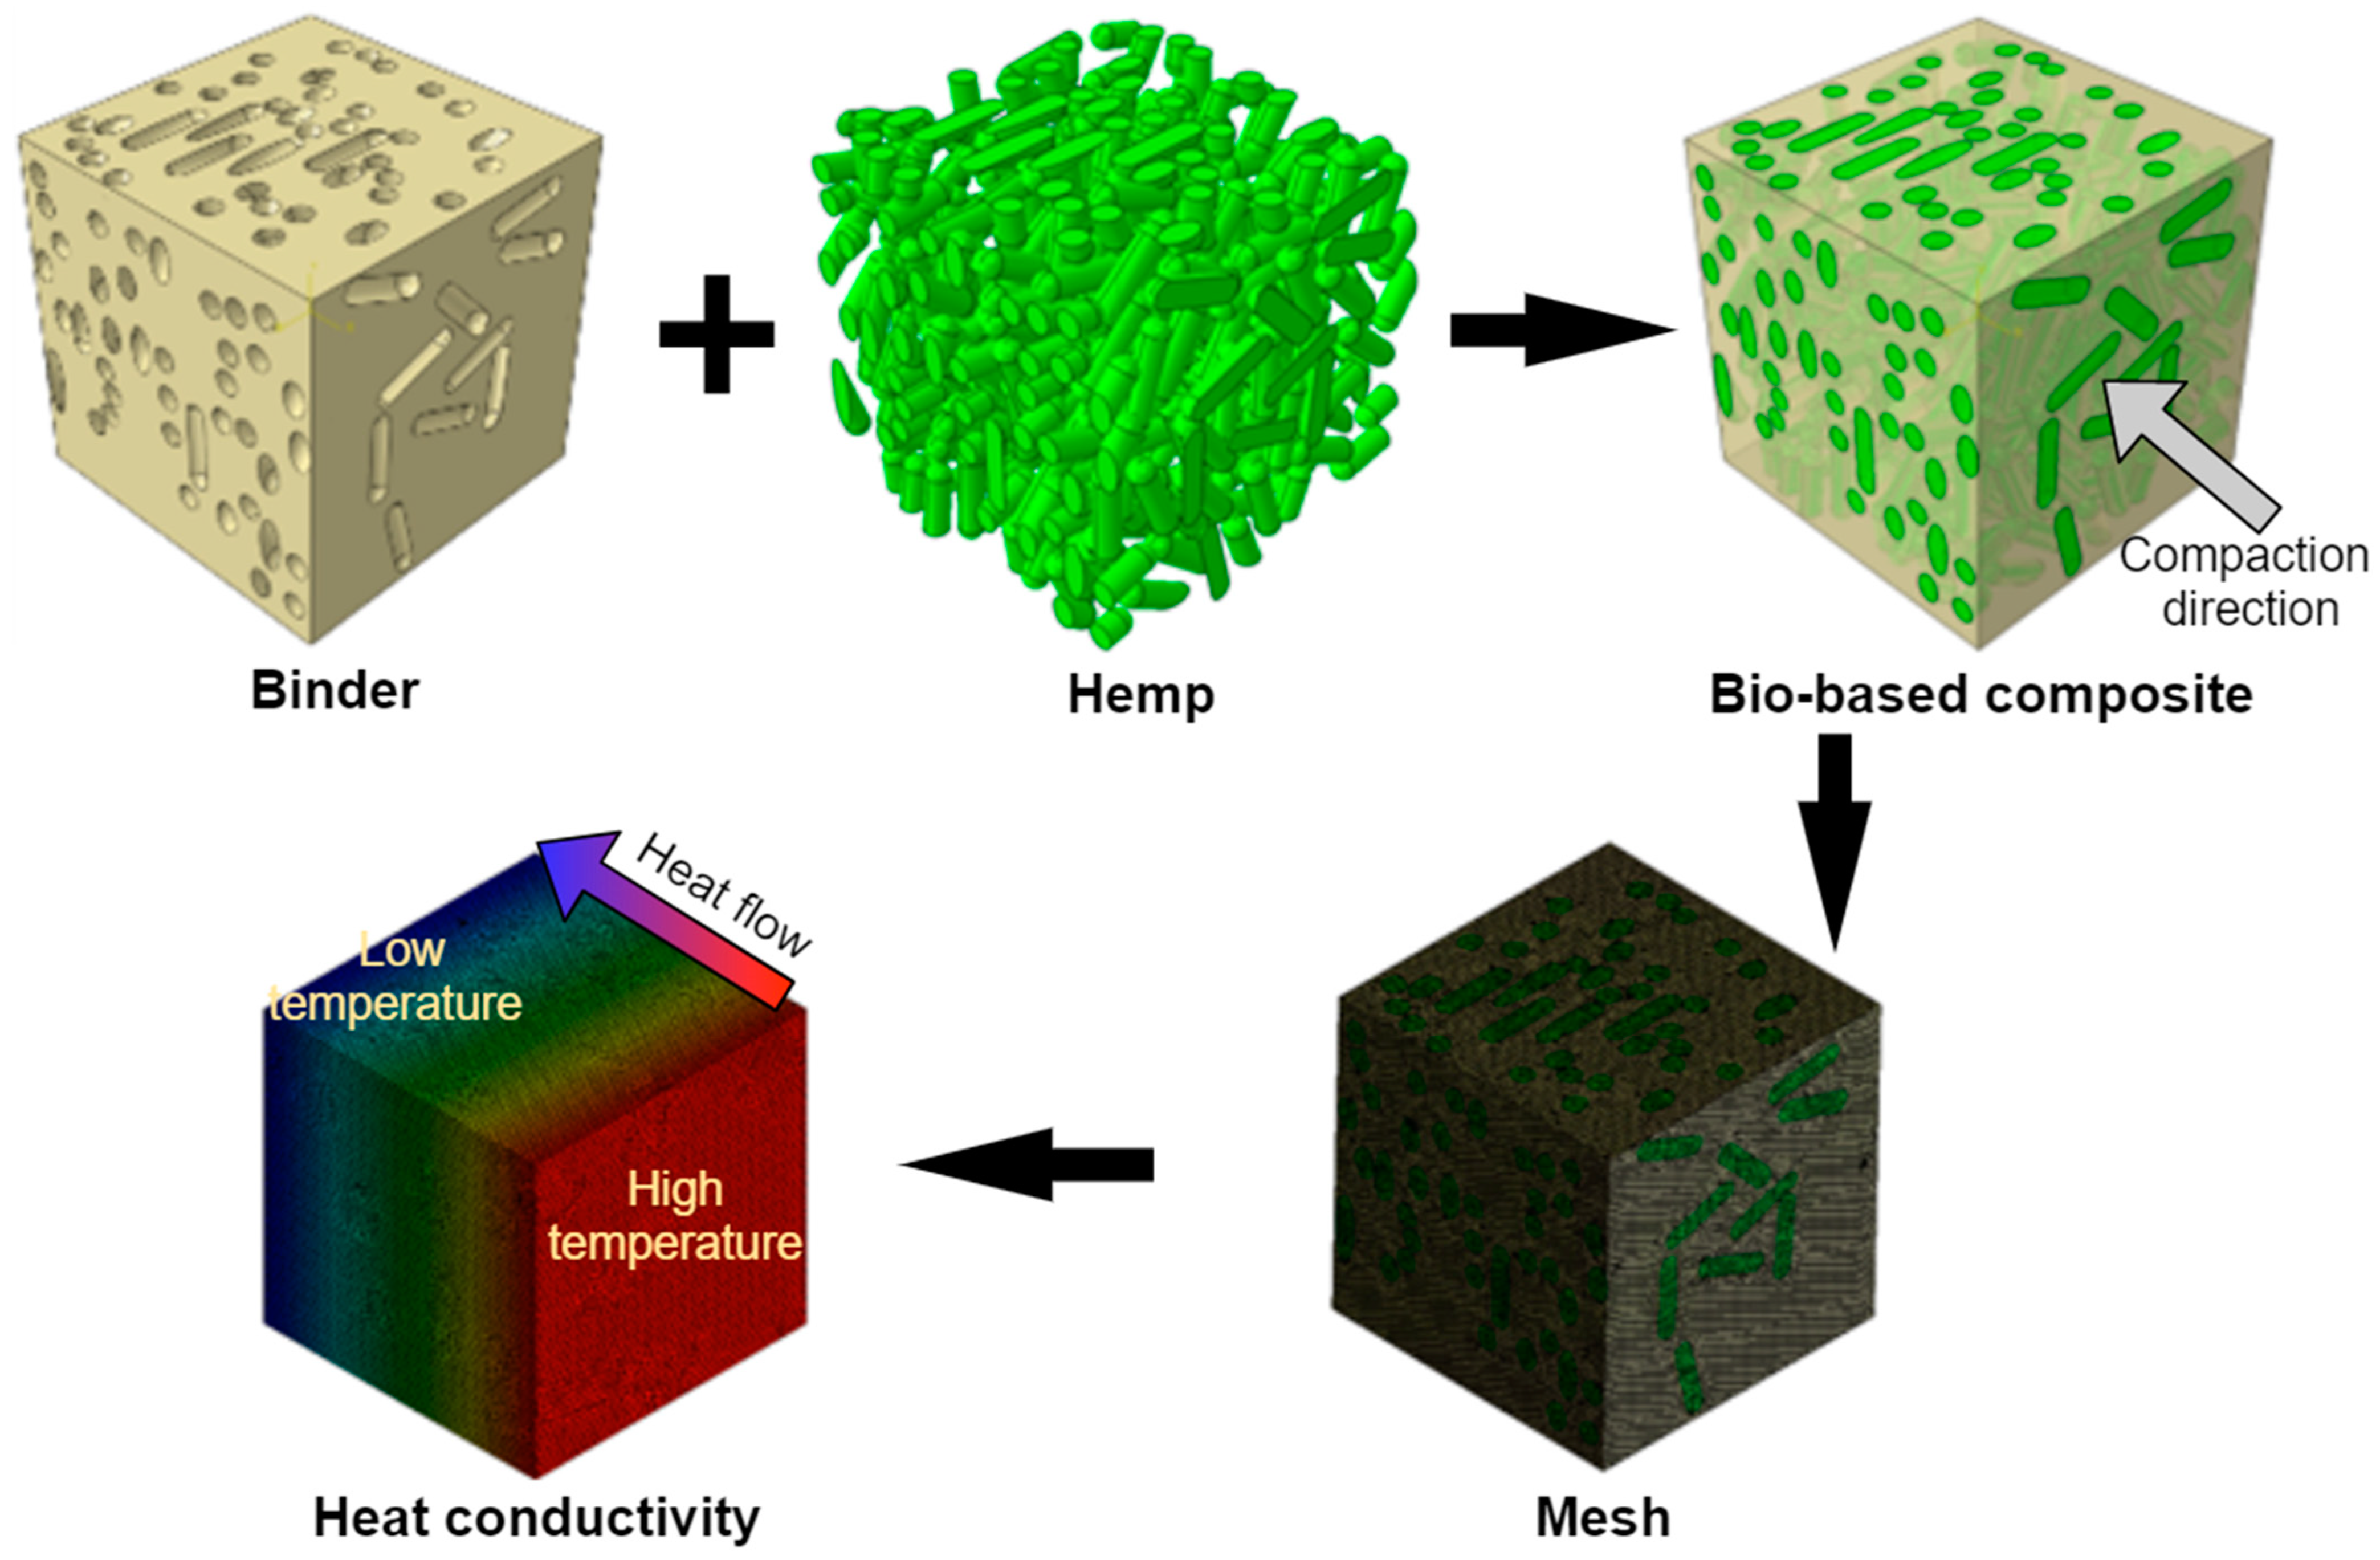
The microstructure of bio-based material and the dimensions of each part were investigated in the previous section and can be represented in Figure 2. At the macroscopic level (100–102 mm), bio-based building materials include a binder, bio-aggregates (Length: 4 mm, width: 1 mm), and macropores (1–3 mm). Further, the binder on a scale of 10−2–100 μm includes micropores (0.02–4 μm) and binder solid, while the bio-aggregate on a scale of 10–102 μm includes intra-particle pores (20–50 μm) and bio-aggregate solid. In a humid environment, the porous structure of bio-aggregate absorbs moisture, which is distributed along the elongated pores, so water is assumed to be distributed in the air matrix as a cylinder in this model on a scale of 100–10 μm. Thus, in the present multi-scale model, binder, bio-aggregate, and bio-based composite are sequentially homogenized by numerical methods. Among them, bio-aggregate is homogenized in a humid environment involving intra-particle pores and moisture. The details of each homogenization step are described in the next section.

2.2.1. Modeling of Binder

Scale 1 (10−2–100 μm): the binder.
The binder is considered to consist of binder solids and micropores on scale 1 (10−2–100 μm), as shown in Figure 2. The micropores are considered to be randomly distributed in the solid. Micropores, with pore sizes in the range of 0.02–4 μm and mostly 1 μm [38], are considered to be randomly distributed in the solid. Note that there is only one homogenization step here. The model of the porous binder based on these data is shown in Figure 3. The pores were embedded in the binder solid to form a two-phase material, and then the mesh was applied to the whole. The nodes are shared at the interface of the two phases.

2.2.2. Two-Scale Modeling of Individual Hemp Shiv

Scale 2 (100–10 μm): pore and moisture.
The porous structure of the hemp shown in Figure 1 facilitates the absorption of moisture. Moreover, the elongated cells allow the water to be distributed in a directional arrangement. Therefore, on scale 2 (Figure 2) of the numerical model, the moisture is assumed to be a cylinder embedded in the air matrix as shown in Figure 4. Homogenized materials considering pores and moisture can be obtained through the homogenization in this step and used for modeling on the next scale. It is noted that water saturation (WS), i.e., the volume ratio of water to pore, is used to quantify the moisture value of the hemp.
Scale 3 (10–102 μm): the bio-aggregates.
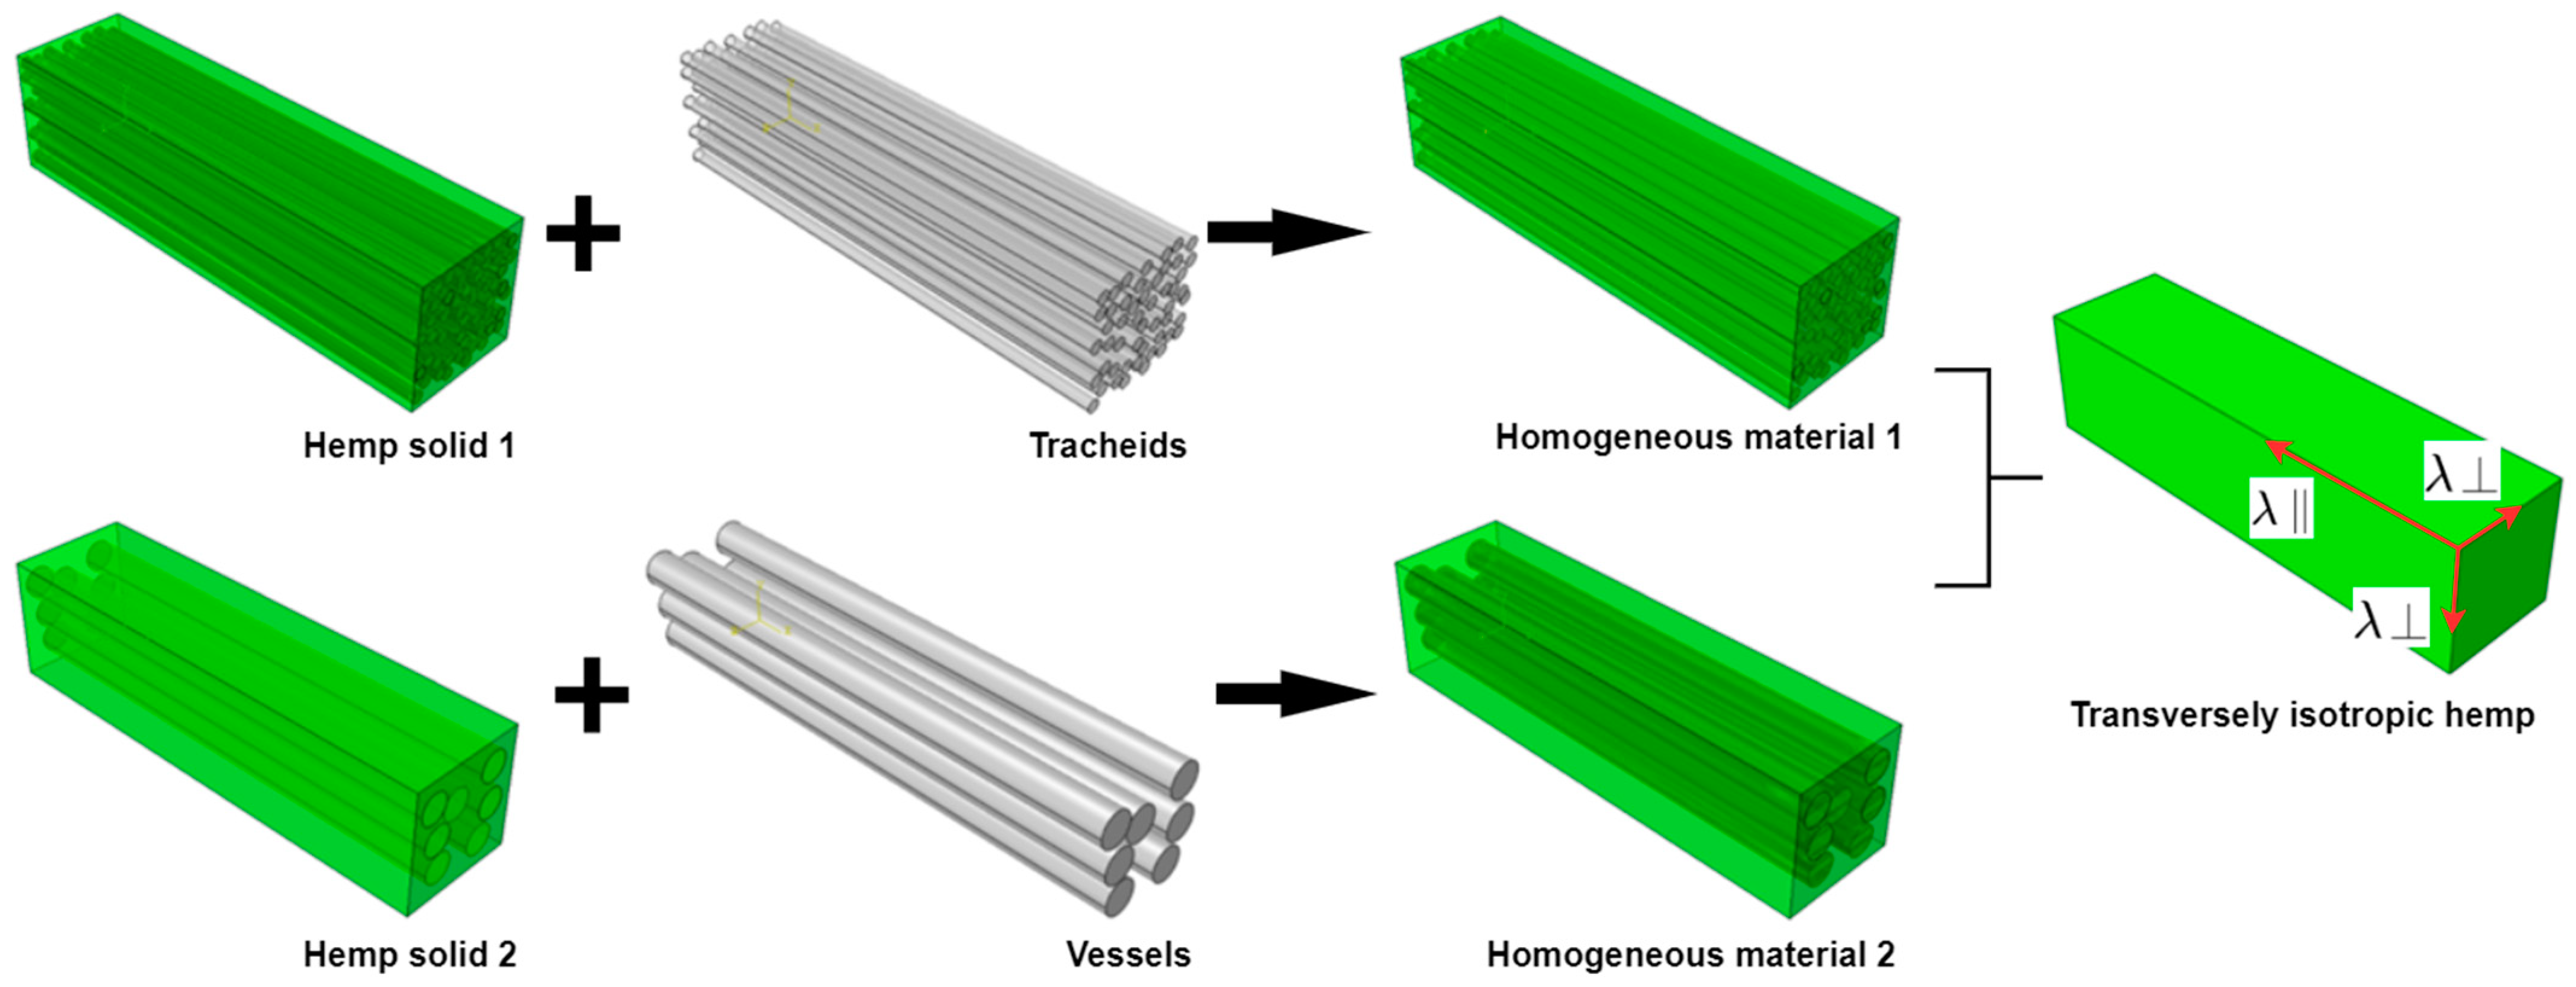
As shown in Figure 2, the homogenization at this scale aims to combine the homogenized material (moisture and voids) from the previous step with the hemp solid. Figure 1 shows that there are two types of pores inside the hemp: vessel (50 μm) and tracheid (20 μm). Therefore, the finite element models of tracheid and vessel were built according to their corresponding dimensions in Figure 5. It should be noted that the pores were generated randomly in the cross-section.

2.2.3. Modeling of Bio-Based Construction Materials

Scale 4 (100–102 mm): the bio-based composite.
The bio-based composite on scale 4 in Figure 2 is macroscopically composed of three components: binder, hemp, and macropores. Macropores in the modeling are considered randomly distributed in the homogenized binder (binder solid and micropores). Therefore, prior to considering the hemp, the numerical homogenization was carried out between the binder and the macropores by a similar method as in Figure 3. After obtaining the homogenized binder, the final model containing the hemp is shown in Figure 6. The model was generated in the commercial software Digimat and then solved by Abaqus. As shown in Figure 6, the heat flow is transferred from the high-temperature side to the low-temperature side. In this process, the effective thermal conductivity of the composite can be calculated by applying the classical Fourier’s law [42,43]. Note that the length and width of the hemp are 4 and 1 mm, respectively, according to Table 1. It is also worth noting that plant fibers in bio-based building materials usually tend to be distributed perpendicular to the compaction direction [24,44]. Therefore, in this model, the hemp is randomly distributed in the plane perpendicular to the compaction direction. For hemp construction material, the volume fraction of each component is essential for the modeling. This can be found in the literature [12] and listed in Table 3.
To extend the present model from hemp to more types of bio-aggregates, three shapes of inclusions are compared in this numerical model. Their size information and particle distribution are shown in Figure 7.

3. Results and Discussion

3.1. Effective Thermal Conductivity of Binder

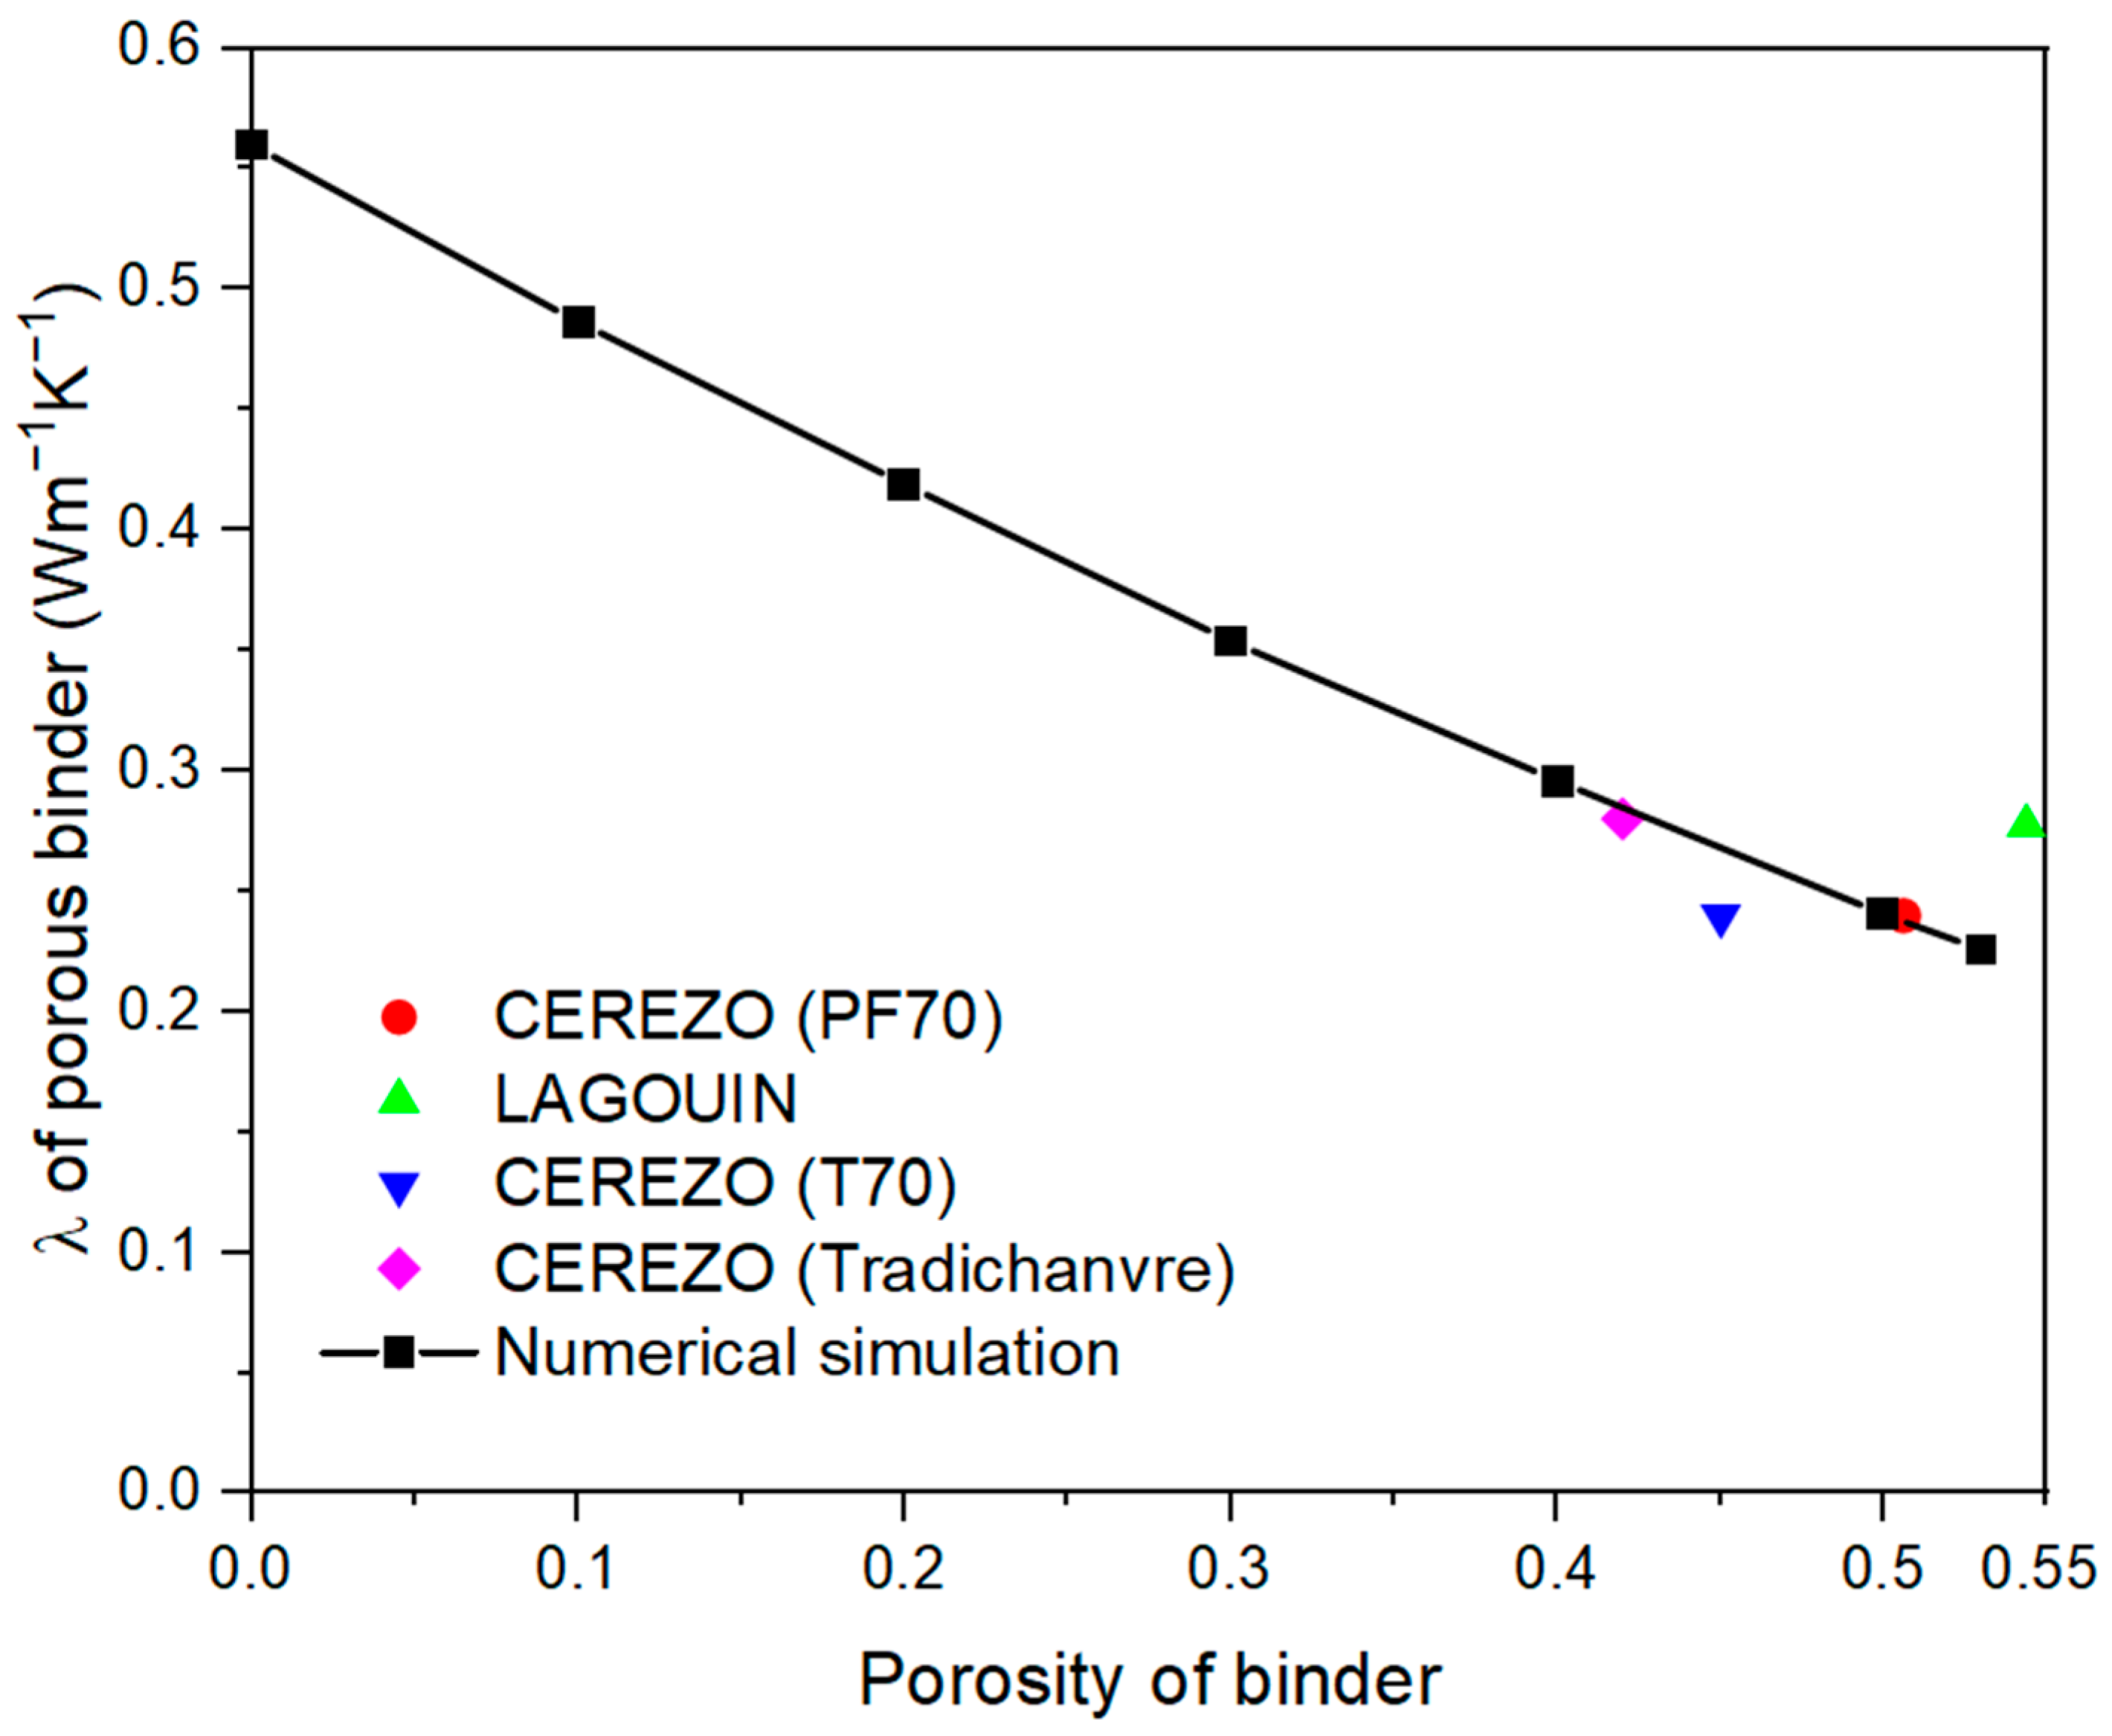
The study of the effective thermal conductivity for a porous binder involves only one factor, i.e., the volume fraction of the micropores in Figure 2. The effective thermal conductivity of porous binder is presented in Figure 8. As the porosity increases, the thermal conductivity of the binder decreases. The results of the numerical simulations in this paper agree well with the experimental data from the literature [21,38,40].

3.2. Effective Thermal Conductivity of Individual Hemp Shiv

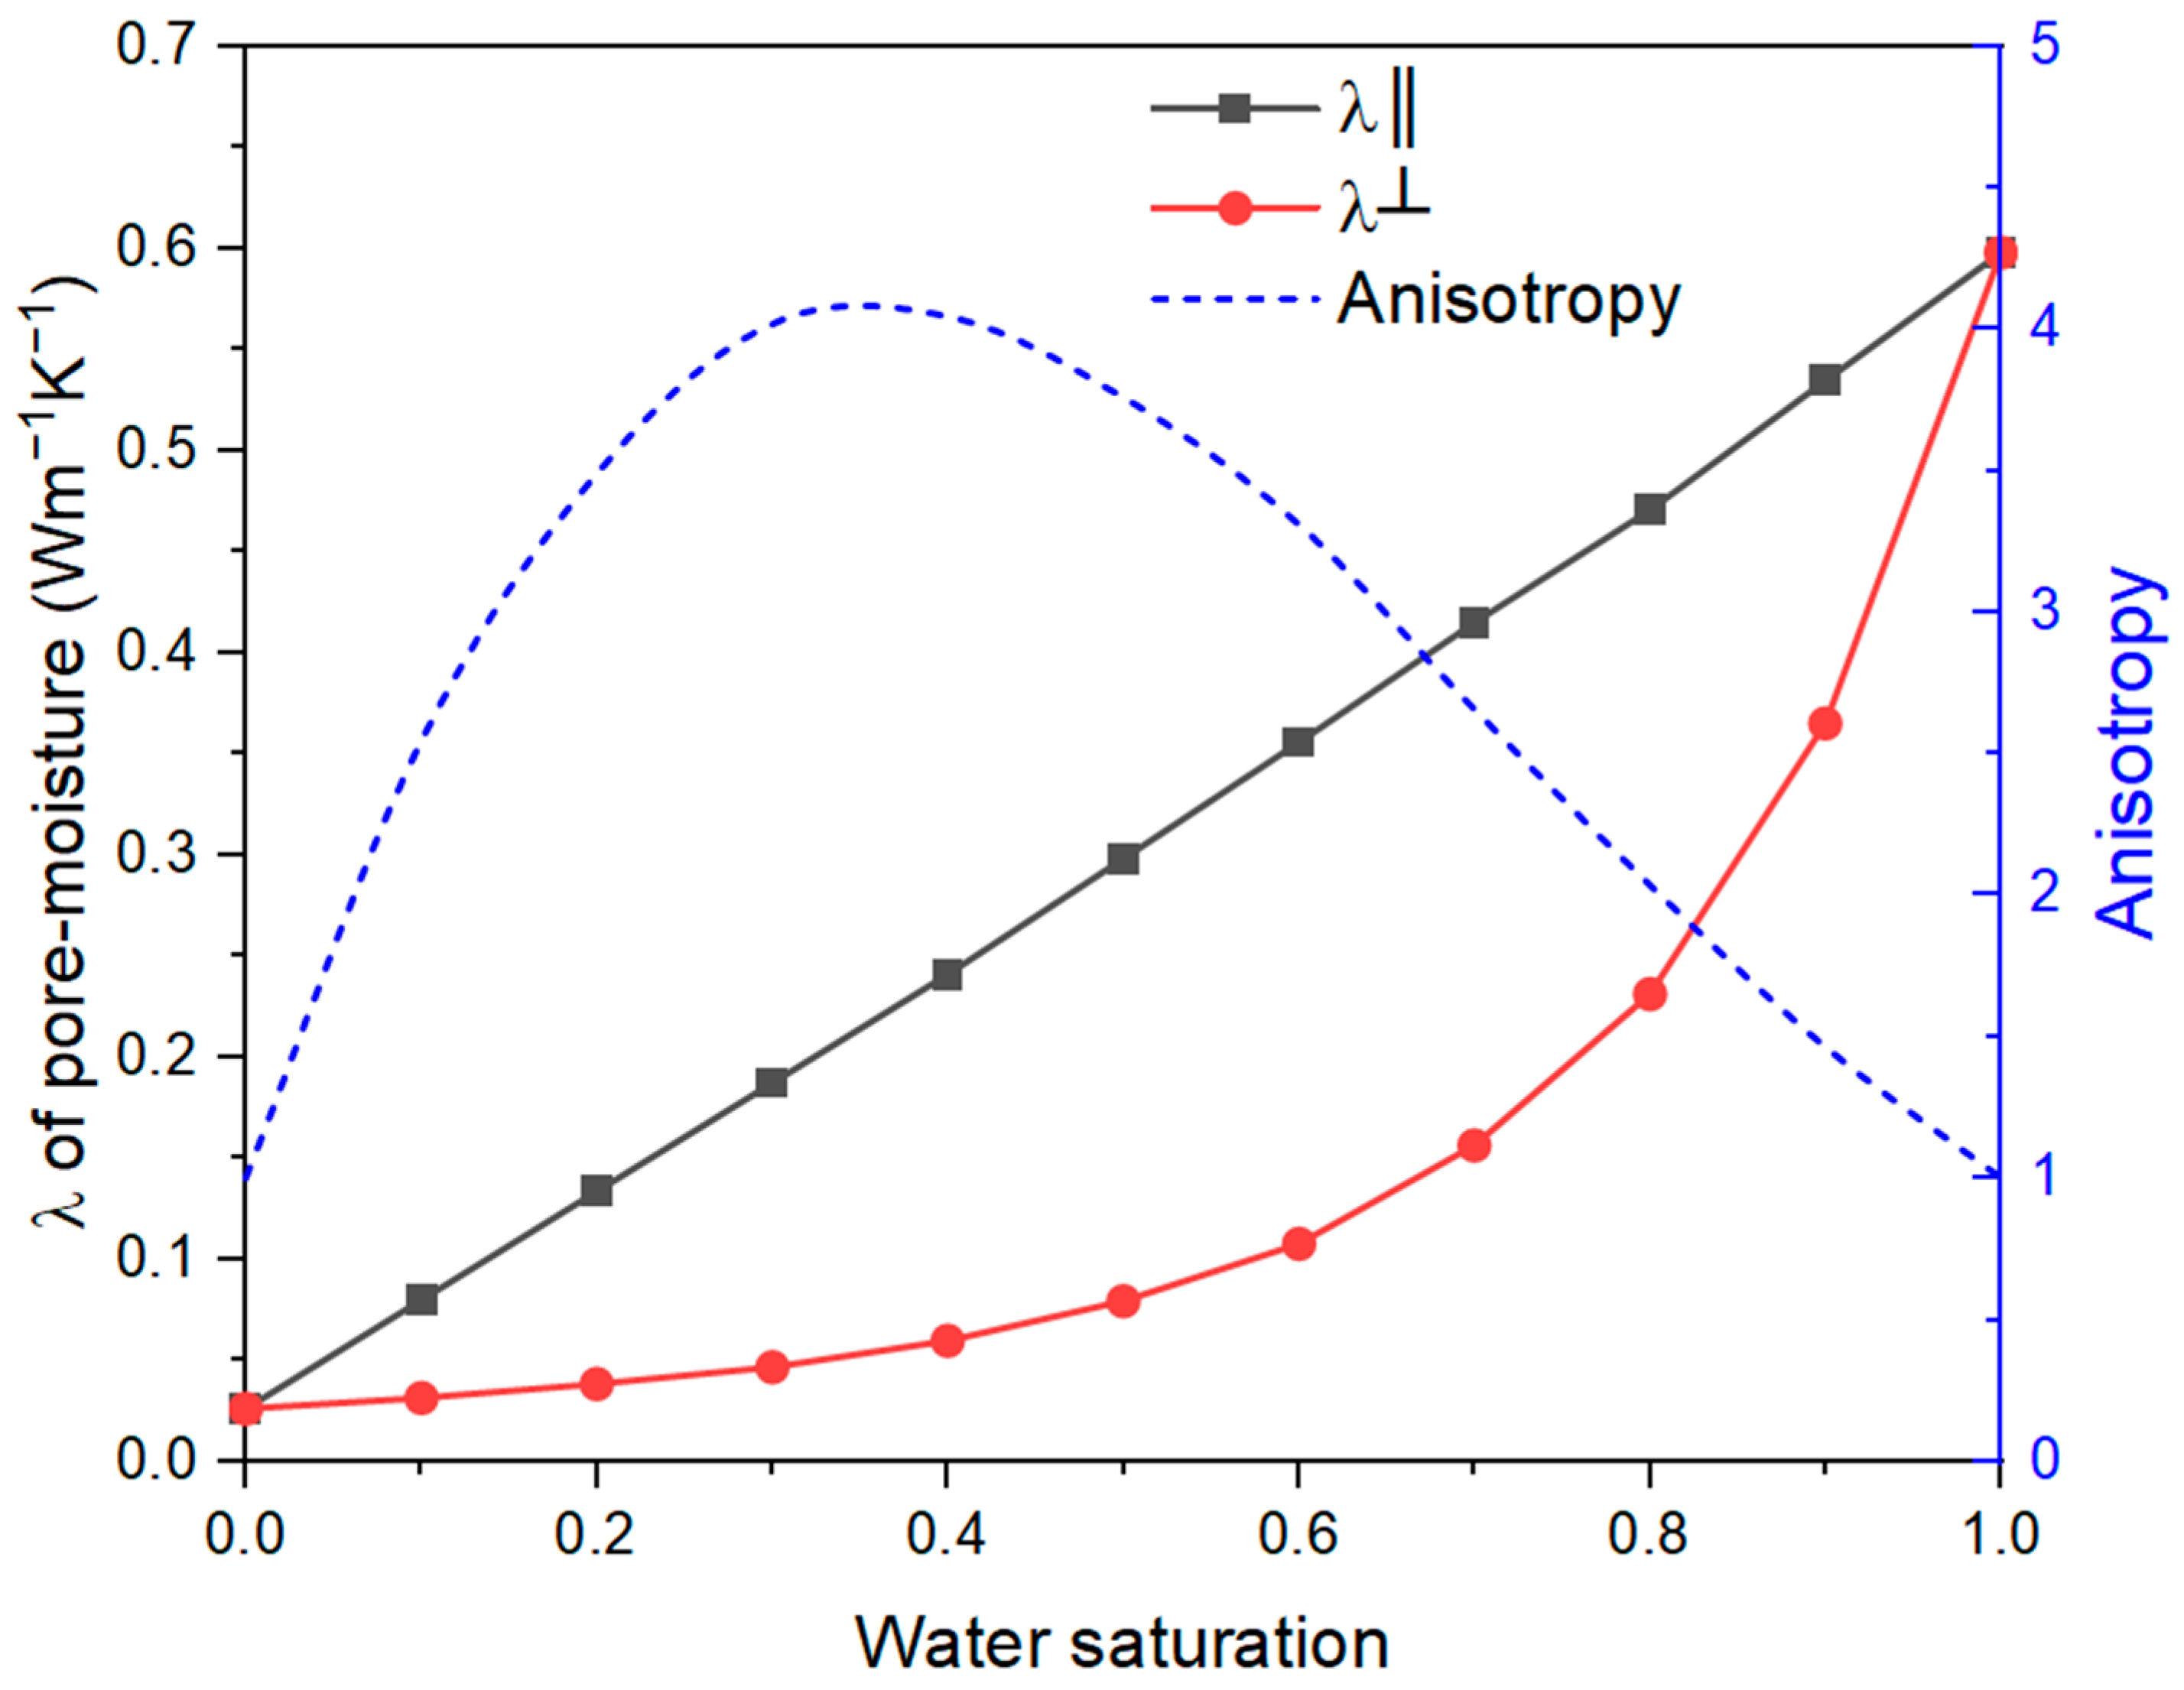
Figure 9 shows the thermal conductivity with water saturation in different directions on scale 2. Note that λ║ and λ┴ in Figure 9 denote the axial direction and the direction perpendicular to the axial direction, respectively. The axial direction is the revolution axis of the inclusion. The results in Figure 9 show that λ║ increases almost linearly with water saturation while λ┴ increases at an increasing rate. This difference makes the anisotropy increase initially, then decrease with water saturation. It takes a maximum of about 0.4. From this conclusion, it is known that water saturation affects the anisotropy of the pore-moisture, which in turn affects the anisotropy of the hemp and the bio-based composite. First, the orientation of the moisture illustrated in Figure 4 leads to differences in the thermal conductivity of the pore-moisture in different directions, i.e., anisotropy. Then, the orientation of the anisotropic pore-moisture in the hemp solid leads to the anisotropy of the hemp shiv, as shown in Figure 5. Finally, the anisotropic hemp is distributed in a specific direction in the composite, which results in the anisotropy of the composite.
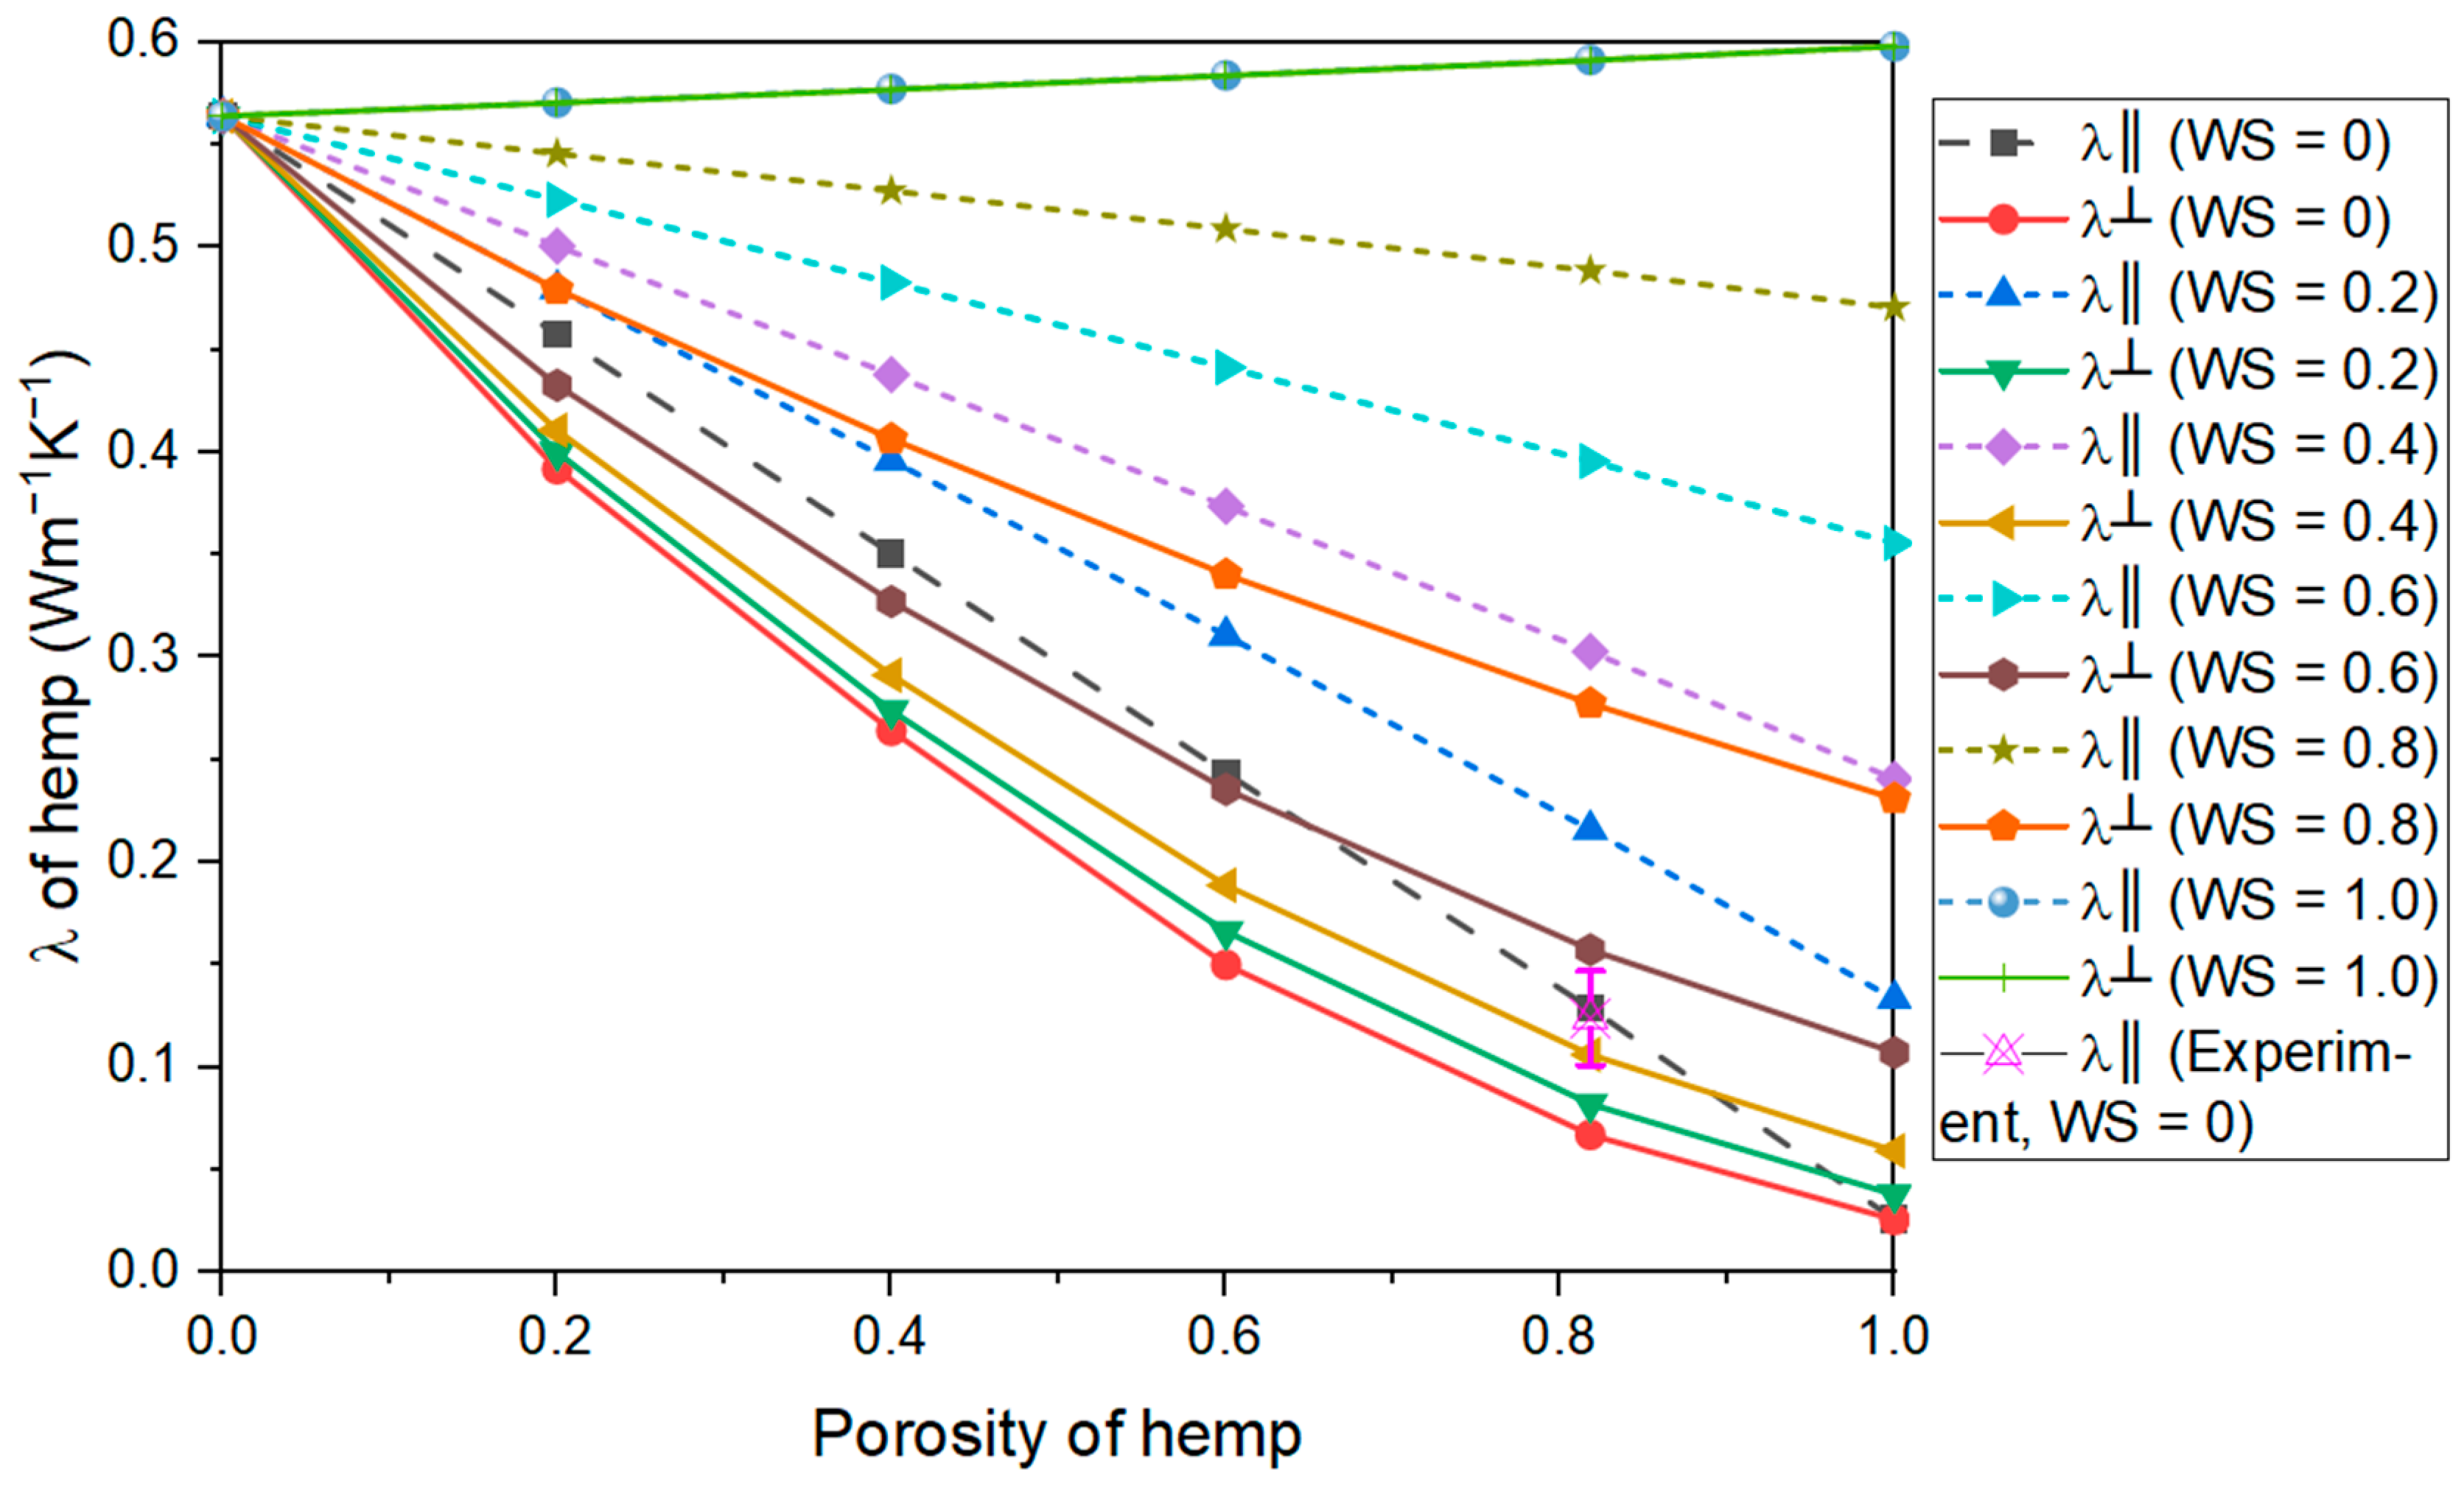
After obtaining the properties of pore-moisture in the previous step, the hemp solid is homogenized with pore-moisture. The porosity of hemp varies with the source and processing method. Moreover, the study of porosity can also help to extend the present model to more plant fibers. So here the thermal conductivity of hemp with different porosity is studied as shown in Figure 10. As porosity increases, only at WS = 1.0, the thermal conductivity of hemp increases in 2 directions. This can be explained by the fact that the thermal conductivity of hemp solid is greater than that of pore-moisture when WS ≤ 0.8. Comparing λ║ and λ┴ in Figure 10 at the same WS, when WS = 1.0, λ║ = λ┴ because the isotropic pore-moisture is embedded in the isotropic hemp solid. When WS ≤ 0.8, λ║ > λ┴ owing to the anisotropy of pore-moisture, which can be seen in Figure 9. Another finding from Figure 10 is that water saturation significantly increases the transverse thermal conductivity of hemp when WS > 0.6. Finally, the experimental data on dry hemp from the literature [33] agrees well with the numerical simulation.
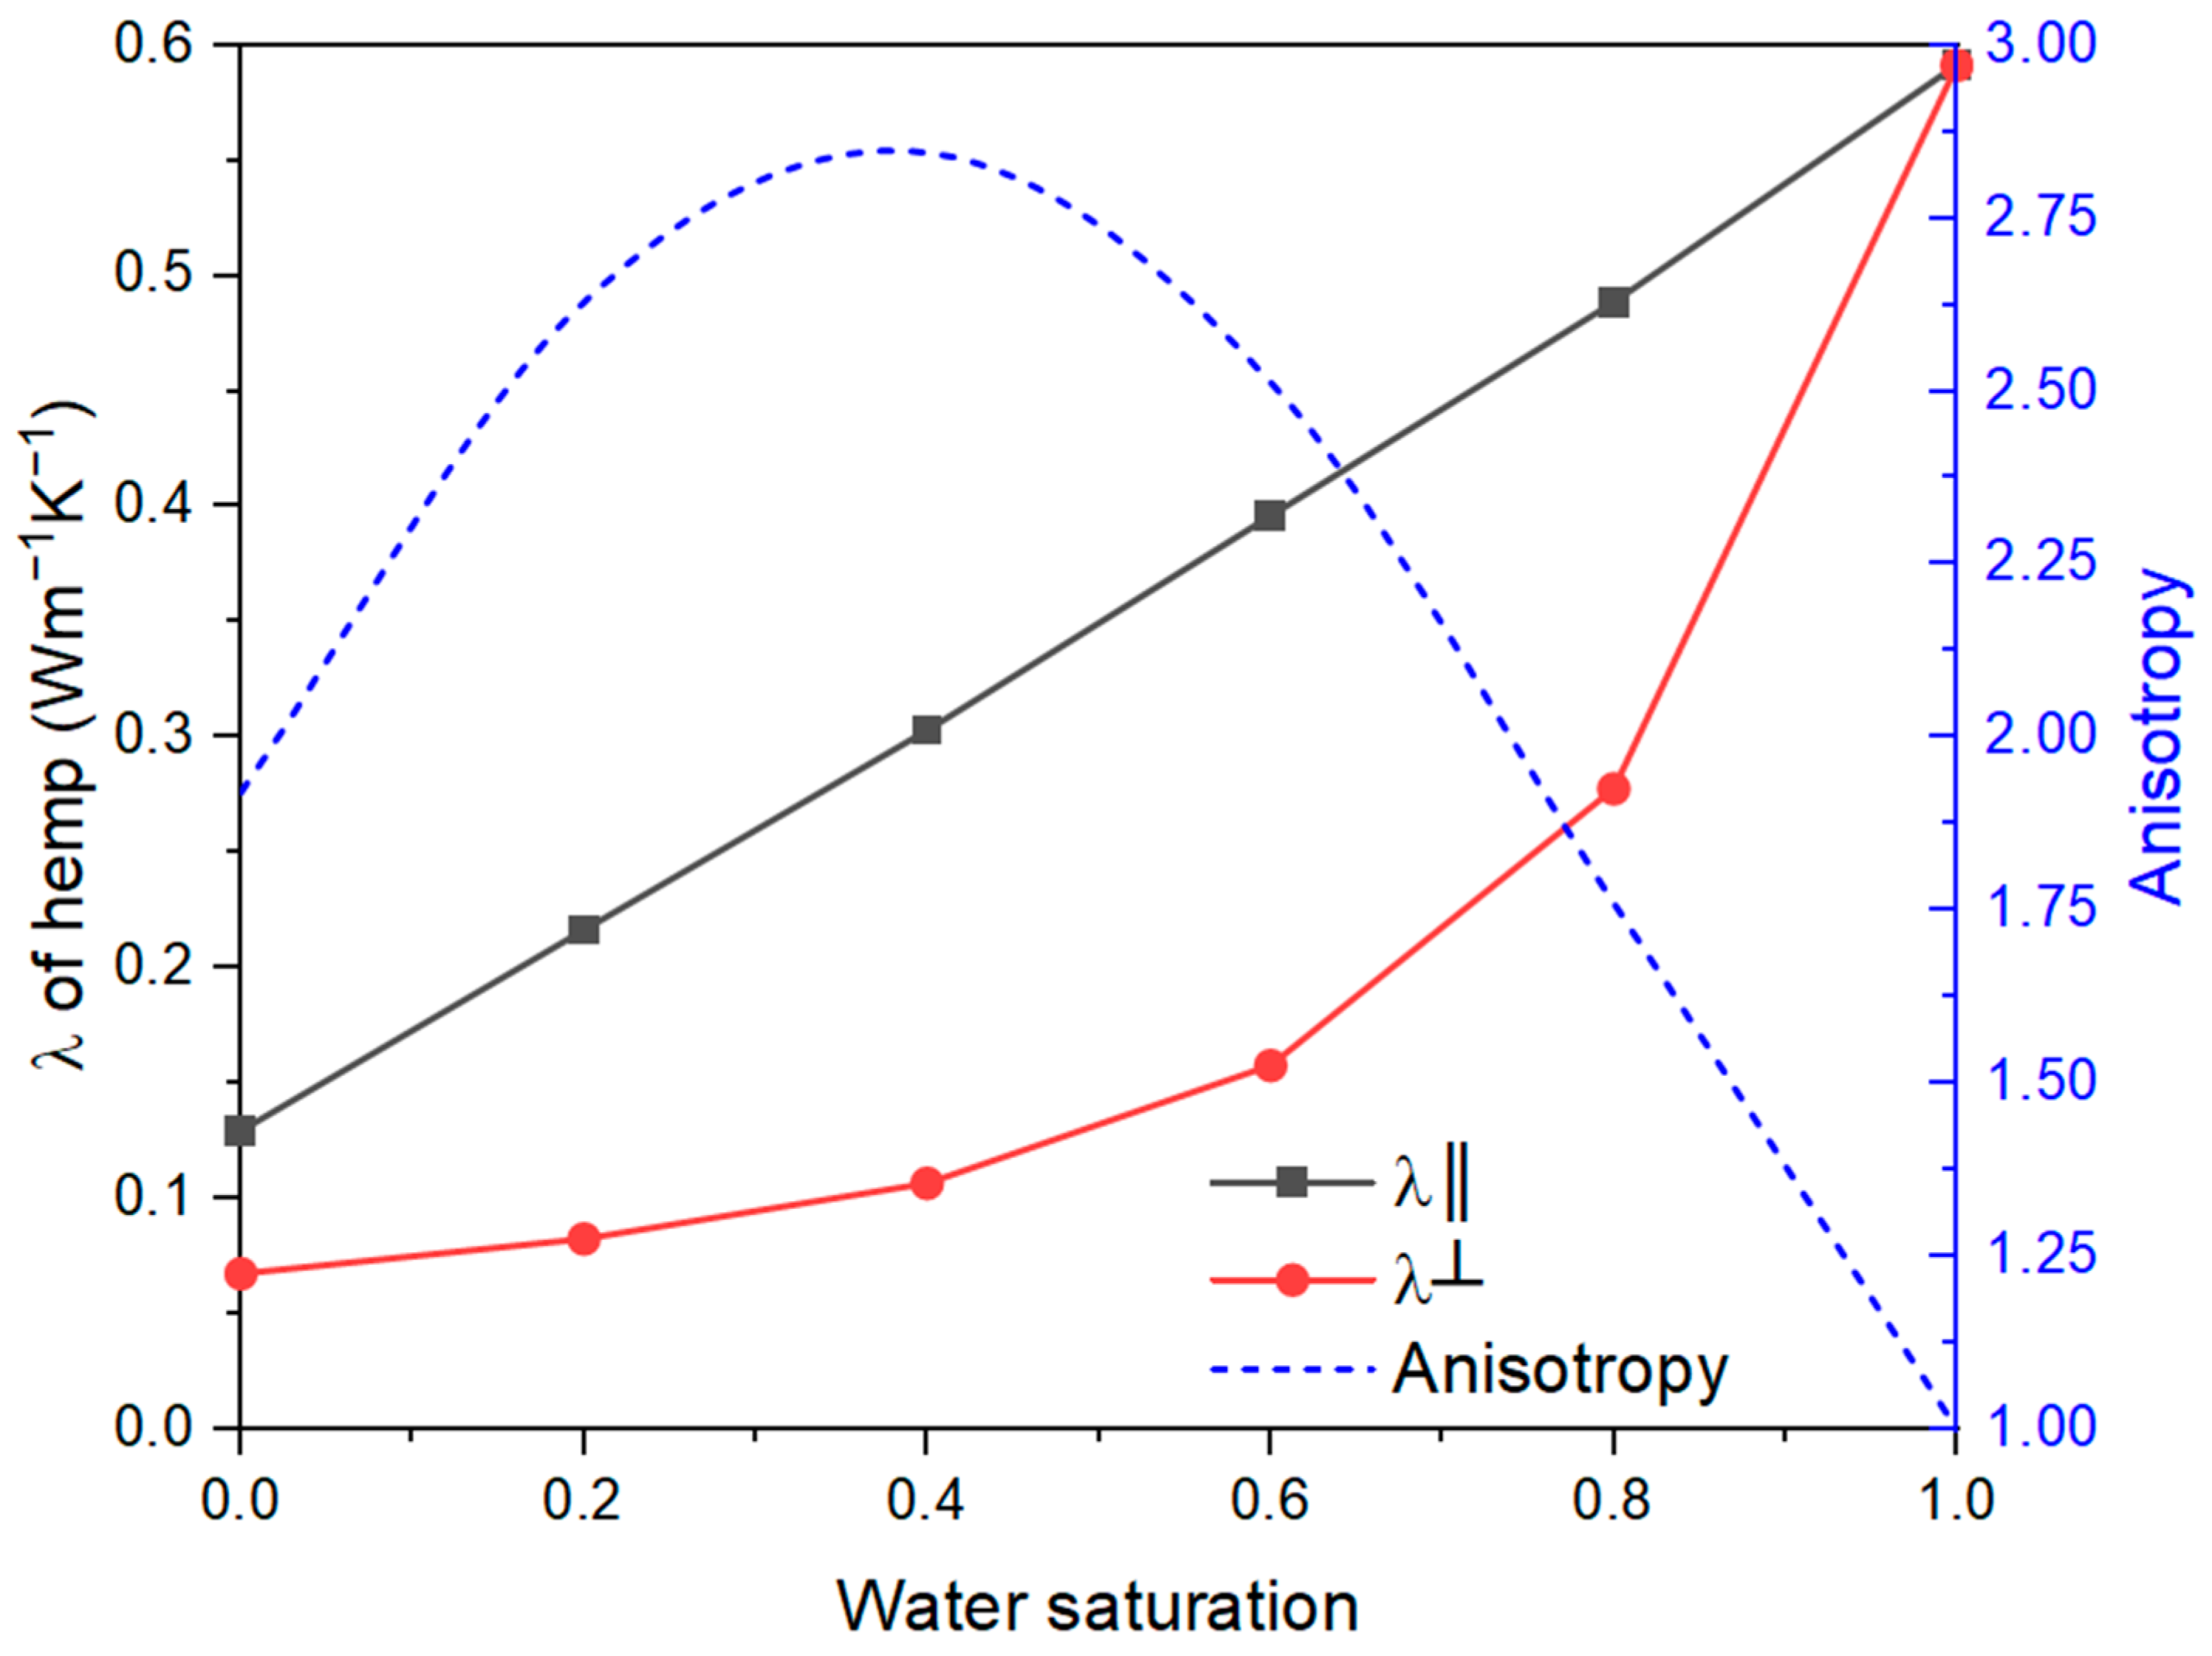
Further, substituting the porosity 0.818 of hemp from the literature [34] into Figure 10 gives the variation of thermal conductivity of hemp with water saturation, as shown in Figure 11. The curves of hemp with WS are similar to the pore-moisture in Figure 9.

3.3. Effective Thermal Conductivity of Bio-Based Construction Materials

3.3.1. Mesh Size Analysis

Figure 6 shows a complex numerical model of bio-based composite, and it is necessary to perform a mesh size analysis before studying the factors. A hemp volume fraction of 0.25 was selected here to investigate the effect of mesh element size on the thermal conductivity of the composite in horizontal and parallel directions. It should be noted that in the study of bio-based composites, λ║ represents the thermal conductivity parallel to the compaction direction, and λ┴ represents the thermal conductivity perpendicular to the compaction direction.
As shown in Figure 12, the thermal conductivity of the bio-based composite decreases as the mesh element size decreases. The thermal conductivity varies slightly when the mesh element size decreases from 0.2 to 0.1 mm. However, during this process, the number of elements in the finite element numerical simulation increases from 2,007,549 to 10,049,154. Therefore, a mesh element size of 0.2 mm was chosen in the study of bio-based composites. The dimensions of bio-aggregates can be found in Figure 7.

3.3.2. Validation with Experimental Data

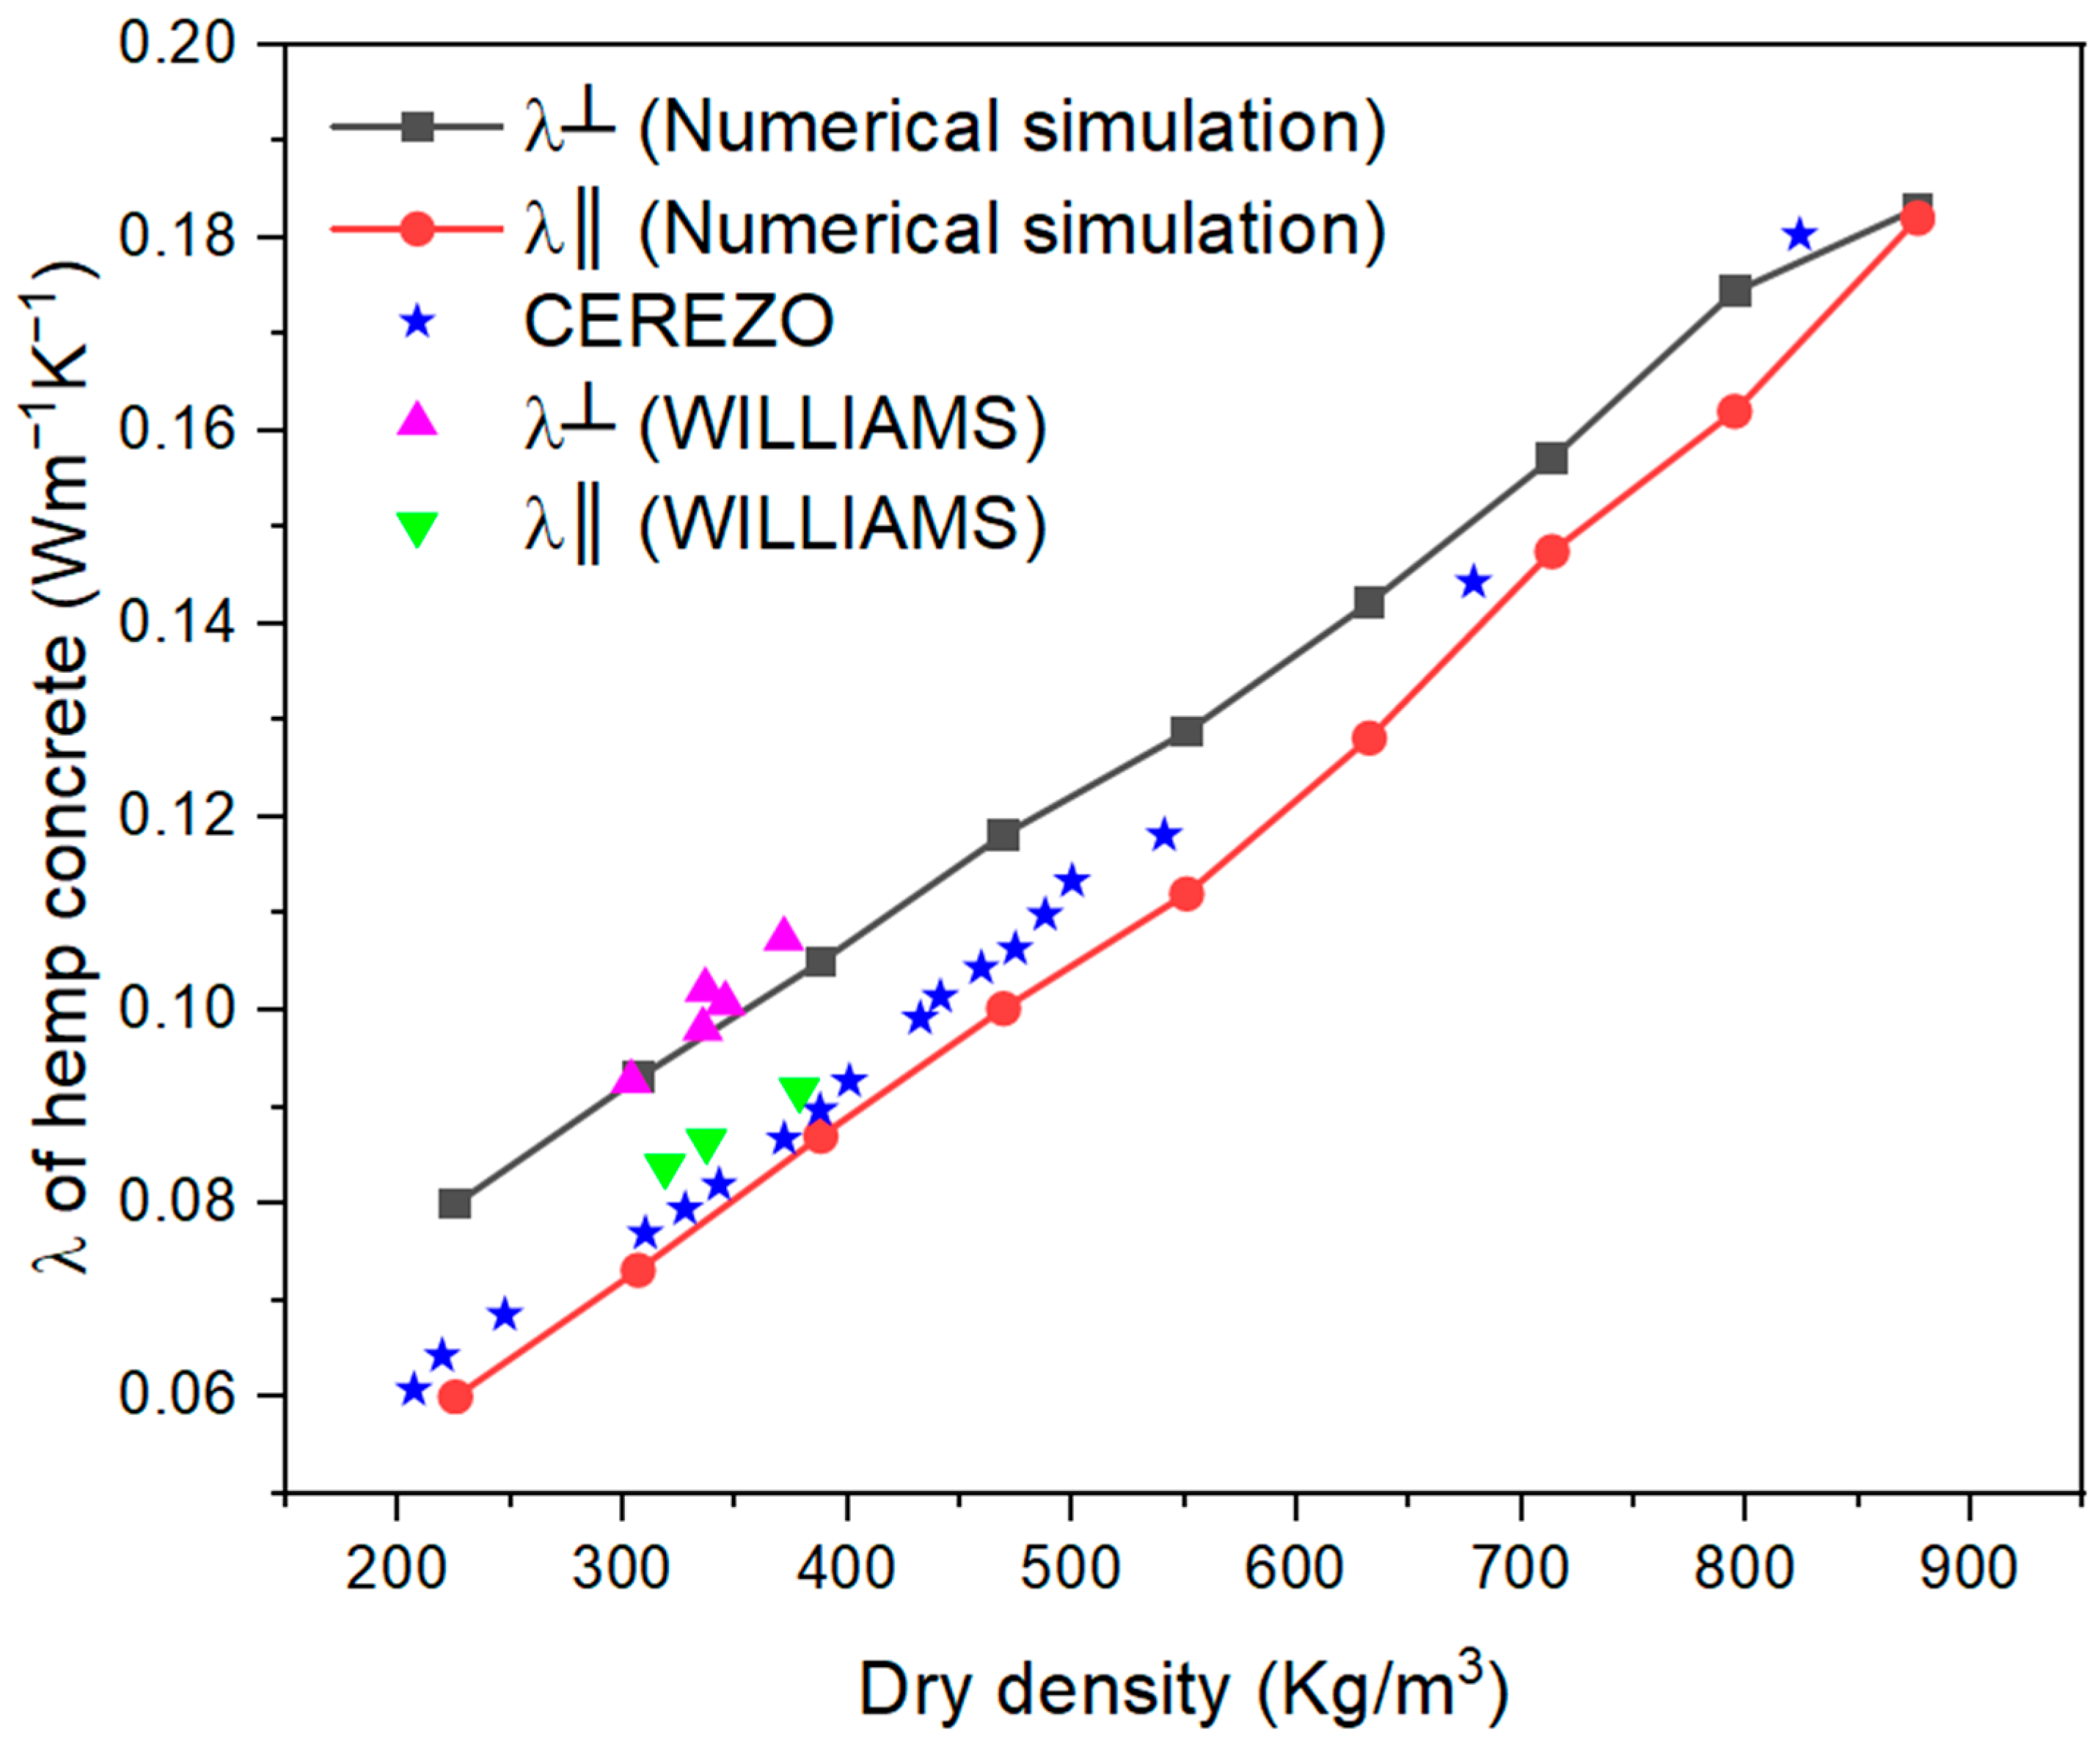
It is necessary to validate the model with the experimental results before conducting the parametric analysis. Figure 13 shows the comparison of the results of the numerical simulations with the experimental results from the literature [23,40]. It is important to note that the numerical simulation results in Figure 13 are based on the volume fraction of macropores in Table 3, i.e., macro-porosity was assumed to be a constant at different volume fractions of hemp, and then the density of the composite was calculated according to Table 1 and Table 2. It should also be noted that for the experimental results from CEREZO [40], the authors did not distinguish the different thermal conductivity perpendicular and parallel to the compaction direction, so there is only one type of value in Figure 13. In contrast, the experiments from WILLIAMS [23] have different thermal conductivities in different directions. It can be seen that the results from CEREZO [40] are between the two curves in Figure 13 when the density is approximately from 200 to 850 kg/m3. Moreover, the results of the numerical simulation agree approximately with the experimental results from WILLIAMS [23].

3.3.3. Moisture

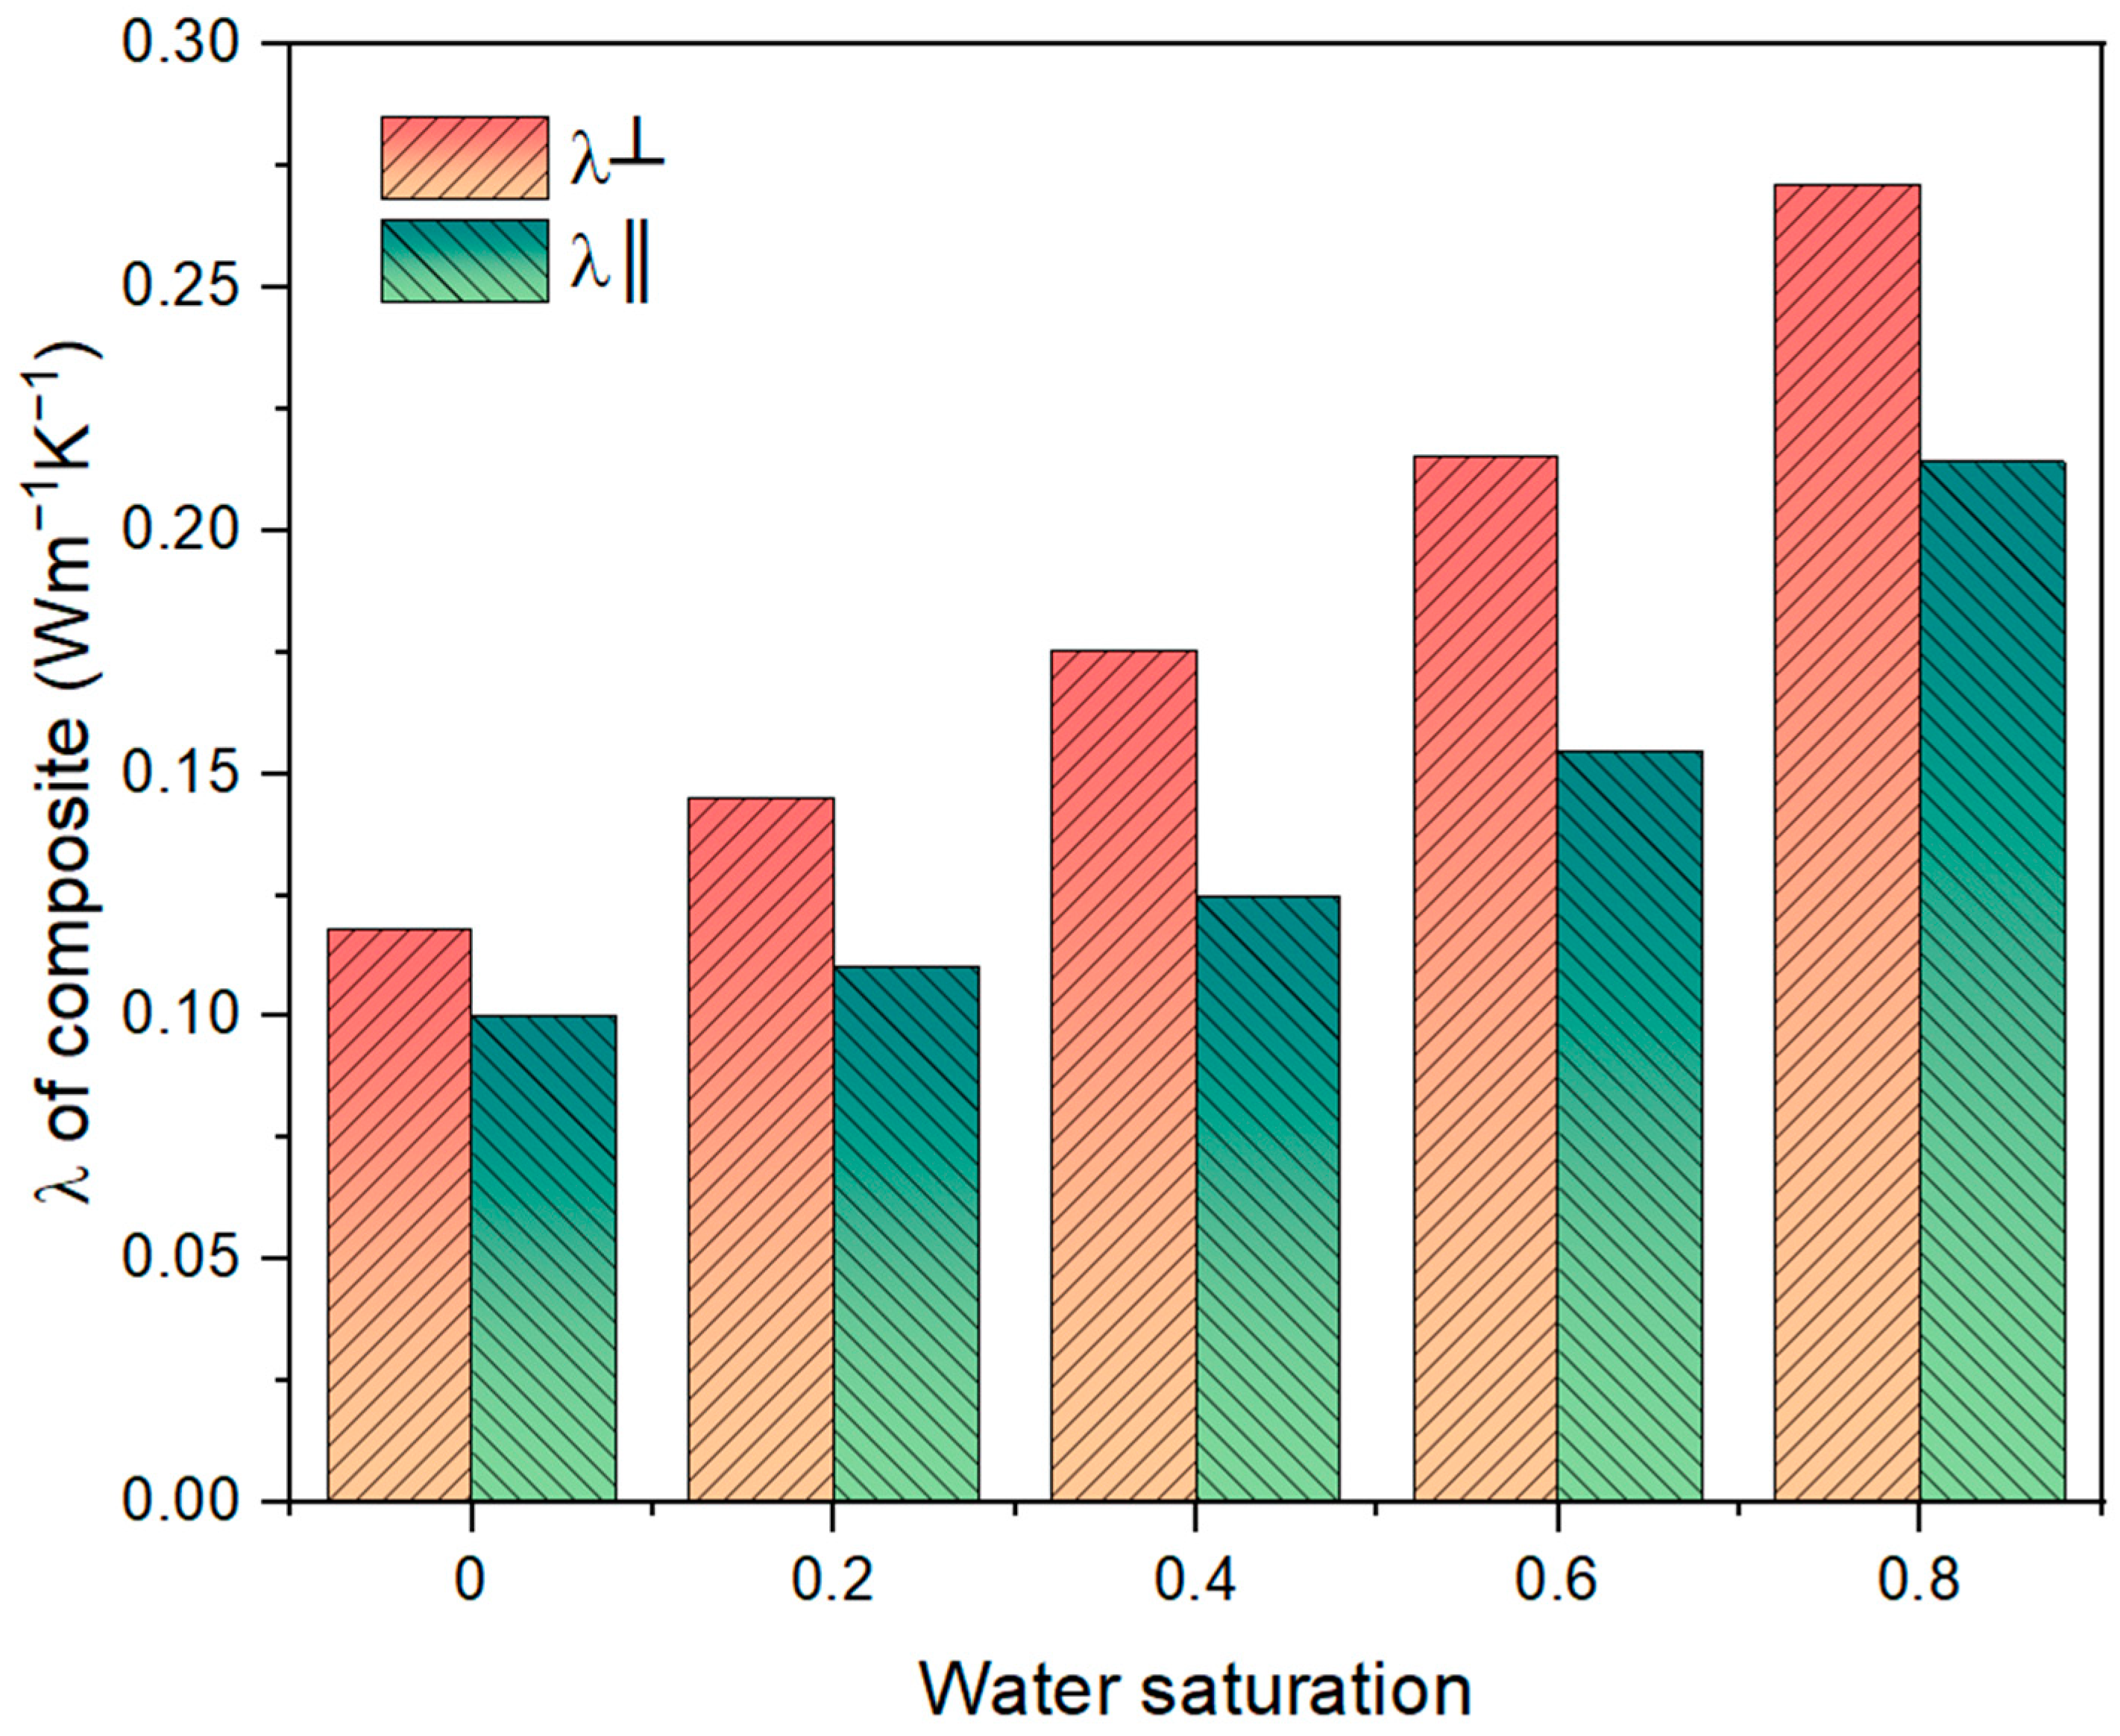
It is known from the previous sections that water saturation significantly affects the thermal conductivity of pore-moisture and hemp. In detail, in the multi-scale model, water saturation affects pore-moisture initially (Figure 9), then hemp (Figure 11), and finally bio-based composite. Figure 14 shows the effect of water saturation on the thermal conductivity of bio-based composites. Due to the high thermal conductivity of water compared to other components, the increase in water saturation reduces the thermal insulation of bio-based composite whether in the direction parallel or perpendicular to the compaction.
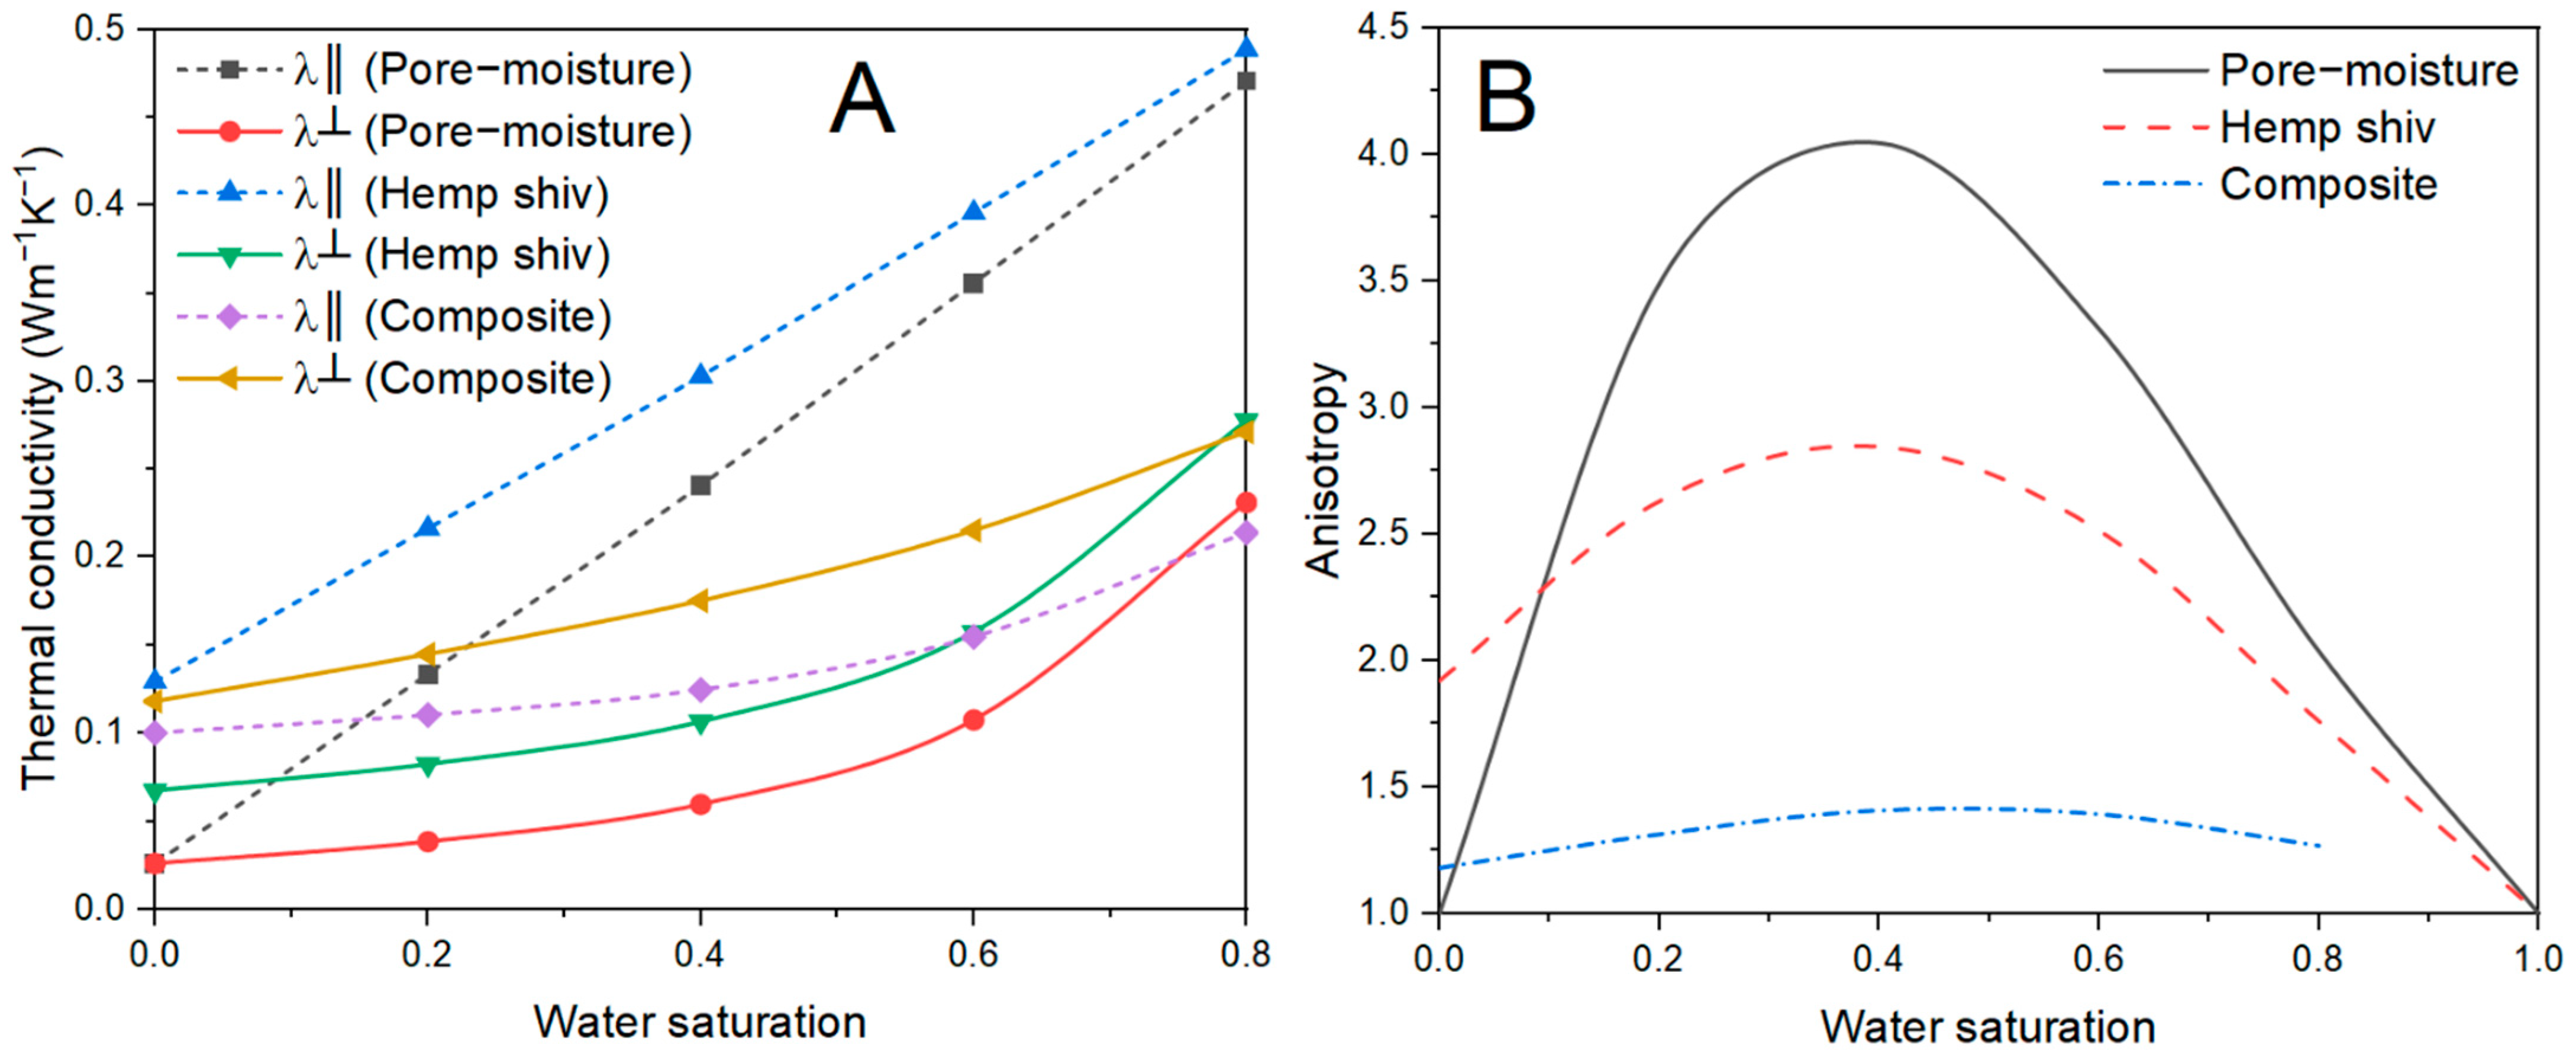
Further analysis in Figure 15A demonstrates the effect of water saturation on the thermal conductivity of the material at different scales. λ║ increases approximately linearly with water saturation for pore-moisture and hemp shive. In contrast, it is nonlinear for the bio-based composite. This can be explained by the different arrangements of the inclusions. In bio-based composite, the inclusions are distributed randomly rather than linearly in the plane perpendicular to the compaction direction. In pore-moisture and hemp shiv, heat flow can be transferred directly through the tubular inclusions.
The effect of water saturation on the anisotropy of the pore-moisture, hemp shiv, and bio-based compositeis presented in Figure 15B. They have similar trends since the materials affect each other between different scales. This finding also illustrates that the macroscopic properties of a material depend on its microstructure state. Moreover, from pore-moisture to composite, anisotropy is decreasing as homogenization advances from microscopic to macroscopic scales (WS > 0.1). This is due to the fact that the new phases are isotropic materials at each step of homogenization, such as hemp solids and binders.

3.3.4. Shape of Bio-Aggregate

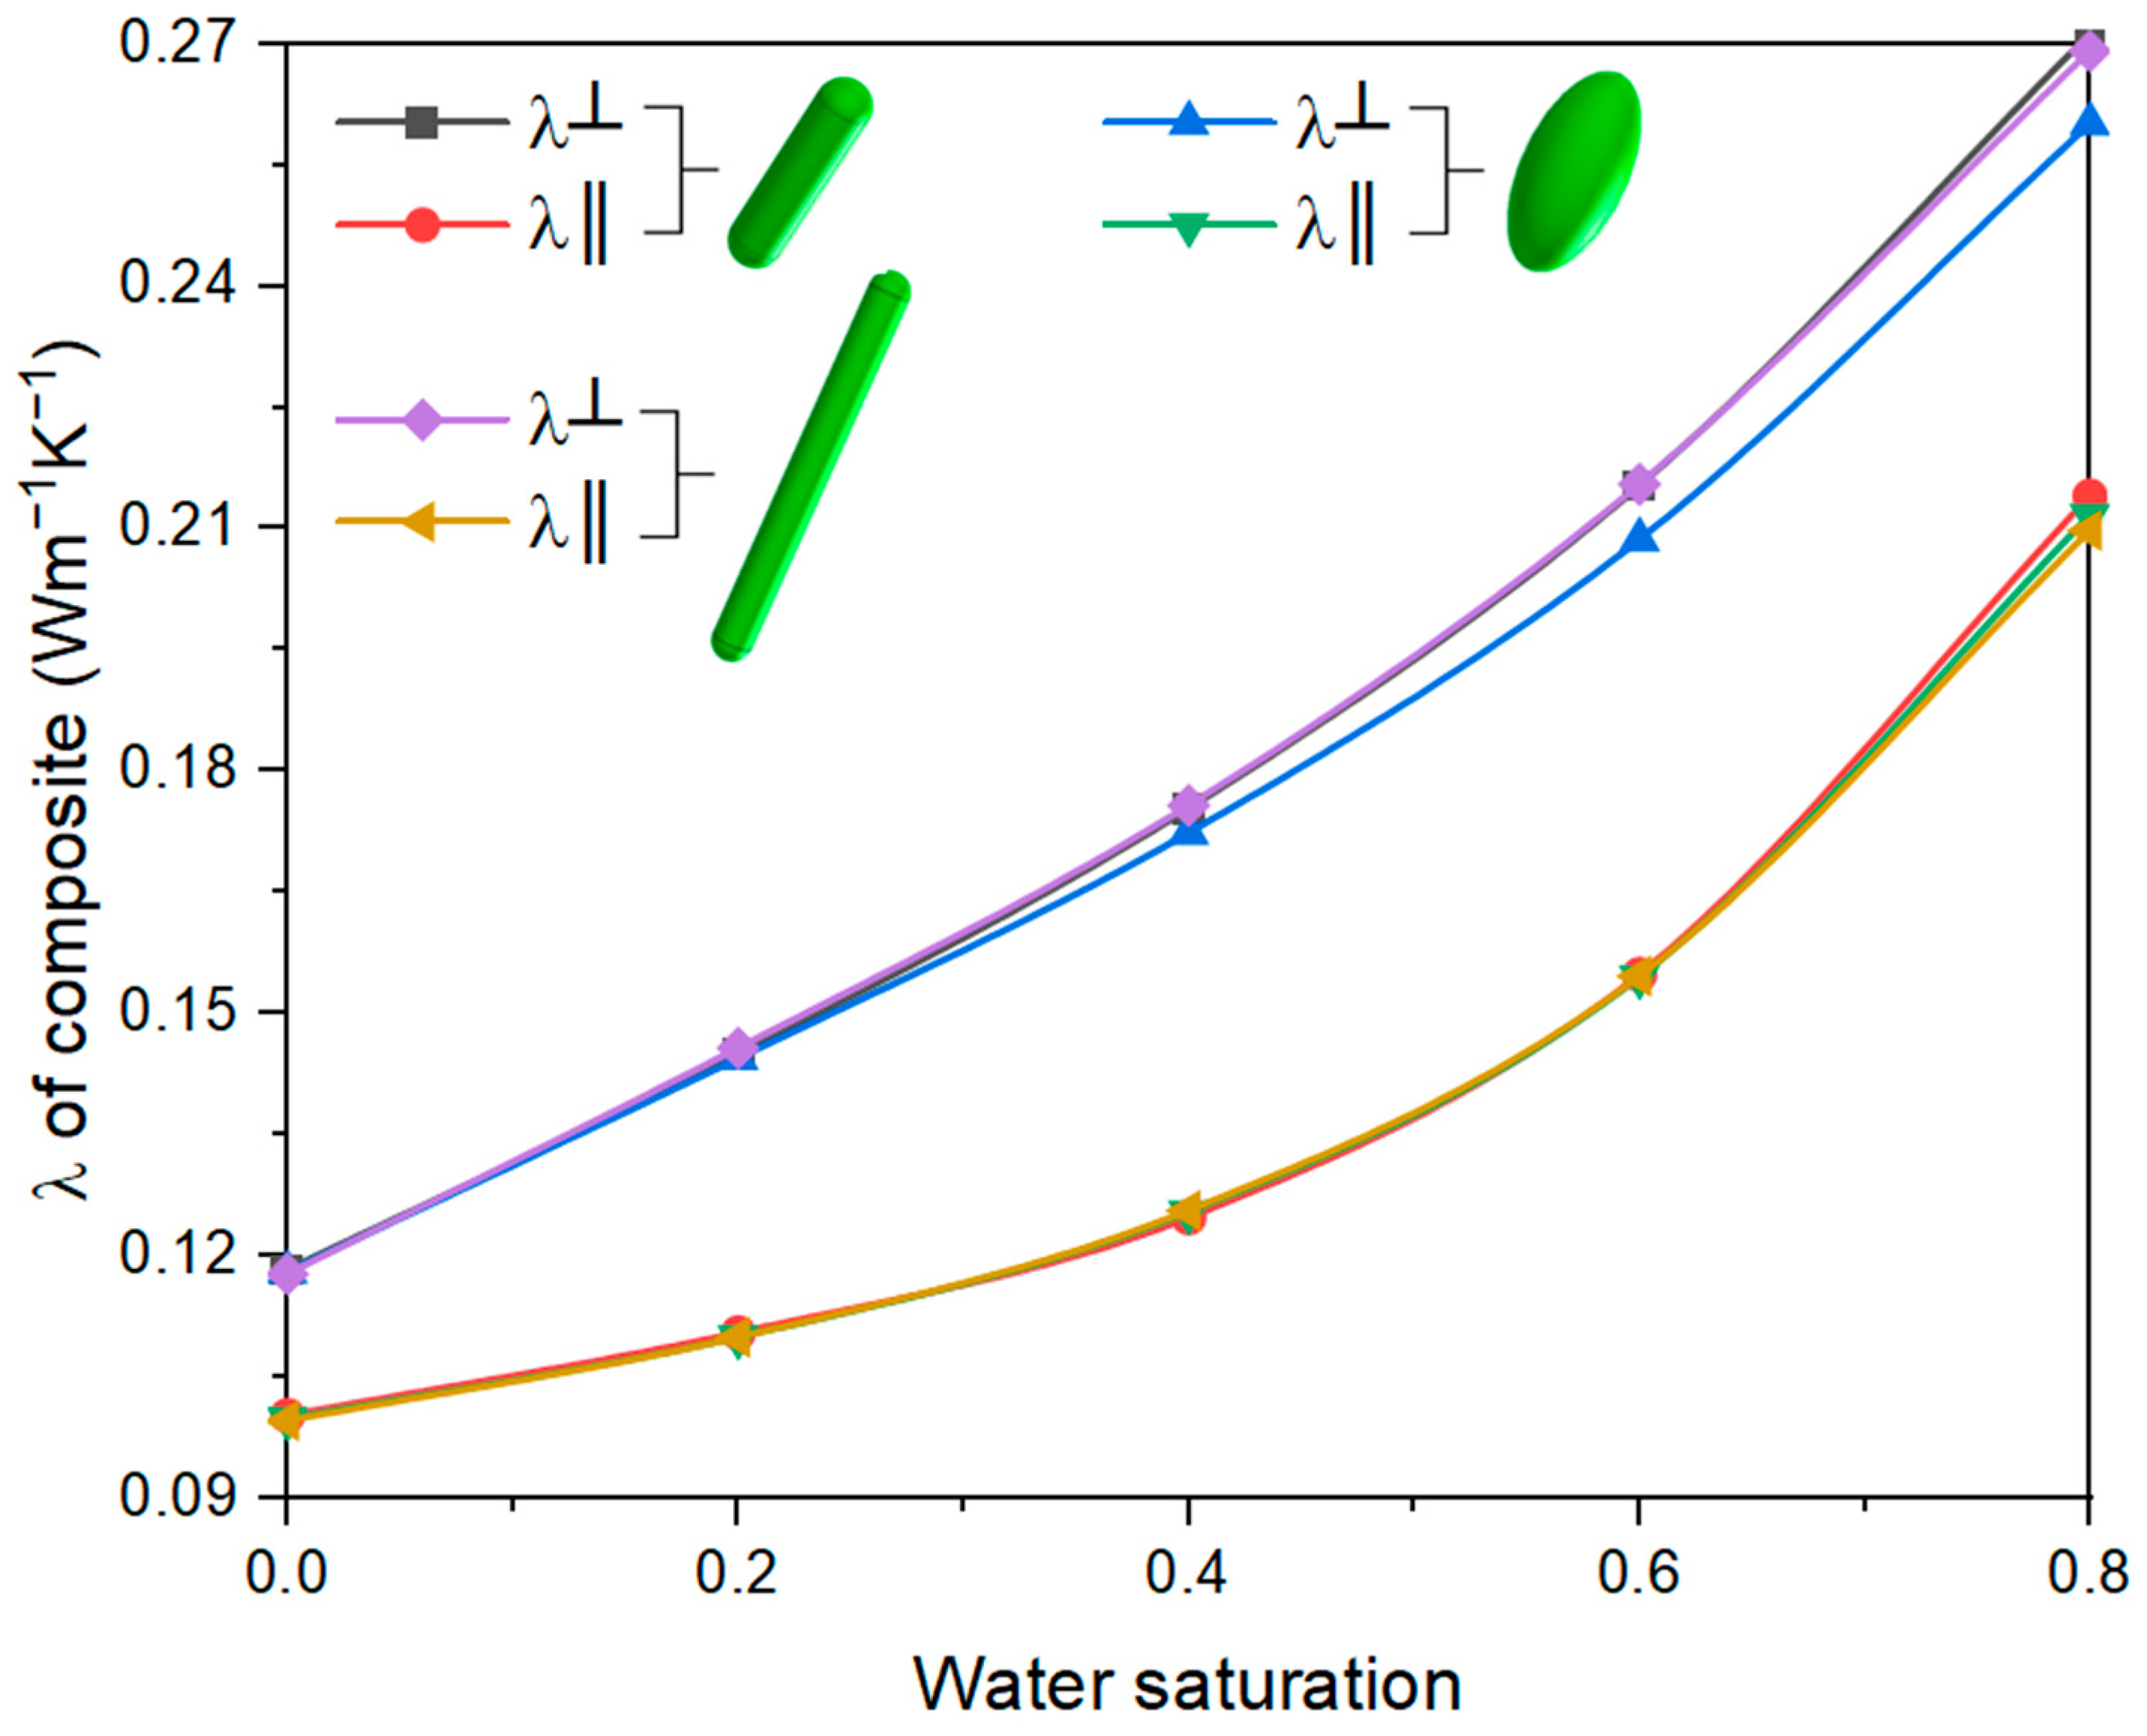
The multiscale homogenization models for inclusions with length and width of 4 and 1 mm has been discussed in the previous sections. However, on the one hand, the hemp size depends on the source and the manufacturing method. On the other hand, there are other local agricultural by-products specific to different countries and regions. Therefore, a comparison of three different shapes of bio-aggregates was undertaken and is shown in Figure 16. As can be seen from Figure 16, the thermal conductivity in the parallel direction is almost the same for different shapes. In contrast, with respect to the perpendicular direction, the thermal conductivity of inclusions with an aspect ratio (calculated by length/width) of 2 is lower than that of the other shapes. This relative difference increases with water saturation. These findings can be explained by the anisotropy and arrangement of the bio-aggregate. In the parallel direction, the transfer of heat flow needs to cross the cross-section of the plant fibers. In this case, the shape of the fibers in the perpendicular direction does not affect the properties in the parallel direction generally. On the contrary, in the perpendicular direction, the heat flow prefers to transfer along the plant fibers rather than cross them transversely, and the elongated plant fibers can better transfer the heat from one side of the specimen to the other side. Conversely, for plant fibers with a low aspect ratio, the heat flow from one side to the other side needs to cross more interparticle zones, which will undoubtedly increase the thermal resistance. This phenomenon will continue to be discussed in the next section based on finite element results.

3.3.5. Analysis of Fiber Orientation

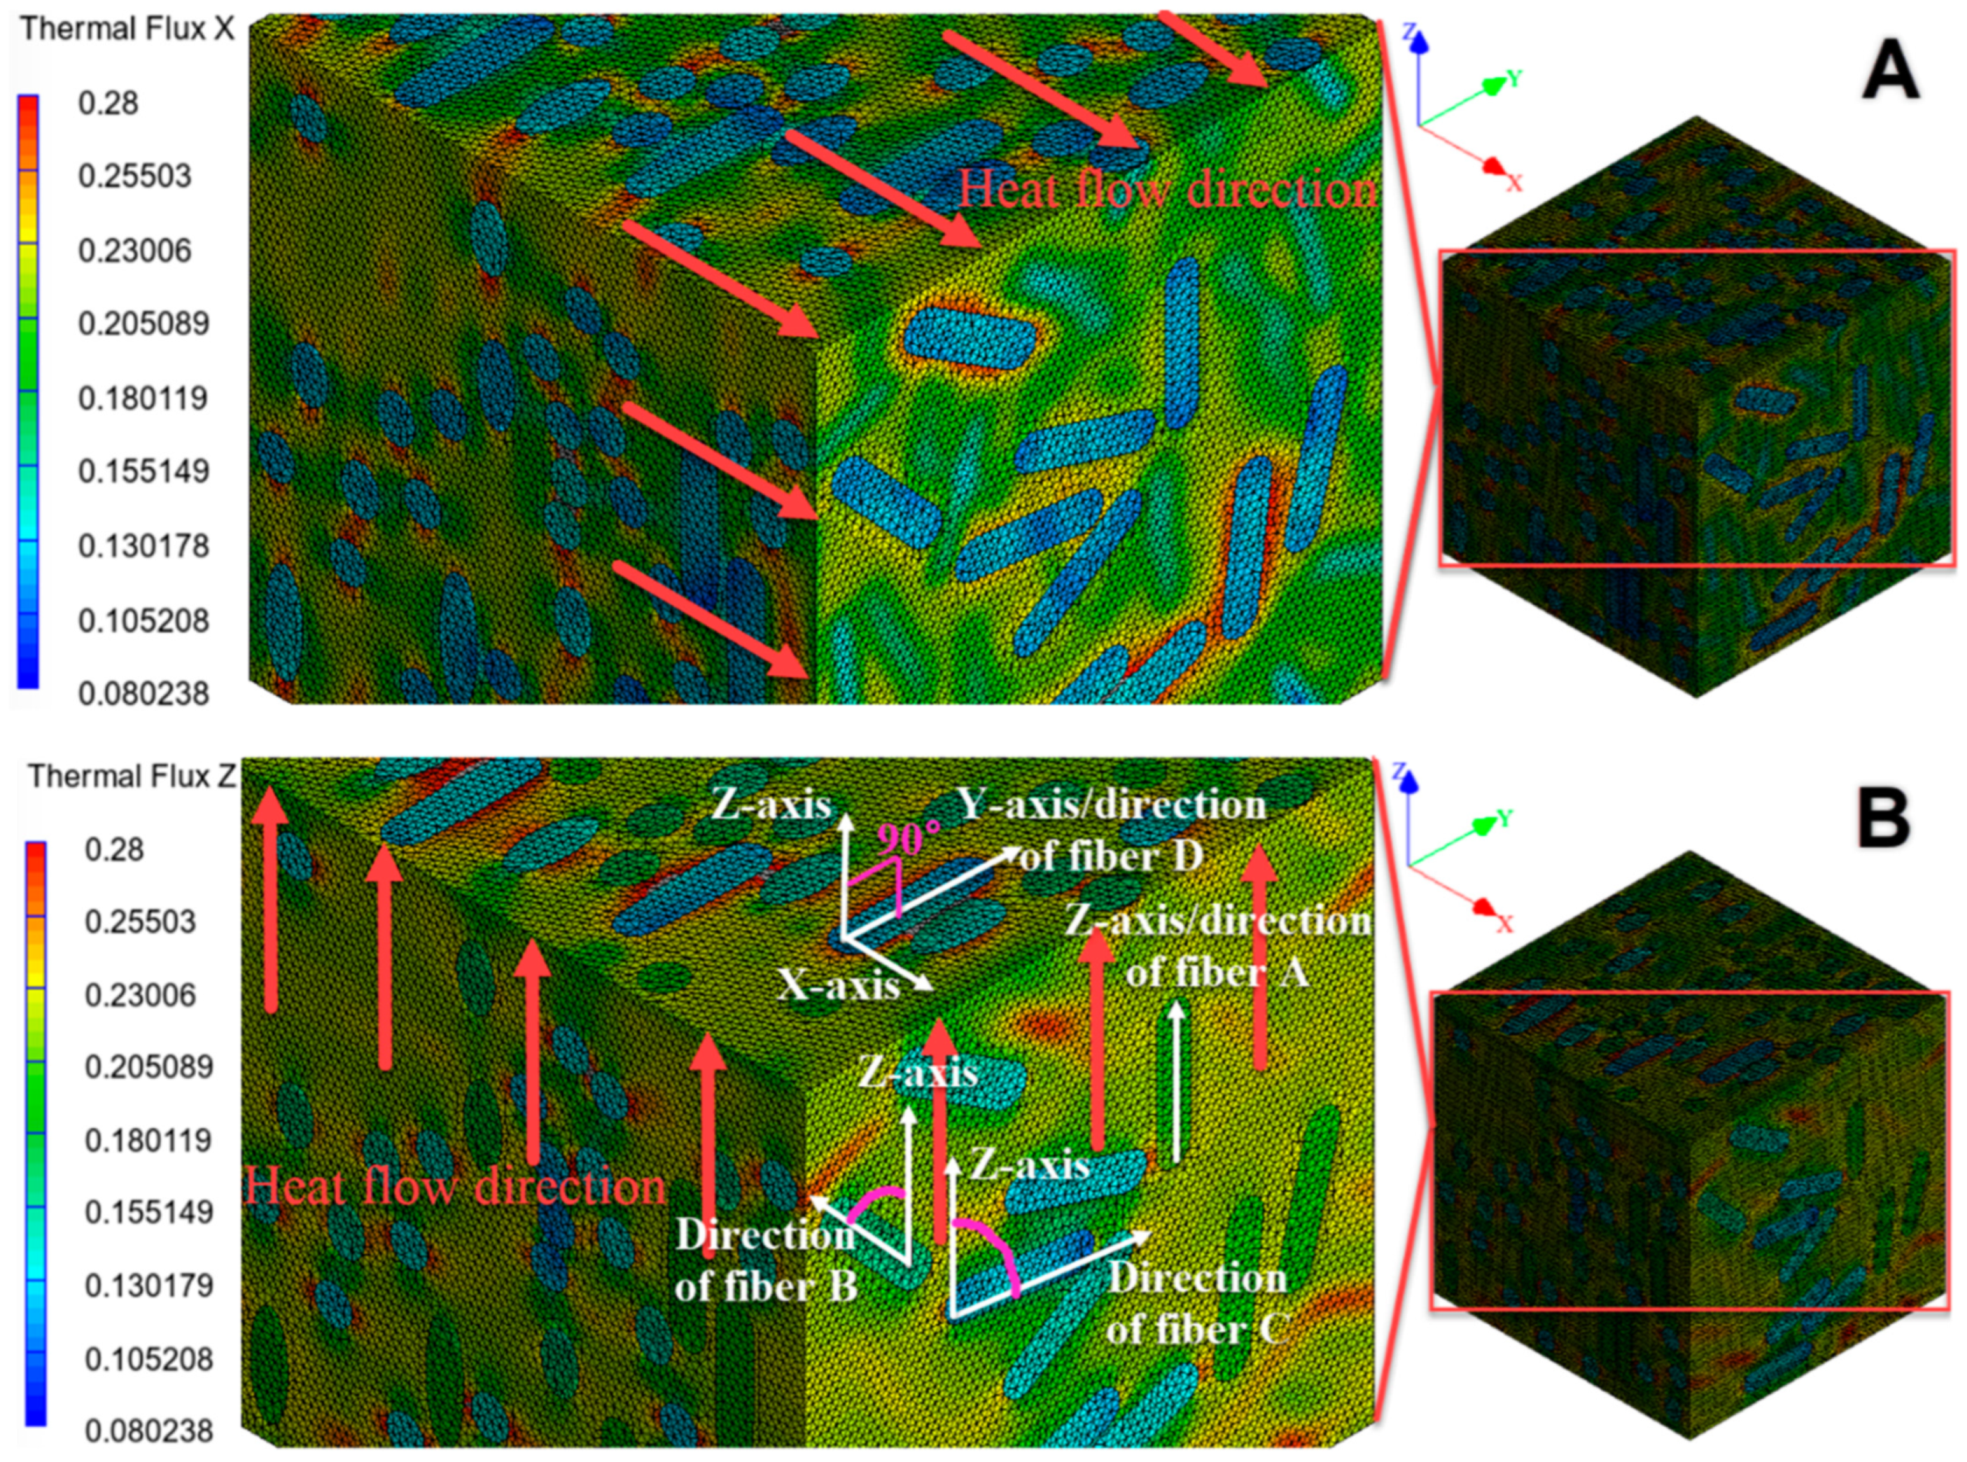
Figure 17 shows the distribution of heat flux in the X- and Z-directions. Note that the compaction is along the X-axis. The distribution of the heat flux in the X-direction (Figure 17A) shows that the heat flux on each inclusion is almost the same. Moreover, it is less than the heat flux on the matrix. This is because, in the X-direction, the heat flow needs to pass through each inclusion transversely. Additionally, the transverse thermal conductivity of the inclusions is lower than that of the matrix. As stated before, this arrangement of inclusions increases the thermal resistance in the X-direction and contributes to better insulation of the building material.
As for the distribution of the heat flux in the Z-direction, as shown in Figure 17B, the heat flux varies significantly on the inclusion in different orientations. In this case, the initial heat flow direction is along the Z-axis, so the inclusions oriented exactly in the Z-direction have the maximum heat flux, as shown in fiber A in Figure 17B. The heat flux is minimized when the fiber direction is perpendicular to the Z-axis, such as fiber D in Figure 17B. Moreover, the heat flux on fiber D is approximately equivalent to that of the fibers in Figure 17A, since the heat flow crosses the fibers transversely in both cases. In summary, the larger the angle (acute angle) between the fiber direction and the Z-axis (initial heat flow direction), the lower the heat flux. For example, the angle in fiber: C > B > A; as a result of heat flux: A < B < C. The heat flow tends to transfer along the bio-aggregate rather than across it because of its anisotropy.

4. Conclusions

The purpose of this study is to develop a multi-scale numerical model to analyze the effect of the microstructure of bio-based construction materials on thermal conductivity. These factors were considered in this model: size, shape, orientation, porosity, and water saturation of plant fibers. The study of these factors can link microstructure and macroscopic thermal conductivity, which ultimately promotes the application of bio-based concrete as an insulation material in buildings. Moreover, considering the lack of research on numerical modeling, especially those involving multi-scale microstructures, in bio-based building materials, this study can make a contribution to the current literature. Additionally, the analysis of shape and porosity undertaken here can extend our modeling to more types of plant aggregates.
Based on the numerical simulation results, the main conclusions can be summarized as follows:
  • For individual plant fiber, the thermal conductivity in the axial direction is greater than that in the transverse direction. For bio-based construction material, the thermal conductivity along the compaction direction is less than that perpendicular to the compaction direction.
  • The anisotropy (the ratio of thermal conductivity in two directions) of both individual fiber and bio-based construction material increases initially, then decreases with water saturation. They take a maximum of about 0.4 water saturation.
  • For transversely isotropic bio-aggregates, such as hemp, the thermal conductivity (WS ≤ 0.8) decreases with porosity. Moreover, the decline rate decreases with water saturation.
  • The thermal conductivity of hemp and bio-based construction material increases with water saturation in both parallel and perpendicular directions. Further analysis shows that the parallel thermal conductivity of hemp increases linearly with water saturation, in contrast to the non-linear increase in thermal conductivity of bio-based material.
  • Comparing the inclusions with different shapes (length/width = 2, 4, and 10), in the direction of compaction, the thermal conductivity of the bio-based material is almost independent of the shape. In the direction perpendicular to the compaction, the thermal conductivity at the length/width of two is lower than that of the other shapes, and the relative difference increases with water saturation.
  • The analysis of the plant fiber orientation shows that the heat flow tends to transfer axially along the fiber rather than transversely across it. The heat flux on the fiber decreases with the angle (acute angle) between the fiber and the initial heat flow. This can be explained by the transversely isotropic structure of the plant fibers.

Author Contributions

Conceptualization, A.A.-C., S.G. and J.A.; methodology, G.H., A.A.-C., S.G. and J.A.; software, G.H. and J.A.; validation, A.A.-C., S.G. and J.A.; formal analysis, G.H.; investigation, G.H.; resources, A.A.-C.; data curation, G.H.; writing—original draft preparation, G.H.; writing—review and editing, A.A.-C., S.G. and J.A.; visualization, G.H.; supervision, A.A.-C., S.G. and J.A.; project administration, S.G. All authors have read and agreed to the published version of the manuscript.

Funding

This research received no external funding.

Data Availability Statement

The data presented in this study are available on request from the corresponding author.

Conflicts of Interest

The authors declare no conflict of interest.

References

  1. Climate Change 2022: Mitigation of Climate Change. Available online: https://www.ipcc.ch/report/ar6/wg3/ (accessed on 16 May 2022).
  2. Li, X.; Wu, W.; Yu, C.W.F. Energy Demand for Hot Water Supply for Indoor Environments: Problems and Perspectives. Indoor Built Environ. 2015, 24, 5–10. [Google Scholar] [CrossRef]
  3. Cabeza, L.F.; Boquera, L.; Chàfer, M.; Vérez, D. Embodied Energy and Embodied Carbon of Structural Building Materials: Worldwide Progress and Barriers through Literature Map Analysis. Energy Build. 2021, 231, 110612. [Google Scholar] [CrossRef]
  4. Churkina, G.; Organschi, A.; Reyer, C.P.O.; Ruff, A.; Vinke, K.; Liu, Z.; Reck, B.K.; Graedel, T.E.; Schellnhuber, H.J. Buildings as a Global Carbon Sink. Nat. Sustain. 2020, 3, 269–276. [Google Scholar] [CrossRef]
  5. Wu, W.; Skye, H.M. Residential Net-Zero Energy Buildings: Review and Perspective. Renew. Sustain. Energy Rev. 2021, 142, 110859. [Google Scholar] [CrossRef] [PubMed]
  6. Cabeza, L.F.; Chàfer, M. Technological Options and Strategies towards Zero Energy Buildings Contributing to Climate Change Mitigation: A Systematic Review. Energy Build. 2020, 219, 110009. [Google Scholar] [CrossRef]
  7. Ürge-Vorsatz, D.; Khosla, R.; Bernhardt, R.; Chan, Y.C.; Vérez, D.; Hu, S.; Cabeza, L.F. Advances toward a Net-Zero Global Building Sector. Annu. Rev. Environ. Resour. 2020, 45, 227–269. [Google Scholar] [CrossRef]
  8. Amantino, G.M.; Hasparyk, N.P.; Tiecher, F.; Toledo Filho, R.D. Assessment of Bio-Aggregate Concretes’ Properties with Rice Residue. J. Build. Eng. 2022, 52, 104348. [Google Scholar] [CrossRef]
  9. Bovo, M.; Giani, N.; Barbaresi, A.; Mazzocchetti, L.; Barbaresi, L.; Giorgini, L.; Torreggiani, D.; Tassinari, P. Contribution to Thermal and Acoustic Characterization of Corn Cob for Bio-Based Building Insulation Applications. Energy Build. 2022, 262, 111994. [Google Scholar] [CrossRef]
  10. Costantine, G.; Maalouf, C.; Moussa, T.; Polidori, G. Experimental and Numerical Investigations of Thermal Performance of a Hemp Lime External Building Insulation. Build. Environ. 2018, 131, 140–153. [Google Scholar] [CrossRef]
  11. Chabriac, P.A.; Gourdon, E.; Gle, P.; Fabbri, A.; Lenormand, H. Agricultural By-Products for Building Insulation: Acoustical Characterization and Modeling to Predict Micro-Structural Parameters. Constr. Build. Mater. 2016, 112, 158–167. [Google Scholar] [CrossRef]
  12. Bennai, F.; El Hachem, C.; Abahri, K.; Belarbi, R. Microscopic Hydric Characterization of Hemp Concrete by X-Ray Microtomography and Digital Volume Correlation. Constr. Build. Mater. 2018, 188, 983–994. [Google Scholar] [CrossRef]
  13. Latif, E.; Lawrence, M.; Shea, A.; Walker, P. Moisture Buffer Potential of Experimental Wall Assemblies Incorporating Formulated Hemp-Lime. Build. Environ. 2015, 93, 199–209. [Google Scholar] [CrossRef] [Green Version]
  14. Colinart, T.; Lelievre, D.; Glouannec, P. Experimental and Numerical Analysis of the Transient Hygrothermal Behavior of Multilayered Hemp Concrete Wall. Energy Build. 2016, 112, 1–11. [Google Scholar] [CrossRef]
  15. Benmahiddine, F.; Bennai, F.; Cherif, R.; Belarbi, R.; Tahakourt, A.; Abahri, K. Experimental Investigation on the Influence of Immersion/Drying Cycles on the Hygrothermal and Mechanical Properties of Hemp Concrete. J. Build. Eng. 2020, 32, 101758. [Google Scholar] [CrossRef]
  16. Gourlay, E.; Glé, P.; Marceau, S.; Foy, C.; Moscardelli, S. Effect of Water Content on the Acoustical and Thermal Properties of Hemp Concretes. Constr. Build. Mater. 2017, 139, 513–523. [Google Scholar] [CrossRef]
  17. Collet, F.; Pretot, S. Thermal Conductivity of Hemp Concretes: Variation with Formulation, Density and Water Content. Constr. Build. Mater. 2014, 65, 612–619. [Google Scholar] [CrossRef] [Green Version]
  18. Ahmad, M.R.; Chen, B.; Haque, M.A.; Saleem Kazmi, S.M.; Munir, M.J. Development of Plant-Concrete Composites Containing Pretreated Corn Stalk Bio-Aggregates and Different Type of Binders. Cem. Concr. Compos. 2021, 121, 104054. [Google Scholar] [CrossRef]
  19. Rahim, M.; Douzane, O.; Tran Le, A.D.; Langlet, T. Effect of Moisture and Temperature on Thermal Properties of Three Bio-Based Materials. Constr. Build. Mater. 2016, 111, 119–127. [Google Scholar] [CrossRef]
  20. Walker, R.; Pavía, S. Moisture Transfer and Thermal Properties of Hemp–Lime Concretes. Constr. Build. Mater. 2014, 64, 270–276. [Google Scholar] [CrossRef]
  21. Tran-Le, A.D.; Nguyen, S.-T.; Langlet, T. A Novel Anisotropic Analytical Model for Effective Thermal Conductivity Tensor of Dry Lime-Hemp Concrete with Preferred Spatial Distributions. Energy Build. 2019, 182, 75–87. [Google Scholar] [CrossRef]
  22. Water—Thermal Conductivity vs. Temperature. Available online: https://www.engineeringtoolbox.com/water-liquid-gas-thermal-conductivity-temperature-pressure-d_2012.html (accessed on 19 May 2022).
  23. Williams, J.; Lawrence, M.; Walker, P. The Influence of the Casting Process on the Internal Structure and Physical Properties of Hemp-Lime. Mater. Struct. 2017, 50, 108. [Google Scholar] [CrossRef] [Green Version]
  24. Williams, J.; Lawrence, M.; Walker, P. The Influence of Constituents on the Properties of the Bio-Aggregate Composite Hemp-Lime. Constr. Build. Mater. 2018, 159, 9–17. [Google Scholar] [CrossRef]
  25. Dartois, S.; Mom, S.; Dumontet, H.; Ben Hamida, A. An Iterative Micromechanical Modeling to Estimate the Thermal and Mechanical Properties of Polydisperse Composites with Platy Particles: Application to Anisotropic Hemp and Lime Concretes. Constr. Build. Mater. 2017, 152, 661–671. [Google Scholar] [CrossRef] [Green Version]
  26. Rezakhani, R.; Scott, D.A.; Bousikhane, F.; Pathirage, M.; Moser, R.D.; Green, B.H.; Cusatis, G. Influence of Steel Fiber Size, Shape, and Strength on the Quasi-Static Properties of Ultra-High Performance Concrete: Experimental Investigation and Numerical Modeling. Constr. Build. Mater. 2021, 296, 123532. [Google Scholar] [CrossRef]
  27. Naderi, S.; Zhang, M. 3D Meso-Scale Modelling of Tensile and Compressive Fracture Behaviour of Steel Fibre Reinforced Concrete. Compos. Struct. 2022, 291, 115690. [Google Scholar] [CrossRef]
  28. Liang, X.; Wu, C. Investigation on Thermal Conductivity of Steel Fiber Reinforced Concrete Using Mesoscale Modeling. Int. J. Thermophys. 2018, 39, 142. [Google Scholar] [CrossRef]
  29. Mabrouk, Y.; Benazzouk, A.; Lahmar, A.; Azrour, M.; Mocerino, C.; Lahmar, A. Elaboration and Characterization of Lightweight Rammed Earth Containing Hemp Particles. Mater. Today Proc. 2022, 58, 1389–1396. [Google Scholar] [CrossRef]
  30. Ismail, B.; Belayachi, N.; Hoxha, D. Optimizing Performance of Insulation Materials Based on Wheat Straw, Lime and Gypsum Plaster Composites Using Natural Additives. Constr. Build. Mater. 2020, 254, 118959. [Google Scholar] [CrossRef]
  31. Fourmentin, M.; Faure, P.; Pelupessy, P.; Sarou-Kanian, V.; Peter, U.; Lesueur, D.; Rodts, S.; Daviller, D.; Coussot, P. NMR and MRI Observation of Water Absorption/Uptake in Hemp Shives Used for Hemp Concrete. Constr. Build. Mater. 2016, 124, 405–413. [Google Scholar] [CrossRef]
  32. Delannoy, G.; Marceau, S.; Glé, P.; Gourlay, E.; Guéguen-Minerbe, M.; Diafi, D.; Nour, I.; Amziane, S.; Farcas, F. Aging of Hemp Shiv Used for Concrete. Mater. Des. 2018, 160, 752–762. [Google Scholar] [CrossRef]
  33. Pierre, T.; Carin, M. Characterization of the Thermal Properties of Millimeter-Sized Insulating Materials. Int. J. Therm. Sci. 2019, 135, 247–255. [Google Scholar] [CrossRef]
  34. Glé, P.; Lecompte, T.; Hellouin de Ménibus, A.; Lenormand, H.; Arufe, S.; Chateau, C.; Fierro, V.; Celzard, A. Densities of Hemp Shiv for Building: From Multiscale Characterisation to Application. Ind. Crops Prod. 2021, 164, 113390. [Google Scholar] [CrossRef]
  35. Seng, B.; Magniont, C.; Lorente, S. Characterization of a Precast Hemp Concrete. Part I: Physical and Thermal Properties. J. Build. Eng. 2019, 24, 100540. [Google Scholar] [CrossRef]
  36. Bourdot, A.; Moussa, T.; Gacoin, A.; Maalouf, C.; Vazquez, P.; Thomachot-Schneider, C.; Bliard, C.; Merabtine, A.; Lachi, M.; Douzane, O.; et al. Characterization of a Hemp-Based Agro-Material: Influence of Starch Ratio and Hemp Shive Size on Physical, Mechanical, and Hygrothermal Properties. Energy Build. 2017, 153, 501–512. [Google Scholar] [CrossRef]
  37. Modeling thermal conductivity of hemp insulation material: A multi-scale homogenization approach. Build. Environ. 2016, 107, 127–134. [CrossRef]
  38. Lagouin, M.; Magniont, C.; Sénéchal, P.; Moonen, P.; Aubert, J.-E.; Laborel-préneron, A. Influence of Types of Binder and Plant Aggregates on Hygrothermal and Mechanical Properties of Vegetal Concretes. Constr. Build. Mater. 2019, 222, 852–871. [Google Scholar] [CrossRef]
  39. Zaknoune, A. Etude du Comportement Thermohydrique de Matériaux «Chanvre-Chaux» Lors de la Phase de Séchage—Estimation par Technique Inverse des Propriétés Hydriques. Ph.D. Thesis, Université de Bretagne Sud, Lorient, France, 2011. [Google Scholar]
  40. Véronique, C. Propriétés Mécaniques, Thermiques et Acoustiques d’un Matériau à Base de Particules Végétales: Approche Expérimentale et Modélisation Théorique. Ph.D. Thesis, INSA, Lyon, France, 2005; p. 248. [Google Scholar]
  41. Abbas, M.S.; McGregor, F.; Fabbri, A.; Ferroukhi, M.Y. The Use of Pith in the Formulation of Lightweight Bio-Based Composites: Impact on Mechanical and Hygrothermal Properties. Constr. Build. Mater. 2020, 259, 120573. [Google Scholar] [CrossRef]
  42. Asadi, I.; Shafigh, P.; Abu Hassan, Z.F.B.; Mahyuddin, N.B. Thermal Conductivity of Concrete—A Review. J. Build. Eng. 2018, 20, 81–93. [Google Scholar] [CrossRef]
  43. Cannon, J.R. The One-Dimensional Heat Equation; Cambridge University Press: Cambridge, UK, 1984; ISBN 0-521-30243-9. [Google Scholar]
  44. Williams, J.; Lawrence, M.; Walker, P. A Method for the Assessment of the Internal Structure of Bio-Aggregate Concretes. Constr. Build. Mater. 2016, 116, 45–51. [Google Scholar] [CrossRef]
Figure 1. Microstructure of hemp shiv is reprinted with permission from Ref. [32]. 2018. Elsevier.-A, reprinted with permission from Ref. [12]. 2018. Elsevier.-B, (A-1,B-1) cross-section, (A-2,B-2) longitudinal section.
Constrmater 02 00011 g001
Figure 2. Multi-scale homogenization model for the thermal conductivity (The photograph of the sample on the right is reprinted with permission from Ref. [41]. 2020. Elsevier).
Constrmater 02 00011 g002
Figure 3. Multi-scale homogenization model for scale 2-binder.
Constrmater 02 00011 g003
Figure 4. Multi-scale homogenization model for scale 2.
Constrmater 02 00011 g004
Figure 5. Multi-scale homogenization model for scale 3-bio-aggregate.
Constrmater 02 00011 g005
Figure 6. Multi-scale homogenization model for scale 3-bio-based composite.
Constrmater 02 00011 g006
Figure 7. Multiple shapes of bio-aggregates in numerical models.
Constrmater 02 00011 g007
Figure 8. Effective thermal conductivity of binder (Experimental results as a comparison are from [21,38,40]).
Constrmater 02 00011 g008
Figure 9. Effective thermal conductivity of pore-moisture (Anisotropy = λ┴).
Constrmater 02 00011 g009
Figure 10. Effective thermal conductivity of hemp with porosity in various water saturation (WS: water saturation, λ║ and λ┴ denote the axial direction of hemp and the direction perpendicular to the axial direction, respectively).
Constrmater 02 00011 g010
Figure 11. Variation in effective thermal conductivity with water saturation for hemp shiv.
Constrmater 02 00011 g011
Figure 12. Testing of mesh element size.
Constrmater 02 00011 g012
Figure 13. Comparison of numerical simulation with experimental data from [23,40].
Constrmater 02 00011 g013
Figure 14. Effective thermal conductivity of composite with water saturation.
Constrmater 02 00011 g014
Figure 15. Comparison of (A) thermal conductivity and (B) anisotropy in multiple homogenization steps.
Constrmater 02 00011 g015
Figure 16. Comparison of bio-aggregates in various shapes.
Constrmater 02 00011 g016
Figure 17. Analysis of plant fiber orientation based on finite element results (the compaction direction is in the X-axis. (A)—thermal flux X, (B)—thermal flux Z).
Constrmater 02 00011 g017
Table 1. Properties of hemp shiv.
PropertyValueReference
Particle density (kg/m3)265[33]
Solid density (kg/m3)1454[34]
Length (mm)4–8 mm[34]
Width (mm)1–2 mm[34]
Porosity (%)81.8[34]
Specific heat capacity (J/(kg·K))1320/1247/1272[33,35,36]
Thermal conductivity of solid (W/(m·K))0.564/0.576[34,37]
Note: The first value in these multiple options is selected for the model.
Table 2. Properties of binder.
PropertyValueReference
Density (kg/m3)1079[38]
Porosity (%)50.6/54.8[21,38]
Specific heat capacity (J/(kg·K))890/859[35,39]
Thermal conductivity of solid (W/(m·K))0.24/0.277[38,40]
Pore size diameter (μm)0.02–4[38]
Note: The first value in these multiple options is selected for the model.
Table 3. Volume fraction of each phase in hemp construction material from [12].
PhasesVolume Fraction
Binder0.30
Hemp0.55
Macro pore0.15
Publisher’s Note: MDPI stays neutral with regard to jurisdictional claims in published maps and institutional affiliations.