Aiming to understand the feasibility, characteristics, and performance of earthen construction, a study was conducted in the Laboratory of Building Materials, Civil Engineering Department, University of Minho. First, the soil was characterized from the geotechnical perspective to identify its properties and indicate the need for soil correction in order to use it as a building material. Then, the soil was prepared, and a plan was made for the production of CEBs and RE specimens with different binder materials, additions, and coatings in order to evaluate their performance, considering different constructive options. Finally, the specimens were submitted to several durability tests: accelerated erosion by water jet; a visual and qualitative analysis with a pachymeter; an ultrasonic analysis; and a verification of mechanical strength loss by compression.
5.1. Materials and Composition of the Specimens
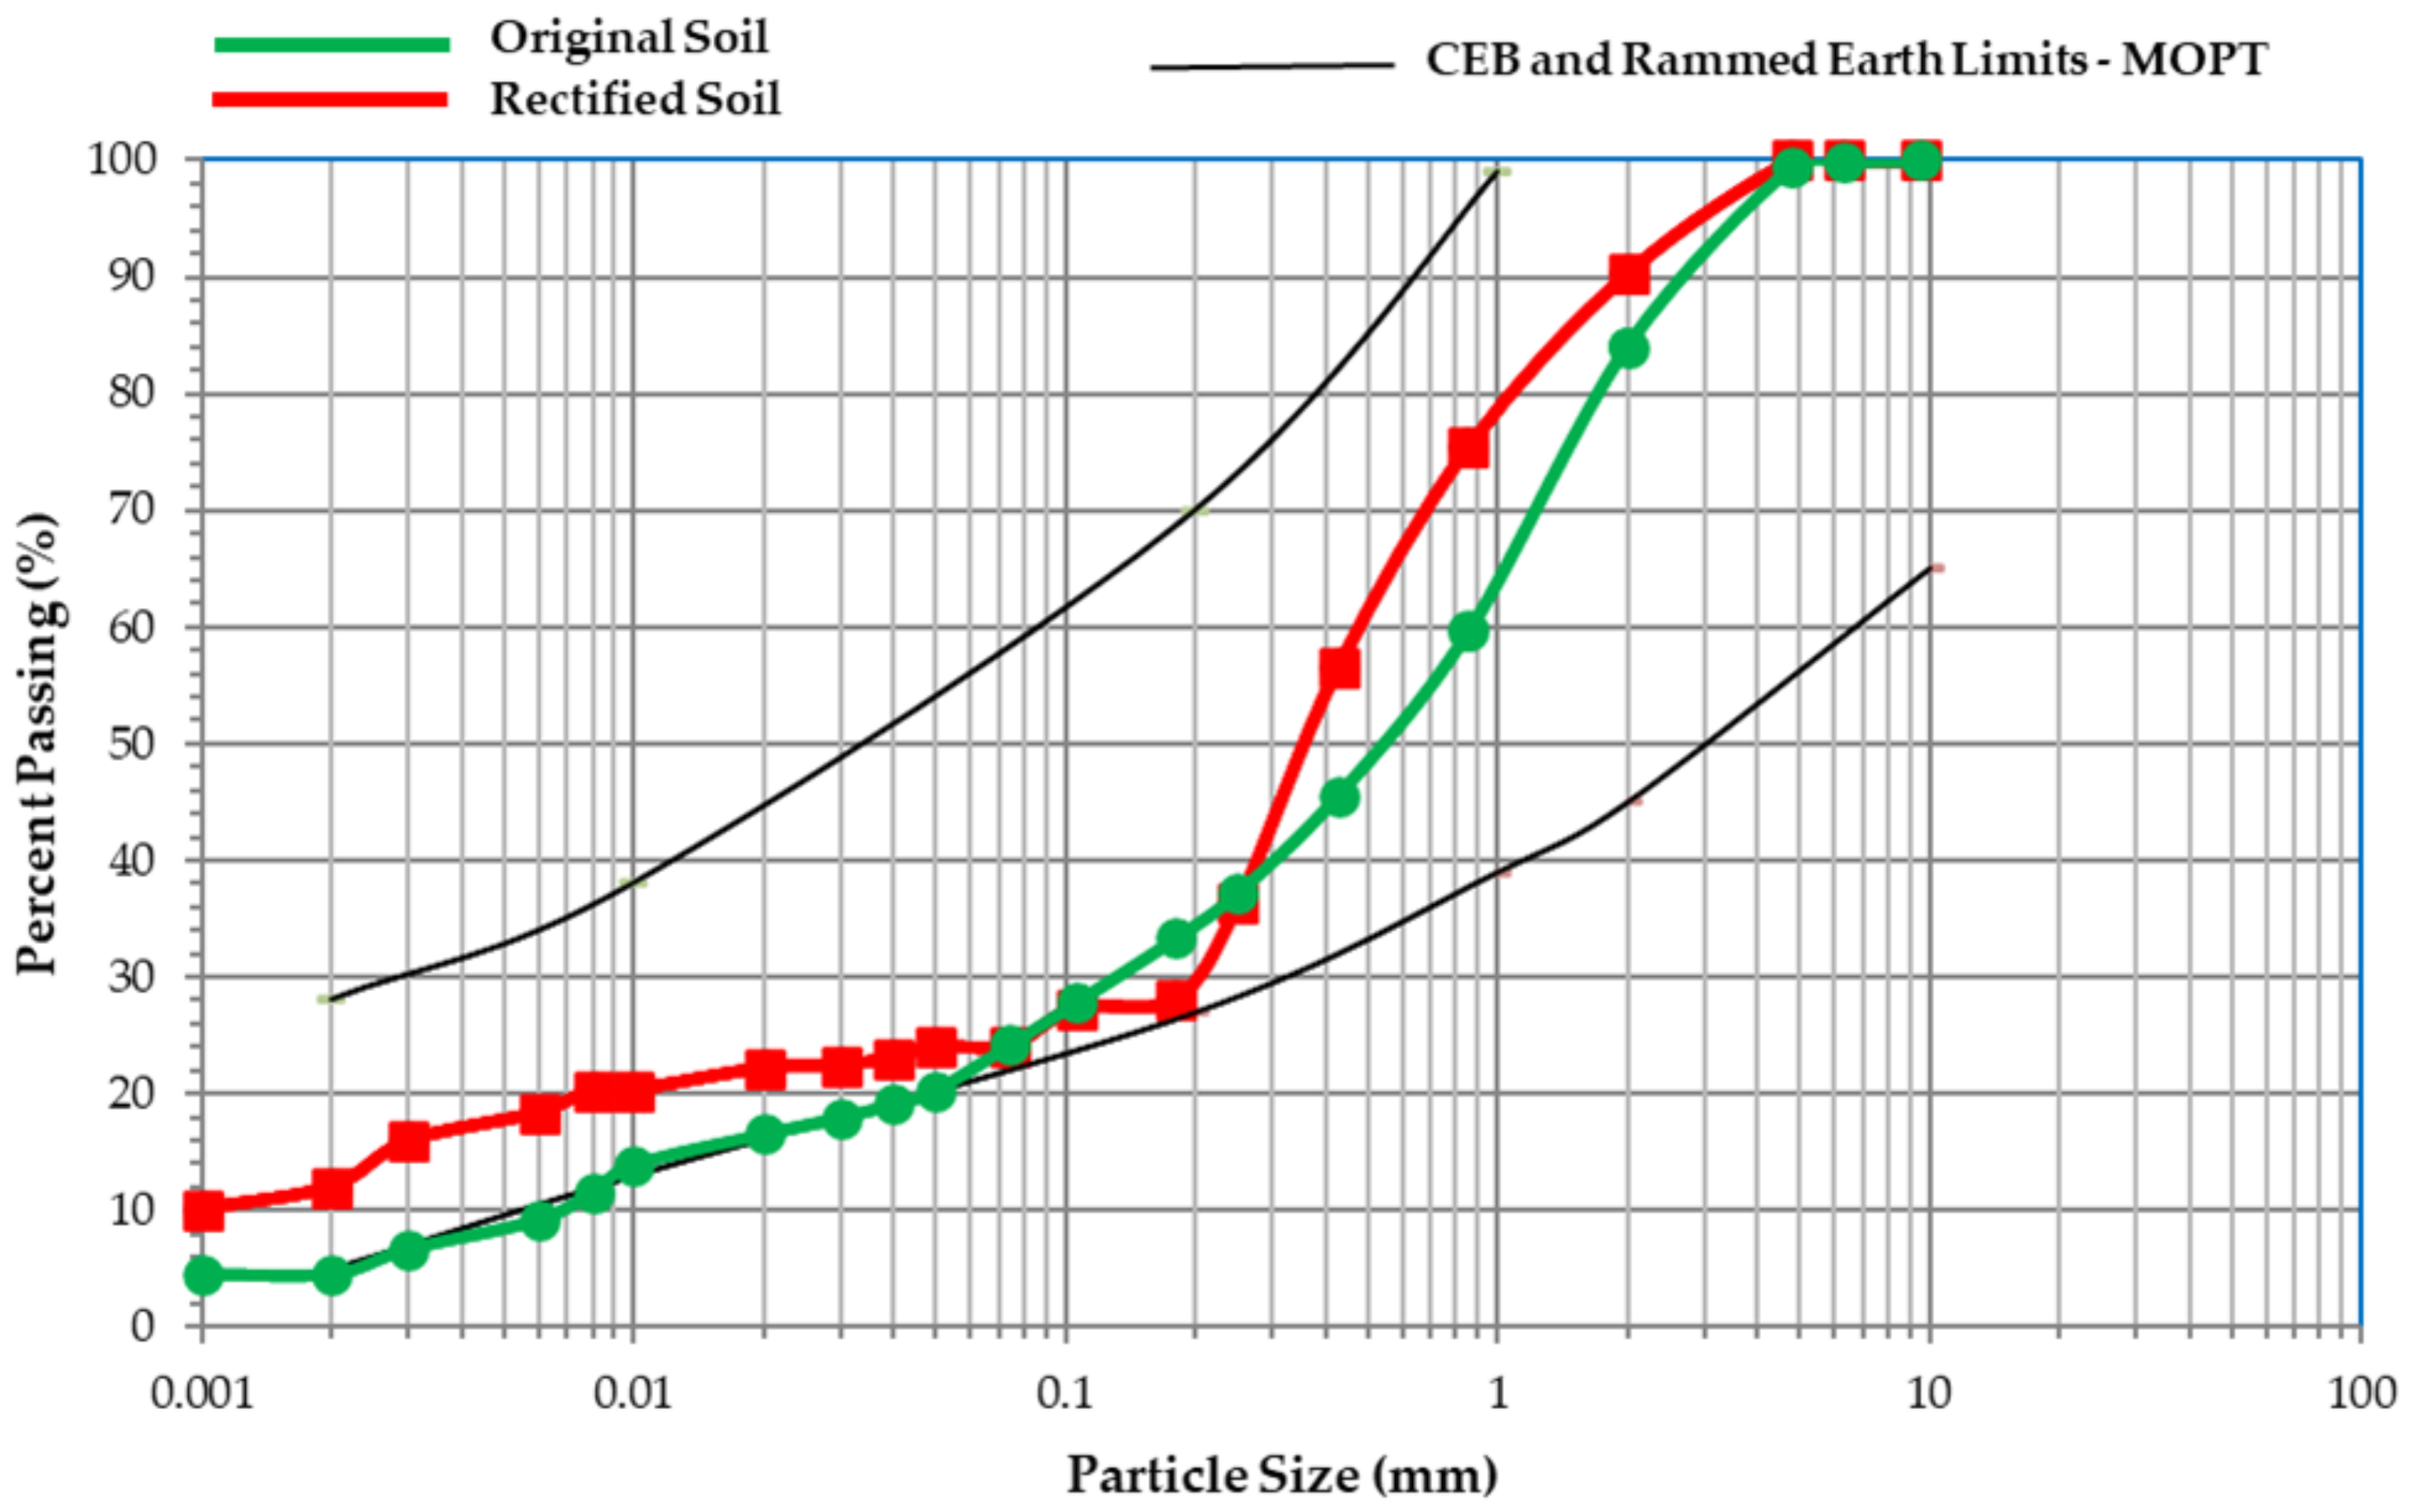
The soil used in this study was obtained from the Minho region in Portugal and was characterised through field and laboratory tests. In the first contact, observation, and field tests, it was possible to notice that it had a very rough and sandy characteristic. With little plasticity, the soil presented a need for correction with clay particles to become more propitious for earthen construction experiments, and 8% kaolin was added to facilitate this process. The granulometric curves of the original soil and the soil with the addition of kaolin can be observed in
Figure 6 and are within the ideal parameters for useful soil in construction [
22]. A granulometric analysis of the soil by sedimentation was carried out based on the LNEC E-196 standard [
23]. The study used a clear, yellowish kaolin which was washed with a hydrocyclone and dried at the factory. According to data provided by the company Mibal, kaolin has a density that varies between 2.4 and 2.7 g/cm
3 and a fineness that is essentially between 2 and 30 μm. To reduce the shrinkage content, the soil used for producing the RE specimens was supplemented with 40% fine gravel (up to 10 mm).
Binding materials such as cement and aerated lime (quicklime and hydrated lime) were individually added to the soil at 6% of the soil mass. These binders are the most common in earthen construction and have the function of increasing the water resistance of the soil, also increasing the compressive strength. The study utilized a limestone Portland cement CEM II/A-L 42.5R, certified in accordance with NP EN 197-1 (2001) [
25]. The cement contained 80–94% clinker, 6–20% limestone, and calcium sulfate as a setting regulator. The material’s technical data sheet recommends it for soil–cement applications [
26]. Hydrated lime CL90 which complied with the European Standard EN 459-1 [
27] was used in the study. Micronized quicklime from the brand Maxical was also used.
The CEBs, blocks with dimensions of 22 × 10 × 13.5 cm
3, were produced in a manual press. The rammed-earth specimens were produced using a pneumatic compactor and a wooden pestle with which the earth was compacted in 5 cm layers inside iron forms, forming 15 × 15 × 15 cm
3 blocks. The soil hydration of all specimens was up to 14% of the soil volume, and in the case of the addition of quicklime, more than half of its volume of water was added for previous hydration. For the mixture of soil with quicklime, the old method of hot hydration was used, that is, 48 h before the preparation of the specimens, alternating layers of soil and lime with water irrigation were placed in a container [
2,
10]. The curing period was 30 days at room temperature (approximately 20 °C and 60% RH).
Specimens without addition and specimens with different types of finish were also produced to evaluate the durability of earthen construction under different protection conditions. These were also used to evaluate the quality of the surface finish on the specimens as healthier and more natural and affordable alternatives. Part of the studied specimens, those without addition or with lime addition (quick or hydrated), received various finishes: lime mortars with and without hemp fibres, used to aid adhesion and reduce shrinkage damage; lime paints with pigments;
aloe vera paint [
28]; olive oil soap, reproducing part of the Moroccan technique of
tadelakt [
29]; cooking oil already used with caustic soda [
10]; and handmade varnish, which included beeswax and pine resin among its components. Further information about all the materials used in the specimens can be found in [
1].
Table 1 presents the composition of each specimen, noting that only one of each type was subjected to erosion and compressive strength testing. CEBs 2, 3, and 7 were specifically chosen for compressive strength testing to enable a meaningful comparison with similar specimens.
The CEBs 1, 3, and 5 were made simulating mini walls using two CEBs of each type of addition, cement, hydrated lime and quicklime; this latter (CEB 5) still received a traditional varnish paint finish. The CEBs were joined using 170 mm spread mortars prepared with the respective additives (cement, hydrated lime, or quicklime) in accordance with the EN 1015-3 standard (1999) [
30]. These mortars were also reinforced with hemp fibres to improve adhesion and reduce shrinkage damage. The specimens were tested in a coupled format solely for the erosion test. Subsequently, compressive strength testing was performed on the specimens, with the specimens evaluated separately.
For some RE specimens, finishing mortars of quicklime and hydrated lime of 160 mm spread were made with and without hemp fibres to be applied on the surfaces of some specimens of quicklime and hydrated lime. Some surfaces were also painted for finishing and protective purposes. The specimens were subjected to a water erosion test and then tested mechanically under compression.
5.2. Performed Tests
The CEB and RE specimens were tested mainly for their durability with the accelerated erosion by water jet test, alternated with drying periods to simulate rain. Complementary tests were also performed, such as a visual qualitative evaluation and dimensional evaluation using a pachymeter and mechanical resistance by compression.
5.2.1. Accelerated Erosion
This test is based on the ASTM D559 [
31] standard and the method developed by Rezende [
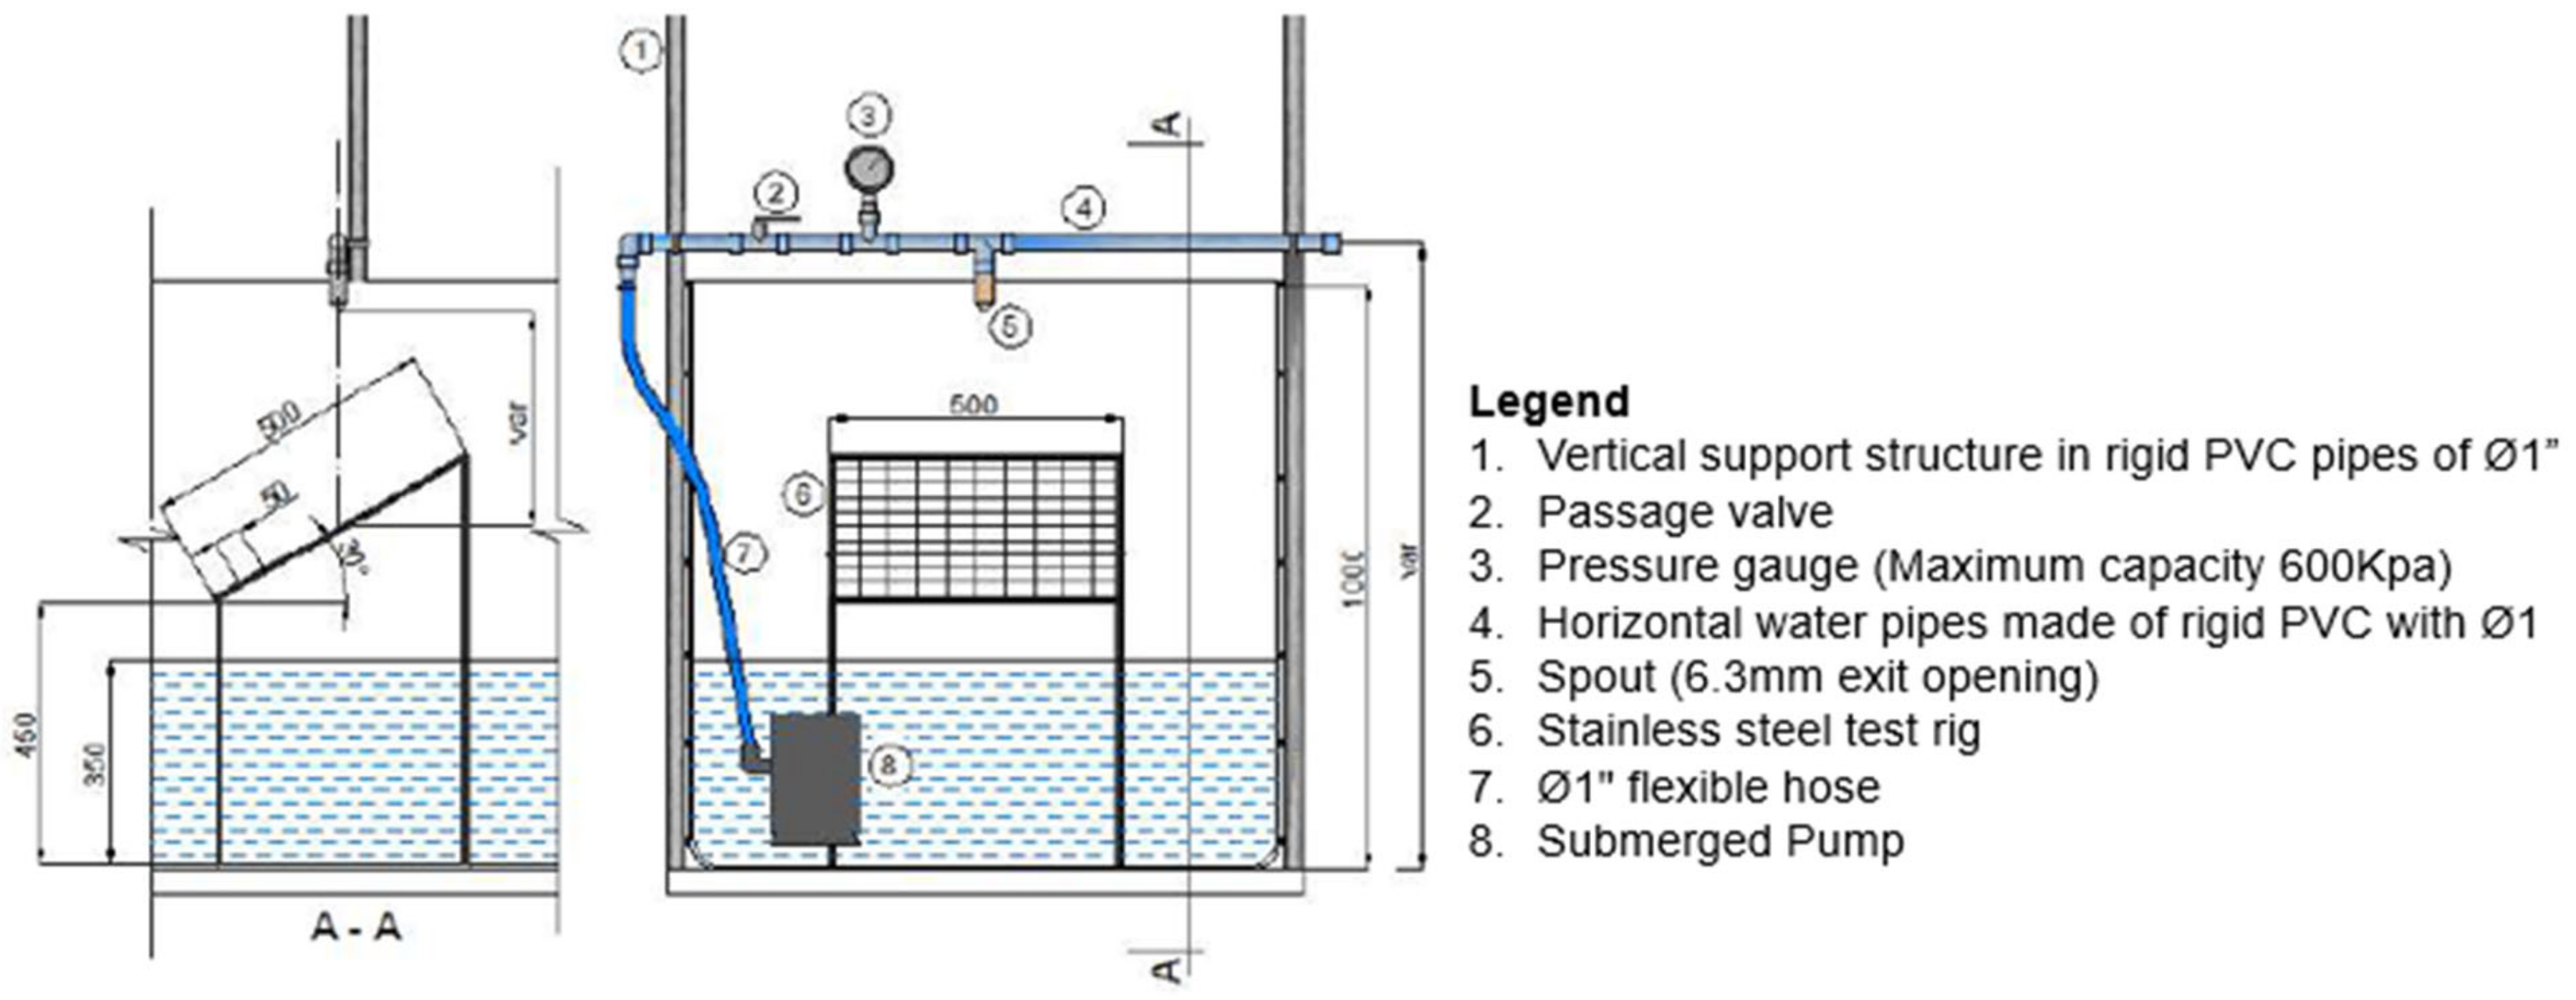
32] to evaluate an accelerated degradation test rain simulator. At 60 days of curing, the samples were placed in an oven at 70 °C for an initial drying period. They were then weighed and left at an ambient temperature for a few hours to cool down. The rain simulation was then initiated, alternating with drying periods of at least 14 h at 70 °C in an oven. During the rain simulation, the specimens were positioned on a 50 mm × 50 mm stainless steel grid platform that allowed the water to fall (
Figure 7). The wetting and drying cycles were repeated for three consecutive days. The water erosion test simulated periods of rain, considering the highest average annual rainfall in Portugal and corresponding to an exposure time to weathering of between 43 and 64 years, depending on the type of specimen and distance from the water jet, according to the methodology of Rezende et al. [
32]. Therefore, the longevity level of the two studied construction techniques can be estimated.
The sample was subjected to a flow rate of 14.26 litres/min and a water outlet pressure at the nozzle of 45 kPa, which is consistent with the pressure values for erosion tests referenced in international standards [
32], see also
Figure 8. The results were analysed after three cycles, and the mass losses and changes in the water volume of the specimens were verified. The mass variation was checked at the end of each cycle, and the ratio between the mass of the specimen after the first and third cycles was used to evaluate the change in mass of the specimens. The result was computed based on the NBR 13554 standard [
33]. Following each rain simulation cycle to which the specimens were subjected, a visual evaluation was performed to document the changes.
5.2.2. Ultrasonic Velocity
This test was conducted to measure the speed of wave propagation through the compacted or compressed earth. It was intended to obtain information regarding the homogeneity of specimens after durability tests, to evaluate the presence of voids or the existence of cracks, and to relate the obtained values to the compressive strength values of the material. An initial ultrasonic evaluation was performed on each group of specimens before they were subjected to rain and drying simulation cycles. Subsequently, the same ultrasonic evaluation was performed to determine what internal changes specimens might have undergone after the three durability test cycles to which they were submitted.
The direct reading method was followed to obtain results with greater accuracy because the distance between the transducers is more precise, ensuring linearity, and the maximum vibration energy is transmitted perpendicular to the face of the transducers, thus providing more reliable travel times.
The equipment used was the
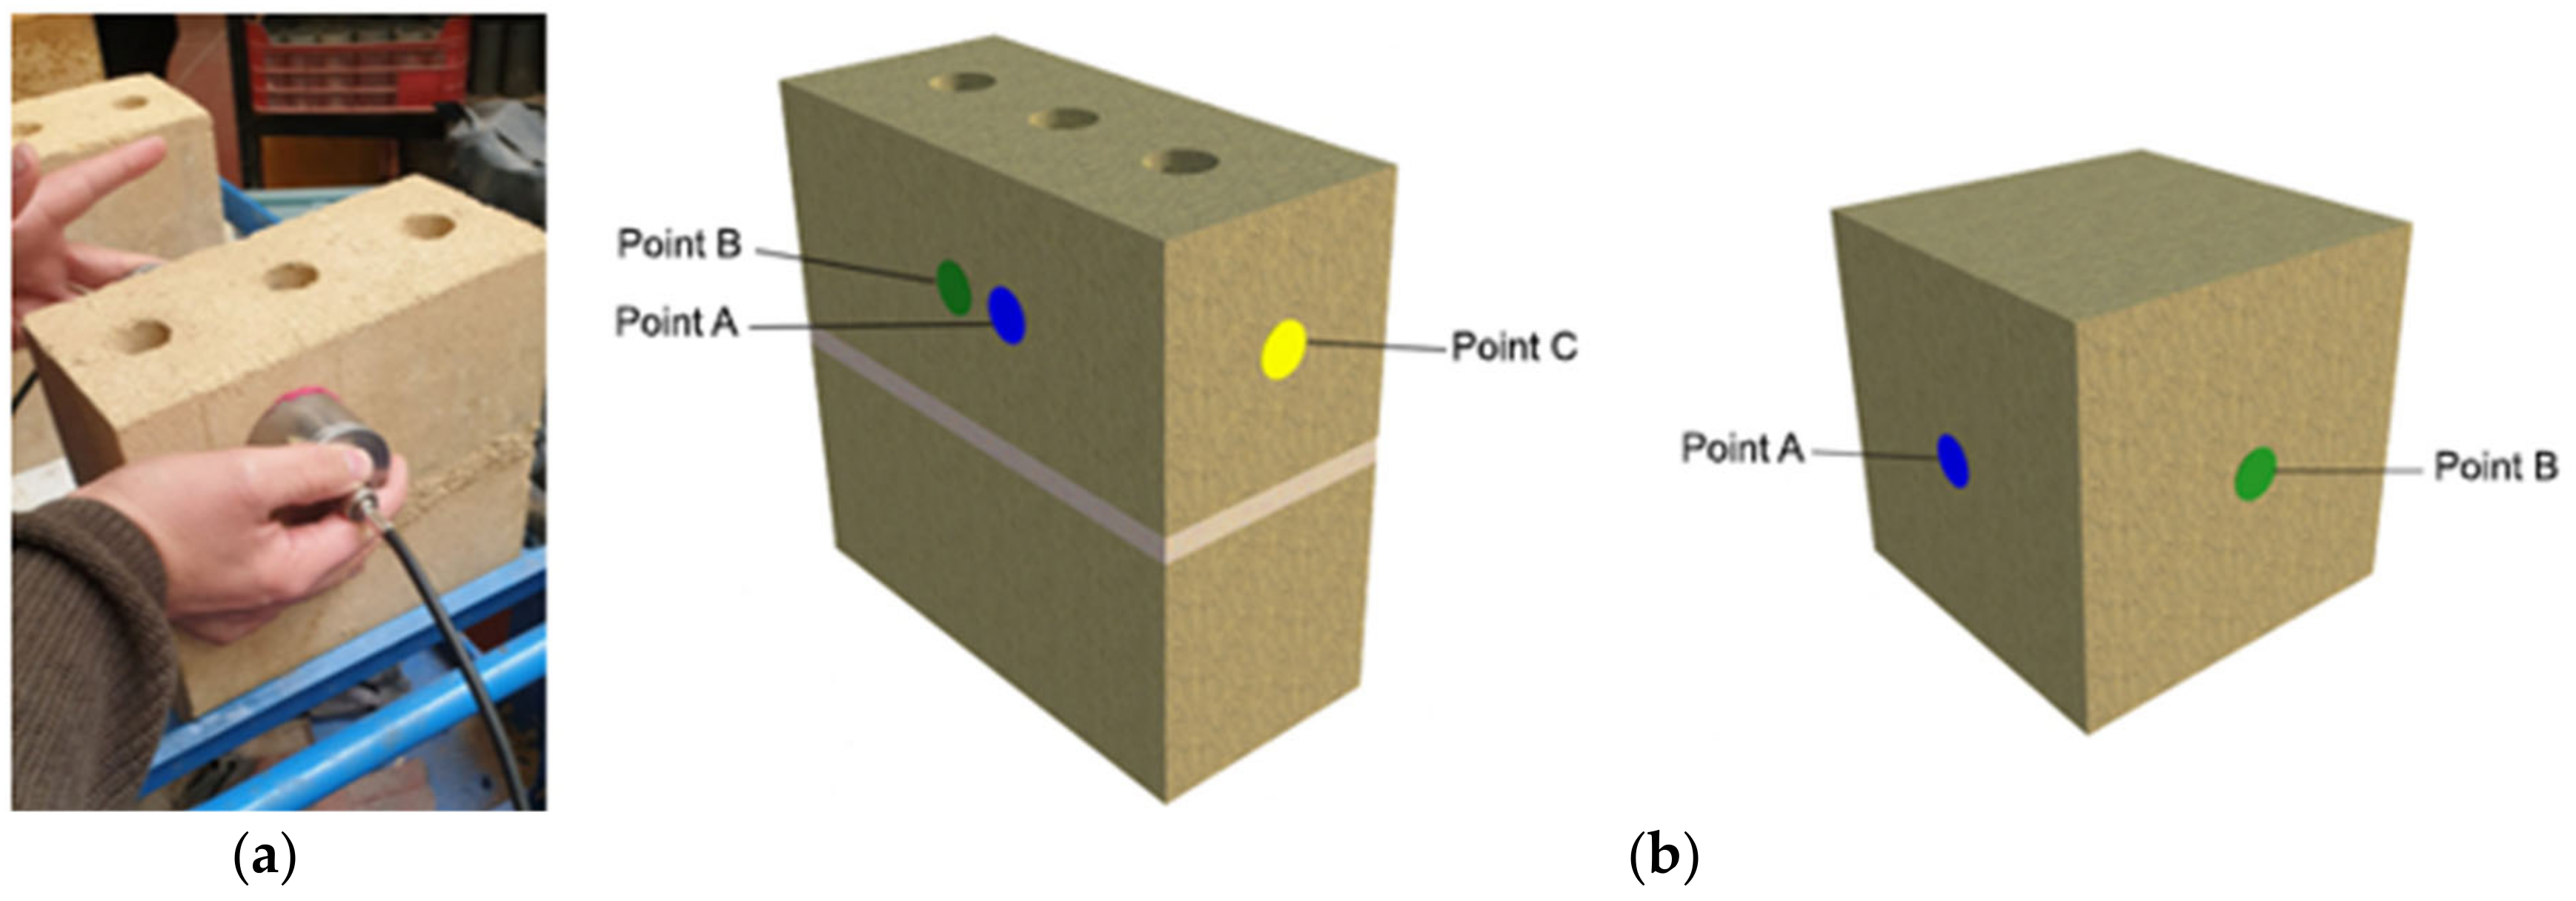
Pundit Lab + Ultrasonic Instrument from PROCEQ. With cylindrical transducers, a mass was used as a conductor between the transducers and the specimens’ surfaces. Prior to the beginning of the measurement, it was always necessary to calibrate the transducers so that they had a calibration of 25.4 μs. The frequency used was 54 kHz, the length to be measured and adjusted before each measurement [
34]. The testing process was based on EN 12504-4 [
35], and
Figure 9 shows the reference points for the measurement of the RE and CEB specimens.
As direct measurements of the specimens were made, the transducers were positioned face-to-face on opposite sides of the specimens, and each measurement was performed three times and then averaged. The readings were made before the durability tests and at the end of the cycles. The measuring distances are present in
Table 2.
5.2.3. Compressive Strength
The compressive strength test was performed based on EN 772 [
36] to evaluate the compressive strength of the CEB and RE specimens. With this test, it was possible to compare the strength of the samples submitted to the durability test against the result of the strength of the samples that were not submitted to the test and that had the same characteristics and type of addition.
As the study also tested CEB specimens joined by mortar in the erosion test (CEBs 1, 3 and 5), the blocks that remained attached during the erosion test were disconnected for the compressive strength test. The upper units of the connected blocks that demonstrated the most significant changes during the erosion test were selected for the compressive strength evaluation. The mortar was then completely removed from these blocks before testing to ensure that all specimens could be compared equally for compression strength testing. Moreover, it is recommended that for earth blocks with nominal heights greater than 71 mm, compressive strength should be evaluated separately for the entire block, in accordance with the references [
37,
38].
Another study in 2018 investigated experimental procedures to propose suitable testing methods for adoption as standards [
39]. It concluded that a slenderness ratio of two would be optimal for testing soil mechanics, resulting in accurate measurements of friction (due to confinement from the press platen), the gradient of dry density, and volume (including gravel or small stones) in earth samples. It was emphasised that compression tests on samples with a smaller slenderness ratio would yield unrealistic results [
40]. However, while producing samples with a slenderness ratio of two is relatively easy for rammed earth or cob, it is more challenging for CEBs and adobe. While some proposals have emerged, including overlapping blocks joined by mortar [
41], no consensus has been reached [
39]. The DIN 18945 standard states that for earth blocks with a nominal height ≤ 71 mm, the compressive strength test should be carried out on two half-blocks stacked on top of each other and connected by a cement mortar [
37,
38].
To perform the test, a monotonic compressive load was uniformly distributed and continuously incremented until rupture after 1 min. The direction of compression applied to the specimens was perpendicular to the specimen faces that were tested with water exposure and where the finishes were applied, acting in the same direction as the models were compressed or compacted, thus simulating the load that the material would suffer in real construction.
5.3. Test Results
5.3.1. Accelerated Erosion
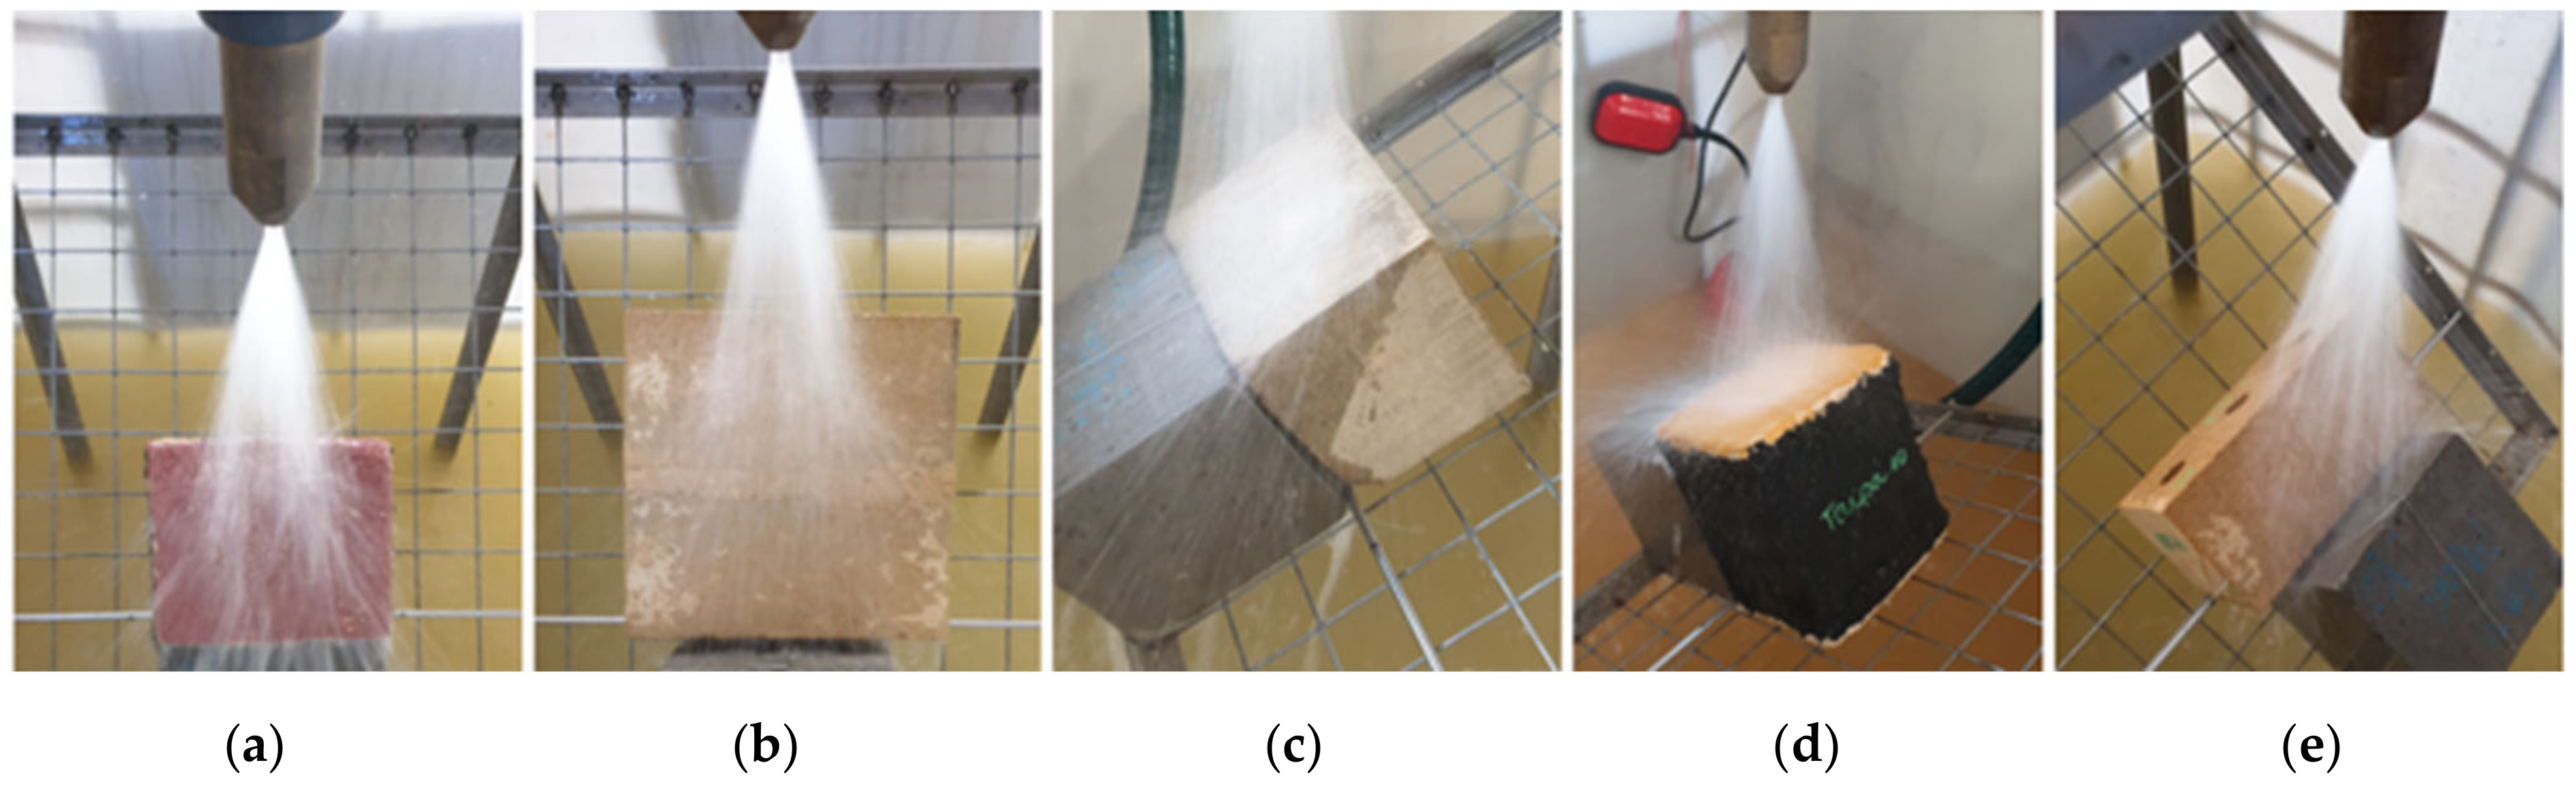
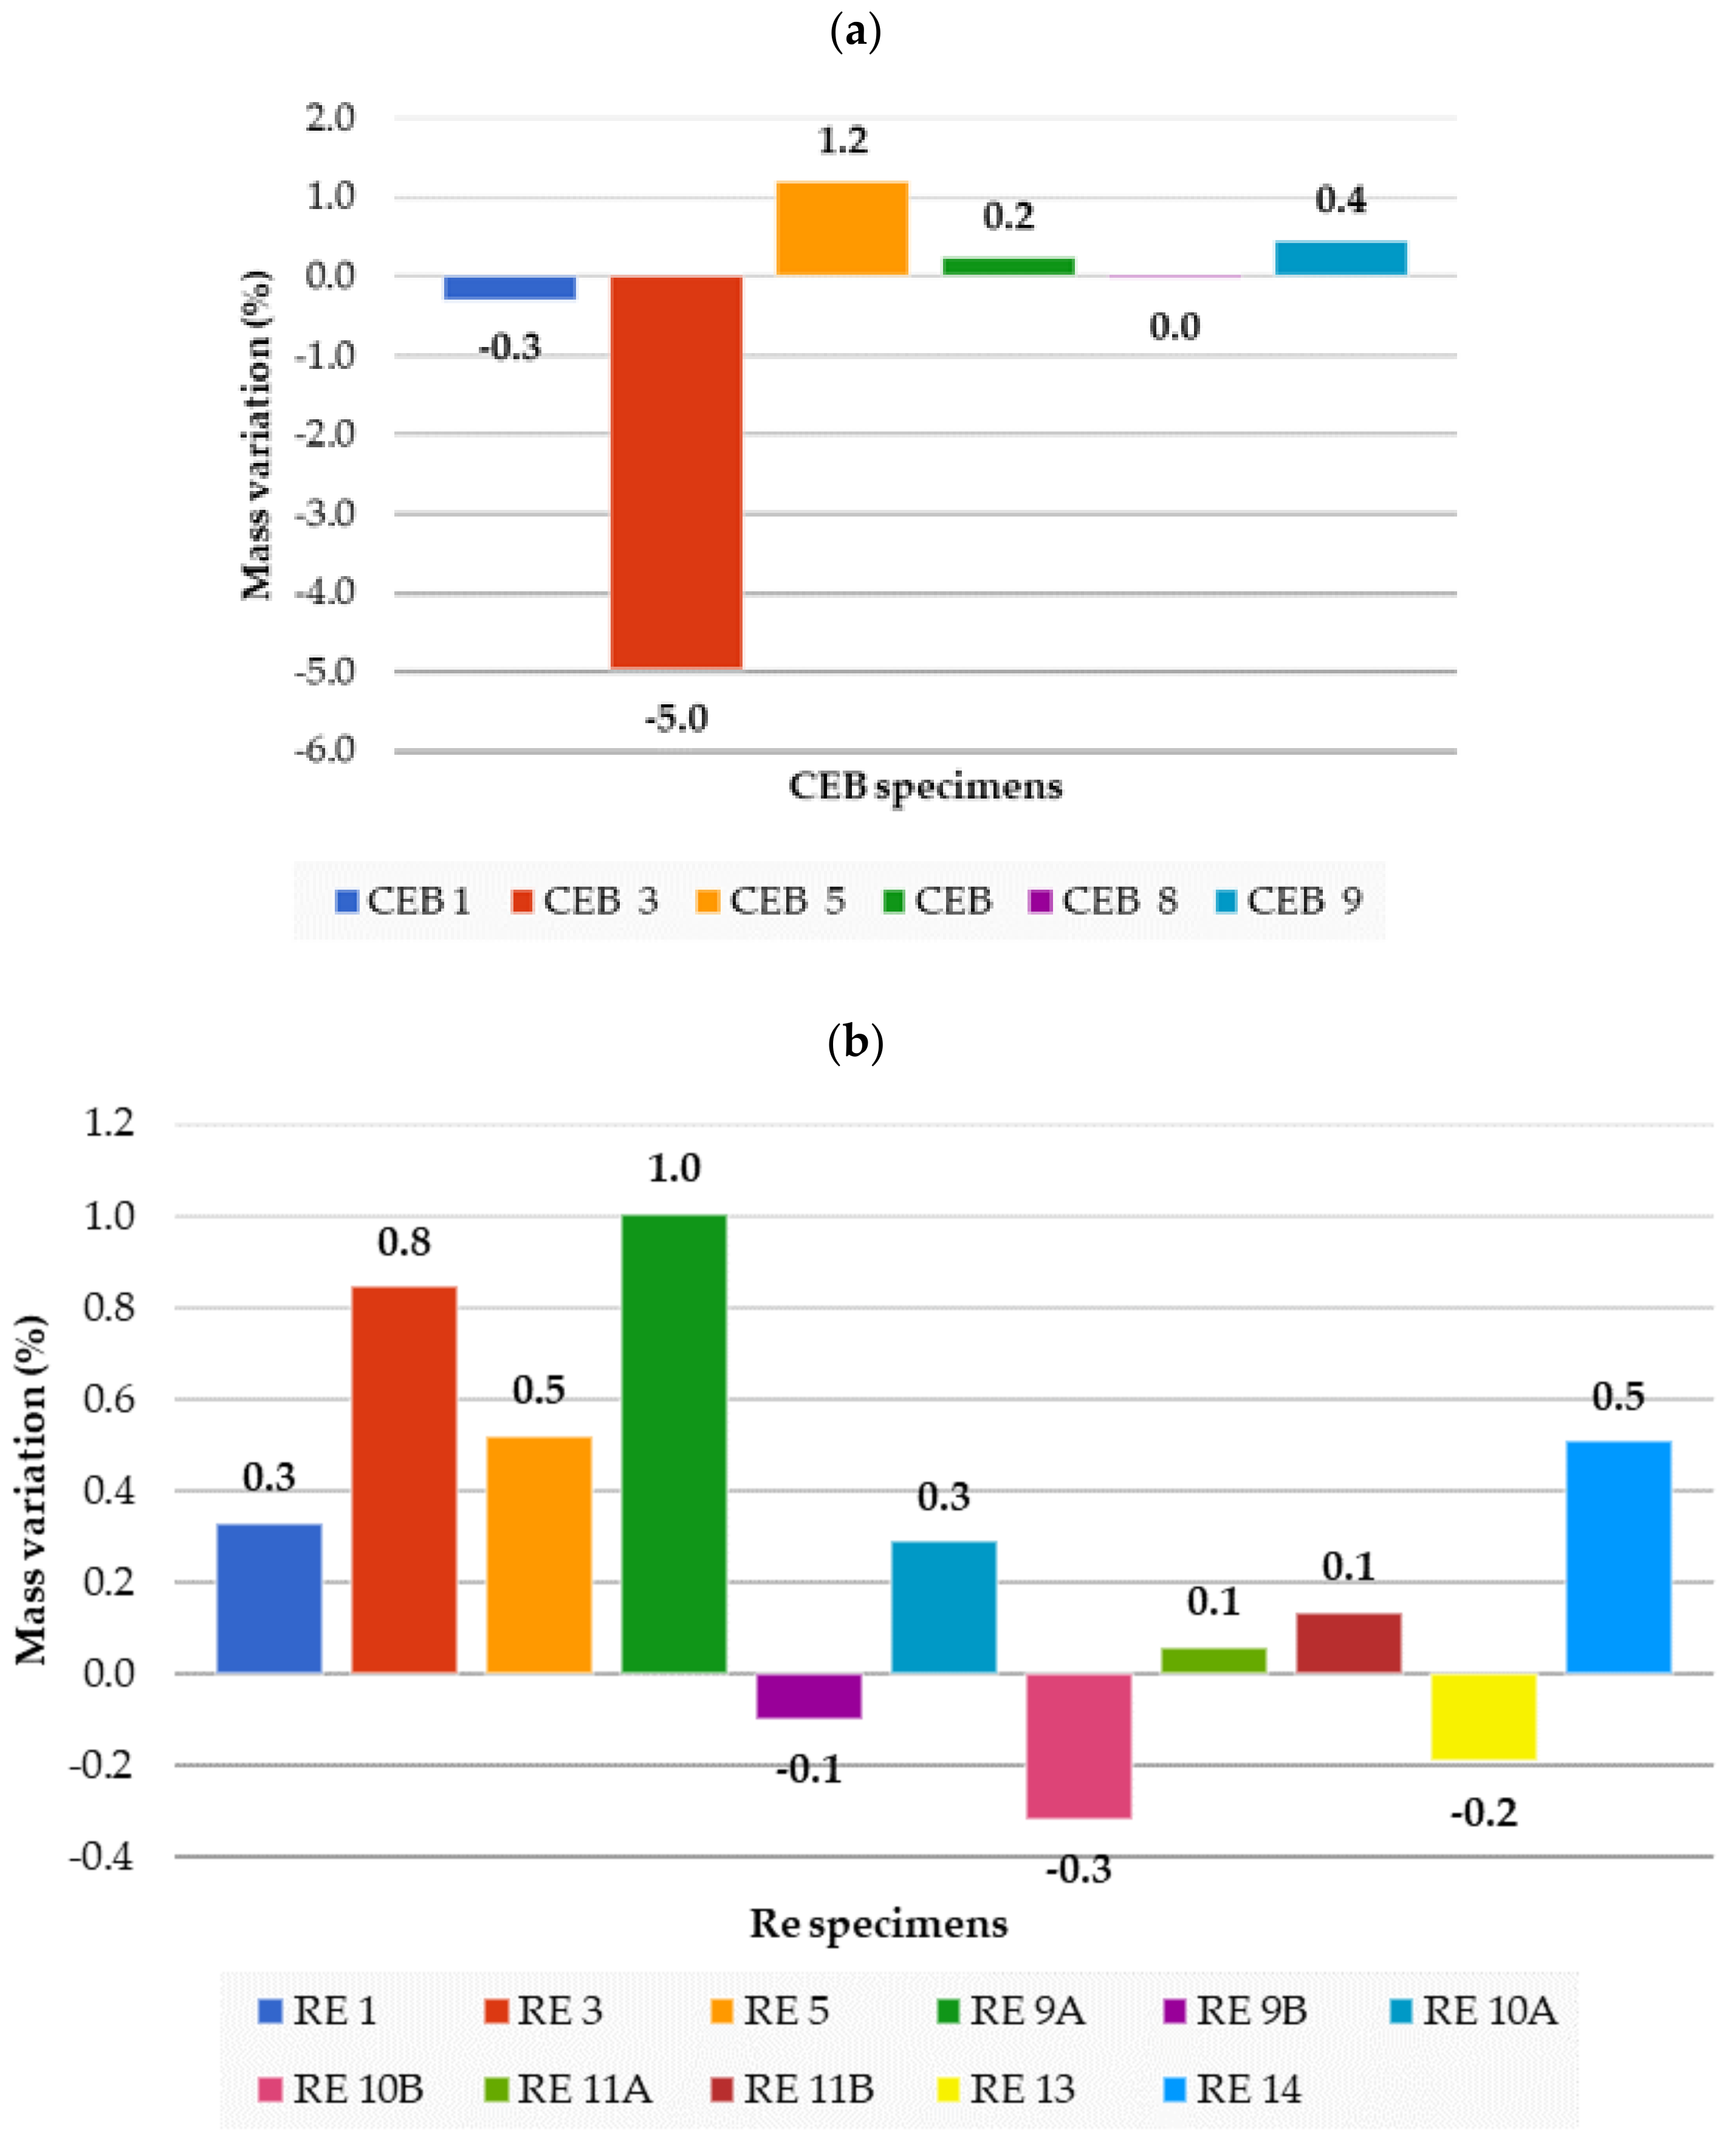
During the cycles, all visual changes suffered by the specimens were observed, such as colour change, the appearance of or increase in cracks or holes, a change in surface texture, and the loss of protective finishing. Regarding mass loss, some non-stabilised samples suffered a significant mass loss in the erosion test, resulting one of the non-stabilised rammed earth specimens losing more than 42% of its mass in 15 min of exposure to water. However, specimens with stabilizing materials or with coating mortars obtained lower variation values that were almost null (
Figure 10).
Depending on the composition of the specimens, some showed no signs of erosion and even increased in mass. However, with the addition of hydrated, the specimen CEB 3 experienced a 5% decrease in mass, which suggests a potential material loss or an increase in voids. Despite this loss, there were no visual indications of mass loss. The study by Guettala [
10] on CEB revealed that there is a mass loss of 1% in soils with the addition of 5% cement and a mass loss of 2% in soils with the addition of 8% lime, which compares well with the results obtained in this study, see
Figure 6. One factor that masks the mass loss is the drying period, which may not be sufficiently long enough to completely evaporate the water contained in the specimens at the time of measurement. Repeating the tests with specimens of the same type can also help to identify the variation trend of each type of composition.
The results of the visual and pachymeter surveys of selected specimens subjected to wetting and drying cycles during a rain simulation test are presented in
Table 3 and
Table 4. These tables describe and quantify the observed degradation of each specimen, providing valuable insights into the potential damage caused by the test.
5.3.2. Ultrasonic Velocity
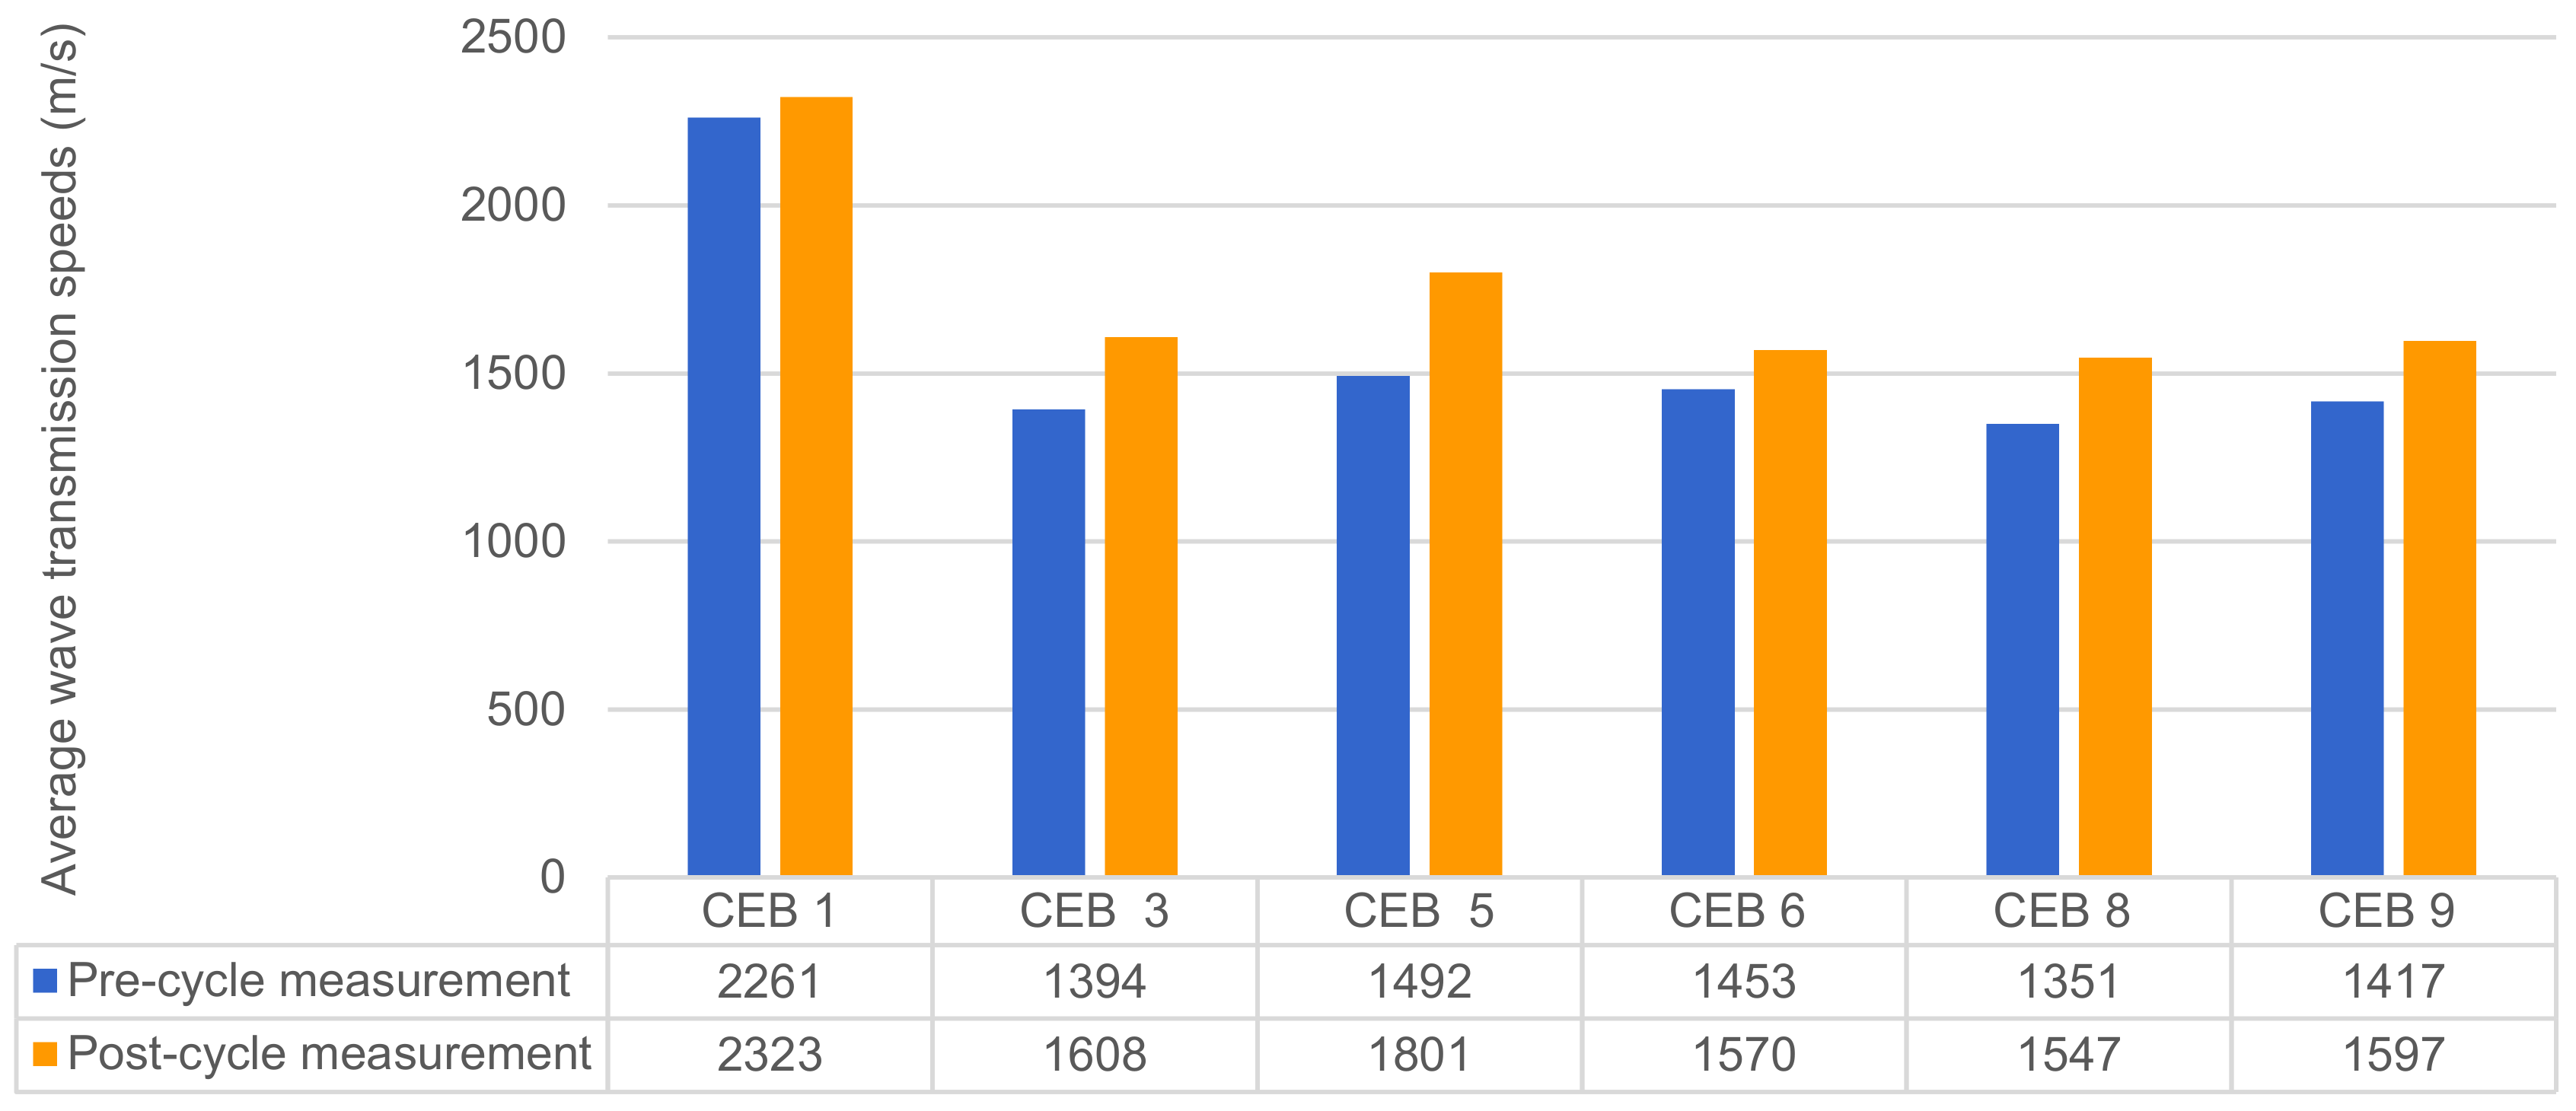
Figure 11 shows the average of the three ultrasonic readings taken before and after the cycles. CEB 1, which received cement additions, demonstrated a velocity significantly higher than the other CEBs with lime additions. This difference seems to indicate that the presence of cement reduces the voids inside the sample, but more tests would be needed to prove this.
Concerning the variation in wave velocity in the CEBs before and after the cycles, it is possible to observe that this variation is always positive. In the case of cement, the presence of water increased the formation of solid crystals and promoted the cohesion of the material. In the case of quicklime, the hardening was due to carbonation, which can also be increased in the presence of water since water carries CO2, also promoting the cohesion of the material. However, it takes a long time due to the slow carbonation process, which justifies the higher values since the first measurement for specimens with cement at the test age (between 60 and 70 days). Another study using specimens stabilised with lime stated that the honeycomb structures can be broken up but will agglomerate again and form more entangled structures that improve cohesion; although they have more voids, they have less bonding between them [
42].
It can also be seen that the specimens with added lime obtained greater variations before and after the cycles. CEB 5, with the addition of quicklime and traditional varnish painting, was demonstrated the greatest variation of more than 20%. This may be because the drying time was insufficient for this specimen due to the varnish layer. It was observed during the tests that this specimen created an area of vapour between its base and the surface where it rested during the ultrasonic measurements. Among the CEBs with a lime addition, CEB 6, which had a lime addition and was without finishing, presented the lowest variations in wave velocity.
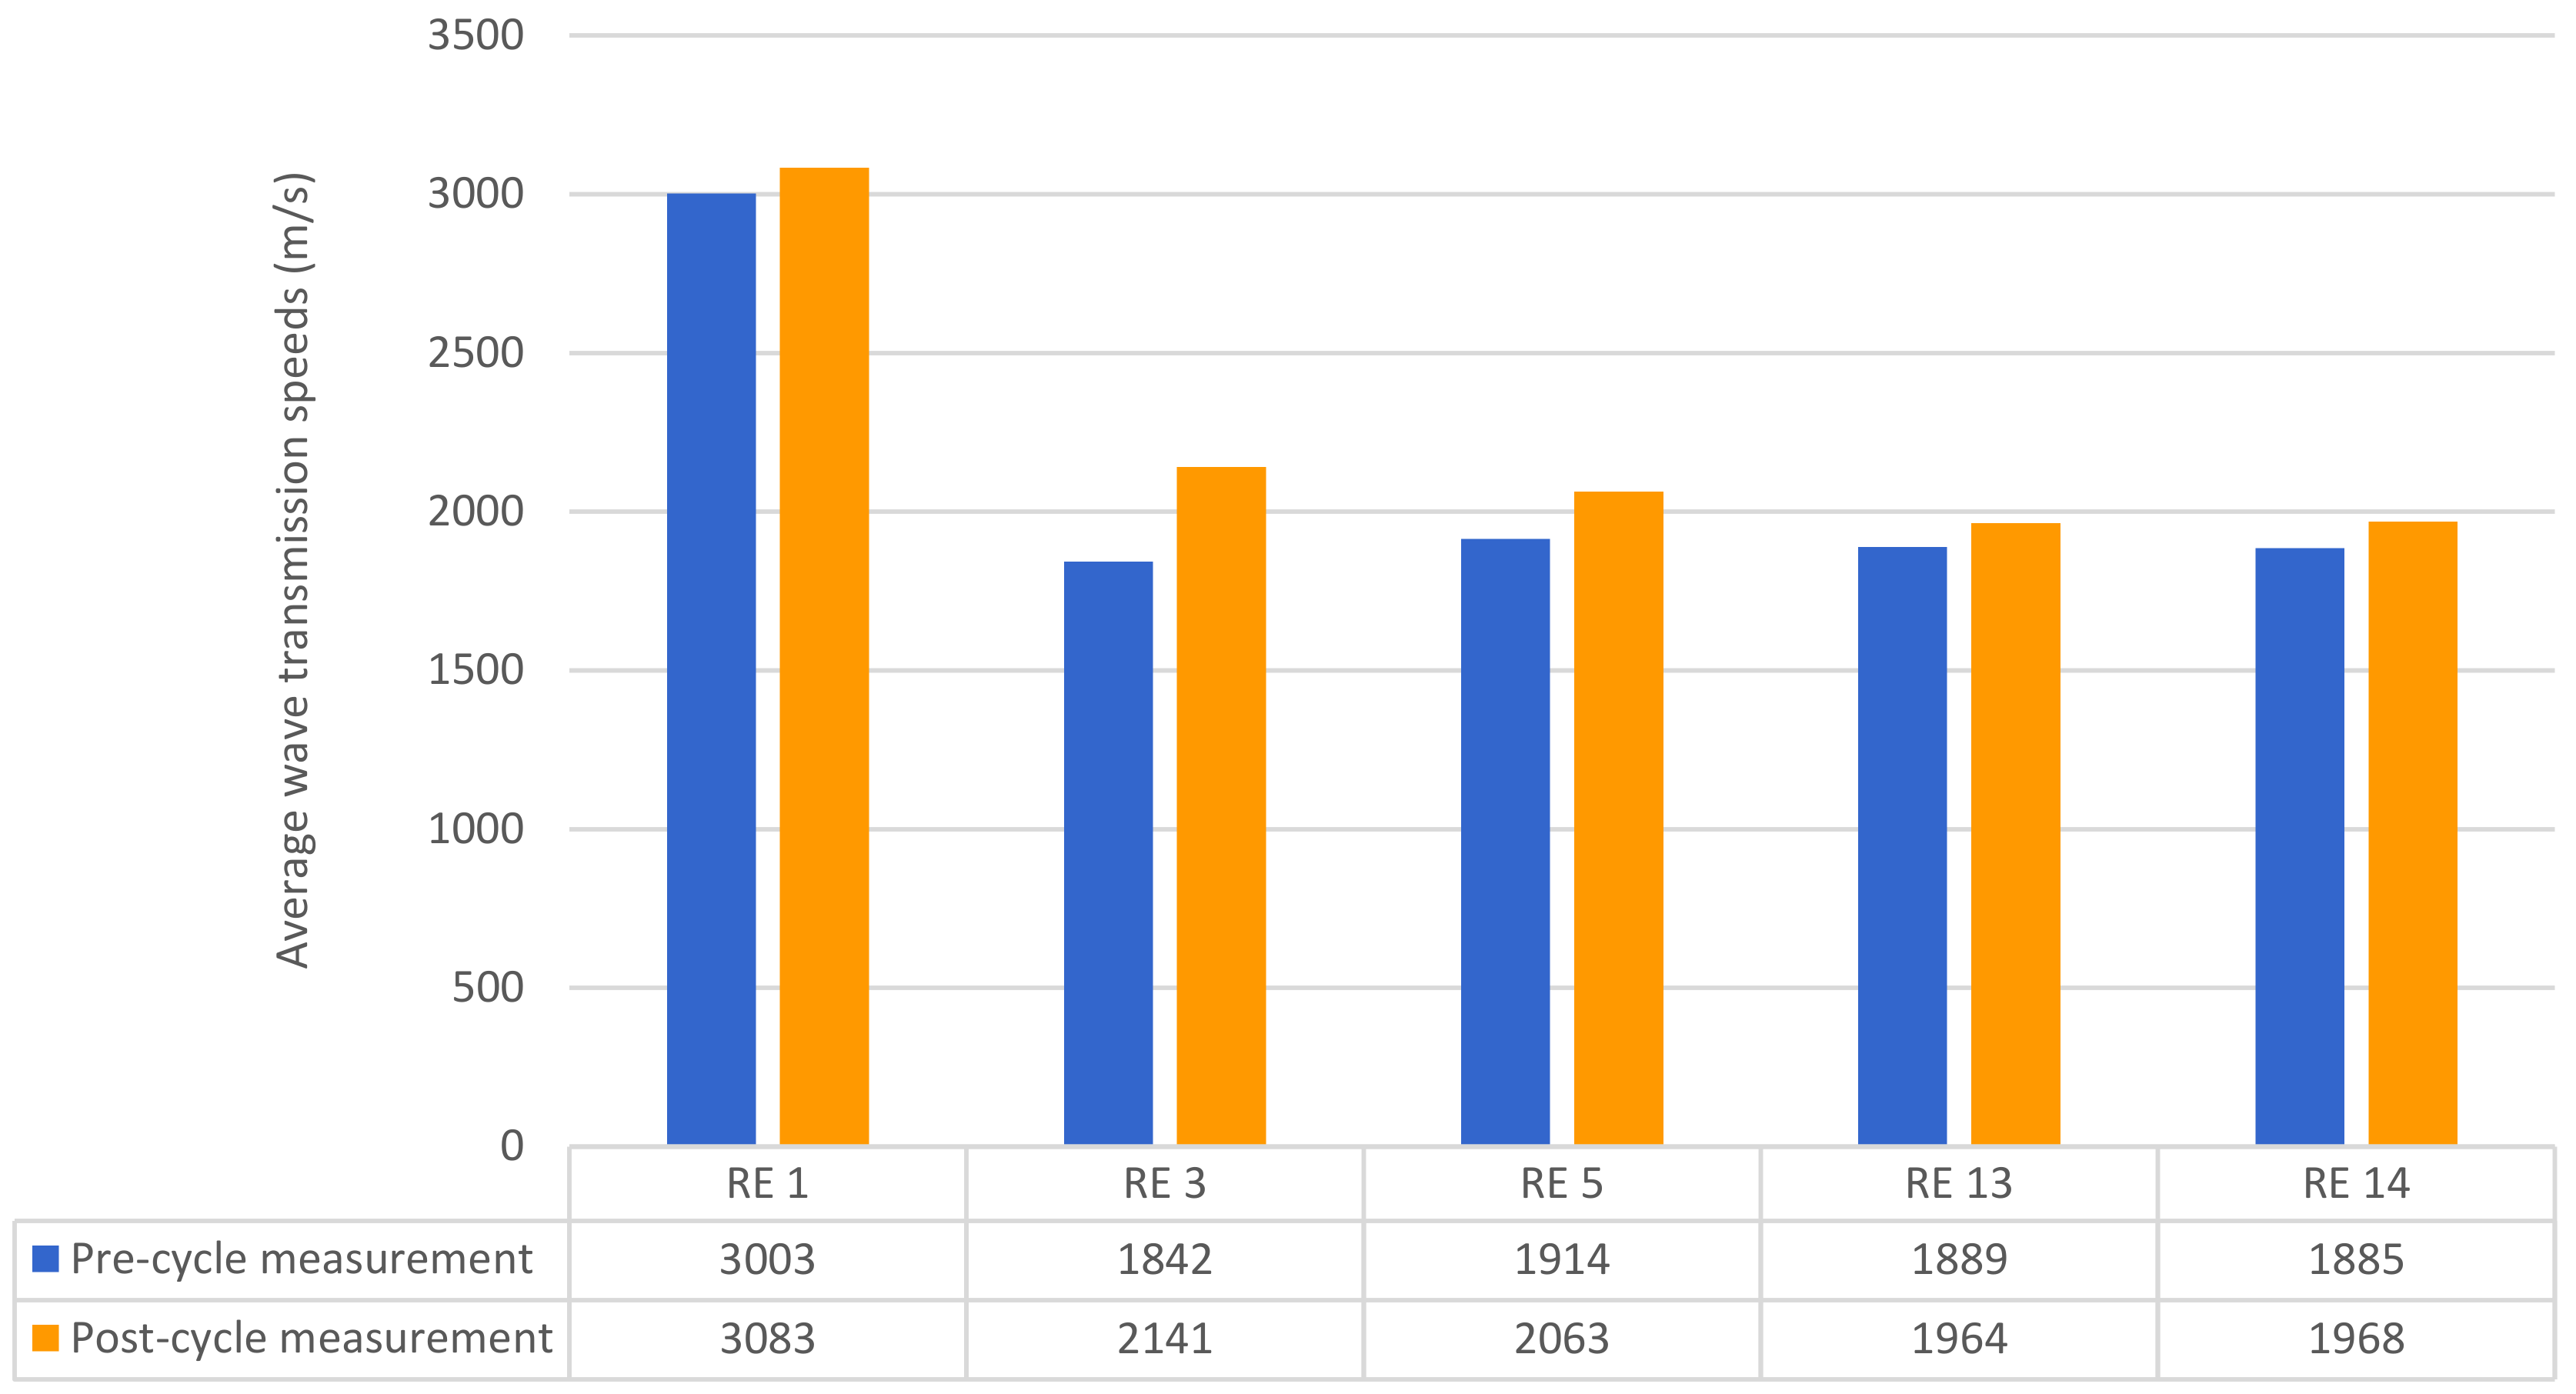
Figure 12 shows the results of the ultrasonic analysis performed on the RE samples. Here, a similar behaviour to the CEB samples was found, but with lower variation values. The results show that RE1, with the addition of cement, had a higher velocity and was very expressive concerning the other lime addition samples, confirming the trends already discussed for CEB samples.
The RE 3 specimen showed the highest variation (the addition of hydrated lime and without mortar). The washing of the hydrated lime and fines likely caused a considerable readjustment of the materials, with a greater chemical bond between the additive and the soil, although more characterization tests would be necessary to prove this reaction. The RE 1 sample (the addition of cement) varied the least, with a very small difference concerning the RE 13 sample of only just over 1%, followed by the sample of RE 14, with which it also maintained a small difference of almost 2%. The RE samples that received different finishes on more than one face did not have their ultrasonic measurements checked because the result of the ultrasound analysis would be inconclusive since the specimen would be influenced by the tests previously performed on one side with a different finish.
5.3.3. Compressive Strength
All samples were tested under compression, including those that were not submitted to the erosion test, so that the results could be compared with the samples submitted to the erosion test. A study that tested lime-enriched, red-bed soil specimens showed that the greater the amount of lime and exposure to wetting and drying cycles, the more the specimens were compression resistant and stable [
42]. The particle size and strength of consolidation are significant for soil strength [
43]. The addition of lime leads to a series of changes to the soil through chemical reactions. The products of these reactions bind the surrounding soil particles together and significantly strengthen the soil [
44,
45].
The samples in blue colours represent those with cement additions, which presented higher compressive strength results, as expected. The dark blue specimens are the ones previously submitted to the erosion test. In the case of the CEBs, water-exposed CEBs presented higher strengths than their equivalents that were not exposed to water, because the action of water on the specimens, as a cohesion factor of the composite materials, caused an improvement in their performance in terms of compressive strength. The same increase occurred with the samples of RE that had additions of hydrated lime and quicklime. On the other hand, the RE specimens with the addition of cement showed a slightly lower strength limit than similar specimens that were not exposed to water, and the same occurred for the CEBs with an addition of hydrated lime (
Figure 13).
The specimens with different surface finishes can only be compared with those without finishes. The green coloured CEBs with the addition of quicklime and protective finishes can be compared with CEB 6 and CEB 7 (without finish), which obtained equivalent results. In the RE results, the light green specimens with different finishes and without stabilizer can be compared with specimen 7 (without stabilizer), though it was not exposed to the rain test. These specimens (RE 9, 10 and 11) have lower resistances and the lowest of all specimens produced, which can be explained by the fact that these specimens had twice the exposure time to water action than the rest of the RE specimens since they had two sides with different plasters and finishes which were tested on separate occasions. The purple-coloured specimens, with added quicklime and paints, showed results equivalent to the specimens RE 5 and 6, with the same type of stabilizer and without protective finishes.
According to the Spanish standard for compressed earth blocks [
46], blocks with a compressive strength lower than 1.3 MPa are deemed unsuitable for construction purposes. Similarly, the Australian standard [
47] requires a minimum value of 2 MPa for construction on rammed earth and CEBs. The tests conducted on the specimens produced in this study demonstrated good overall values of compressive strength, with stabilized specimens exhibiting results higher than 2.7 MPa. The unstabilised rammed-earth specimens that underwent erosion testing and were protected by lime mortar obtained compressive strength values ranging from 0.8 MPa to 1.2 MPa. The unstabilised specimen RE 7, which was without any protective layer and was not subjected to erosion testing, showed a compressive strength value of 1.6 MPa. A study conducted by Misseri et al. tested rammed-earth specimens as bi-modulus materials, consisting only of soil and water, which were subjected to uniaxial compression tests after curing, resulting in an average maximum stress of 2.567 MPa [
48].
5.4. Relation between Ultrasonic Analysis Results and Compressive Strength
Through the ultrasonic test, it is possible to obtain information about the homogeneity of a material, namely, the presence of voids or the existence of cracks, in which materials that are less compacted have a lower wave propagation velocity than more compacted materials. It is also possible to relate, in a certain way, propagation velocity with the compressive strength of the material, according to Abreu [
49].
In this work, a relationship was established between the variation in the ultrasonic test results before and after the wetting and drying cycles and the compressive strength assessed after the cycles. Contact with water causes the cohesion of the materials to improve, causing an increase in the wave velocity. This occurred with all specimens tested. However, a high increase in this velocity may indicate a loss of mass and a consequent loss of mechanical capacity.
Table 5 and
Table 6 illustrate the relationship between the results of the ultrasonic velocity variation and their compressive strength for the CEB and RE specimens.
In
Table 5 above, it is possible to observe the relationship between the increase in the wave transmission speed with the result of the mechanical compressive strength of the CEBs. Regarding the CEB with cement addition, which had a transmission speed variation of 2.74%, transmission speeds higher than 2000 m/s, and compressive strength index of 9.6 Mpa, better results were expected in relation to the samples with a lime addition. However, it is precisely in a comparison between the lime samples that it can be observed that the worst resistance index among the tested specimens was obtained by the CEB 5 specimen, which had the addition of quicklime and traditional varnish and obtained a greater wave transmission variation (20.76%) between the moment before the durability test and after the test. This specimen obtained a compressive strength value of 2.8 Mpa. It was observed in the other specimens with the addition of lime that the smaller the transmission variation measured before and after the durability test, the higher the index of compressive strength. In fact, better results were expected compared to CEB 5, requiring new evaluations of the traditional varnish by repeating these tests to make sure of their properties.
Similar to the CEBs, the ER specimen with the addition of cement performed better in relation to the other specimens with lime additions, in which the RE 1 specimen obtained a transmission speed variation of 2.66% before and after the durability test and a compressive strength index of 10.8 MPa. Among the ER samples with lime additions, this correlation between the results of the two analyses was different. The RE 3 test piece, with the addition of hydrated lime, obtained a speed transmission variation of 16.19% and a compression strength index of 3.5 MPa, the best resistance index among the specimens with lime additions. However, specimen RE 13, with the addition of quicklime and a soaping finish, presented the lowest variation in transmission speed among the specimens with lime additions, demonstrating an increase of 3.97% of the velocity, though it was the specimen that also obtained the lowest index of compressive strength at 2.7 MPa. Therefore, to obtain more accurate results in this comparison, it is recommended that the tests be repeated with a larger number of samples of the same type. It is also recommended to increase the number of cycles and the drying time of the durability test.


