Article

Impact of Freeze–Thaw Cycling on the Mechanical and Durability Properties of Rapid Repair-Based Overlay Systems

John A. Reif, Jr. Department of Civil & Environmental Engineering, New Jersey Institute of Technology, Newark, NJ 07102, USA
*
Author to whom correspondence should be addressed.
Constr. Mater. 2025, 5(1), 3; https://doi.org/10.3390/constrmater5010003
Submission received: 15 November 2024 / Revised: 13 January 2025 / Accepted: 17 January 2025 / Published: 22 January 2025
(This article belongs to the Special Issue Modelling and Analysis of Concrete Degradation)

Abstract

:
Rapid repair materials (RRMs) have been used in concrete overlay systems to rehabilitate infrastructure for many years. The bond performance between RRMs and a concrete substrate is crucial for maintaining the desired performance and can deteriorate due to freeze–thaw action. In the case of partial depth repairs (PDRs), the mechanical and durability properties at the interface between the substrate and repair materials have not been thoroughly studied resulting in frequent failures. There is limited research on the freeze–thaw durability of RRM overlay–substrate interface, and no standardized test methods exist for evaluating the performance under freeze–thaw cycling. The proposed experimental procedure combines freeze–thaw cycling of an overlay–substrate specimen with pull-off testing of the overlay. Three RRM overlay systems were used consisting of calcium sulfoaluminate cement and ordinary Portland cement (PC), and a ternary blend of PC, calcium aluminate cement, and calcium sulfate cement. A correlation between tensile bond strength and fundamental transverse frequency in composite specimens was observed, and the results demonstrated that RRMs can maintain robust adhesion following 300 cycles of freeze–thaw exposure. Furthermore, the employed testing methodology elicited bond-only failures, underscoring the necessity for continued investigation into optimal conditioning intervals and substrate integrity to enhance the durability of repair systems.

1. Introduction

The global construction industry is shifting from new construction to repair and reinforcement, with aging concrete roads becoming prone to defects like potholes, cracking, debonding, pockmarking, etc. [1,2,3]. The transportation infrastructure is prone to complex deterioration mechanisms that reduce service life, require rehabilitation measures, and have economic implications due to road closures and rehabilitation costs [4]. Roadway closures result in delays, which worsen the traffic on major roads, impacting both the environment and the economy; leading to worsening air quality, a reduced standard of living, and interrupted commercial operations [5]. In an era where the vast network of roadway infrastructure is aging while traffic demand rises, transportation agencies are being forced to maintain infrastructure in novel ways that reduce road closure times while maximizing the long-term durability of the repaired systems [6].
The premature deterioration of concrete roadway surfaces can result in early cracking and spalling, reduced strength, and poor ride quality and conditions [6,7]. There are a variety of different reasons for the deterioration of concrete including corrosion of reinforcement, freeze–thaw damage, sulfate attack, and alkali–silica reaction [8,9,10,11]. Furthermore, deterioration from one mechanism can result in the onset of deterioration due to a secondary mechanism [8,9,10,11]. Cement-based rapid repair materials (RRMs) are a solution to quickly repair concrete elements using cementitious systems that set and gain strength quickly. The advent of these products, and their growing use, necessitates novel testing and qualification procedures as existing methods are often developed and qualified for use with standard systems or for examining performance of new construction [12].

1.1. Initiation of Damage in Freeze–Thaw-Affected Concrete Structures

The following four primary mechanisms have been considered for the progression of freeze–thaw damage: generation of hydraulic pressure from water expansion [13], capillary gel water diffusion [14], differential strains resulting from localized shrinkage and swelling [15], and osmotic pressures [14] built up due to partial capillary freezing of salt water solutions. It is generally understood that a prerequisite for damage from freezing is a high degree of saturation in the capillary network [16] and thus, test methodologies such as ASTM C666, generally prescribe pre-saturation as a condition for testing [17].
Past studies have acknowledged that the transport capabilities of the pore structure within the matrix of concrete materials are of primary importance when considering the susceptibility of concrete to damage from freezing [18]. It has been reported that the stresses that lead to matrix cracking and subsequent delamination at the surface originates from the restriction of the flow of displaced water away from the freezing locations [14]. The likelihood of freezing in a concrete matrix is governed by these factors in addition to the availability of a freezable solution, which depends on the degree of saturation, the lowest temperature of water, and the composition of the pore solution [19]. The existence of a pore structure that allows the movement and expansion of water within the concrete matrix can prevent the initiation of damage. For this reason, air–entrainment admixtures are often deployed to increase the freeze–thaw durability [20,21]. Air entrainment can significantly improve the long-term durability of concrete by providing an air-void system from the surfactant effects of air–entraining admixtures. After freeze–thaw damage begins, subsequent cycles can lead to significant deterioration of the concrete system, exposing aggregates and creating hazardous road conditions characterized by uneven surfaces and loose concrete debris. When delamination of the pavement surface reaches a critical point, either removal or repair of the surface is required to restore the road to a functional state.

1.2. Partial Depth Repairs

Reconstruction of a road surface can be costly and time-consuming, leading to lane closures and delays on adjacent road infrastructure. Partial depth repairs (PDRs) are an effective pavement preservation technique that can effectively increase the service life of a pavement structure without complete demolition and reconstruction [22]. Therefore, concrete resurfacing is employed in areas where surface deterioration has occurred due to freezing and thawing, without affecting the entire depth of the pavement structure. Three most widely used repair materials can be categorized as cementitious materials, resinous or polymer materials, and polymer-based cementitious materials [23]. Furthermore, a repair solution can consist of a bonded or unbonded overlay system; where bonded systems are utilized in situations when the existing pavement is in a fair structural condition and the repair thickness is 50–150 mm [24]. PDRs are bonded systems that are effective in rehabilitating areas of localized spalling, thereby restoring the performance of the pavement and extending its service life [25]. PDRs are particularly useful when deterioration is limited to joint failures between pavements and in areas where a third or less of the total depth of the pavement structure is determined to be unsound [6]. Partial depth repair interventions have been studied extensively and shown to be effective at extending the service life of concrete pavements and bridge decks [26,27].
The required compressive strength of PDRs at the time of opening a roadway typically range from 11.2 to 12.5 MPa [6]. The advent of rapid setting and strength gain cement systems comprised of blends of binders such as calcium sulfoaluminate cement (CSA), calcium sulfate (C$), and calcium aluminate cement (CAC) have made it possible to achieve minimum serviceability strength requirements at early ages. The backbone of these rapid-setting cement binders is the formation of ettringite as a primary hydrate structure, in contrast to PC where ettringite is a minor constituent [28]. Ettringite is formed during the first few hours of curing and is achieved by the hydration of calcium, sulfur, and aluminum-bearing oxides such as CSA, C$, and CAC [28,29]. The rapid-setting characteristics of these novel cementitious binders enable repairs to reach minimum opening strength requirements in a matter of hours instead of days. In addition, the hydration process of ternary binders is more complex and varies considerably compared to the hydration of PC and CAC [30,31,32].
In addition, the usage of CSA cement as a PDR material is growing due to its rapid hardening characteristics, high early strength, and low CO2 emissions [1,33]. CSA is a cement made from calcium sulfate, limestone, and bauxite at a temperature of 1250 °C [34]. These cements contain belite (C2S), ye’elimite or tetracalcium trialuminate sulfate (C4A3$), and gypsum (C$H2) as their primary phases [35,36]. The hydration characteristics of these cements are primarily dependent on C$ and/or calcium hydroxide (CH) [28]. A mixture of pure C4A3$ and water will form monosulfate (C4A$H12) and aluminum hydroxide (AH3) [28].
C4A3$ + 18H → C4A$H12 + AH3
The presence of CH and gypsum results in the formation of ettringite (C6A$3H32) and more monosulfate, depending on the molar ratio. The reaction is written as follows:
2C4A3$ + 2C$H2 + 52H → C6A$H32 + C4A$H12 + 4AH3
Systems inter-ground with PC and gypsum will produce ettringite alone [28]. CSA cements exhibit rapid strength gain and heat evolution, primarily because of ettringite formation. These systems can attain strengths of 20 MPa or greater in 3 h [28]. XRD analyses show the formation of ettringite 15–20 min after mixing, a primary source of early-age strength [37]. The continuous increase in strength at later ages observed in CSAs results from the hydration of other phases such as belite as gypsum is rapidly consumed [37].

1.3. Frost Durability of Rehabilitated Structures

While various rapid repair blends are utilized for the rehabilitation of deteriorated concrete pavements in practice, their mechanical and durability properties as a composite with the existing pavement are not well documented in the context of PDR applications, and failures are relatively common [38]. The failure of PDRs typically manifests as a bond failure between the substrate and the repair. It has been determined that bond performance is highly related to surface roughness, and that successful PDR application is dependent on bond development between the existing surface and the repair material [39,40,41,42,43]. There has been limited research on the freeze–thaw durability of such composite systems, and no standardized test method for evaluating the performance of the composite system undergoing freeze–thaw cycling currently exists. Early work on composite cement systems confirmed that freeze–thaw damage was present in composite systems tested in flexure [44]. While efforts have been made to perform testing on composite freeze–thaw prisms [10], studies into the effect of incrementally increasing freeze–thaw cycles on the bond performance of prismatic specimens are lacking.
The field performance is predominantly dependent on the bond performance between the concrete pavement and RRMs. In particular, the bond performance is strongly affected by cyclic freeze–thaw actions which further necessitates the quick and authentic evaluation of bond behavior at the RRM–concrete interface on a highway condition where PDRs are expected. In addition to frost damage, the evaluation of the bond performance of the RRM–concrete pavement interface is often challenged due to differential stress distribution in the concrete substrate caused by vehicular loads [45]. Limited studies on the evaluation of the long-term performance of these systems underscore the importance of this test. An efficient testing methodology needs to be devised to measure the bond behavior where PDRs are required in freeze–thaw environments.
Therefore, in this study, the focus is on developing a testing methodology that is capable of evaluating the freeze–thaw durability and bonding effectiveness of overlay systems on concrete substrates. Furthermore, in this study, the focus is on utilizing existing procedures already documented in the standards, and equipment commonly used in the concrete industry, ensuring accessibility and cost-effectiveness for testing laboratories. The bond of RRMs to reinforcement was not considered in this study. The proposed approach integrates traditional freeze–thaw testing of composite systems with pull-off testing of overlays at set times during freeze–thaw cycling. In this paper, this proposed test method is outlined and the initial findings are presented that suggest its promising effectiveness.

2. Materials

2.1. Cementitious Binders

In this investigation, four distinct cement systems were employed. For the substrate systems, the concrete was made with a Type I/II cement (PC), as defined by ASTM C 150/C150M [46]. Three overlay systems were used where two proprietary systems were utilized by blending the CSA with PC. These proprietary systems were CSA/PC1 and CSA/PC2, while the other overlay system was CAC/C$/PC that was a laboratory-blended ternary system. The cementitious components of CAC/C$/PC system were comprised of 21% standard grade CAC, 9% C$, and 70% PC. An oxide analysis of the cementitious components of the PC and blended CAC/C$/PC systems is presented in Table 1.
However, no oxide information on the cementitious components of the proprietary systems, CSA/PC-1 and CSA/PC-2, was available from the manufacturer; additionally, the systems came pre-mixed with admixtures and aggregates, so oxide analyses for these systems are not presented.

2.2. Aggregates

The type of natural coarse aggregates (CA) and fine aggregates (FA) used in this study were natural granite produced from the same quarry. The gradation of FA complied with ASTM C33, and the gradation of CA followed ASTM C33 for a #7 sized aggregate [48]. Table 2 discusses the physical properties of CA and FA determined by ASTM C127 [49].

2.3. Mix Design of Concrete Substrate

The substrate concrete mixture in this investigation was formulated according to ACI 211.1-91 guidelines [50] to create a standard pavement mixture of moderate strength. The goal was to achieve a slump of 100 mm, 8% air content, and a compressive strength of 34.5 MPa at 28 days. To meet these specifications, a water-to-cementitious materials ratio (w/cm) of 0.45 was chosen. Cement was added at a rate of 563 kg/m3, while CA and FA were added at rates of 680 and 776 kg/m3, respectively. A water-reducing superplasticizer, Sika® Viscocrete, was used at a dosage of 5.25 mL/kg to enhance workability. To ensure durability against freeze–thaw cycles, air entrainment was employed, and a surfactant-based admixture, Sika® AIR 260, was dosed at 2.3 mL/kg to achieve 8% air content. The compressive strength was chosen above a typical pavement design strength to prevent conical shear failures during pull-off testing. These types of failures were observed during the trial testing phase of this study with substrates of lower mechanical strength. Undesirable failure modes involve a failure of the substrate rather than the bond zone or repair material. While this type of failure may be possible in the field, in this study, the focus was on the development of a test method to assess the bond deterioration due to freeze–thaw damage and a higher-strength concrete was therefore used to decrease the likelihood of substrate failures. All PC mixtures produced used the same material stock of FA and CA, and the same dosage rate of Sikament® SPMN superplasticizer and Sika® AIR 260 air entrainer to achieve the desired workability and air content.

2.4. Mix Design of Overlay Systems

Three overlay systems were used in this study. Firstly, the CSA/PC1 system, sold by Mapei as Planitop 18 (Deerfield Beach, FL, USA). It is a proprietary, pre-bagged product that sets rapidly. The second overlay system was designed with CSA/PC2, which was a polymer-modified, fiber-reinforced, rapid-setting system, sold by SpecChem as RepCon 928 (Kansas City, MO, USA). These two overlay systems do not need to be mixed with aggregates before use in applications thinner than 50 mm (2 in). Furthermore, both systems met the requirements of ASTM C928, which sets forth the requirements for rapid hardening, prepackaged, concrete repair materials [51]. Water was added to these systems according to the recommendations given by the manufacturers of these RRMs. For the CSA/PC1 overlay system, this involved adding 300 mL of potable water to 3.41 kg of dry repair material to the benchtop planetary mortar mixer and mixing for one minute before adding the remaining 97 mL of water and mixing for an additional two minutes before discharging the mixture. For the CSA/PC2 overlay system, the mixture involved the same proportions of water and dry mix due to the range of water permitted by the manufacturer and to ensure consistency in the testing program. To maintain the homogeneity of these two systems, the mixing protocol for both systems was kept similar. The third rapid repair material, the CAC/C$/PC system, was made by mixing the FA presented in Table 2 with the rapid-setting cement presented in Table 1. The ratio of cement to FA was chosen to be 1:2.75 by mass following ASTM C109 [52] maintaining the w/cm as 0.45. Mixing operation was performed to emulate the process used for manufactured materials. The cement and FA were pre-mixed for 5 min before being set aside and combined using the same method as the two manufactured blends.

3. Experimental Program

The test method was conceived such that it would be viable for use with any hydraulic cement-based system used in overlay procedures. ASTM C666 [17] was used as a guide for the specimen dimensions and data acquisition during the freeze–thaw conditioning phase. ASTM C1583 [53] was used as a guide for measuring the tensile bond strength of the overlay/substrate system. Two important changes were made to both test standards, especially to limit the number of specimens. It was evident that the required number of specimens was 9 for every 36 cycles, whereas only 6 specimens were required when tested every 50 cycles. Therefore, the maximum number of cycles between data collection procedures was increased from 36 to 50 for the freeze–thaw conditioning. The increase in cycles was performed so that data collection for the freeze–thaw samples matched time periods for pull-off testing.
For pull-off testing, a modified methodology was used to ensure the stability of the load cell with the sample. Notably, ASTM C1583 [53], typically applied as a field test, lacks specific provisions for testing prismatic samples or those with limited dimensions. Figure 1 illustrates a schematic detailing the testing regime adopted in this study. Following this protocol, substrates were initially cast and allowed to cure for a period of 28 days. Upon curing, the substrates were meticulously prepared to receive the overlay materials.
Subsequently, the overlay was applied and allowed to cure, after which, the systems underwent rigorous freeze–thaw testing. At 50-cycle intervals, specimens were removed from the freeze–thaw cycling cabinet to undergo dynamic modulus and mass measurements. Notably, one specimen was reserved after each set of 50 cycles, while the remaining specimens were returned to the machine for further freeze–thaw cycling. The preserved specimen was subjected to pull-off testing using the modified setup prescribed by ASTM C1583 [53]. This iterative process persisted until the completion of 300 cycles, ensuring that all specimens underwent pull-off testing.

3.1. Preparation of Substrate Specimens

The substrate specimens were prepared following ASTM C666 [17] by casting the PC concrete system in prism molds measuring 76 mm × 102 mm × 406 mm with two wooden spacer sections measuring 19 mm × 102 mm × 406 mm to create substrates measuring 38 mm × 102 mm × 406 mm. Water absorption into the wood spacers contacting the fresh concrete was prevented by wrapping the wooden spacers in a thin polyethylene sheet. After demolding, substrates were cured for 28 days in a saturated lime solution conforming to the requirements of ASTM C511 [54].
Following the curing phase, the substrates were prepared for overlay installation to replicate the conditions of a concrete surface treated with PDRs in practical settings. PDRs involve the selective removal and recement of small areas of worn-out concrete pavement, effectively mitigating or halting the spread of damage typically caused by factors like temperature variations, freeze–thaw cycles, and vehicular loads [22].
There are different demolition techniques available to prepare a rough concrete surface. The range of concrete surface profile (CSP) values outlined by the International Concrete Repair Institute (ICRI) reflects different profile outlines that can be generated by the available demolition and preparation methodologies [55]. For the preparation of a substrate for a concrete overlay or repair, a CSP value of 5–10 is required [55]. In this study, the manufacturers’ recommendation of a minimum CSP of 5 was adhered to, widely accepted among various RRM systems [55]. The demolition phase aimed to remove damaged concrete as specified in [27] and establish a repair boundary based on substrate–overlay system design. Laboratory-prepared substrates underwent a 28-day curing process in a saturated lime solution, ensuring adequate curing. This extended curing duration exceeded the ASTM C666 [17] recommendation by 14 days; this was performed to ensure that additional levels of significant strength gain would not be incurred, making it less likely that increased hydration would impact the bond between the RRMs and the substrate.
Scarification was used as the substrate preparation technique based on available equipment in the laboratory and scale of specimens being created. Most of the other methodologies involve heavy equipment and instrumentation only meant for field application. A hand scarifier was chosen to create a grooved shape for substrate surface preparation, capable of CSP values in the range of 5–10. During scarification, it is widely accepted that extra care should be taken since scarification is considered to pose a moderate risk of microcracking [55]. Figure 2 depicts the prepared surface by the hand scarifier representing a CSP roughness of 7–9. In this study, it was assumed that microcracking in the substrate was minimal due to the careful control of the vibration of the hand scarifier during testing. Additionally, microcracks that may exist are likely to be consistent across specimens because the same equipment and technique were used to scarify each sample, and scarification of all specimens was performed by a single operator. Therefore, the impact of differing microcracks between systems should be minimal; however, future work on developing this or a similar test method will need to examine how different demolition techniques and variability in application of demolition techniques between operators may impact the test method’s robustness. These differences would likely impact the overall variability of the test method and could be addressed through an appropriate inter-laboratory study to develop a precision and bias statement for the test method.

3.2. Rapid Repair Overlay Placement

The overlays were cast on the substrates so that a 75 mm × 100 mm × 400 mm specimen conforming to ASTM C666 [17] requirements was created. Due to the need for specimens to be at a similar hydration age upon placement in the freeze–thaw chamber, specimens for an entire overlay series were cast concurrently. Having small dimensional changes in substrate specimen volume during wet curing, the steel molds used to cast the substrates were found not to be suitable for casting the substrate–overlay composite casting. A system was developed using the steel plates from the original molds to cast specimens concurrently and efficiently. A single mold was used to establish a vertical plane against which all substrates were clamped with 75 mm × 400 mm plates between each substrate. Figure 3 represents the arrangement of specimens before casting.
A process was devised to obtain saturated surface dry (SSD) conditions at the time of implantation, as recommended by the majority of RRM manufacturers before applying a bonding agent or scrub coat. After being power cleaned and allowed to remain damp, the specimens were brought to SSD condition using compressed air while the individual overlay was being mixed. Each overlay was cast according to manufacturer specifications.

3.3. Curing and Conditioning of Composite Substrate-Overlay Specimen

The substrate–overlay composite prisms were cured for 24 h before being demolded and placed in a saturated lime-curing tank at 23 °C. ASTM C666 specifies that prisms be cured in saturated lime for 14 days before conditioning [17]. However, due to the desire to achieve full bond before initiation of the test, the specimens were cured in saturated lime for 28 days before freeze–thaw conditioning. Further testing will need to be completed to understand the impact of overlay curing time on the overall test method. Specimens were conditioned to 4.44 °C in a water bath before taking initial measurements according to ASTM C666 and ASTM C215 [17,56].

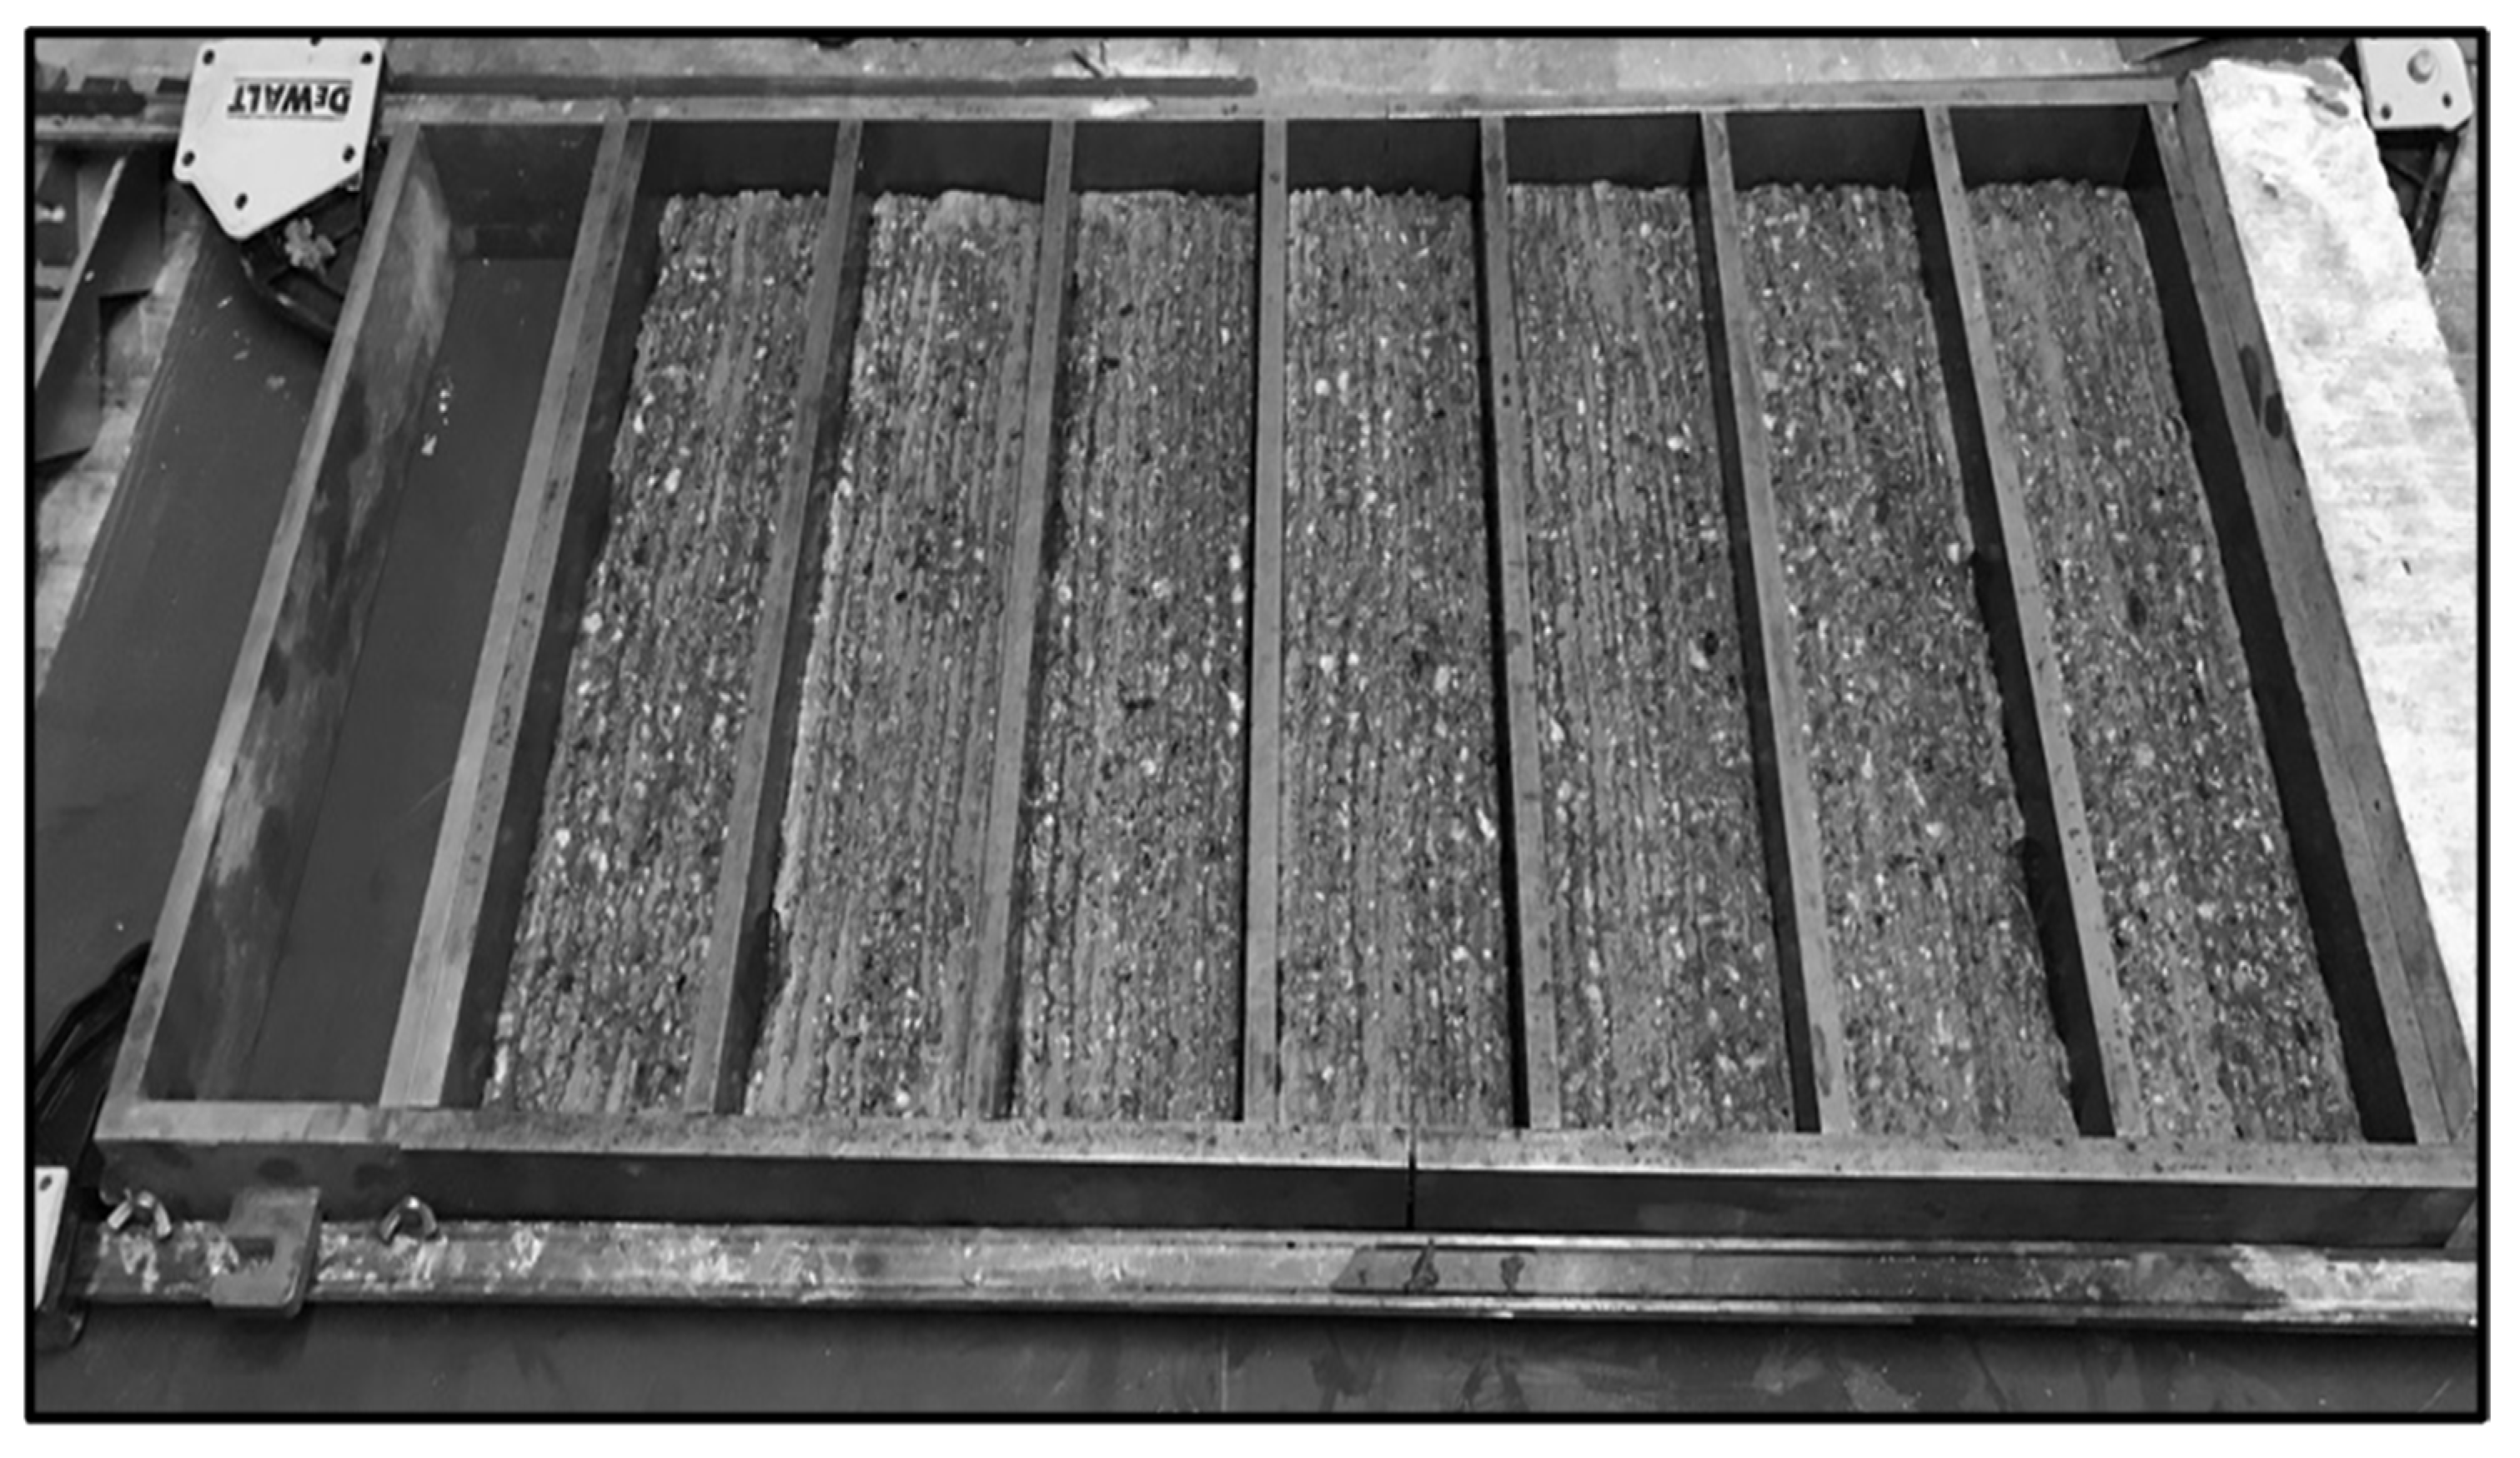
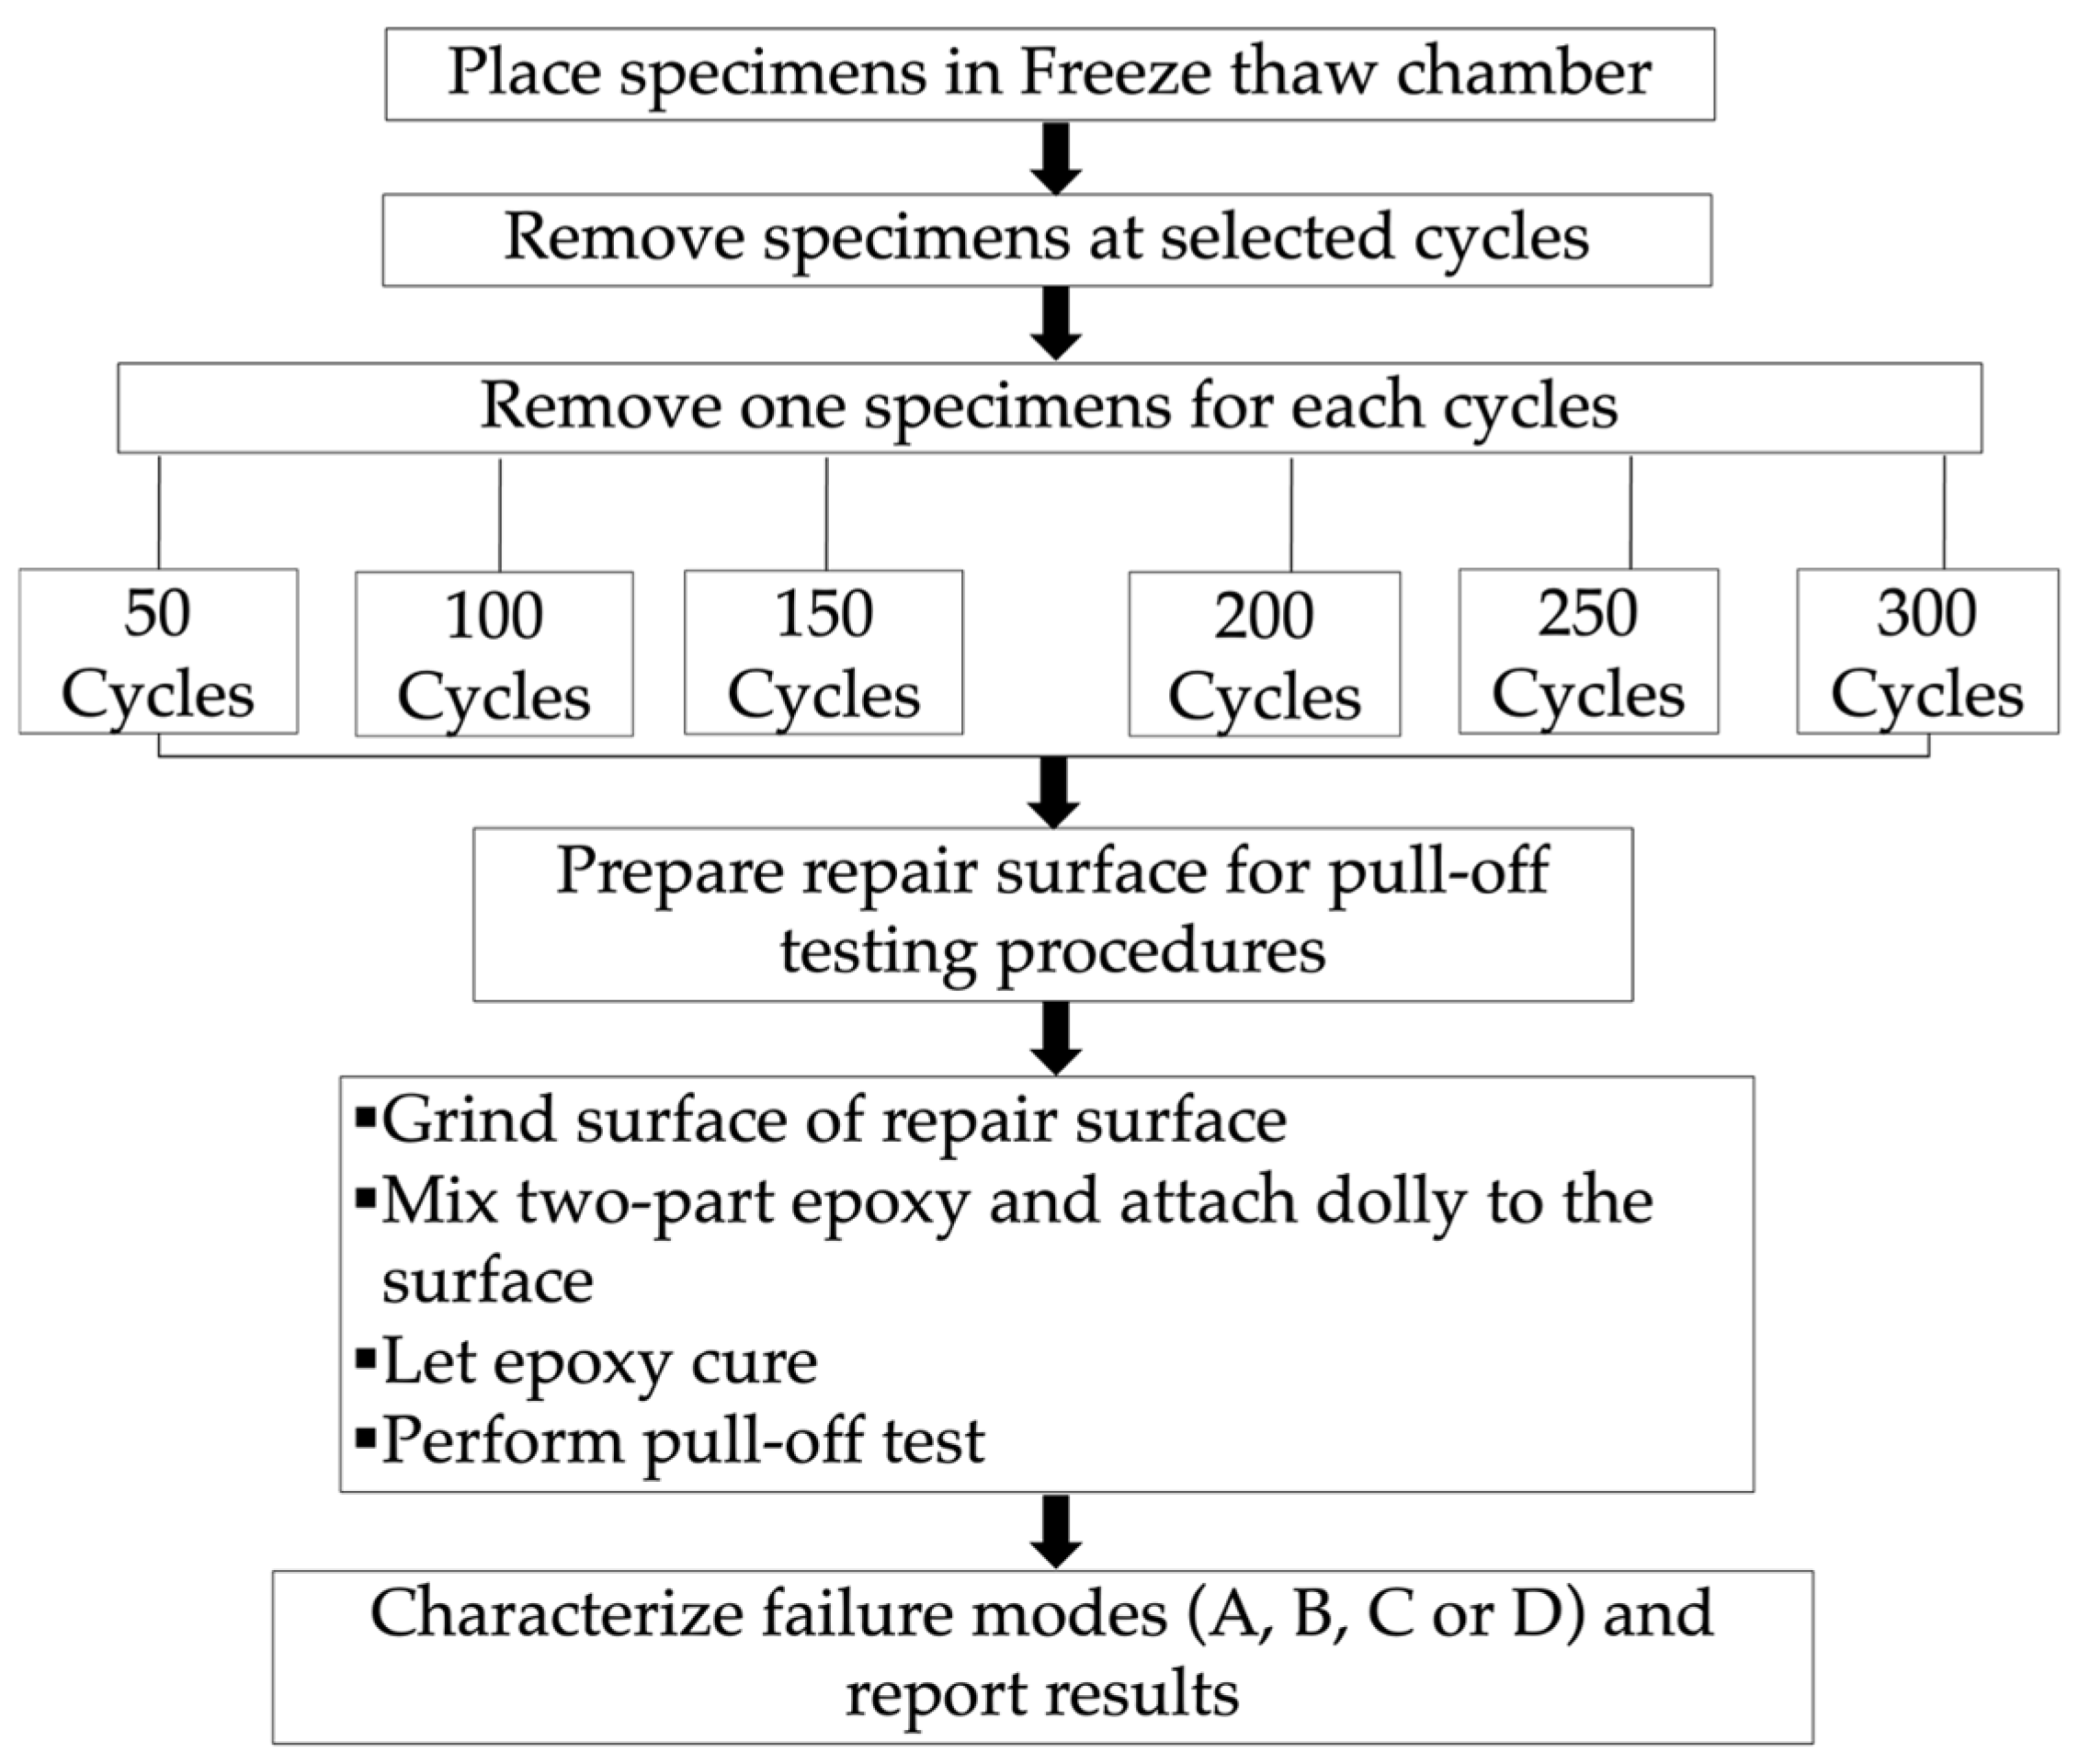
3.4. Freeze–Thaw Conditioning

After the curing and conditioning phase, 6 of 7 specimens of each type were placed in a freeze–thaw chamber and removed at 50-cycle intervals based on the testing plan. The conditioning was performed using a freeze–thaw cabinet capable of bringing specimen temperatures from 4.4 °C to −17.8 °C and back to 4 °C in 2.5–4 h (i.e., meeting the requirements of ASTM C666). At each 50-cycle interval, specimens were removed. Each specimen then had its mass measured, its dimensions were measured, and finally, its fundamental frequencies were measured according to ASTM C666 [17] using the impact resonance method specified by ASTM C215 [56]. After measurements were completed, specimens were placed back in the freeze–thaw chamber, excluding the specimen that was subjected to pull-off testing at that interval. Figure 4 depicts a detailed testing regime for each specimen type.

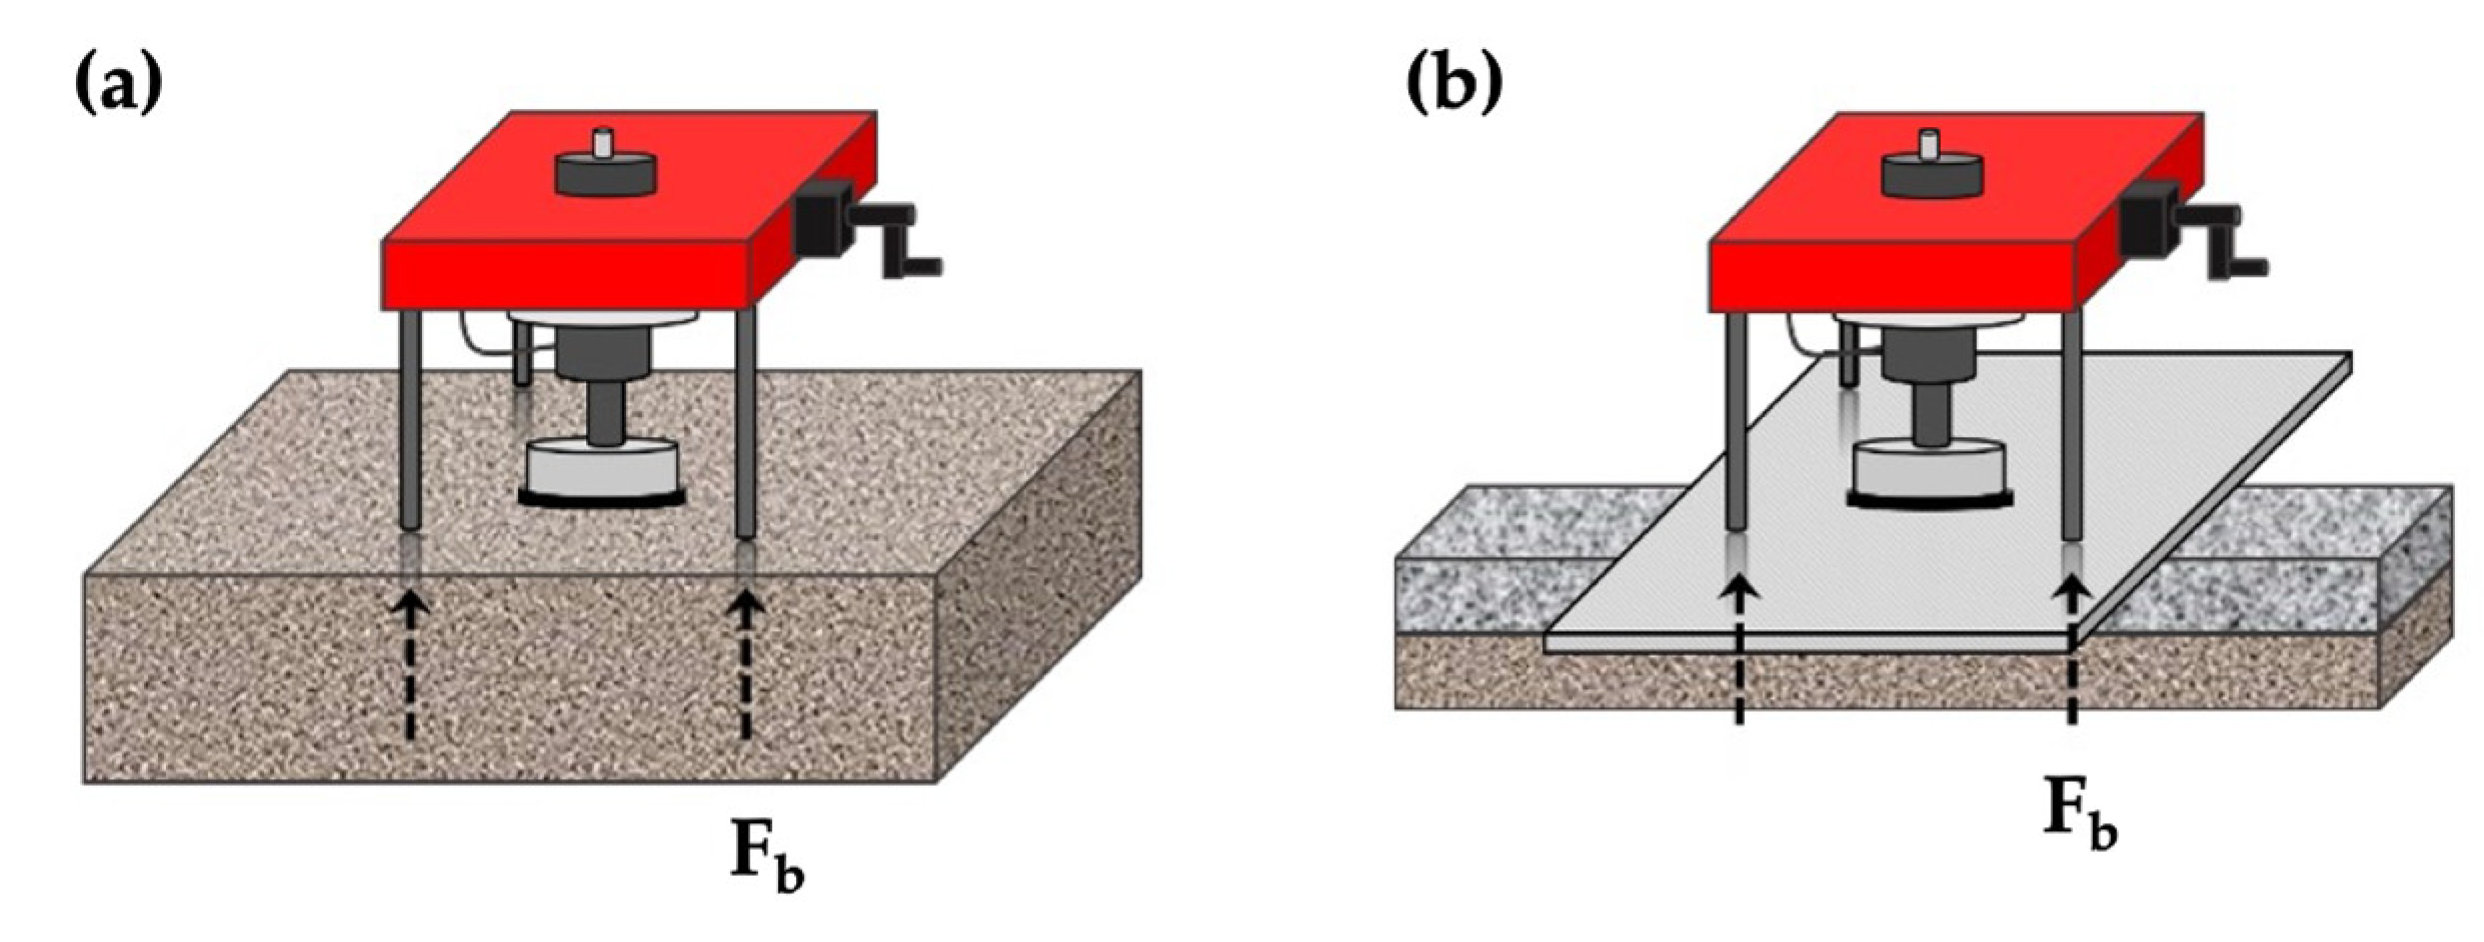
3.5. Pull-Off Testing

As previously mentioned, the composite substrate–overlay samples underwent a 28-day curing process in a saturated lime solution before undergoing initial testing. One sample of each type underwent testing without freeze–thaw conditioning to establish an initial pull-off strength, while the remaining six samples underwent conditioning before pull-off testing. Following each 50-cycle period, one sample was set aside, and the pull-off strength of the overlay system was measured. The pull-off method, based on ASTM C1583 [53], was adapted for specimen size requirements necessitated by freeze–thaw conditioning. To enable the coring and testing of specimens, a unique drill rig and stabilization apparatus were developed. ASTM C1583 [53] mandates that the test area be isolated from the surrounding concrete using a core drill penetrating through both the overlay and substrate. Due to the specimen size, stabilization was crucial during core drilling to ensure vertical coring and adequate core depth. Figure 5 exhibits the coring operation through a drill stabilization rig and attachment of dollies to drilled cores.
A depth of 48 mm was deemed optimal after observing failures at higher depths and adhesive failures below 40 mm. Specimen surfaces were meticulously prepared by grinding them flat and smooth, followed by power washing to remove any debris from freeze–thaw conditioning. This ensured a clean surface and proper adhesion to the steel dollies used for testing. The dollies were affixed using a fast-setting epoxy weld with high tensile strength properties. To prevent drying shrinkage at the site of the core, water was pooled in the annular cavity formed during drilling, and the epoxy was allowed to cure for 24 h before pull-off testing. The pull-off testing was conducted following according to ASTM C1583 [53], at a consistent loading rate of 35 ± 15 kPa/s to maintain uniformity across specimens.
In tensile pull-off tests on prismatic specimens, ensuring proper force transfer is crucial. Unlike field applications where pavement surrounding the core acts as a bearing surface, in lab settings, stability is achieved by transferring force directly to the feet of the device. However, with prismatic specimens, the dimensions are often insufficient, and the feet extend beyond the edge of the specimen, posing challenges for adequate force distribution. To overcome the challenge, a steel bearing plate of 12.5 mm thickness was developed. Ensuring full contact between the plate and specimen is crucial to prevent flexural failures, especially in areas of maximum stress where an annular cavity may form. Pull-off testing was conducted using a Control Group™ pull-off tester of model 58-C0265, with a focus on maintaining a loading rate below 0.14 MPa/min to prevent exceeding stress limits. Figure 6 depicts different test setup for field testing of slabs and laboratory testing of prisms.

4. Results

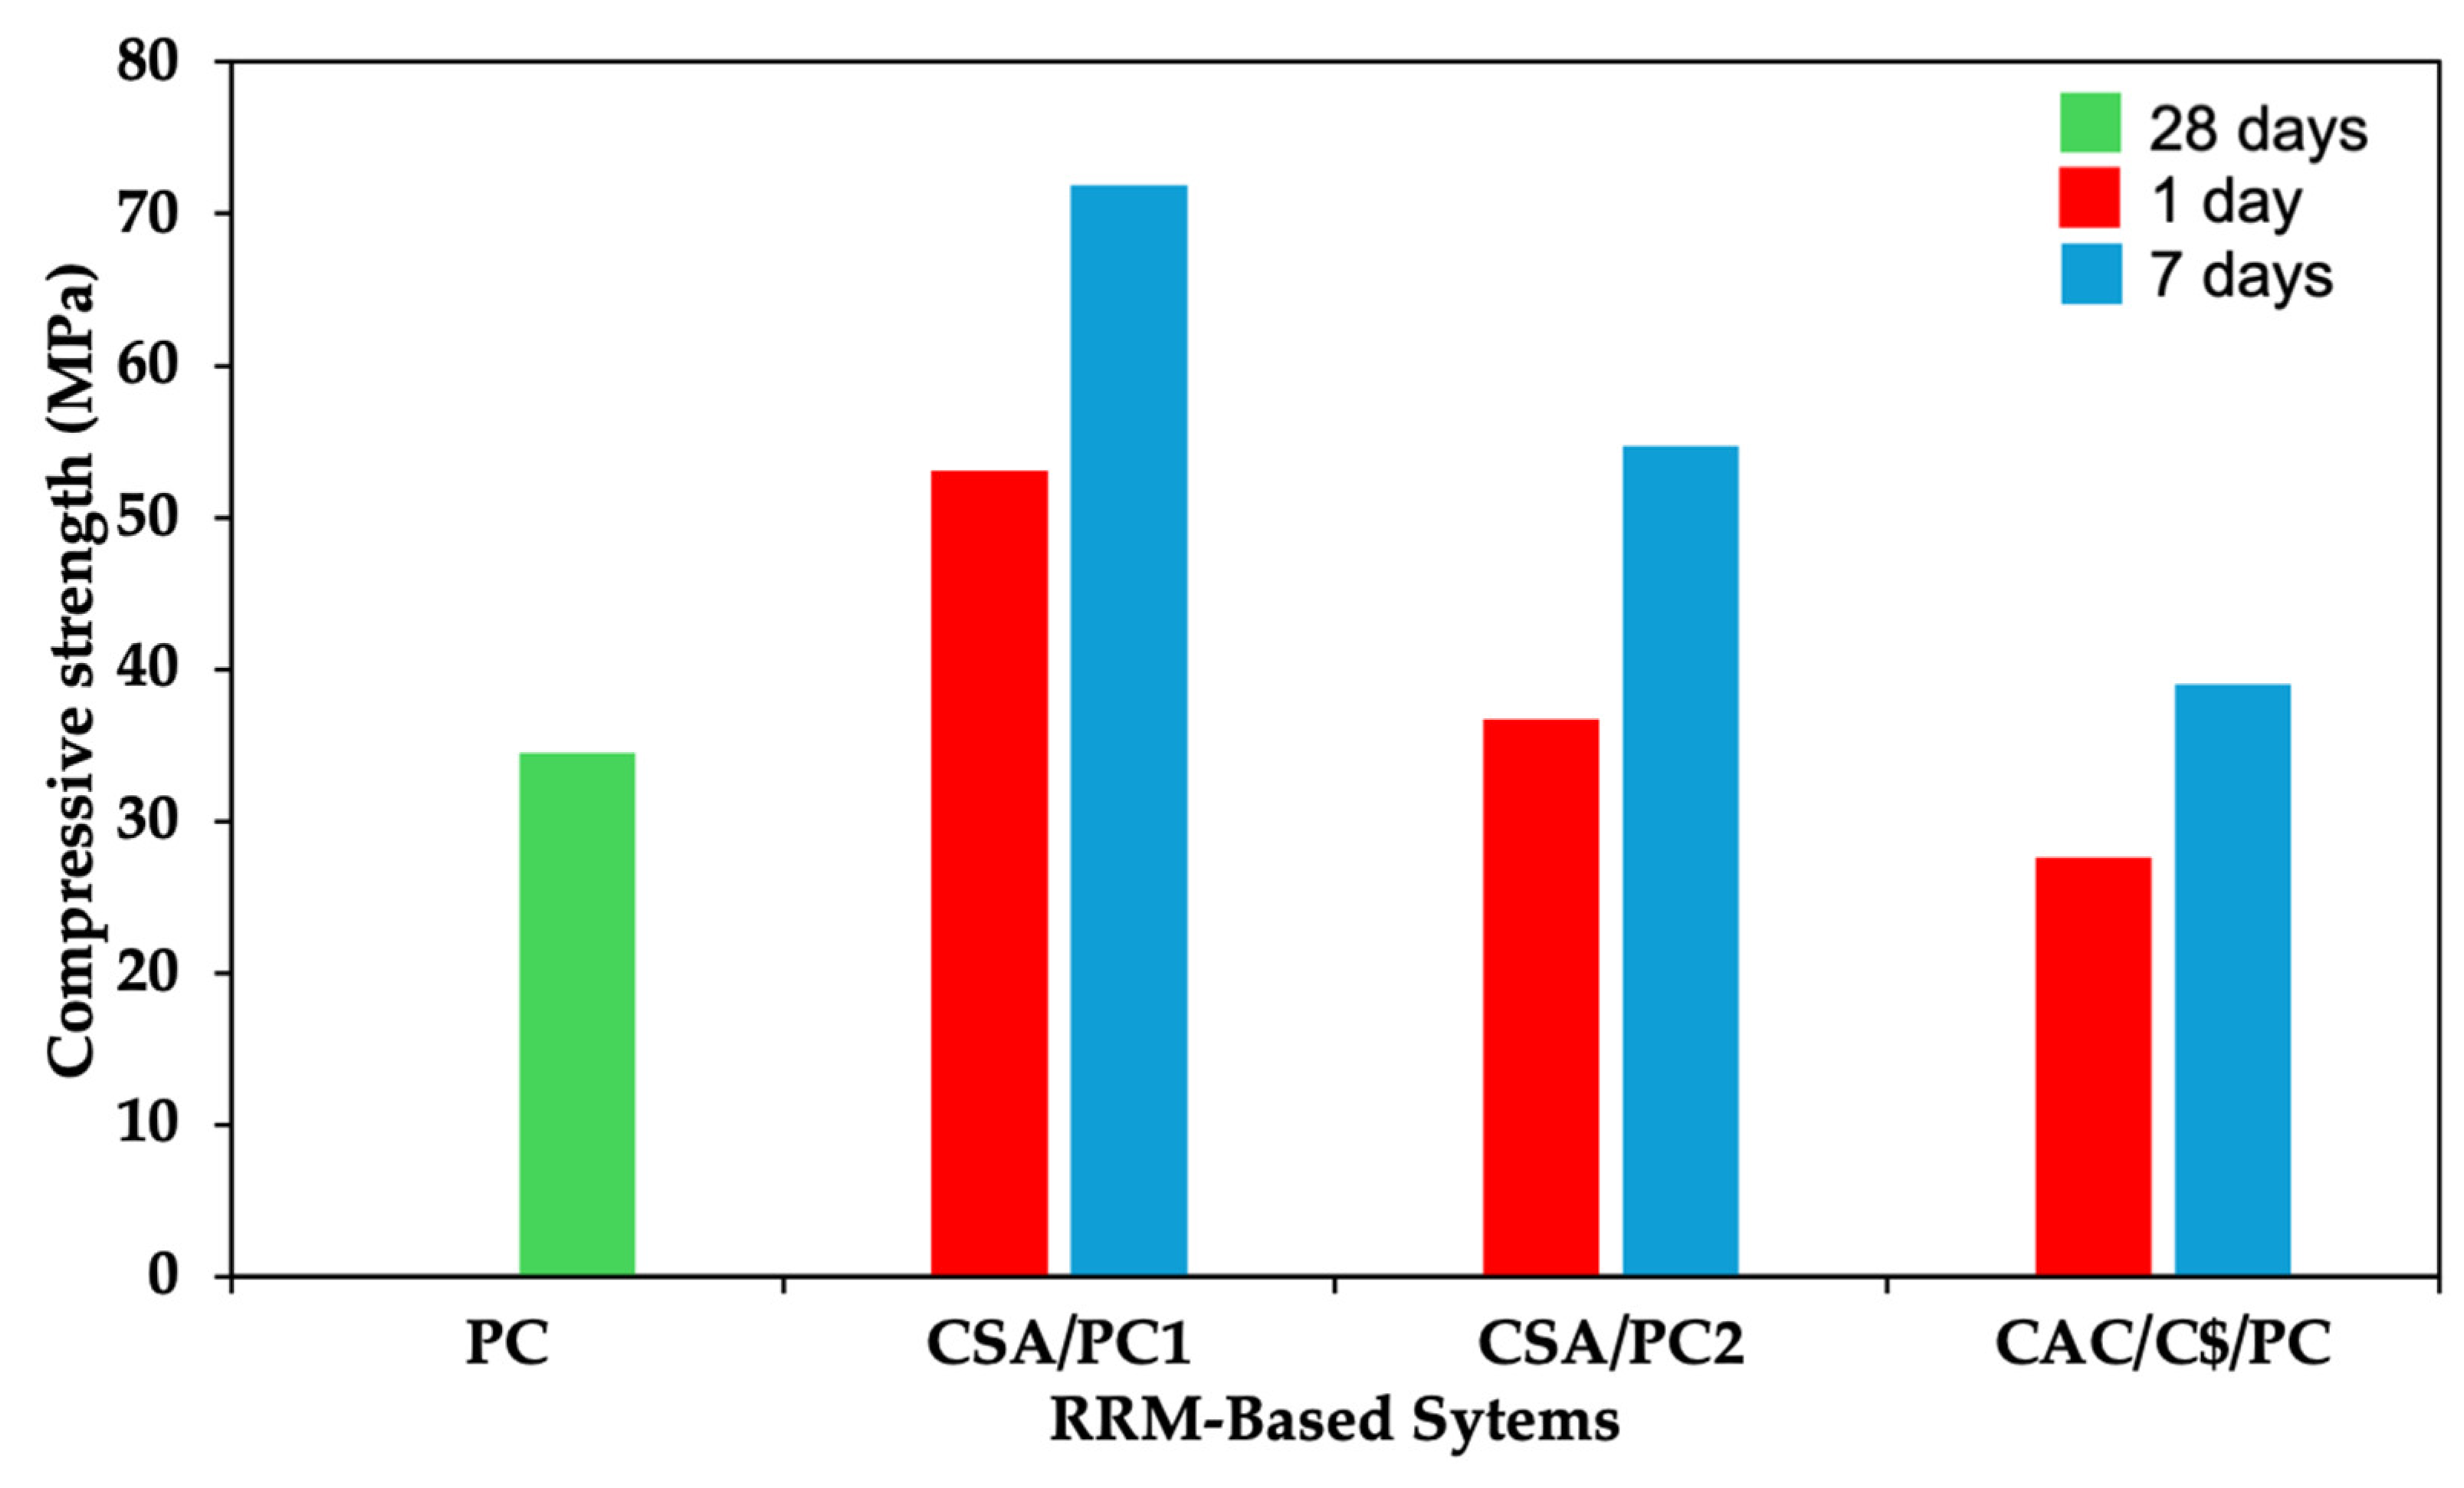
4.1. Fresh and Mechanical Properties

Slump, unit weight, and air content were measured to determine the fresh properties of the substrate systems. Slump was determined according to ASTM C143 [57], while the air content and unit weight were measured according to ASTM C138 [58]. For the 28-day compression test, three 100 mm × 200 mm concrete cylinders were tested according to ASTM C39 [59].
The substrates for the three systems were produced using three separate batches. The three batches are referred to as PC-S1, PC-S2, and PC-S3. The fresh and hardened properties of the three substrate concrete batches produced for this study are provided in Table 3. Substrate PC-S3 had the lowest air content as well as a lower compressive strength when compared to PC-S1 and PC-S2.
For the RRM-based systems, samples were prepared in 50 mm cubic molds to determine the compressive strength according to ASTM C109 [52]. Figure 7 represents the compressive strength of all RRM-based systems. The compressive strength of the PC system was measured at 28 days, whereas the RRM strengths were measured at the 1-day and 7-day intervals. These time intervals are more relevant for comparison due to the high early strength exhibited by RRMs. The compressive strength value for the PC system represents the average value of the 28-day compressive strength specimens tested from all batches (PC-S1, PC-S2, and PC-S3). For these systems, the 7-day compressive strength of all RRMs exceeded the 28-day compressive strength of the PC system. At 1 day, both CSA/PC1 and CSA/PC2 systems exceeded the compressive strength of the PC system, while CAC/C$/PC system reported a lower 1-day compressive strength.
The CSA/PC2 tested 13.1% below the manufacturer’s specification for 1-day strength (42 MPa) according to ASTM C109 but tested above the specification for 7-day strength. The laboratory-made CAC/C$/PC system tested slightly lower than the substrate with a 1-day compressive strength of 27.5 MPa. The CSA/PC1 system had the highest 1-day and 7-day compressive strength with values of 53.12 MPa and 71.93 MPa, respectively.

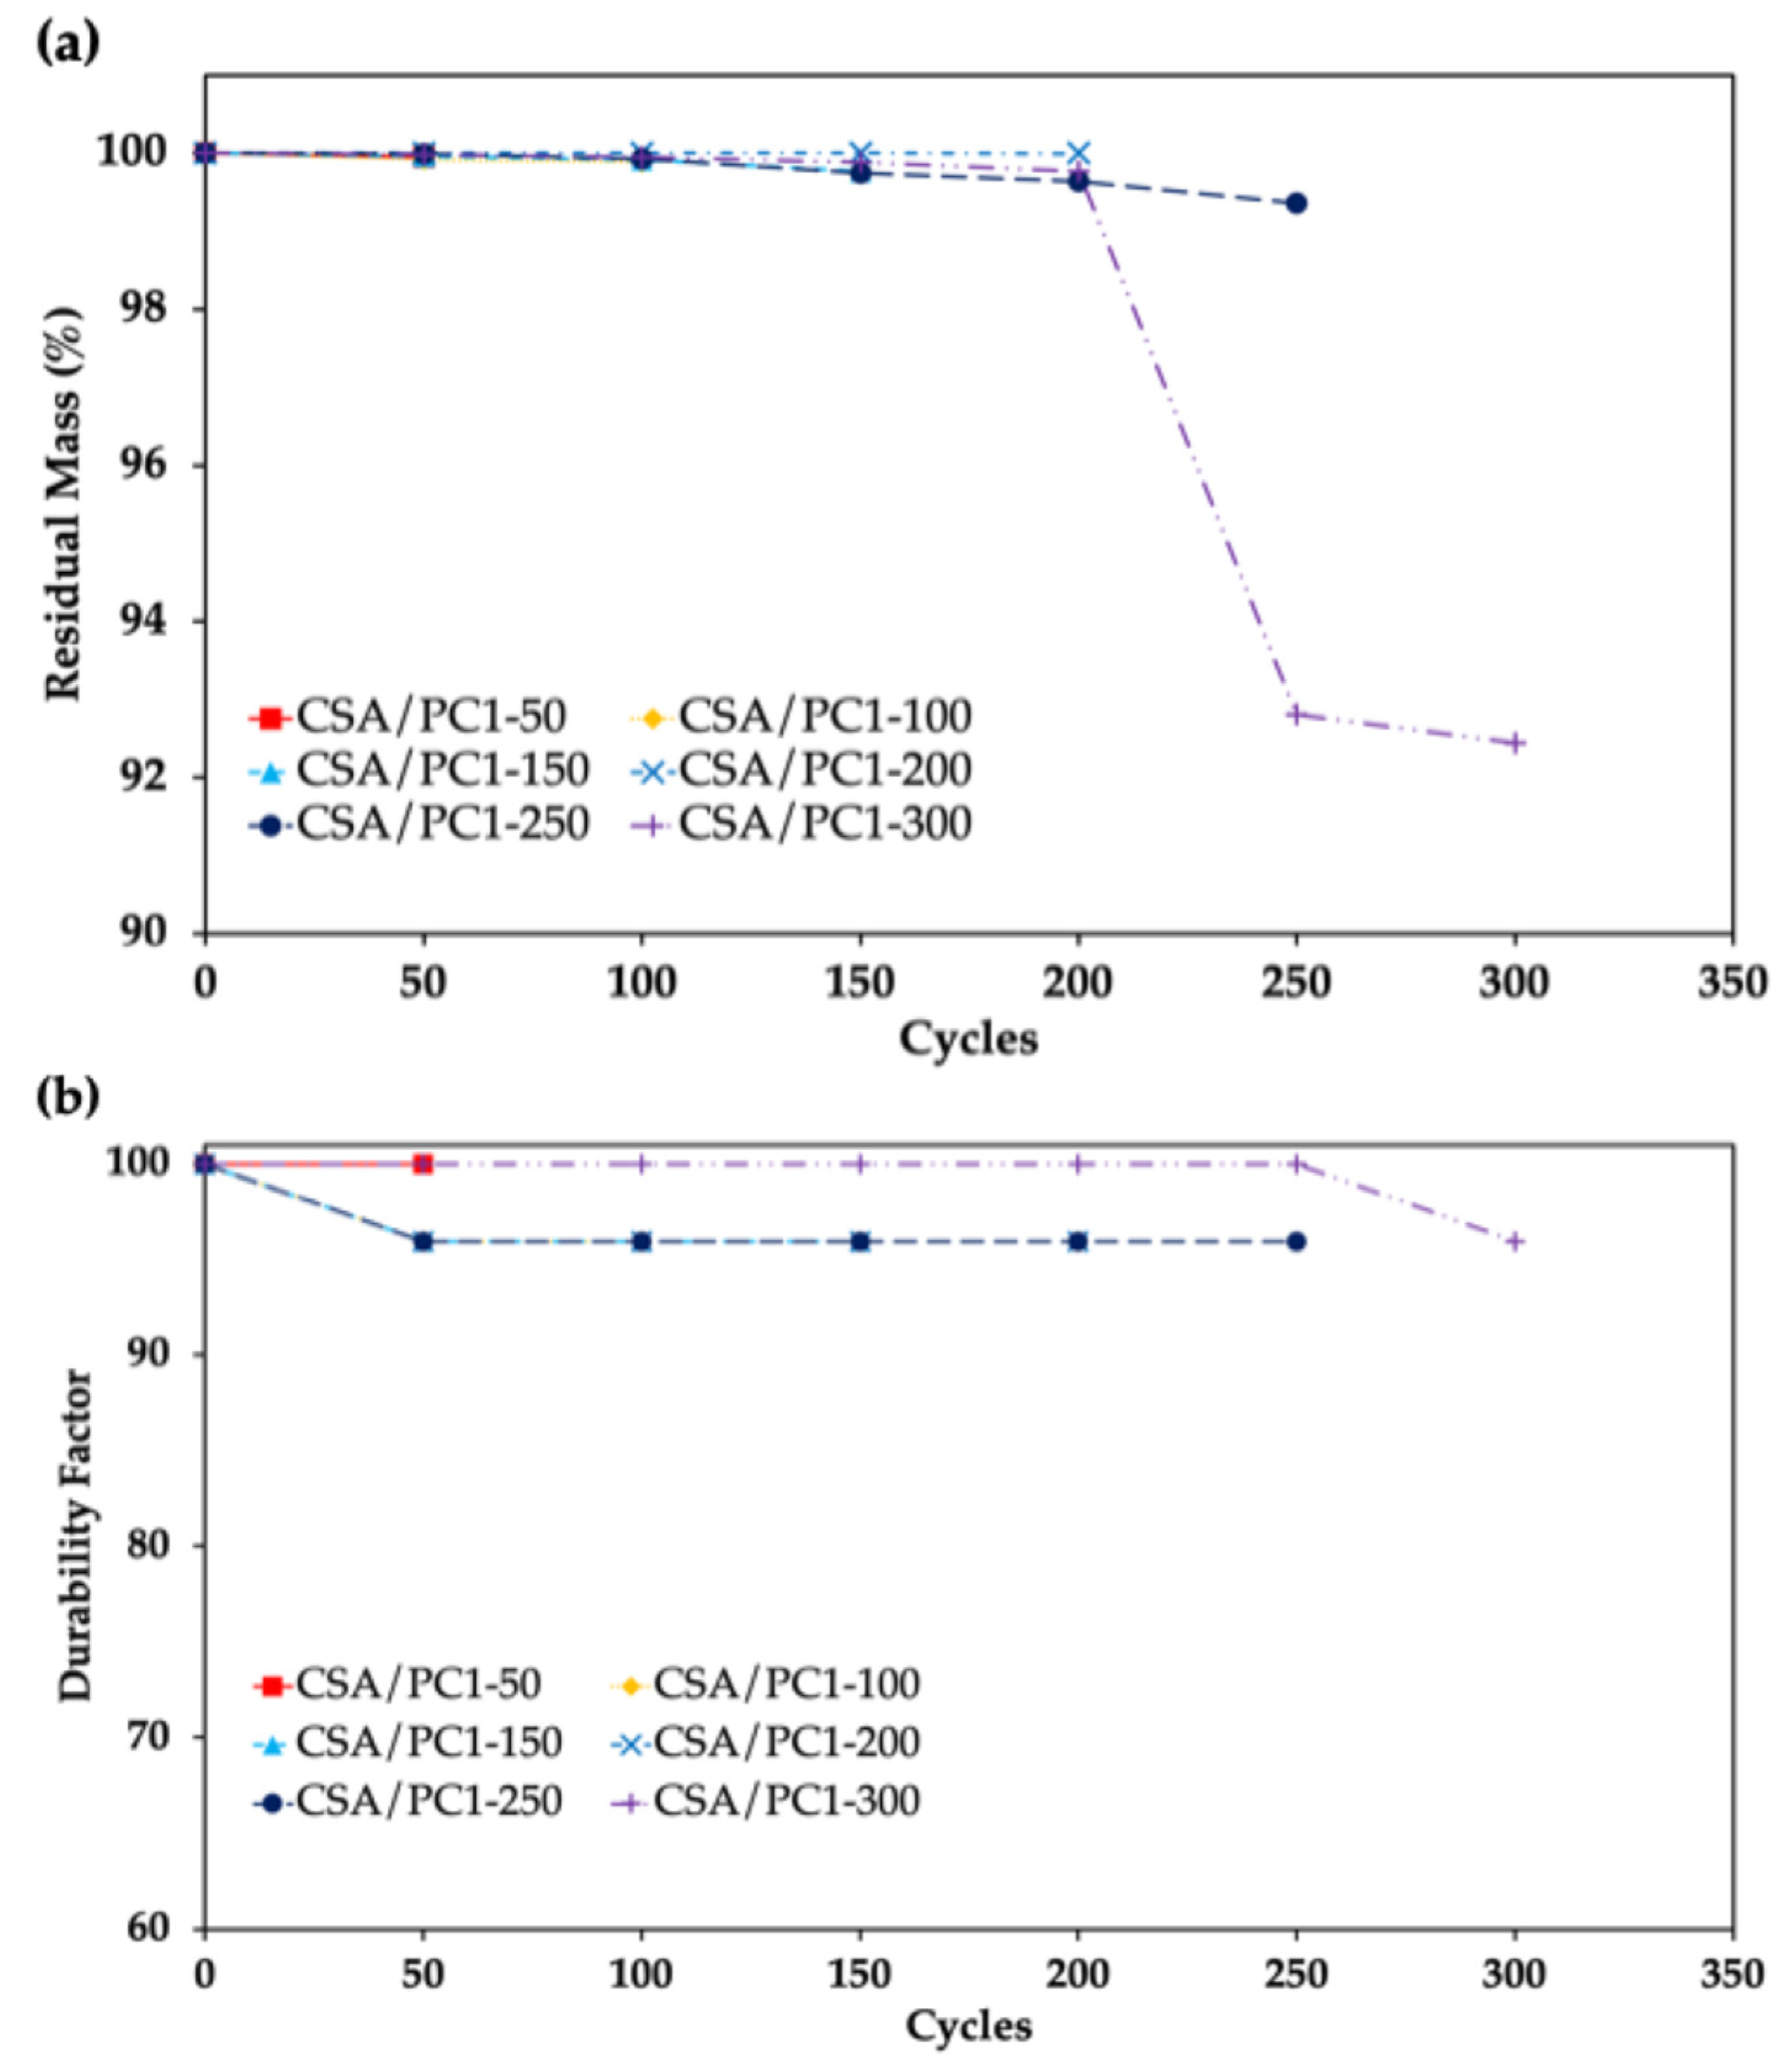
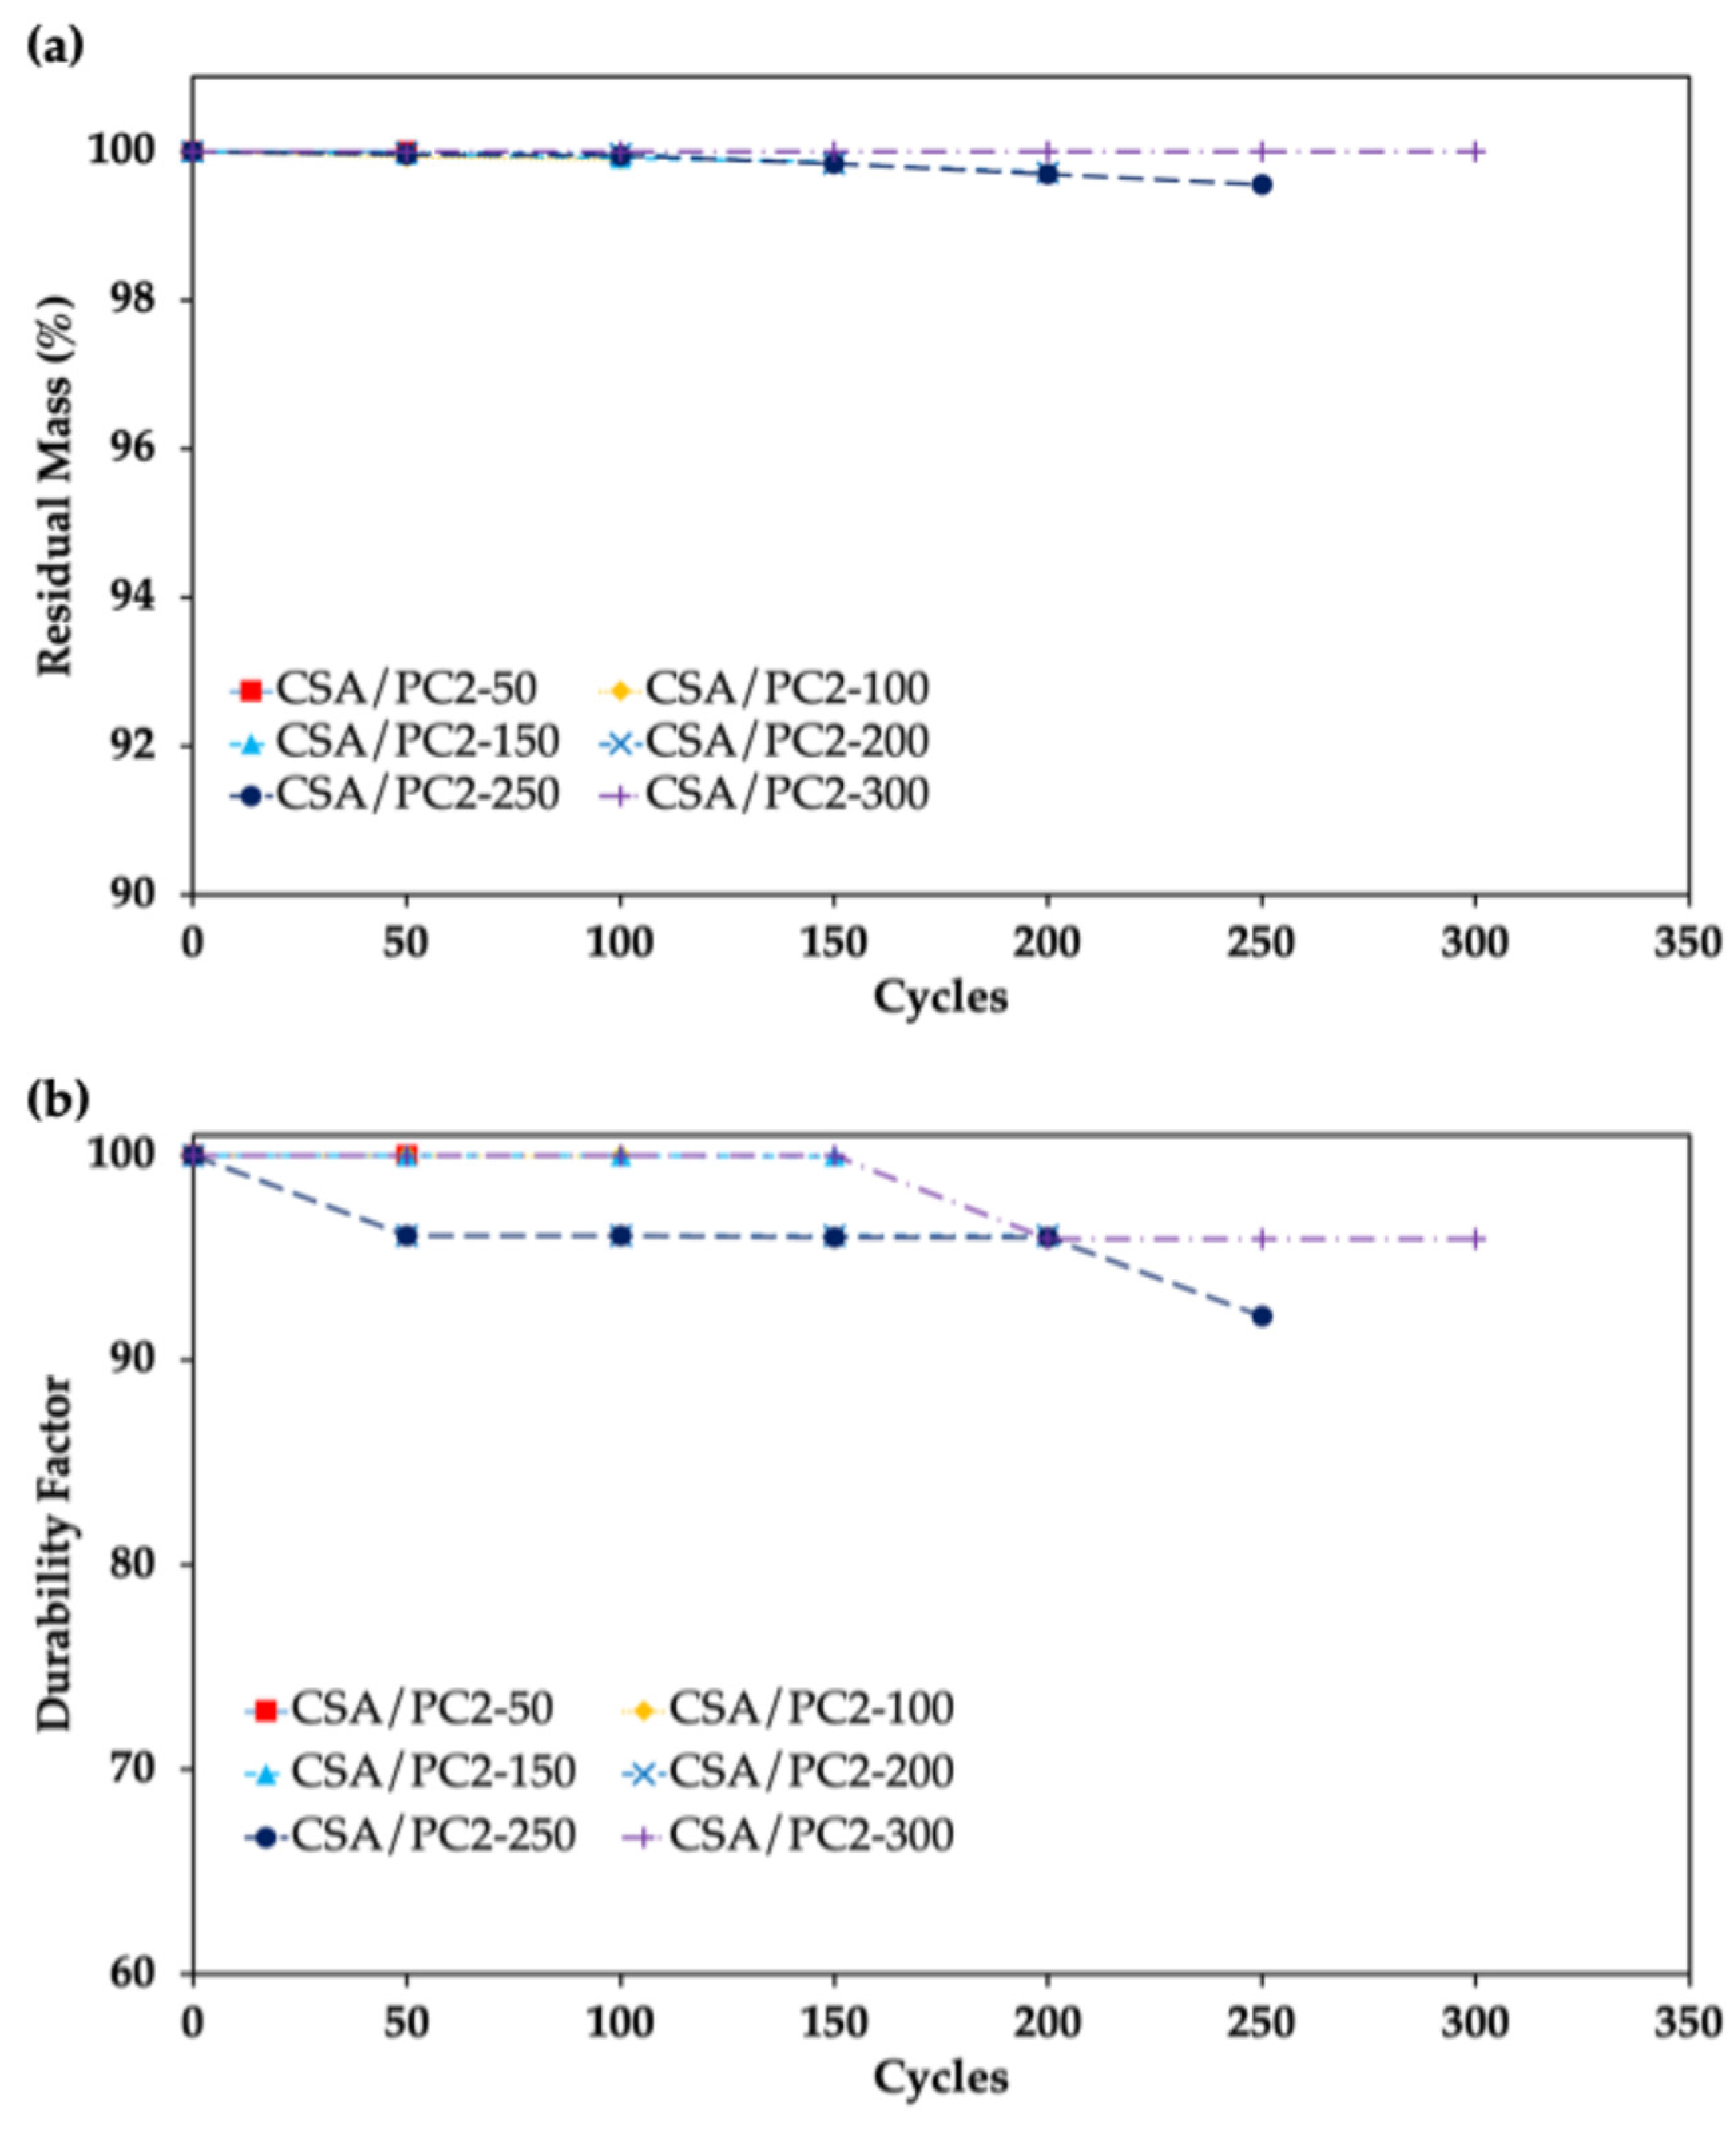
4.2. Freeze–Thaw Deterioration and Performance

Overlayed prisms were exposed to 300 freeze–thaw cycles. Following ASTM C666 [17], the temperature of prismatic specimens was alternated between 4.4 °C and −17.7 °C, over a five hour period, during the freezing and thawing cycles. The temperature was monitored through embedded thermocouples in blank concrete prisms in three places in the freeze–thaw cabinet. Specimens were removed from the freeze–thaw cabinet every 50 cycles to have their mass and dynamic modulus measured. Following each set of 50 cycles, one specimen was placed aside for pull-off testing, and the other specimens were put back into the machine to undergo more freeze–thaw operations. Mass and fundamental resonant impact frequency were recorded for each prism every 50 cycles until pull-off testing. A visual inspection of surface damage and quality was performed after 300 cycles, preceding the final pull-off tests. The fundamental resonant impact frequency was measured after each set of freeze–thaw cycles to calculate the durability factor (DF) for each system. The DF allows a comparison of damage between specimens and reference concrete. In this test method aimed at measuring the deterioration in the overlay–substrate composite, the reference concrete used was the overlay–substrate composite prism before any freeze–thaw cycling [60]. The DF depends on the determination of fundamental resonant impact frequencies and is determined by the relative dynamic modulus of elasticity [56].
P C = n 1 2 n 2 × 100
Equation (3) calculates the relative dynamic modulus where n is the fundamental transverse frequency before freeze–thaw conditioning and n 1 is the frequency after c freeze–thaw cycles. Fundamental frequencies, including longitudinal, transverse, and torsional, were measured using the forced resonance method. The fundamental transverse frequency was obtained by striking the center of the specimen perpendicular to the bond plane, with the accelerometer on the same face at the end of the specimen. Additionally, the results from the RTG are ultimately used for the determination of the DF of the specimen. The DF is calculated by Equation (4), as follows [17]:
DF = P N M
P is the relative dynamic modulus of elasticity at each measurement point; M is the total number of exposure cycles; and N is the number of cycles where the specimen did not reach the minimum P value. If a specimen’s DF is above 80% of the control sample’s resonant frequency, then DF equals P. In addition, Table 4, Table 5 and Table 6 represent the % residual mass (RM) and DF results that are further illustrated by Figure 8, Figure 9 and Figure 10.
Specimens were labeled based on the number of cycles before pull-off testing. The CSA/PC1 specimens subjected to 250 cycles had only a 0.6% loss in mass after 250 cycles, but the one removed at 300 cycles did not align with the dataset, losing 7.2% of mass at 250 cycles and 7.6% after 300 cycles. Furthermore, no CSA/PC1 specimens had a DF below 95%. Impact resonance was performed on all specimens until the prescribed cycle for pull-off testing. Table 5 and Figure 9 illustrate the residual mass and durability factor for the CSA/PC2 system.
The residual mass for the CSA/PC2 systems were below 1% for all specimens. The DF for this series was reduced to 92.14% for the CSA/PC2-250 specimen after 250 cycles. All other specimens had a DF above 95%. Additionally, Table 6 and Figure 10 present the residual mass and durability factor for the CAC/C$/PC ternary system.
The CAC/C$/PC specimens exhibited substantial mass loss, especially CAC/C$/PC-300 losing 7.1% of its original mass gradually during the cycling process, contrasting with the sudden mass loss observed in the CSA/PC1 and CSA/PC2 systems. Additionally, the DFs for the CAC/C$/PC specimens were found to be lower compared to the CSA/PC systems.
For instance, the DF for the CAC/C$/PC-300 specimen was 84.3% after 250 cycles. Notable reductions in the DF were observed between 100/150 and 200/250 cycles, with reductions of 4.1% and 11.6%, respectively. Although other specimens in this series followed a similar trend before being removed from freeze–thaw cycling, the CAC/C$/PC-200 specimen did not experience the same reduction in DF at 250 cycles as observed for the CAC/C$/PC-300 specimen. Consequently, data availability decreases with cycle progression, posing a limitation for statistical analysis due to differing data series representing various systems.

Graphical Representation of Specimens After Freeze–Thaw Cycle

Graphical representation of the freeze–thaw induced CSA/PC1, CSA/PC2, and CAC/C$/PC specimens are exhibited in Figure 11, Figure 12 and Figure 13, respectively. Pictures were taken of the top and bottom of the specimens at 50 cycles, and every 50 cycles thereafter. The picture of the bottom of the specimen shows the visible surface damage on the substrate of the specimens, while the picture of the top of the specimen shows the visible surface damage on the overlay system.
Based on the qualitative analysis, it was observed that all overlay systems showed only discoloration and very minor pitting. The substrate prepared for the lab CAC/C$/PC overlay exhibited pitting as well as surface mortar matrix popouts, resulting in exposure to CA.

4.3. Tensile Pull-Off Strength

Every 50 cycles, a specimen from each overlay system was removed from the freeze–thaw chamber to undergo pull-off testing. The testing procedure ensured a consistent loading rate of 35 ± 15 kPa/s. The tensile pull-off strength was determined by the Equation (5) [61]:
Tensile Bond Strength   =   T o t a l   l o a d A r e a   o f   t e s t   s p e c i m e n
The average pull-off strength of each specimen is dependent on the number of cycles to which the specimens were subjected, and the results are presented in Table 7 and Figure 14. It was observed that the average strength for the CSA/PC1 system decreased from an initial value of 2.5 MPa to a value of 1.7 MPa at 150 cycles with a 32% reduction, and then subsequently increased to a value of 2.4 MPa at 250 cycles, before decreasing by 12.5% to 2.1 MPa at 300 cycles.
For the CSA/PC2 system, the average tensile pull-off strength increased from an initial value of 2 MPa to a value of 2.3 MPa at 150 cycles, and then progressively decreased to a value of 1.9 MPa at 300 cycles, a 17.4% reduction. It was observed that the average tensile pull-off strength for the CAC/C$/PC system exhibited a steady decrease in tensile bond strength with increasing freeze–thaw cycles. The initial pull-off strength was 1.8 MPa, which showed a reduction of 11.1% to 1.6 MPa at 150 cycles, and a final value of 0.6 MPa at 300 cycles.
Table 7 provides a summary of the tensile pull-off strengths for all systems, including the percentage decrease from the initial value, and the average decrease in pull-off strength per cycle. These results indicate that the CSA/PC2 system had the lowest pull-off strength decrease after 300 freeze–thaw cycles overall. The CAC/C$/PC system experienced the largest decrease in pull-off strength, with a total decrease of 66.2% from its initial value. The average decrease per cycle followed the same trend with the CSA/PC2 system having the lowest decrease per cycle, followed by the CSA/PC1 system, and the CAC/C$/PC system had the highest decrease per cycle.

5. Discussion

5.1. Relative Performance of Rapid Repair Overlays

Substrate and overlay systems were evaluated through mechanical and durability tests. Mechanical strength properties were tested using two methodologies such as ASTM C39 for substrate concrete and ASTM C109 for mortar-based overlays [52]. Notably, compressive strength results from ASTM C109 are generally higher than those from ASTM C39. Except for the 1-day CAC/C$/PC, all overlay systems surpassed the compressive strength of the substrate systems at the testing intervals. Although tested later, the concrete substrates were not expected to reach the high compressive strengths of the repair mortars. The initial pull-off strength tests matched the compressive strength results of the overlays. CSA/PC1 performed the best in both compression and tensile bond strength, followed by CSA/PC2. CAC/C$/PC had the lowest compressive and tensile bond strengths. Post-conditioned tensile bond strengths were consistent with initial mechanical tests but varied during conditioning. Durability impact resonance values also aligned with the mechanical test results.

5.1.1. Freeze–Thaw Performance

The freeze–thaw conditioning results show that substrate–overlay systems with durable substrates perform better in impact resonance tests. For the CSA/PC1 and CSA/PC2 series, minimal mass loss was observed, mainly due to substrate degradation, indicating good durability. In contrast, the substrate of CAC/C$/PC system had a poor performance with an average mass loss of 0.1% per cycle, while the overlay remained stable. The effect of composite interaction on frequency data is unclear, needing further study to assess bond zone degradation. The CAC/C$/PC substrate had the lowest strength and air content, which is believed to have contributed to its comparatively poor performance. ASTM C138 does not evaluate the precision of air content measurements, so these differences are not relevant in the qualification of substrates from different batches [58]. The inadequate performance of the CAC/C$/PC substrate suggests that composite specimens require robust substrates to assess the bond performance based solely on the repair material itself. Therefore, substrates should always have an air content of at least 6.5% ± 1.5% to perform well against freeze–thaw cycles [61]. It is not the intention to address the performance of pre-damaged substrate systems in this study.

5.1.2. Compressive Strength and Tensile Bond Strength

The compressive strength of both pre-packaged overlay systems met the 1-day and 7-day compressive strength requirements for all classes (R1, R2, and R3) of pre-packaged rapid hardening materials set forth by ASTM C928 [51]. The CAC/C$/PC system was made in the lab and does not follow the ASTM C928 standard. However, it only failed to meet the 1-day requirement for an R3 material under ASTM C928 and it met and exceeded all other specifications. Both prepackaged, manufactured overlay systems achieved higher compressive strengths faster than the substrate system. The lab-made overlay system had a lower 1-day compressive strength compared to the 28-day compressive strength of all substrates but exceeded it at 7 days. According to ASTM C39 and ASTM C109 standards, the variability in compressive strength results was within acceptable limits for all specimens except the CAC/C$/PC overlay at 7 days, which showed an 11.8% variation, slightly above the allowed 10.6%. The variation for all substrates was 6.5%. ASTM C39 and ASTM C109 both allow a 10.6% variation [52,59]. The highest variation within the limits was 9.5% for the CAC/C$/PC overlay at 1 day.
Initially, the CSA/PC1 system showed a decline in tensile bond strength and improved after 150 cycles but then declined again between 250 and 300 cycles. The tensile bond strength of the CSA/PC2 system increased up to 150 cycles and then fell back to a level close to the starting value. The CAC/C$/PC system performed the least, with a steady decrease in tensile bond strength throughout the cycles. Visual analysis of the CAC/C$/PC system revealed poor performance, with the substrates appearing to limit the bonding potential of the overlay. The CAC/C$/PC system started with slightly lower tensile pull-off strength, indicating a weaker bond potential. Due to low air entrainment, this system deteriorated earlier than expected. This suggests that assessing the risk of freeze–thaw damage should be part of a pavement repair program. At 150 cycles, all systems showed a significant change, either increasing or decreasing in bond strength, marking an inflection point in the bond strength trend. ASTM C928 requires a bond strength of at least 7 MPa for pre-packaged rapid repair materials, but none of the three systems tested met this standard. ASTM C928 uses a slant–shear bond test, which is different from the direct tension pull-off test used here. Slant–shear tests apply force at an angle, engaging the bond zone differently than pull-off tests that apply force directly [62,63,64]. Due to these differences, results from these tests are not directly comparable, and slant–shear tests often show higher values. More research is needed to understand how freeze–thaw damage affects the tensile bond strength and the significance of changes in bond strength trends during testing.

5.1.3. Evaluation of Combined Testing Measures and Modifications

Two performance measures were tested on different prismatic specimens conforming to ASTM C666 [17] and ASTM C1583 [53]. Pull-off testing faced challenges due to the dimensions of the prisms, which do not allow standard equipment to stabilize. To address this, a special bearing plate was used, and the specimens needed to be ground flat to avoid flexural failures. Drilling depth was crucial, as follows: too shallow and the bond zone is not engaged; too deep and the core causes undesirable shear failures. The results from pull-off tests must be compared with frequency measurements to assess the effectiveness of using resonant frequencies in testing. A drawback is that after 50 cycles, the frequency response data decrease by one point for each additional cycle, requiring many samples for a complete dataset.

5.1.4. Availability of Dataset and Accuracy Measures

The limited dataset in this study restricts the analysis of the relationship between pull-off test data and impact resonance data. To better understand these connections, a more detailed study is needed. Destructive testing, which is common in studies of deterioration, limits the number of samples available for analysis.
Pull-off test results can vary significantly. ASTM C1583 notes a pooled standard deviation of 0.29 MPa for pull-off strengths, which is large relative to the average strength of the overlay systems tested [53]. This aligns with the observations of this study, where individual specimen deviations ranged from 0.03 to 0.3 MPa. The low standard deviations suggest that different testing setups provide similar precision. More research is needed to evaluate the repeatability and accuracy of tensile pull-off testing on prismatic specimens, especially regarding freeze–thaw damage.
In terms of the loading application intended for slabs to prismatic specimens, it is crucial to account for the differences in specimen size. Smaller specimens tend to have lower pull-off strengths because stresses are concentrated in a smaller area, which can lead to cracks forming more quickly. In pull-off testing, uniaxial tensile loads produce uniform stress at the interface, leading to brittle fractures that typically begin at the vulnerable point of a concrete specimen [65,66]. Additional research is needed to compare pull-off strengths between field samples and laboratory prismatic specimens with similar overlay systems.

5.1.5. Specimen Handling and Mass Change Parameters

Referring Table 5, CSA/PC2 exhibited inconsistent mass change throughout the 300-cycle period, especially the CSA/PC2-300 specimen. The observed inconsistency in mass change, where the percentage increases slightly from 100% at initial phase to an approximate constant value of 100.03% from 50 cycles to 300 cycles, can be attributed to several factors during freeze–thaw cycles. One possibility is that the specimens may have accidentally struck a surface or experienced slight disturbances while being transferred or weighed, leading to small fluctuations in mass. Additionally, minor errors in the measurement process, such as slight discrepancies in the balance calibration or inconsistencies in sample handling, could also contribute to these small increases. Another factor could be the inherent variation in environmental conditions, such as humidity or temperature, which might affect the specimen’s mass slightly.

5.1.6. Relationship Between Tensile Pull-Off Data and Transverse Frequency Response

In this study, the aim was to evaluate the effectiveness of testing mechanical properties in specimens subjected to environmental conditioning. In concrete durability, combined deterioration types often lead to premature failure. A recent review study found that combining certain deterioration modes causes more severe damage [67]. Specifically, the combination of freeze–thaw cycles with monotonic or cyclic loading was identified as the most aggressive [68,69,70,71,72,73]. These conditions are typical for bridge decks exposed to both traffic loads and temperature fluctuations [67].

5.1.7. Edynamic and Relative Edynamic

Pull-off testing in extreme environments can be impractical. Therefore, understanding how deterioration affects strength helps designers and contractors select and evaluate repairs. To compare performance, tensile pull-off results were normalized, with the initial value set at 100%, similar to frequency measurements. Since impact resonance testing is only feasible for small specimens, this method is effective for assessing both substrate and overlay mixture designs.
ASTM C666 defines the relative Edynamic only in terms of frequency response without weighting factors such as residual mass and length change. ASTM C215 defines the Edynamic [56] in Equation (6). The notation C represents a constant value for concrete prisms, M is the specimen mass, and n is the fundamental transverse frequency.
Edynamic = CMn2
Figure 15 presents a comparison between the mechanical and durability results in this study. Pull-off strength values were normalized to 100% at the start, allowing us to track changes over time. Both tensile pull-off and mean transverse frequency data showed similar declines by the end of testing. Error bars for frequency data are not shown due to limited end data and low variability across specimens. In this study, it is suggested that a relationship might exist for specimens with good durability, but for those failing earlier, Edynamic may not accurately reflect bond degradation. It indicates that the resonant response might be less sensitive to bond performance at a higher degradation levels. Further research is needed to better compare the impact resonance with tensile pull-off strength.

5.2. Validity of Proposed Test Method

The proposed test method could be useful for evaluating the freeze–thaw performance in bonded substrate/overlay systems, but it needs more testing and validation before it can be used in the field. The variability in pull-off test results makes it challenging to differentiate between high-performing systems. For instance, while both CSA/PC1 and CSA/PC2 systems showed strong freeze–thaw performance, their high variability made it somewhat difficult to establish clear performance differentiations between them. On the other hand, the pull-off strength decrease in the CAC/C$/PC system matched a decline in durability factor, suggesting the method can track performance changes in poorer performing systems. Further long-term testing is needed to assess how deterioration affects bond strength and testing beyond 300 cycles may be needed to see deterioration in better performing systems. However, testing beyond 300 cycles may be too rigorous and not accurately reflect real-world conditions.
Substrate quality impacts on test performance were noted as a potential factor in quality of results from the proposed test method; however, it requires further analysis. In this study, three batches of concrete with the same mixture design were used to create substrates for three different repair overlays. Despite using the same mixture, there was variability in the compressive strength and air content. The PC-S3 substrate had the lowest compressive strength and air content and was used in the CAC/C$/PC substrate–overlay composite, which performed the least well of the three systems. It is unclear whether the poor performance was due to the overlay system or the inadequate substrate. More robustness testing is needed to understand how the substrate quality affects the test method and to establish minimum standards for substrates in future testing. The limited scope of this study did not allow for the study of all these factors in the current work. Future work for developing a test method for assessing the bond-zone performance in freeze–thaw should also consider examining how the overlay bond, damage during concrete removal, and strength of substrate may impact bond-zone performance.
In this initial feasibility study, a limited number of specimens were used, which made it difficult to assess the impact of variability. For this study, seven specimens were prepared for each substrate–overlay combination as follows: one for the initial bond properties and one for each 50-cycle period. Each specimen was destructively tested and could not be reused. Future research should involve casting multiple specimens for each test age to better understand the reliability and variability of the test method. Additionally, future work should benchmark the test method against existing field applications to see if it can accurately predict real-world performance. However, the requirements for a large number of specimens for a final test method are not recommended as freeze–thaw cycling equipment has limited space capacity and it can take several months to complete 300 cycles. If too many specimens are required, it will reduce the feasibility for testing laboratories to actually complete the test.

6. Conclusions

In this study, the aim was to evaluate the impact of freeze–thaw cycling using both standard and new testing methods. It was determined that the testing methodology employed can capture changes in end-cycle bond strength that occurred during an environmental conditioning period, but that the variability in pull-off strength data is relatively large and direct comparison is difficult.
The strength and durability tests suggest a link between tensile bond strength and the fundamental transverse frequency of composite prismatic specimens. Furthermore, more research is needed to determine if 300 cycles provide enough data for the long-term durability or if a longer cycling period is necessary. Future research may therefore include different types of substrate system with optimized design, increased number of samples, and different types of overlay systems with varying repair materials. Further experiments should also investigate how substrate condition affects tensile bond strength, as compressive strength alone does not fully determine bonding quality.
Furthermore, it was determined that tensile pull-off testing is possible on prismatic specimens within a narrow range of core drill depths; however, the following conditions are necessary:
the overlay thickness must meet the manufacturer’s minimum specification;
the aggregate size should be one-third of the substrate depth;
the sample depth must be at least 3 inches perpendicular to the drilling face;
drilling should extend at least ½ inch beyond the bond zone;
testing must use a bearing plate to ensure full engagement of the dolly.
In conclusion, in this study, it was demonstrated that a standard 300-cycle testing regime effectively evaluates the bond strength of RRMs against freeze–thaw deterioration, revealing their ability to maintain a strong bond with a prepared substrate. However, substrate condition emerged as a critical factor, leading to the premature degradation of the composite system in early cycles. Additionally, the test method proved successful in inducing bond-only failures, with no instances of substrate or repair layer failures across the experimental series.

Author Contributions

Conceptualization, M.J.B. and M.P.A.; methodology, N.A.T. and M.P.A.; formal analysis, N.A.T., M.M.H., M.J.B. and M.P.A.; data curation, M.M.H. and N.A.T.; writing—original draft, N.A.T. and M.M.H.; writing—review and editing, M.J.B. and M.P.A.; visualization, M.M.H. and N.A.T.; supervision, M.J.B. and M.P.A.; project administration, M.P.A.; funding acquisition, M.J.B. and M.P.A. All authors have read and agreed to the published version of the manuscript.

Funding

This study was funded through grant CAIT-UTC-REG2A from the Center for Advanced Infrastructure and Transportation University Transportation Center and through support from the John A. Reif Jr. Department of Civil and Environmental Engineering at New Jersey Institute of Technology.

Data Availability Statement

The data may be accessible upon request from the corresponding author (matthew.p.adams@njit.edu).

Acknowledgments

The authors of the paper express their sincerest gratitude to the John A. Reif Jr. Department of Civil and Environmental Engineering, New Jersey Institute of Technology, for their technical, laboratory, and materials support. We would also like to thank Anuruddha Jayasuriya, Jin Fan, Aaron Strand, and Marwa Korayem for their occasional help in creating specimens in the laboratory.

Conflicts of Interest

The authors declare no conflicts of interest.

References

  1. Pang, B.; Yang, C.; Wang, P.; Tian, L.; Mei, B.; Song, X. Cement-Based Ductile Rapid Repair Material Modified with Self-Emulsifying Waterborne Epoxy. J. Build. Eng. 2023, 79, 107864. [Google Scholar] [CrossRef]
  2. Liu, Z.; Jiang, J.; Jin, X.; Wang, Y.; Zhang, Y. Experimental and Numerical Investigations on the Inhibition of Freeze–Thaw Damage of Cement-Based Materials by a Methyl Laurate/Diatomite Microcapsule Phase Change Material. J. Energy Storage 2023, 68, 107665. [Google Scholar] [CrossRef]
  3. Liu, Z.; Qian, R.; Gao, S.; Wang, Y.; Jiang, J.; Zhang, Y. Modelling of Damage Spatiotemporal Distribution in Saturated Cementitious Materials and Its Chloride Transport Evolution. J. Adv. Concr. Technol. 2023, 21, 248–261. [Google Scholar] [CrossRef]
  4. Weisbrod, G.; Vary, D.; Treyz, G. Measuring Economic Costs of Urban Traffic Congestion to Business. Transp. Res. Rec. 2003, 1839, 98–106. [Google Scholar] [CrossRef]
  5. Weisbrod, G.; Vary, D.; Treyz, G.I. Economic Implications of Congestion; NCHRP Report; TRID: Washington, DC, USA, 2001. [Google Scholar]
  6. FHWA. Concrete Pavement Preservation Guide, 2nd ed.; 7th Floor: Washington, DC, USA, 2014.
  7. Frentress, D.P.; Harrington, D.S. Guide for Partial Depth Repair of Concrete Pavements; Institute for Transportation-Iowa State University: Ames, IA, USA, 2012. [Google Scholar]
  8. Broomfield, J. Corrosion of Steel in Concrete: Understanding. Investig. Repair/EFN 1997, 1–15. [Google Scholar]
  9. Roberge, P.R. Corrosion Engineering: Principles and Practice; McGraw Hill: New York, NY, USA, 2008; Volume 232. [Google Scholar]
  10. Amini, K. Laboratory Testing of High Performance Repair Materials for Pavements and Bridge Decks. Ph.D. Thesis, Cleveland State University, Cleveland, OH, USA, 2015. [Google Scholar]
  11. Thomas, J.G. The Electrochemistry of Corrosion. Hinds, G., Ed.; The National Physical Laboratory: Teddington, UK, 2004. [Google Scholar]
  12. Adams, M.P.; Lute, R.D.; Moffatt, E.G.; Ideker, J.H. Evaluation of a Procedure for Determining the Converted Strength of Calcium Aluminate Cement Concrete. J. Test. Eval. 2018, 46, 1659–1672. [Google Scholar] [CrossRef]
  13. Yu, H.; Ma, H.; Yan, K. An Equation for Determining Freeze-Thaw Fatigue Damage in Concrete and a Model for Predicting the Service Life. Constr. Build. Mater. 2017, 137, 104–116. [Google Scholar] [CrossRef]
  14. Guo, J.; Sun, W.; Xu, Y.; Lin, W.; Jing, W. Damage Mechanism and Modeling of Concrete in Freeze–Thaw Cycles: A Review. Buildings 2022, 12, 1317. [Google Scholar] [CrossRef]
  15. De Kock, T.; Boone, M.A.; De Schryver, T.; Van Stappen, J.; Derluyn, H.; Masschaele, B.; De Schutter, G.; Cnudde, V. A Pore-Scale Study of Fracture Dynamics in Rock Using X-Ray Micro-CT under Ambient Freeze–Thaw Cycling. Environ. Sci. Technol. 2015, 49, 2867–2874. [Google Scholar] [CrossRef]
  16. American Concrete Institute. ACI Committee 201 201.2R-16 Guide to Durable Concrete; Technical Documents; American Concrete Institute: Farmington Hills, MI, USA, 2016. [Google Scholar]
  17. ASTM C666/C666M; Standard Test Method for Resistance of Concrete to Rapid Freezing and Thawing. ASTM International: West Conshohocken, PA, USA, 2015. [CrossRef]
  18. Qiu, J.; Zhou, Y.; Vatin, N.I.; Guan, X.; Sultanov, S.; Khemarak, K. Damage Constitutive Model of Coal Gangue Concrete under Freeze-Thaw Cycles. Constr. Build. Mater. 2020, 264, 120720. [Google Scholar] [CrossRef]
  19. Wang, R.; Zhang, Q.; Li, Y. Deterioration of Concrete under the Coupling Effects of Freeze–Thaw Cycles and Other Actions: A Review. Constr. Build. Mater. 2022, 319, 126045. [Google Scholar] [CrossRef]
  20. Shang, H.-S.; Yi, T.-H. Freeze-thaw Durability of Air-entrained Concrete. Sci. World J. 2013, 2013, 650791. [Google Scholar] [CrossRef] [PubMed]
  21. Peng, G.-F.; Ma, Q.; Hu, H.-M.; Gao, R.; Yao, Q.-F.; Liu, Y.-F. The Effects of Air Entrainment and Pozzolans on Frost Resistance of 50–60 MPa Grade Concrete. Constr. Build. Mater. 2007, 21, 1034–1039. [Google Scholar] [CrossRef]
  22. Zhao, Z.; Guan, X.; Xiao, F.; Xie, Z.; Xia, P.; Zhou, Q. Applications of Asphalt Concrete Overlay on Portland Cement Concrete Pavement. Constr. Build. Mater. 2020, 264, 120045. [Google Scholar] [CrossRef]
  23. Wang, B.; Gupta, R. Analyzing Bond-Deterioration during Freeze-Thaw Exposure in Cement-Based Repairs Using Non-Destructive Methods. Cem. Concr. Compos. 2021, 115, 103830. [Google Scholar] [CrossRef]
  24. Harrington, D.; Fick, G.; Bordelon, A.; Cable, J.; DeGraaf, D.; Parkes, N.; Riley, R.; Rodden, R.; Roesler, J.; Vandenbossche, J. Guide to Concrete Overlays: Sustainable Solutions for Resurfacing and Rehabilitating Existing Pavements, 3rd ed.; American Concrete Pavement Association: Washington, DC, USA, 2014. [Google Scholar] [CrossRef]
  25. Guan, Y.; Gao, Y.; Sun, R.; Won, M.C.; Ge, Z. Experimental Study and Field Application of Calcium Sulfoaluminate Cement for Rapid Repair of Concrete Pavements. Front. Struct. Civ. Eng. 2017, 11, 338–345. [Google Scholar] [CrossRef]
  26. Darter, M. Concrete Repair Best Practices: A Series of Case Studies; Missouri Department of Transportation, Construction & Materials Division: Jefferson City, MO, USA, 2017. [Google Scholar]
  27. Chen, D.-H.; Lin, H.-H.; Sun, R. Field Performance Evaluations of Partial-Depth Repairs. Constr. Build. Mater. 2011, 25, 1369–1378. [Google Scholar] [CrossRef]
  28. Moffatt, E. Durability of Rapid-Set (Ettringite-Based) Concrete. Doctoral Dissertation, University of New Brunswick, Fredricton, NB, Canada, 2016. [Google Scholar]
  29. Zaman, J. Concrete Mix Design for TxDOT CRCP Repair: Utilizing Rapid Set Cement (RSC) with Nano Calcium Carbonate. Ph.D Thesis, Texas Tech University, Lubbock, TX, USA, 2024. [Google Scholar]
  30. Nehring, J.; Neubauer, J.; Berger, S.; Goetz-Neunhoeffer, F. Acceleration of OPC by CAC in Binary and Ternary Systems: The Role of Pore Solution Chemistry. Cem. Concr. Res. 2018, 107, 264–274. [Google Scholar] [CrossRef]
  31. Qoku, E.; Bier, T.A.; Schmidt, G.; Skibsted, J. Impact of Sulphate Source on the Hydration of Ternary Pastes of Portland Cement, Calcium Aluminate Cement and Calcium Sulphate. Cem. Concr. Compos. 2022, 131, 104502. [Google Scholar] [CrossRef]
  32. Qoku, E.; Bier, T.A.; Westphal, T. Phase Assemblage in Ettringite-Forming Cement Pastes: A X-Ray Diffraction and Thermal Analysis Characterization. J. Build. Eng. 2017, 12, 37–50. [Google Scholar] [CrossRef]
  33. Du, F.; Zhu, W.; Yang, R.; Zhang, Y.; Wang, J.; Li, W.; Zuo, W.; Zhang, L.; Chen, L.; She, W. Bioinspired Super Thermal Insulating, Strong and Low Carbon Cement Aerogel for Building Envelope. Adv. Sci. 2023, 10, 2300340. [Google Scholar] [CrossRef]
  34. Ojovan, M.I.; Lee, W.E.; Kalmykov, S.N. Chapter 17—Immobilisation of Radioactive Waste in Cement. In An Introduction to Nuclear Waste Immobilisation, 3rd ed.; Ojovan, M.I., Lee, W.E., Kalmykov, S.N., Eds.; Elsevier: Amsterdam, The Netherlands, 2019; pp. 271–303. ISBN 978-0-08-102702-8. [Google Scholar]
  35. Sanfelix, S.G.; Zea-García, J.D.; Londono-Zuluaga, D.; Santacruz, I.; la Torre, A.G.D.; Kjøniksen, A.-L. Hydration Development and Thermal Performance of Calcium Sulphoaluminate Cements Containing Microencapsulated Phase Change Materials. Cem. Concr. Res. 2020, 132, 106039. [Google Scholar] [CrossRef]
  36. Péra, J.; Ambroise, J. New Applications of Calcium Sulfoaluminate Cement. Cem. Concr. Res. 2004, 34, 671–676. [Google Scholar] [CrossRef]
  37. Glasser, F.P.; Zhang, L. High-Performance Cement Matrices Based on Calcium Sulfoaluminate–Belite Compositions. Cem. Concr. Res. 2001, 31, 1881–1886. [Google Scholar] [CrossRef]
  38. Zuniga, J.R. Development of Rapid, Cement-Based Repair Materials for Transportation Structures. Master’s Thesis, University of Texas at Austin, Austin, TX, USA, 2013. [Google Scholar]
  39. Al-Basha, A.J.; Toledo, W.K.; Newtson, C.M.; Weldon, B.D. Ultra-High Performance Concrete Overlays for Concrete Bridge Decks; IOP Publishing: Bristol, UK, 2019; Volume 471, p. 032007. [Google Scholar]
  40. Ma, Z.; Zhu, F.; Ba, G. Effects of Freeze-Thaw Damage on the Bond Behavior of Concrete and Enhancing Measures. Constr. Build. Mater. 2019, 196, 375–385. [Google Scholar] [CrossRef]
  41. Santos, P.M.D.; Júlio, E.N.B.S. Factors Affecting Bond between New and Old Concrete. ACI Mater. J. 2011, 108, 449. [Google Scholar]
  42. Talbot, C.; Pigeon, M.; Beaupre, D.; Morgan, D. Influence of Surface Preparation on Long-Term Bonding of Shotcrete. Mater. J. 1995, 91, 560–566. [Google Scholar]
  43. Santos, P.M.; Júlio, E.N. A State-of-the-Art Review on Roughness Quantification Methods for Concrete Surfaces. Constr. Build. Mater. 2013, 38, 912–923. [Google Scholar] [CrossRef]
  44. Zhao, Y.-R.; Wang, L.; Lei, Z.-K.; Han, X.-F.; Shi, J.-N. Study on Bending Damage and Failure of Basalt Fiber Reinforced Concrete under Freeze-Thaw Cycles. Constr. Build. Mater. 2018, 163, 460–470. [Google Scholar] [CrossRef]
  45. Chen, J.; Wang, H.; Xie, P. Finite Element Modeling of Mechanical Responses of Concrete Pavement with Partial Depth Repair. Constr. Build. Mater. 2020, 240, 117960. [Google Scholar] [CrossRef]
  46. ASTM C150/C150M; Standard Specification for Portland Cement1. ASTM International: West Conshohocken, PA, USA, 2024. [CrossRef]
  47. Adams, M.P.; Ideker, J.H. Influence of Aggregate Type on Conversion and Strength in Calcium Aluminate Cement Concrete. Cem. Concr. Res. 2017, 100, 284–296. [Google Scholar] [CrossRef]
  48. ASTM C33/C33M; Standard Specification for Concrete Aggregates. ASTM International: West Conshohocken, PA, USA, 2024. [CrossRef]
  49. ASTM C127; Standard Test Method for Relative Density (Specific Gravity) and Absorption of Coarse Aggregate. ASTM International: West Conshohocken, PA, USA, 2024. [CrossRef]
  50. ACI 211.1-91; Standard Practice for Selecting Proportions for Normal, Heavyweight, and Mass Concrete. 38800 Country Club Drive: Farmington Hills, MI, USA, 1991.
  51. ASTM C928/C928M; Standard Specification for Packaged, Dry, Rapid-Hardening Cementitious Materials for Concrete Repairs. ASTM International: West Conshohocken, PA, USA, 2020. [CrossRef]
  52. ASTM C109/C109M; Standard Test Method for Compressive Strength of Hydraulic Cement Mortars (Using 2-in. or [50 mm] Cube Specimens). ASTM International: West Conshohocken, PA, USA, 2024. [CrossRef]
  53. ASTM C1583/C1583M; Standard Test Method for Tensile Strength of Concrete Surfaces and the Bond Strength or Tensile Strength of Concrete Repair and Overlay Materials by Direct Tension (Pull-Off Method). ASTM International: West Conshohocken, PA, USA, 2020.
  54. ASTM C511; Standard Specification for Mixing Rooms, Moist Cabinets, Moist Rooms, and Water Storage Tanks Used in the Testing of Hydraulic Cements and Concretes. ASTM International: West Conshohocken, PA, USA, 2021. [CrossRef]
  55. ICRI Committee 310. Guideline No. 310.2R–2013: Selecting and Specifying Concrete Surface Preparation for Sealers, Coatings, Polymer Overlays, and Concrete Repair; International Concrete Repair Institute: Minneapolis, MN, USA, 2013. [Google Scholar]
  56. ASTM C215; Standard Test Method for Fundamental Transverse, Longitudinal, and Torsional Resonant Frequencies of Concrete Specimens. ASTM International: West Conshohocken, PA, USA, 2019. [CrossRef]
  57. ASTM C143/C143M; Standard Test Method for Slump of Hydraulic-Cement Concrete. ASTM International: West Conshohocken, PA, USA, 2020. [CrossRef]
  58. ASTM C138/C138M; Standard Test Method for Density (Unit Weight), Yield, and Air Content (Gravimetric) of Concrete. ASTM International: West Conshohocken, PA, USA, 2024. [CrossRef]
  59. ASTM C39/C39M; Standard Test Method for Compressive Strength of Cylindrical Concrete Specimens. ASTM International: West Conshohocken, PA, USA, 2024. [CrossRef]
  60. Lamond, J.F.; Pielert, J.H. Significance of Tests and and Concrete-Making STP 169D; ASTM International: West Conshohocken, PA, USA, 2012; p. 664. [Google Scholar]
  61. FHWA. Partial-Depth Repairs; FHWA: Washington, DC, USA, 2017.
  62. Feng, S.; Lyu, J. The Method of Slant Shear Test with Various Slant Shear Angles Decouple Cohesion and Friction of Substrate-Overlays Interface. Constr. Build. Mater. 2024, 456, 139238. [Google Scholar] [CrossRef]
  63. Diab, A.M.; Abd Elmoaty, M.; Eldin, M.R.T. Slant Shear Bond Strength between Self Compacting Concrete and Old Concrete. Constr. Build. Mater. 2017, 130, 73–82. [Google Scholar] [CrossRef]
  64. Feng, S.; Xiao, H.; Li, Y. Influence of Interfacial Parameters and Testing Methods on UHPC–NSC Bond Strength: Slant Shear vs. Direct Tensile Testing. Cem. Concr. Compos. 2022, 131, 104568. [Google Scholar] [CrossRef]
  65. He, S.; Huang, X.; Zhong, H.; Wan, Z.; Liu, G.; Xin, H.; Zhang, Y. Experimental Study on Bond Performance of UHPC-to-NC Interfaces: Constitutive Model and Size Effect. Eng. Struct. 2024, 317, 118681. [Google Scholar] [CrossRef]
  66. Doitrand, A.; Henry, R.; Lube, T.; Meille, S. Size Effect Assessment by Weibull’s Approach and the Coupled Criterion. Eng. Fract. Mech. 2021, 256, 107979. [Google Scholar] [CrossRef]
  67. Zhao, H.; Hu, Y.; Tang, Z.; Wang, K.; Li, Y.; Li, W. Deterioration of Concrete under Coupled Aggressive Actions Associated with Load, Temperature and Chemical Attacks: A Comprehensive Review. Constr. Build. Mater. 2022, 322. [Google Scholar] [CrossRef]
  68. Vicente, M.A.; González, D.C.; Mínguez, J.; Tarifa, M.A.; Ruiz, G.; Hindi, R. Influence of the Pore Morphology of High Strength Concrete on Its Fatigue Life. Int. J. Fatigue 2018, 112, 106–116. [Google Scholar] [CrossRef]
  69. Silva, A.; Jiang, Y.; Castro, J.; Silvestre, N.; Monteiro, R. Monotonic and Cyclic Flexural Behaviour of Square/Rectangular Rubberized Concrete-Filled Steel Tubes. J. Constr. Steel Res. 2017, 139, 385–396. [Google Scholar] [CrossRef]
  70. Bao, J.; Xue, S.; Zhang, P.; Dai, Z.; Cui, Y. Coupled Effects of Sustained Compressive Loading and Freeze–Thaw Cycles on Water Penetration into Concrete. Struct. Concr. 2021, 22, E944–E954. [Google Scholar] [CrossRef]
  71. Hao, L.; Liu, Y.; Xiao, J. Durability of Recycled Aggregate Thermal Insulation Concrete under Combined Flexural Loading and Freeze–Thaw Cycles. Constr. Build. Mater. 2021, 272, 121652. [Google Scholar] [CrossRef]
  72. Shen, Y.; Liu, J.; Zhou, S.; Li, G. Experimental Investigation on the Freeze–Thaw Durability of Concrete under Compressive Load and with Joints. Constr. Build. Mater. 2019, 229, 116893. [Google Scholar] [CrossRef]
  73. Wang, Y.; Cao, Y.; Zhang, P.; Ma, Y.; Zhao, T.; Wang, H.; Zhang, Z. Water Absorption and Chloride Diffusivity of Concrete under the Coupling Effect of Uniaxial Compressive Load and Freeze–Thaw Cycles. Constr. Build. Mater. 2019, 209, 566–576. [Google Scholar] [CrossRef]
Figure 1. Schematic of experimental setup.
Constrmater 05 00003 g001
Figure 2. Scarified substrate system.
Constrmater 05 00003 g002
Figure 3. Substrate for overlay placement.
Constrmater 05 00003 g003
Figure 4. Prism conditioning and testing regime.
Constrmater 05 00003 g004
Figure 5. Coring operation: (a) drill rig, (b) drilled core, and (c) dolly attachment.
Constrmater 05 00003 g005
Figure 6. Schematic setup for pull-off testing: (a) field; (b) laboratory.
Constrmater 05 00003 g006
Figure 7. Compressive strength of RRM-based systems.
Constrmater 05 00003 g007
Figure 8. CSA/PC1 overlay system: (a) residual mass; (b) durability factor.
Constrmater 05 00003 g008
Figure 9. CSA/PC2 overlay system: (a) residual mass; (b) durability factor.
Constrmater 05 00003 g009
Figure 10. CAC/C$/PC overlay system: (a) residual mass; (b) durability factor.
Constrmater 05 00003 g010
Figure 11. CSA/PC1_300 system: substrate; overlay throughout cycles.
Constrmater 05 00003 g011
Figure 12. CSA/PC2_300 system: substrate; overlay throughout cycles.
Constrmater 05 00003 g012
Figure 13. CAC/C$/PC_300 system: substrate; overlay.
Constrmater 05 00003 g013
Figure 14. Tensile pull-off strength of all systems.
Constrmater 05 00003 g014
Figure 15. Comparison of tensile pull-off strength and impact resonance results for (a) CSA/PC1; (b) CSA/PC2; (c) CAC/C$/PC systems.
Constrmater 05 00003 g015
Table 1. Oxide analysis of PC, rapid-set CSA, and CAC cement.
Portland CementRapid-Set CSA CementCAC Cement [47]
OxideAmount (%)
Na2O0.210.180.03
MgO2.752.890.71
Al2O33.7310.0138.23
SiO220.516.584.98
P2O50.220.180.13
SO32.97.650.06
Cl0.05*
K2O0.7710.23
CaO62.4357.137.53
TiO20.190.561.8
Cr2O30.060.05
MnO0.230.11*
Mn2O3**0.23
Fe2O33.342.0115.4
ZnO0.140.05*
SrO0.220.230.02
LOI ***1.410.65
Total100
* not detected. ** accounts for loss due to C, CO2, H2O, OH, organic compounds, and/or other.
Table 2. Physical properties of CA and FA.
Aggregate SpecificationDry-Rodded Unit Weight kg/m3Relative Density (SG)Absorption Capacity (%)
Coarse Aggregate (CA)15112.690.66
Fine Aggregate (FA)-2.750.57
Table 3. Fresh and mechanical properties of substrates.
PropertyPC-S1PC-S2PC-S3
Compressive Strength [MPa]363432.5
Unit Weight [kg/m3]230622912306
Slump [mm]8.912.712.7
Air Content7.50%8%6.50%
Repair System Used on SubstrateCSA/PC1CSA/PC2CAC/C$/PC
Table 4. % Residual mass and durability factor of CSA/PC1 system.
CSA/PC1-50CSA/PC1-100CSA/PC1-150CSA/PC1-200CSA/PC1-250CSA/PC1-300
CycleRM (%)DFRM (%)DFRM (%)DFRM (%)DFRM (%)DFRM (%)DF
0100100100100100100100100100100100100
5099.910099.995.999.995.999.995.999.995.999.9100
100 99.995.999.995.999.995.999.995.999.9100
150 99.895.999.995.999.795.999.9100
200 99.995.999.695.999.8100
250 99.495.992.8100
300 92.495.9
Table 5. % Residual mass and durability factor of CSA/PC2 system.
CSA/PC2-50CSA/PC2-100CSA/PC2-150CSA/PC2-200CSA/PC2-250CSA/PC2-300
CycleRM (%)DFRM (%)DFRM (%)DFRM (%)DFRM (%)DFRM (%)DF
0100100100100100100100100100100100100
5010010099.910099.910099.996.199.996.1100100
100 99.999.999.910099.996.199.996.1100100
150 99.999.999.896.199.895.9100100
200 99.796.199.795.910095.9
250 99.592.110095.9
300 10095.9
Table 6. % residual mass and durability factor of CAC/C$/PC system.
CAC/C$/
PC-50
CAC/C$/
PC-100
CAC/C$/
PC-150
CAC/C$/
PC-200
CAC/C$/
PC-250
CAC/C$/
PC-300
CycleRM (%)DFRM (%)DFRM (%)DFRM (%)DFRM (%)DFRM (%)DF
0100100100100100100100100100100100100
5099.910099.610099.810099.610099.510096.1100
100 99.510099.810099.110099.110096.1100
150 99.395.998.895.998.695.995.295.9
200 98.395.997.995.994.595.9
250 97.295.993.684.3
300 92.984.3
Table 7. Comparison of pull-off testing results.
Overlay SystemInitial Pull-Off Strength (MPa)300-Cycle Pull-Off Strength (MPa)300-Cycle Decrease (%)Avg. Decrease per Cycle (kPa/c)
CSA/PC12.52.114.91.2
CSA/PC221.97.10.5
CAC/C$/PC1.80.666.24.1
Disclaimer/Publisher’s Note: The statements, opinions and data contained in all publications are solely those of the individual author(s) and contributor(s) and not of MDPI and/or the editor(s). MDPI and/or the editor(s) disclaim responsibility for any injury to people or property resulting from any ideas, methods, instructions or products referred to in the content.

