Article

Solvent Relaxation NMR as a Tool to Study Particle Dispersions in Non-Aqueous Systems

by
Zahra Alaei
1,
Beatrice Cattoz
2,
Peter John Dowding
2 and
Peter Charles Griffiths
1,*
1
School of Science, Faculty of Engineering and Science, University of Greenwich, Chatham Maritime, Kent ME4 4TB, UK
2
Infineum International Ltd., Milton Hill Business and Technology Centre, Abingdon OX13 6BB, UK
*
Author to whom correspondence should be addressed.
Physchem 2022, 2(3), 224-234; https://doi.org/10.3390/physchem2030016
Submission received: 21 March 2022 / Revised: 18 May 2022 / Accepted: 12 July 2022 / Published: 15 July 2022

Abstract

:
The determination of the NMR spin–spin relaxation rate of water in (purely) aqueous particulate dispersions has been shown to be a convenient and facile experimental approach to probing the composition of near particle surface structures. Here, a systematic study has been undertaken of both non-aqueous and mixed aqueous–non-aqueous solvent particulate dispersions to explore the universality of the solvent relaxation technique. As in the aqueous case, a linear relationship between the surface area present and the solvent relaxation rate is observed, confirming the rapid exchange of the solvent molecules between the surface and the bulk and thereby illustrating the viability of the experimental methodology to study such systems. Crucially, the surface enhancement effect was considerably weaker in non-aqueous systems compared with aqueous dispersions and reflects a potential limitation of the wider deployment of this experimental methodology.

1. Introduction

Many commodities—products such as lubricants, detergents, paints/inks, foodstuffs, and drug formulations—involve the manipulation of particulate suspensions, often dispersed at high volume fractions [1,2,3,4]. Thus, the characterisation of the surfaces within such particulate suspensions is a necessary first step in the optimisation of those formulations.
NMR presents a family of experimental methodologies that can probe concentrated, opaque systems such as particulate dispersions, yielding a variety of dynamic characterisations—diffusion rates [5,6] and relaxation times [7,8]—as well as structural information, e.g., solid-state spectra [9,10], which can be used to investigate the molecular environment of near-surface species. Over the past few years, the solvent relaxation NMR approach has been particularly insightful in characterising aqueous dispersions, both theoretically and experimentally [11,12,13,14,15,16,17,18]. The present work focuses on assessing whether the measurement of solvent relaxation times (rates) in binary aqueous–non-aqueous solvent blends or, indeed, non-aqueous dispersions offer the same experimental potential as aqueous dispersions.

2. Materials & Methods

2.1. Materials

A selection of silica substrates has been studied here; three hydrophobic fumed silica powders and two silica dispersions, as in Table 1. Silica has been selected as the model substrate due to the range of materials available, but one would assume the conclusions drawn here to be general given other known comparisons.
The solvents toluene (99 + %), ethanol (EtOH) (99 + %, absolute), methanol (MeOH) (≥99.5%), decane (99 + %), p-xylene (99 + %), and isopropanol (IPA) (99 + %) were obtained from either Fisher Scientific Ltd, Loughborough, UK or Alfa Aesar, Lancashire, UK and used as received.

2.2. Methods

Measurements of the spin–spin relaxation time ( T 2 ) of the solvent(s) were carried out on a bench-top Xigo Nanotools Acorn AreaTM spectrometer operating at a resonance frequency of 13 MHz , using a CPMG [19,20] pulse sequence. The magnetisation decay curve − ( M x y ( t ) ) versus time ( t )—was recorded with a spacing of 0.5 ms between 90° and 180° pulses and a recycle delay of about 5 T 1 between each cycle to allow for full recovery of the magnetisation between acquisitions. The sample environment was equilibrated at 25 (± 0.5) °C. The signal was averaged over three scans. The built-in Acorn AreaQuant software was used to fit all the relaxation decay curves, which we show were well-described by a single-exponential expression.

Theory

In a simple colloidal dispersion, the relaxation behaviour of the solvent molecules can be modelled as a weighted average of two contributions connected through a rapid exchange between the bulk state with a long T 2 and a highly constrained interfacial state with a considerably shorter T 2 . The overall relaxation time for rapid exchange yields
1 T 2 = 1 p b o u n d T 2 f r e e + p b o u n d T 2 b o u n d
where T 2 is the observed spin–spin relaxation time, p b o u n d is the fraction of time that solvent molecules spend in the bound environment with a shorter relaxation time T 2 b o u n d , whereas T 2 f r e e represents the relaxation time of free solvent molecules [4,21]. In Equation (1), ( 1 / T 2 ) is the effective relaxation rate, which is designated as R 2 . An enhancement in the relaxation rate corresponds to an increase in the residence time or the number of solvent molecules at the surface. Relaxation data are often presented in a normalised form to minimise the effects of instrument-dependent variables as the specific relaxation rate ( R 2 S P ), i.e., normalised to the relaxation rate of the bulk dispersion solvent ( R 2 ° ), Equation (2) [4].
R 2 S P = R 2 R 2 ° 1
where R 2 is the relaxation rate of the solvent within the dispersion and R 2 ° is the relaxation rate of the pure solvent.

3. Results and Discussions

The technique has been widely used to characterise aqueous colloidal dispersions [12,15,16,18], and a range of exemplar data have been summarised in the double-logarithmic representation in Figure 1. In the standard representation, R 2 S P is presented as a function of silica surface area, which is a proxy for pbound, and both are linearly correlated with the concentration of particles. As can be seen, in all cases, each particulate dispersion shows a relaxation enhancement determined by the nature through which the water molecule is constrained at the surface. If the solvent interacts strongly with the surface, the anisotropic motion leads to efficient relaxation and the relaxation rate increases. For aqueous systems, there is a linear correlation between R 2 S P and surface area, with the absolute effect—the surface enhancement—reflecting the hydrophilicity of the surface, as in Figure 2.

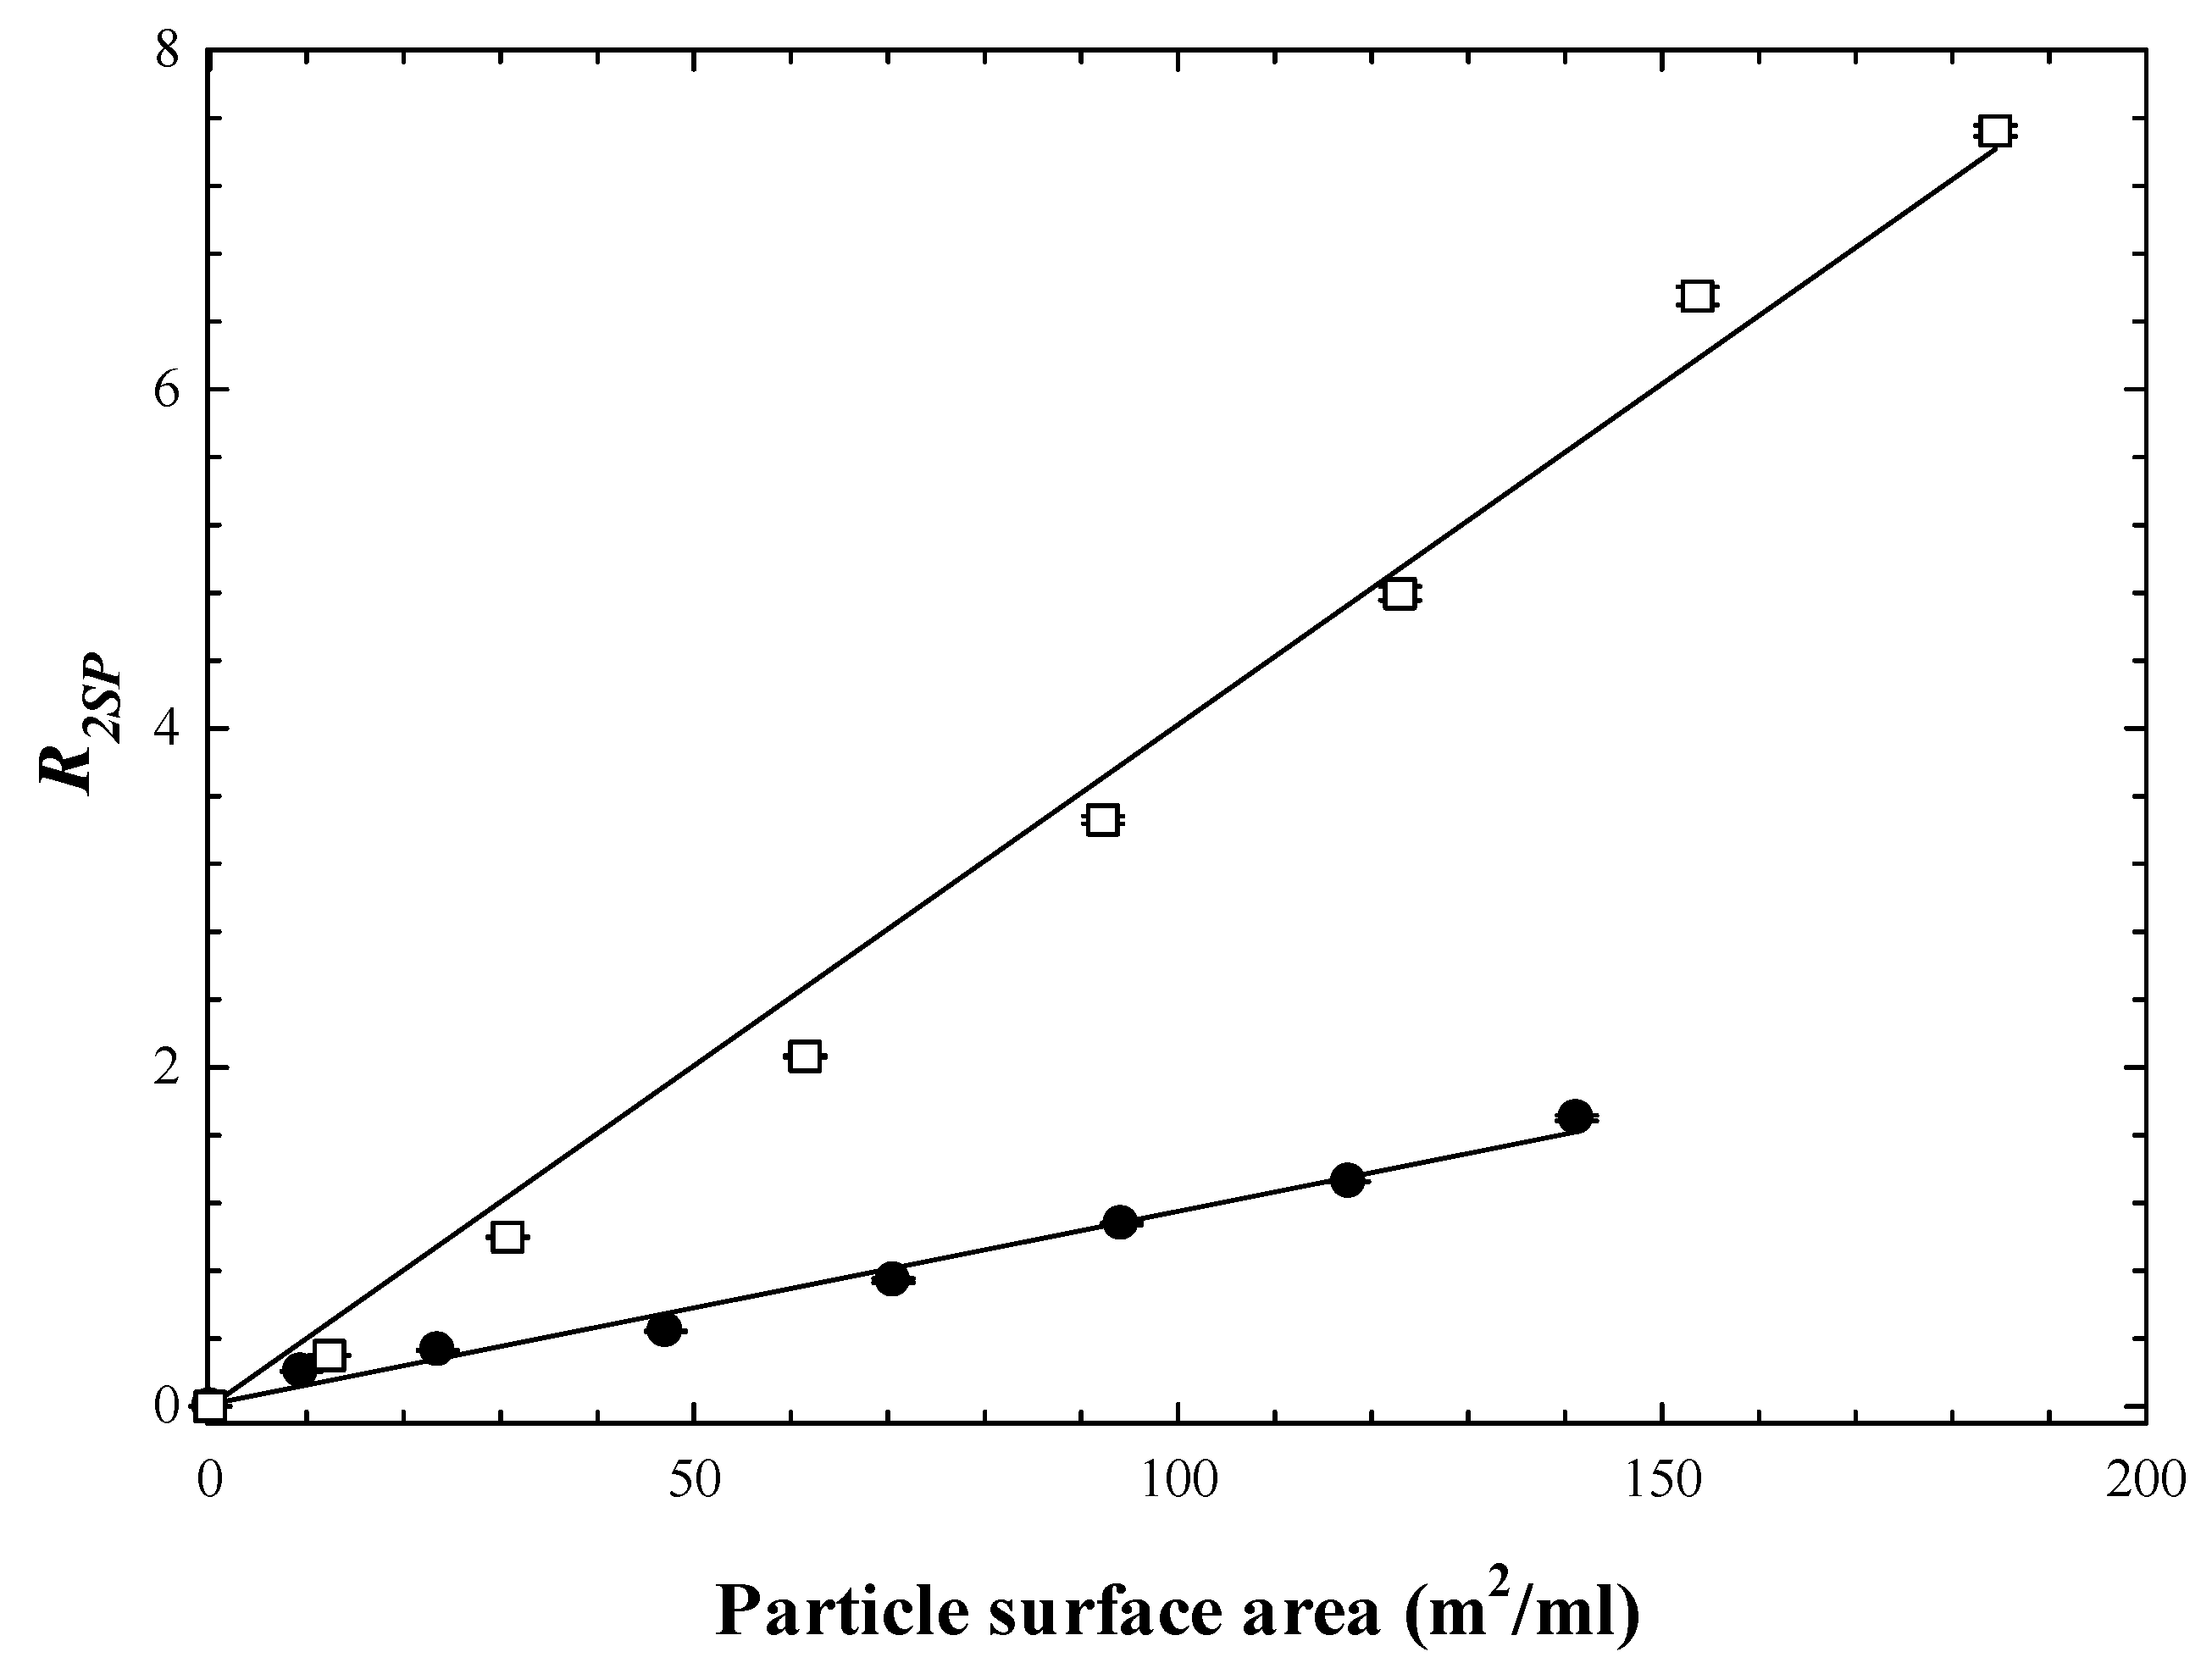
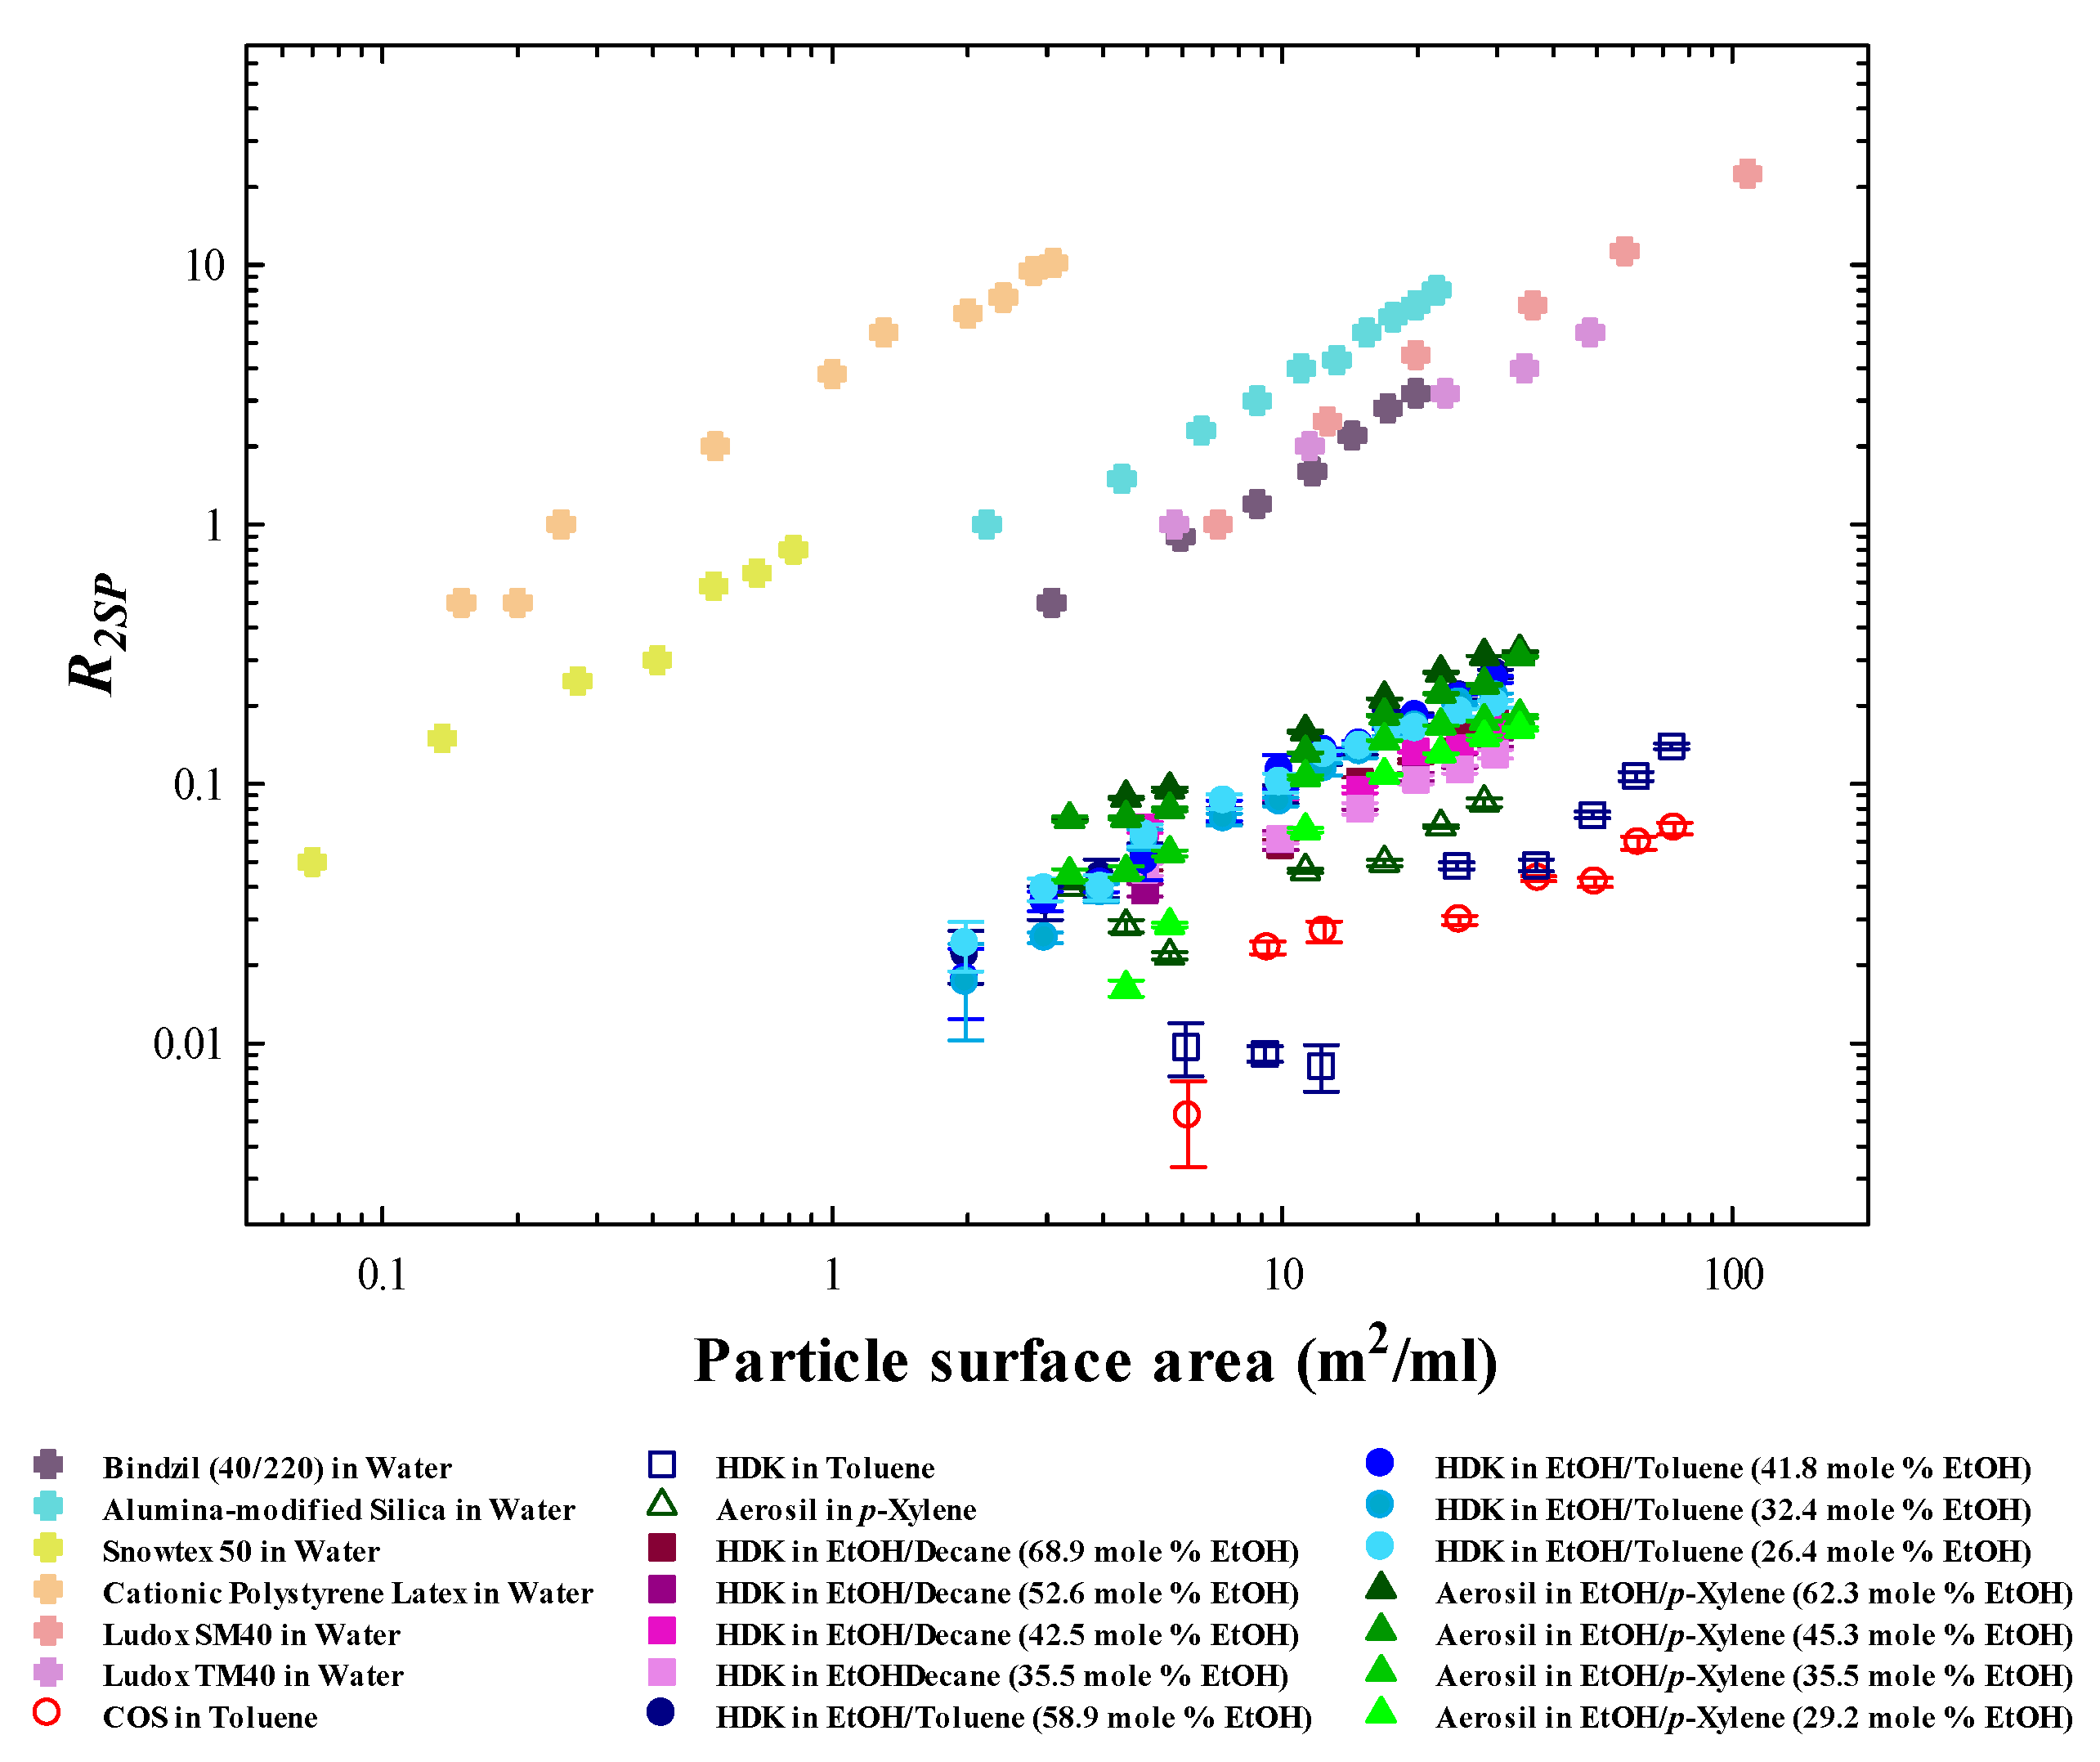
3.1. Comparison of Aqueous and Non-Aqueous Single Solvent Particle Dispersions

Similar exemplar and comparator data for a series of aqueous and non-aqueous silica nanoparticles in a range of solvents are presented in Figure 3 and Figure 4. Again, the standard representation of R 2 S P as a function of particle surface area is used. As in the aqueous case, all data follow a linear relationship [13,18] indicative of a fast exchange. There is a very sensitive coupling of the solvent/surface pairings. Fairhurst et al. [23] have proposed an interpretation of these enhancements in terms of the Hansen Solubility Parameter (HSP) [24], in that liquids with strong interactions with the surface have a faster relaxation rate, thereby exhibiting the highest surface enhancements. There was a correlation with the macroscopic stability of the dispersions in that the solvents that exhibited weak interactions with the surfaces settled relatively quickly compared with the same particles suspended in solvents that showed a high affinity with the surface. Collectively, these studies, therefore, conclude that the technique is also applicable to non-aqueous dispersions, though the magnitude of the effect is somewhat smaller.

3.2. Characterisation of Aqueous–Alcohol Solvents

Many formulations involve solvent blends, either during preparation or in their final form. Several questions arise when considering whether NMR solvent relaxation is applicable to dispersions formed from solvent blends, principally whether a single effective relaxation rate is observed and whether any such average rate demonstrates a linear dependence on the surface area, both pre-requisites for Equations (1) and (2). As a first juncture, consider the dynamic averaging operative in the solvent blend itself.
The magnetisation decays for representative binary solvent blends are presented in Figure S1 on a semi-logarithmic plot. This is a low-resolution methodology, i.e., the NMR signal has not been Fourier Transformed to separate the relaxation rates in terms of chemical shifts or solvent identity. The data (and fits) have been normalised to the intensity at t = 0 returned in the fitting route. In all cases, the data follow a single-exponential decay indicating that the measured T 2 (and equivalently, the relaxation rate ( R 2 )) reflects a global average of all the relaxation processes within the entire solvent. The thus-determined blend R 2 was determined for a series of alcohol–aqueous blends, viz, methanol (MeOH), ethanol (EtOH), and isopropyl alcohol (IPA) as a function of composition, expressed in terms of the alcohol mole fraction ( χ A l c o h o l ). Figure S2 presents the excess relaxation rate R 2 s p e x c e s s for these three alcohol–aqueous blends defined as:
R 2 s p e x c e s s = R 2 R 2 ( l i n e a r )
where R 2 ( l i n e a r ) is the weighted average expected from two independently relaxing populations of species:
R 2 S P ( l i n e a r ) = χ a l c o h o l R 2 a l c o h o l + ( 1 χ a l c o h o l ) R 2 s o l v e n t
This manipulation now highlights the broad maximum in the enhancement of the relaxation behaviour in the water-rich end of the composition range, centred around χ a l c o h o l = 0.15   ( ± 0.05 ) , with the maximum being more evident for the lower-molecular-weight alcohol blends. It is evident that the number of H-bonded networks between water and alcohol molecules has a significant effect on both the average relaxation rate and changes in the relaxation rates. The strength of alcohols varies markedly, and the order of variation of the average relaxation rate of alcohols is established as IPA > EtOH > MeOH, consistent with a recent study by Yoshida et al. [25].

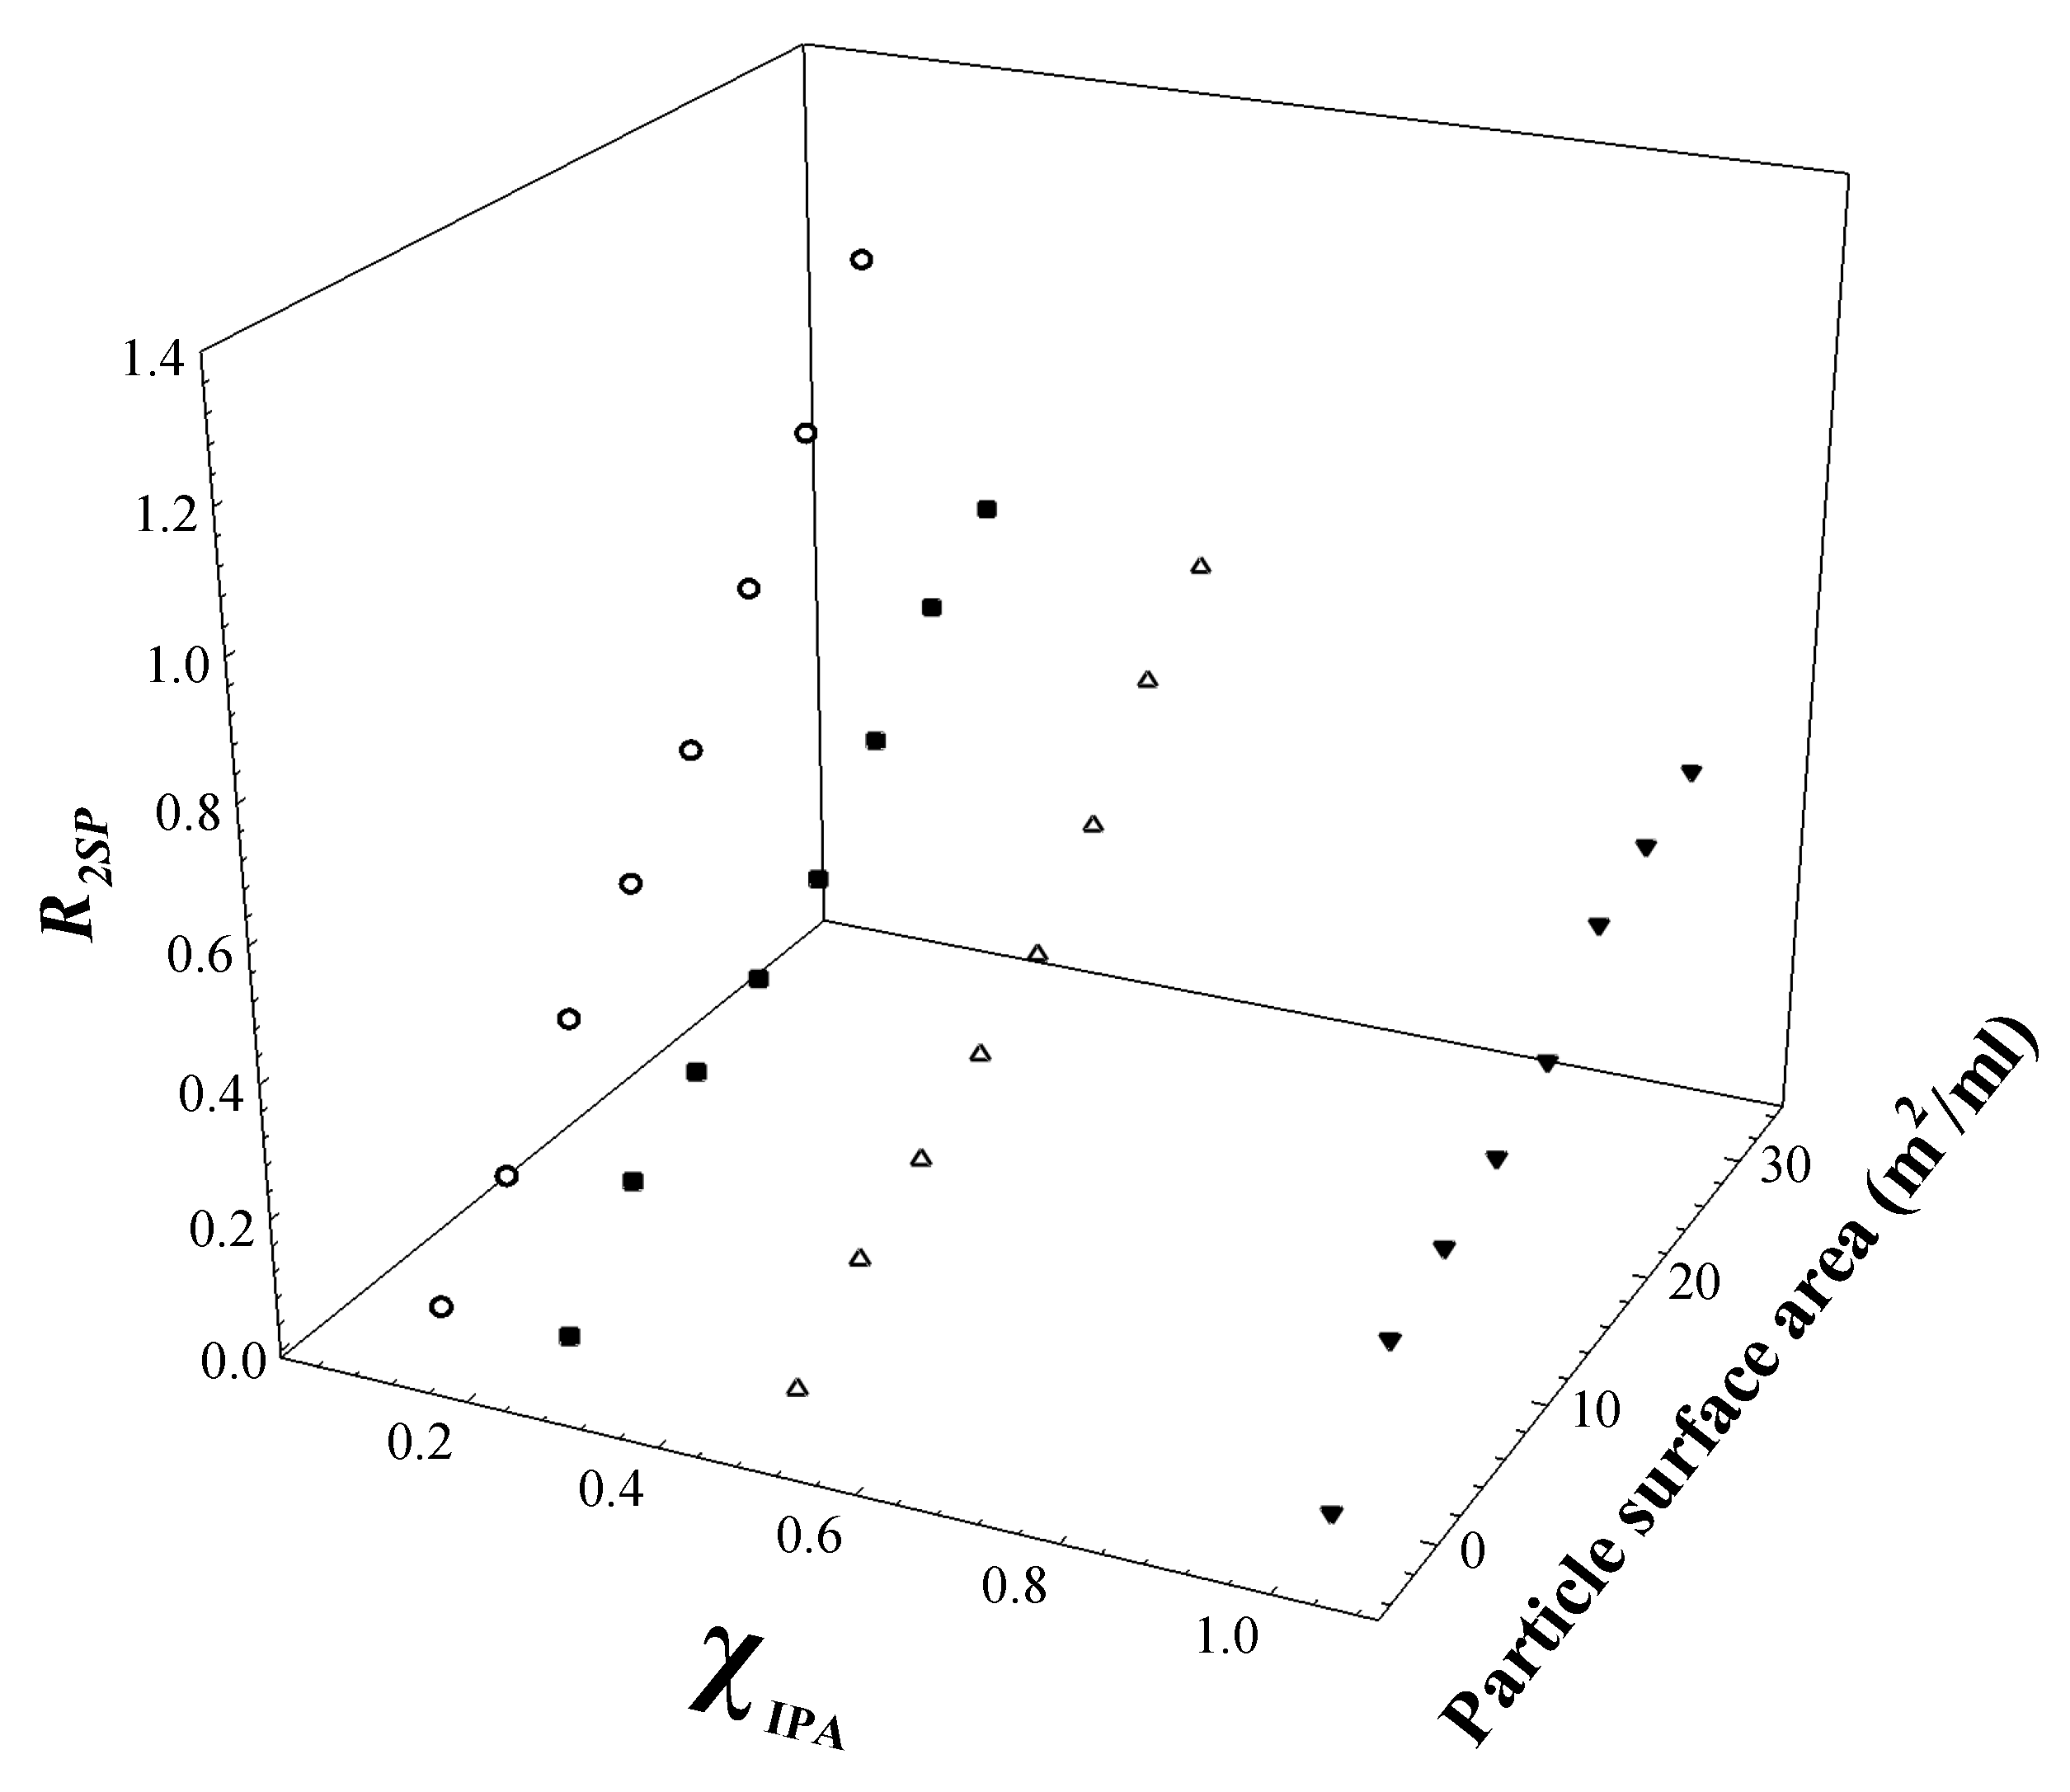
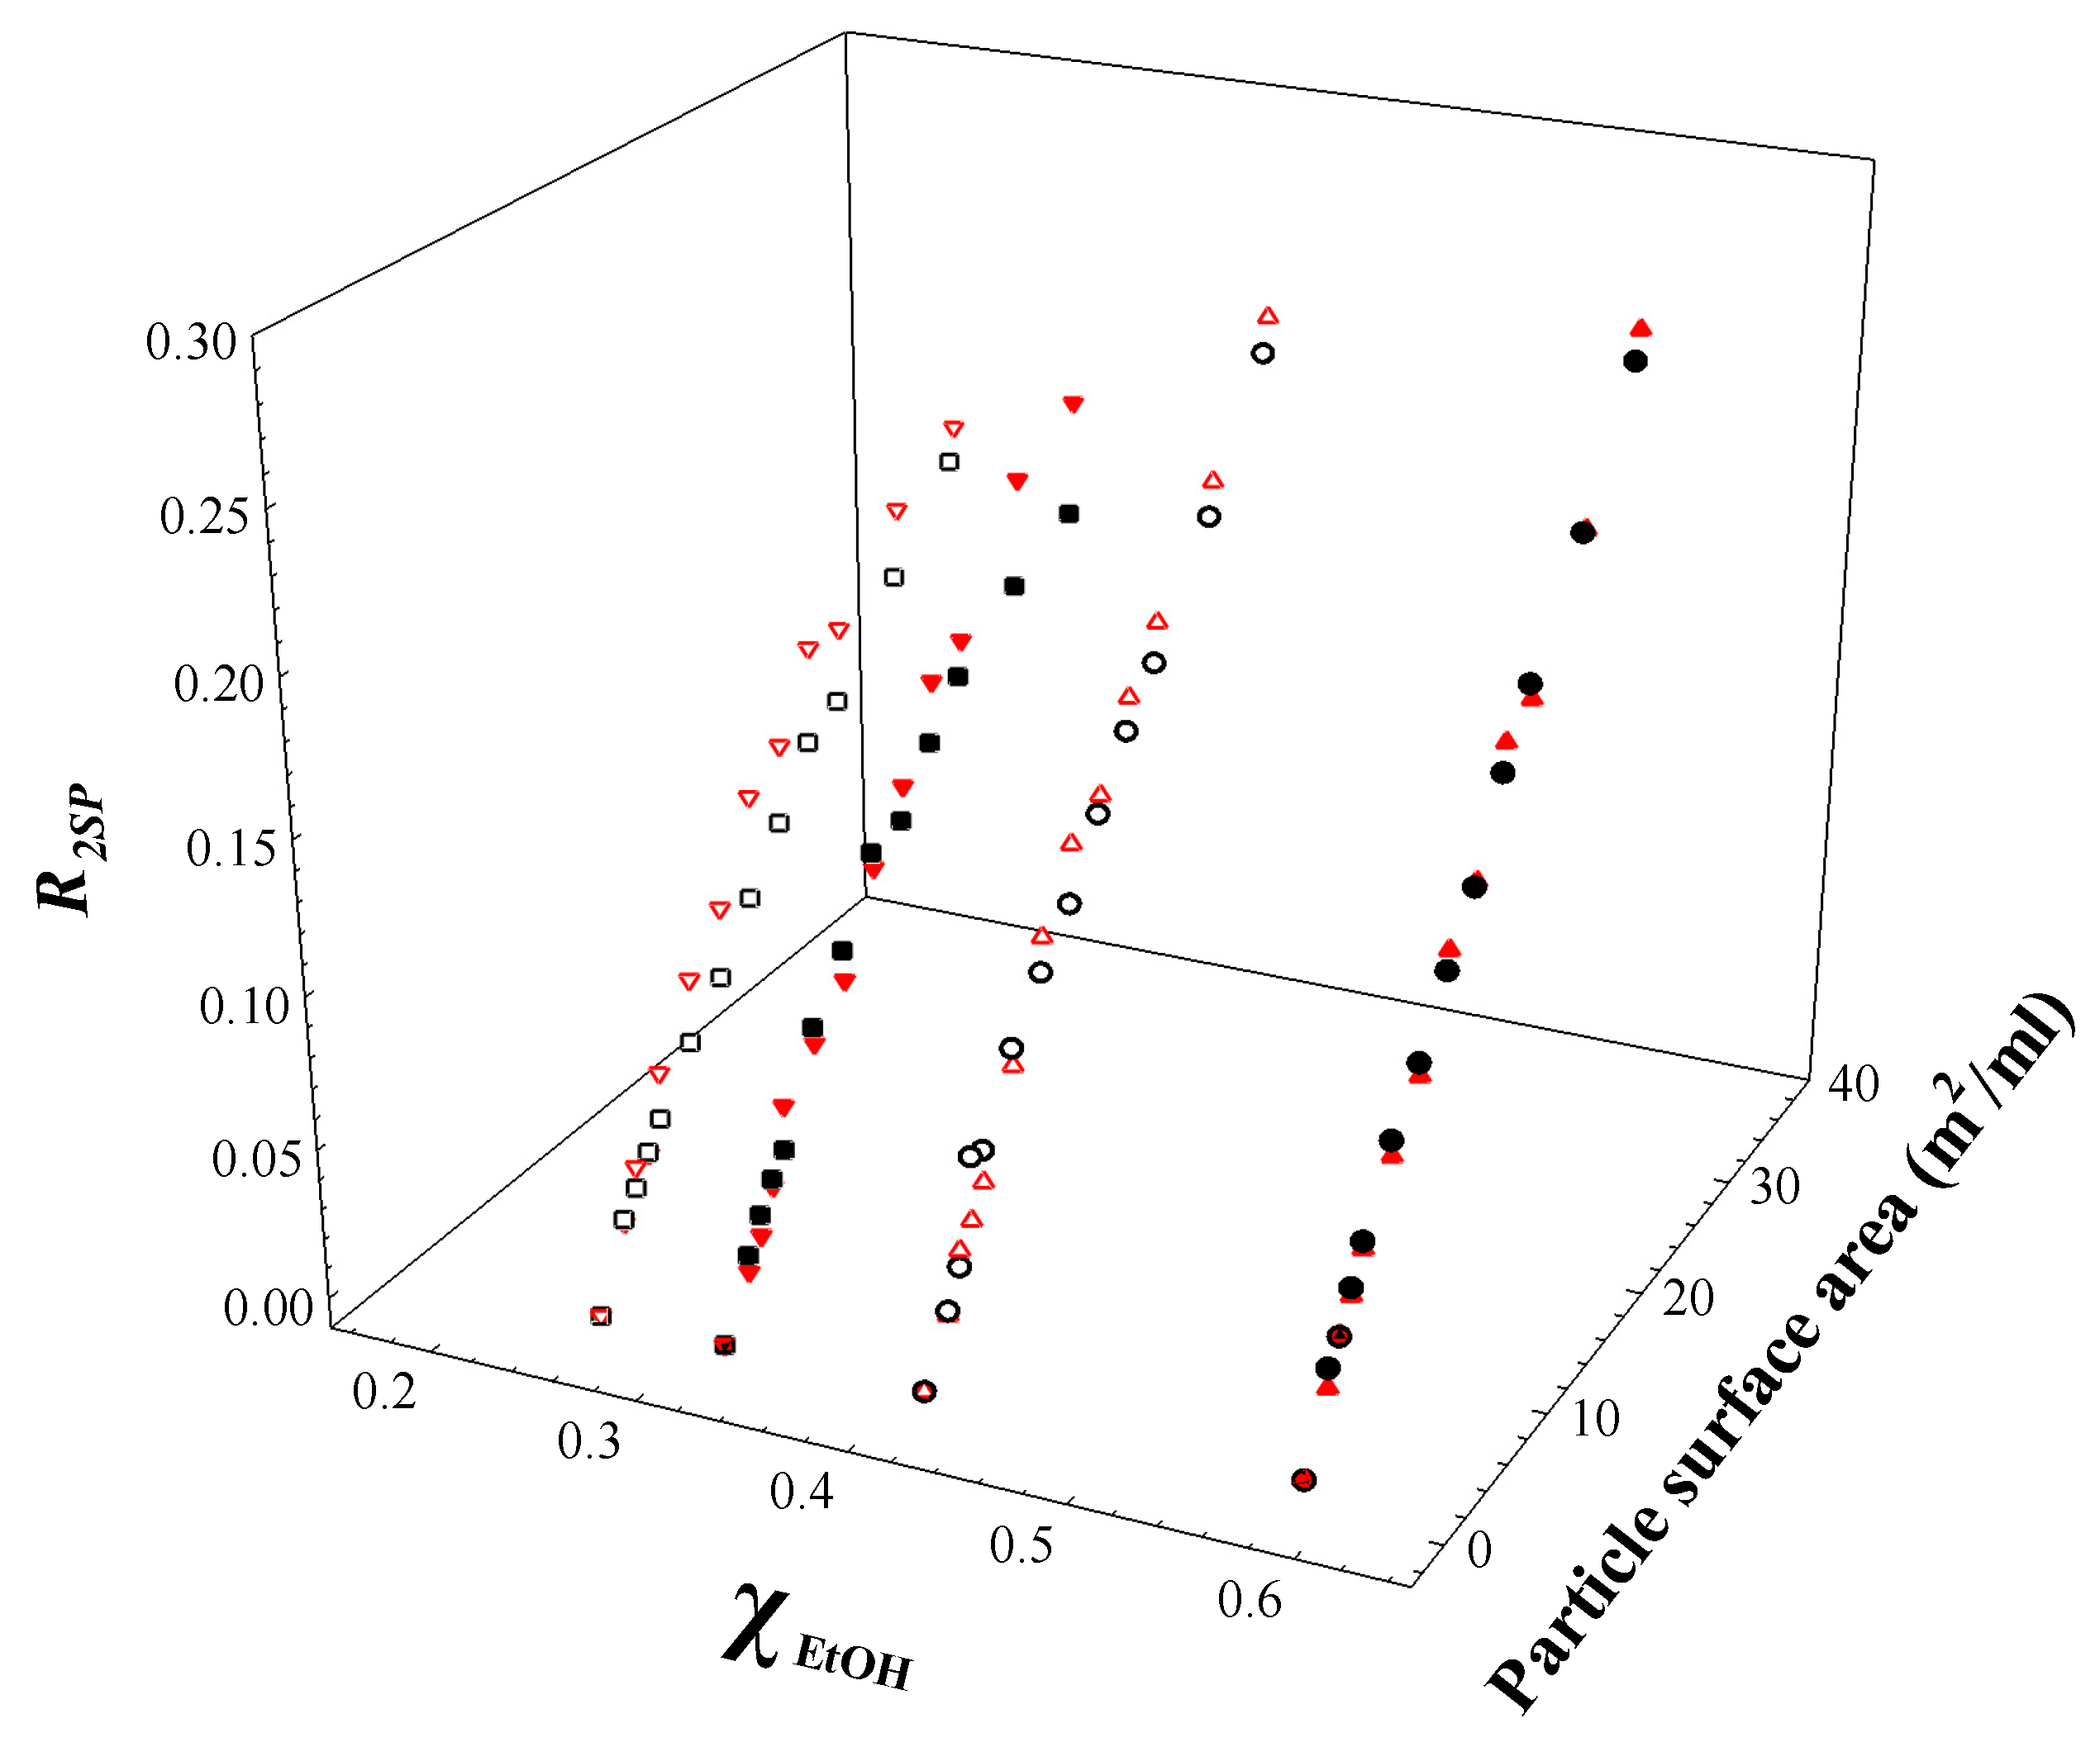
3.3. Characterisation of Non-Aqueous/Alcohol-Mixed Solvents

Extending the previous study, a series of binary solvent blends were then explored in which ethanol was mixed with solvents with quite different characters—decane, toluene, and p-xylene. Again, all the magnetisation decay curves follow a single-exponential form, Figure S3. R 2 for the series of ethanol blends with decane, toluene, and p-xylene were determined as a function of ethanol mole fraction and are presented in Figure S4. Ostensibly, the data differ markedly from the aqueous–alcohol solvent systems, now demonstrating a seemingly featureless dependence of the average relaxation rate on the alcohol mole fraction. Once correcting the data in terms of the excess relaxation rate, weak retardation is observed in the toluene and p-xylene cases, whereas the decane case shows a negligible change in the composition of the constituents. Ultimately, these binary blend studies indicate an empirical correlation between the average relaxation rate and solvent polarity; the more polar the solvent, the shorter the relaxation rate ( R 2 t o l u e n e < R 2 p x y l e n e < R 2 E t O H < R 2 d e c a n e ).

3.4. Characterisation of Aqueous Binary Mixtures—Particle Dispersions in the Aqueous System

Consider now what happens when the silica is added to these solvent blends. The R 2 S P   for two different colloidal particles, Ludox-SM30 and IPA-ST, are evaluated as a function of the weight percentage of the particles dispersed in IPA/water in Figure 5 and Figure 6. A series of IPA mole fractions in the IPA/water binary mixture were studied. In both silica particles, over the particle concentration range studied, a linear relationship can be seen for R 2 S P   as a function of the particle surface area, which indicates the existence of a rapid exchange between restricted and non-restricted environments, as well as the global averaging for the relaxation between the various functional groups within the solvent molecules themselves. Interestingly, the relaxation enhancements—the slope of the plots of relaxation rate versus particle concentration—decrease with an increase in the IPA mole fraction. This indicates the sensitivity of the technique to the polarity of the solvent. The observations are consistent with the data obtained from aqueous systems.

3.5. Characterisation of Non-Aqueous Binary Mixtures—Particle Dispersions in Non-Aqueous System

Representative relaxation decay curves for the solvents in a series of silica dispersions are presented in Figure S5. As in the no-silica case, all the decays were single-exponential, confirming the same global averaging of the relaxation process. The R 2 values for each nanoparticulate system are presented as a function of the particle surface area, Figures S6–S8, from which it is clear that the R 2 is linearly dependent on the particle surface area in each system— R 2 increases linearly with increasing surface area, indicating a rapid exchange between the surface and the bulk.
The relaxation rates were normalised to the equivalent solvent blend in the absence of the silica. The relationship between the R 2 S P and particle surface area is presented as a function of EtOH mole fractions for COS and HDK silicas in EtOH/toluene, Figure 7, for COS and HDK silica in EtOH/decane, and for Aerosil in EtOH/p-xylene in Figures S9 and S10, respectively. As expected, it is evident that an increase in particle surface area leads to an increase in the average relaxation rate, but the magnitude of the effect is weaker. There is a weak signature of nonlinearity in those systems that gel (e.g., EtOH), reflecting the loss of surface area associated with the formation of inter-particle linkage between the particles (that concomitantly leads to an enhancement in viscosity).
These observations are entirely commensurate with the conclusions drawn from the aqueous system. Bringing all these studies together, Figure 8 illustrates (on a double-logarithmic representation) the linear relationship between the R 2 S P and particle surface area for a wide range of nanoparticulate systems in aqueous and non-aqueous dispersions. The variation in R 2 S P in the non-aqueous solvents yields much smaller enhancements in the average relaxation rates than in the aqueous systems. Thus, it is concluded that solvent relaxation NMR is a viable experimental methodology with which to study particulate dispersions in non-aqueous media; however, the minor changes observed inherently limit the wider applicability of the methodology, which is an important contrast with the aqueous system.

4. Conclusions

Solvent relaxation NMR has been utilised to characterise nanoparticle dispersions in a range of binary mixtures of aqueous and non-aqueous solutions. For a range of binary aqueous–alcohol solvent blends, there are inflection points in the relaxation rates at characteristic alcohol mole fractions due to the arrangement of hydrogen bonds in the system. In non-aqueous binary solvent blends, the average relaxation rates of toluene and p-xylene increase with the EtOH mole fraction. Surprisingly, decane shows a decrease in the relaxation rate with a composition that reflects the solvent polarity. In the case of nanoparticulate dispersions, there is a linear relationship between the specific relaxation rate and the available particle surface area, except where there are macroscopic changes in formulation characteristics, i.e., gelation. Importantly, for the first time, these results demonstrate that solvent relaxation NMR is a viable technique to characterise non-aqueous dispersions; however, the technique is approaching the limit of experimental resolution.

Supplementary Materials

The following supporting information can be downloaded at: https://www.mdpi.com/article/10.3390/physchem2030016/s1, Figure S1: Relaxation decay curves of the solvent blends: EtOH/water, IPA/water, and MeOH/water. The mole fractions of EtOH in EtOH/water mixture were ~ 0.08 (red circles) and ~ 0.46 (open circles). The mole fractions of IPA in IPA/water mixture were ~ 0.09 (green triangles up) and ~ 0.47 (open triangles up). The mole fractions of MeOH in MeOH/water mixture were ~ 0.15 (blue squares) and ~ 0.63 (open squares), respectively. The solid lines through the experimental data are the single-exponential fits.; Figure S2: Excess solvent relaxation rate in blends of MeOH/water (squares), EtOH/water (circles) and IPA/water (triangles) as a function of alcohol mole fraction. The error bars are the standard deviation of three measurements for each sample.; Figure S3: Relaxation decay curves of the solvent blends: EtOH/decane (circles), EtOH/toluene (squares), and EtOH/p-xylene (triangles up). The mole fractions of EtOH were equal to ~ 0.5, ~ 0.4, and ~ 0.43 for EtOH/decane, EtOH/toluene, and EtOH/p-xylene mixtures, respectively. The solid lines through the experimental data are the single-exponential fits.; Figure S4: Relaxation rates of the solvent blends: EtOH/decane (circles), EtOH/toluene (squares), and EtOH/p-xylene (triangles) as a function of EtOH mole fraction. The error bars are the standard deviation of three measurements for each sample. The solid lines are guides to the eye; Figure S5: Relaxation decay curves of the solvent blends: EtOH/decane, EtOH/toluene, and EtOH/p-xylene. The mole fractions of EtOH in the EtOH/decane mixtures were ~ 0.68, ~ 0.52, ~ 0.42, and ~ 0.35, for EtOH/toluene mixtures were ~ 0.58, ~ 0.41, ~ 0.32, and ~ 0.26, and for EtOH/p-xylene mixtures were ~ 0.62, ~ 0.45, ~ 0.35, and ~ 0.29, respectively. The solid lines through the experimental data are the single-exponential fit.; Figure S6: Relaxation rates of COS and HDK silica in EtOH/decane as a function of particle surface area ( m 2 / mL ) . The mole fractions of EtOH in EtOH/decane mixtures were equal to   ~ 0.35 (COS (open squares) and HDK (open triangles down)), ~ 0.42 (COS (squares) and HDK (triangles down)), ~ 0.52 (COS (open circles) and HDK (open triangles up)), and ~ 0.68 (COS (circles) and HDK (triangles up)). The error bars are the standard deviation of three measurements for each sample. The solid lines are guides for the eye.; Figure S7: Relaxation rates of COS and HDK silica in EtOH/toluene as a function of particle surface area ( m 2 / mL ) . The mole fractions of EtOH in EtOH/toluene mixtures were equal to ~ 0.26 (COS (open squares) and HDK (open triangles down)), ~ 0.32 (COS (squares) and HDK (triangles down)), ~ 0.41 (COS (open circles) and HDK (open triangles up)), and ~ 0.58 (COS (circles) and HDK (triangles up)). The error bars are the standard deviation of three measurements for each sample. The solid lines are guides for the eye.; Figure S8: Relaxation rates of Aerosil in EtOH/p-xylene as a function of its surface area ( m 2 / mL ) . The mole fractions of EtOH in EtOH/p-xylene mixtures were equal to ~ 0.29 (open hexes), ~ 0.35 (hexagons), ~ 0.45 (open diamonds), and ~ 0.62 (diamonds). The error bars are the standard deviation of three measurements for each sample. The solid lines are guides for the eye.; Figure S9: Solvent specific relaxation rates of COS and HDK silica dispersions as a function of particle surface area ( m 2 / mL ) . The mole fractions of EtOH in EtOH/decane mixtures were equal to   ~ 0.35 (COS (open squares) and HDK (open triangles down)), ~ 0.42 (COS (squares) and HDK (triangles down)), ~ 0.52 (COS (open circles) and HDK (open triangles up)), and ~ 0.68 (COS (circles) and HDK (triangles up)). The R 2 S P data for both COS and HDK silica are normalised to the relaxation rate of the equivalent EtOH/decane mixture. The error bars are the standard deviation of three measurements for each sample. The solid lines are guides for the eye.; Figure S10: Solvent specific relaxation rate of Aerosil dispersions as a function of particle surface area ( m 2 / mL ) . The mole fractions of EtOH in EtOH/p-xylene mixtures were equal to ~ 0.29 (open hexagons), ~ 0.35 (hexagons), ~ 0.45 (open diamonds), and ~ 0.62 (diamonds). The R 2 S P data for Aerosil are normalised to the relaxation rate of the equivalent EtOH/p-xylene mixture. The error bars are the standard deviation of three measurements for each sample. The solid lines are guides for the eye.

Author Contributions

Formal analysis, Z.A.; funding acquisition, P.C.G., B.C. and P.J.D.; investigation, Z.A.; methodology, Z.A. and P.C.G.; project administration, P.C.G., B.C. and P.J.D.; supervision, P.C.G.; validation, Z.A.; writing—original draft, Z.A. and P.C.G.; writing—review & editing, Z.A and P.C.G. All authors have read and agreed to the published version of the manuscript.

Funding

This research was funded by a studentship grant jointly provided by Infineum and the University of Greenwich. The APC was funded through author voucher discount.

Institutional Review Board Statement

Not applicable.

Informed Consent Statement

Not applicable.

Acknowledgments

We would like to acknowledge the financial contribution of Infineum and for permission to reproduce the data of Wasiu Abdullahi [22] and Yoanh Moratille in Figure 2.

Conflicts of Interest

The authors declare no conflict of interest.

References

  1. Daniel, F. Natl. Paint, Varn. Lacq. Assoc. Sci. Sect. Circ. 1950, 774, 53–62. [Google Scholar]
  2. Parfitt, G.D. The role of the surface in the dispersion of powders in liquids. Pure Appl. Chem. 1981, 53, 2233–2240. [Google Scholar] [CrossRef]
  3. Nelson, R.D. Dispersing Powders in Liquids; Elsevier: Amsterdam, The Netherlands, 2012. [Google Scholar]
  4. Cooper, C.L.; Cosgrove, T.; van Duijneveldt, J.S.; Murray, M.; Prescott, S.W. The use of solvent relaxation NMR to study colloidal suspensions. Soft Matter 2013, 9, 7211–7228. [Google Scholar] [CrossRef]
  5. Li, X.; Shantz, D.F. PFG NMR studies of lysine–silica solutions. J. Colloid Interface Sci. 2012, 383, 19–27. [Google Scholar] [CrossRef]
  6. Wolf, L.; Hoffmann, H.; Linders, J.; Mayer, C. PFG-NMR self-diffusion measurements in the single phase channels of a microemulsion system with an anionic–nonionic surfactant mixture. Soft Matter 2012, 8, 6731–6739. [Google Scholar] [CrossRef]
  7. Flood, C.; Cosgrove, T.; Espidel, Y.; Welfare, E.; Howell, I.; Revell, P. Fourier-Transform Carr−Purcell−Meiboom−Gill NMR experiments on polymers in colloidal dispersions: How many polymer molecules per particle? Langmuir 2008, 24, 7875–7880. [Google Scholar] [CrossRef] [PubMed]
  8. De Graaf, A.J.; Boere, K.W.M.; Kemmink, J.; Fokkink, R.G.; van Nostrum, C.F.; Rijkers, D.T.S.; van der Gucht, J.; Wienk, H.; Baldus, M.; Mastrobattista, E.; et al. Looped structure of flowerlike micelles revealed by 1H NMR relaxometry and light scattering. Langmuir 2011, 27, 9843–9848. [Google Scholar] [CrossRef] [PubMed]
  9. Brown, S.P. Applications of high-resolution 1H solid-state NMR. Solid State Nucl. Magn. Reson. 2012, 41, 1–27. [Google Scholar] [CrossRef]
  10. Hanna, J.V.; Smith, M.E. Recent technique developments and applications of solid state NMR in characterising inorganic materials. Solid State Nucl. Magn. Reson. 2010, 38, 1–18. [Google Scholar] [CrossRef] [Green Version]
  11. Van der Beek, G.P.; Stuart, M.A.C.; Cosgrove, T. Polymer adsorption and desorption studies via proton NMR relaxation of the solvent. Langmuir 1991, 7, 327–334. [Google Scholar] [CrossRef]
  12. Mears, S.J.; Cosgrove, T.; Thompson, L.; Howell, I. Solvent relaxation NMR measurements on polymer, particle, surfactant systems. Langmuir 1998, 14, 997–1001. [Google Scholar] [CrossRef]
  13. Nelson, A.; Jack, K.S.; Cosgrove, T.; Kozak, D. NMR solvent relaxation in studies of multicomponent polymer adsorption. Langmuir 2002, 18, 2750–2755. [Google Scholar] [CrossRef]
  14. Hossain, M.R.; Wray, D.; Paul, A.; Griffiths, P.C. Probing the surfaces of core-shell and hollow nanoparticles by solvent relaxation NMR. Magn. Reson. Chem. 2018, 56, 251–256. [Google Scholar] [CrossRef] [PubMed]
  15. Cosgrove, T.; Obey, T.M.; Taylor, M. Solvent relaxation NMR: Bound fraction determination for sodium poly(styrene sulphonate) at the solid/solution interface. Colloids Surf. 1992, 64, 311–316. [Google Scholar] [CrossRef]
  16. Cosgrove, T.; Griffiths, P.C.; Lloyd, P.M. Polymer adsorption. The effect of the relative sizes of polymer and particle. Langmuir 1995, 11, 1457–1463. [Google Scholar] [CrossRef]
  17. Cosgrove, T.; Turner, M.J.; Thomas, D.R. The adsorption of polydimethylsiloxane onto silica from the melt. Polymer 1997, 38, 3885–3892. [Google Scholar] [CrossRef]
  18. Cooper, C.L.; Cosgrove, T.; van Duijneveldt, J.S.; Murray, M.; Prescott, S.W. Colloidal particles in competition for stabilizer: A solvent relaxation NMR study of polymer adsorption and desorption. Langmuir 2012, 28, 16588–16595. [Google Scholar] [CrossRef]
  19. Carr, H.Y.; Purcell, E.M. Effects of diffusion on free precession in nuclear magnetic resonance experiments. Phys. Rev. 1954, 94, 630–638. [Google Scholar] [CrossRef]
  20. Meiboom, S.; Gill, D. Modified spin-echo method for measuring nuclear relaxation times. Rev. Sci. Instrum. 1958, 29, 688–691. [Google Scholar] [CrossRef] [Green Version]
  21. Woessner, D.E.; Zimmerman, J.R. Nuclear transfer and anisotropic motional spin phenomena: Relaxation time temperature dependence studies of water adsorbed on silica gel IV. J. Phys. Chem. 1963, 67, 1590–1600. [Google Scholar] [CrossRef]
  22. Abdullahi, W.O. Cationc-Polymer-Induced Aggregation of Single and Binary Anionic Particulate Dispersions; University of Greenwich: London, UK, 2021. [Google Scholar]
  23. Fairhurst, D.; Sharma, R.; Takeda, S.-I.; Cosgrove, T.; Prescott, S.W. Fast NMR relaxation, powder wettability and Hansen Solubility Parameter analyses applied to particle dispersibility. Powder Technol. 2021, 377, 545–552. [Google Scholar] [CrossRef]
  24. Hansen, C.M. Hansen Solubility Parameters: A User’s Handbook, 2nd ed.; CRC Press: Boca Raton, FL, USA, 2007. [Google Scholar]
  25. Yoshida, K.; Kitajo, A.; Yamaguchi, T. 17O NMR relaxation study of dynamics of water molecules in aqueous mixtures of methanol, ethanol, and 1-propanol over a temperature range of 283–403 K. J. Mol. Liq. 2006, 125, 158–163. [Google Scholar] [CrossRef]
Figure 1. Variation of R 2 SP for various nanoparticulate systems in aqueous media: cationic polystyrene latex (triangles down) [15], Ludox SM40 (stars) and TM40 (hexagons) [16], Snowtex 50 silica (triangles up) [12], colloidal silica (Bindzil 40/220) (open circles), and alumina-modified silica (Bindzil 309/220) (squares) [18] in water as a function of particle surface area ( m 2 / mL ). The solid lines are guides for the eye.
Physchem 02 00016 g001
Figure 2. Solvent-specific relaxation rate enhancement for all the particles dispersed in aqueous and non-aqueous solvents. For non-aqueous dispersions, the EtOH mole fraction for EtOH/decane, EtOH/toluene, and EtOH/p-xylene was ~ 0.68, ~ 0.58, and ~ 0.62. The IPA-ST was dispersed in pure IPA. For aqueous dispersions, the solvent was pure water. The data were extracted from * [22], and ** [12,15,16,18].
Physchem 02 00016 g002
Figure 3. Solvent-specific relaxation rate of IPA-ST (circles) and Ludox SM30 (squares) as a function of particle surface area ( m 2 / mL ). The R 2 S P data for IPA-ST and Ludox SM30 are normalised to the relaxation rates of pure IPA and water, respectively. The error bars are the standard deviations of three measurements of each sample. The solid lines are linear regressions with r2 = 0.997 (squares) and 0.986 (circles).
Physchem 02 00016 g003
Figure 4. Solvent-specific relaxation rate of Aerosil in p-xylene (triangles) and COS (circles) and HDK silica (squares) in toluene as a function of surface area ( m 2 / mL ). The R 2 S P data for Aerosil, COS, and HDK were normalised to the relaxation rates of pure p-xylene and toluene, respectively. The error bars are the standard deviations of three measurements of each sample. The solid lines are linear regressions with r2 = 0.983 (squares), 0.936 (triangles up), and 0.958 (circles).
Physchem 02 00016 g004
Figure 5. Solvent-specific relaxation rate of Ludox-SM30 dispersed in IPA/water as a function of Ludox-SM30 surface area ( m 2 / mL ). The mole fractions of IPA were equal to ~ 0.0 (diamonds), ~ 0.09 (circles), ~ 0.11 (squares), ~ 0.13 (triangles up), and ~ 0.23 (triangles down). The R 2 S P data were normalised to the relaxation rate of the equivalent IPA/water binary mixture.
Physchem 02 00016 g005
Figure 6. Solvent specific relaxation rate of IPA-ST dispersed in IPA/water as a function of IPA-ST surface area ( m 2 / mL ). The mole fractions of IPA were equal to ~ 0.09 (circles), ~ 0.23 (squares), ~ 0.47 (triangles up), and ~ 1 (triangles down). The R 2 S P data were normalised to the relaxation rate of the equivalent IPA/water binary mixture.
Physchem 02 00016 g006
Figure 7. Solvent-specific relaxation rates of COS and HDK silica dispersions as a function of particle surface area ( m 2 / mL ) . The mole fractions of EtOH in EtOH/toluene mixtures were equal to ~ 0.26 (COS (open squares) and HDK (open triangles down)), ~ 0.32 (COS (squares) and HDK (triangles down)), ~ 0.41 (COS (open circles) and HDK (open triangles up)), and ~ 0.58 (COS (circles) and HDK (triangles up)). The R 2 S P data for both COS and HDK silica are normalised to the relaxation rate of the equivalent EtOH/toluene mixture. The error bars are the standard deviations of three measurements for each sample.
Physchem 02 00016 g007
Figure 8. Log–log plot of R 2 S P  versus particle surface area ( m 2 / mL ) for aqueous and non-aqueous nanoparticulate systems; cationic polystyrene latex [15], Ludox SM40 and TM40 [16], Snowtex 50 silica [12], colloidal silica (Bindzil 40/220) and alumina-modified silica (Bindzil 309/220) [18] in water (cross symbols), COS and HDK silica in toluene, Aerosil in p-xylene, HDK silica and COS in EtOH/decane, EtOH/toluene, and Aerosil EtOH/p-xylene at different mole % of EtOH.
Physchem 02 00016 g008
Table 1. List of silica substrates used in these experiments. The particle sizes for Ludox SM30 and IPA-ST are provided by the manufacturers.
MaterialStateSupplier
Aerosil R104
(particle size 10–30 nm, surface area 140 m2·g−1)
PowderEvonik Degussa,
Essen, Germany
HDK H18 pyrogenic silica
(particle size 15–50 nm, surface area 124 m2·g−1)
PowderWacker Chemie AG, Munich, Germany
Cab-O-Sil TS-720
(particle size 15–45 nm, surface area 122 m2·g−1)
PowderInoxia Ltd., Cranleigh, UK
Ludox SM30
(particle size 8 nm)
30 wt% suspension in waterSigma Aldrich, Dorset, UK
IPA-ST
(particle size 10–15 nm)
38 wt% dispersed in isopropanol (IPA)Nissan Chemical Corporation, Tokyo, Japan
Publisher’s Note: MDPI stays neutral with regard to jurisdictional claims in published maps and institutional affiliations.

