Article

Geopolymers for Space Applications

by
D. Mendoza-Cachú
1,
J. B. Rojas-Trigos
2,
J. Hernández-Wong
3,
T. J. Madera-Santana
4 and
E. A. Franco-Urquiza
1,*
1
Advanced Manufacturing Department, Center for Engineering and Industrial Development, CIDESI-Airport, Carretera Estatal 200, km 23, Queretaro 76270, Mexico
2
Instituto Politécnico Nacional, Centro de Investigación en Ciencia Aplicada y Tecnología Avanzada, Unidad Legaria, Legaria 694, Col. Irrigación, Alcaldía Miguel Hidalgo, Mexico City 11500, Mexico
3
Consejo Nacional de Ciencia y Tecnología, Programa de Investigadoras e Investigadores por México–Instituto Politécnico Nacional, Centro de Investigación en Ciencia Aplicada y Tecnología Avanzada, Unidad Legaria, Legaria 694, Col. Irrigación, Alcaldía Miguel Hidalgo, Mexico City 11500, Mexico
4
Centro de Investigación en Alimentación y Desarrollo, A.C. (CIAD), Hermosillo 83304, Mexico
*
Author to whom correspondence should be addressed.
Physchem 2024, 4(3), 197-213; https://doi.org/10.3390/physchem4030015
Submission received: 30 April 2024 / Revised: 25 June 2024 / Accepted: 25 June 2024 / Published: 5 July 2024
(This article belongs to the Section Solid-State Chemistry and Physics)

Abstract

:
Geopolymers are cementitious materials with exceptional mechanical and physical properties, making them suitable for aerospace applications. Considering their excellent performance, the present investigation aims to develop geopolymers with designed physical properties to address some issues in the aerospace industry. In this sense, the influence of the alkaline activator on the final properties was evaluated. For the development of the geopolymers, sodium hydroxide and sodium metasilicate solutions were preparedto obtain the alkaline activator. The synthesis process also consisted of a mixing stage using a mixer to obtain a homogenous paste. After mixing, the curing process consisted of a first thermal treatment at 60 °C for 4 h to evaporate the excess water, avoid excessive contraction, and promote strength at early ages. Subsequently, the geopolymers were left at rest for 28 days until the final properties were achieved. The influence of the solid-to-liquidratio (S/L) on the microstructure of the geopolymers was evaluated. For this purpose, X-ray fluorescence spectrometry, X-ray diffraction, and infrared spectrometry analyses were performed. The results show that the content of the alkaline activator promotes variations inthe presence of different crystalline phases, which is more noticeable as the S/L ratio increases. Likewise, the infrared spectra display peaks at different wavelengths regarding the variations in elemental composition, which are more evident with the changes in the S/L ratio. In addition, physical studies, such as thermal conductivity and resistance to gamma radiation were conducted for different geopolymer compositions. The results indicate that changes in properties are not too sensitive to compositional variations, although slight modifications exist. Finally, these studies are significant as aerospace-focused materials are directly exposed to this kind of phenomena. The designed geopolymers have to be able to resist and maintain their properties through exposure to any energy.

1. Introduction

The concept of geopolymer was first used in the 1970s by the French scientist and engineer Joseph Davidovits [1]. Geopolymers are ceramic-like materials obtained from the mixture of a precursor mineral and a chemical agent that acts as an alkaline activator, which promotes reactions that lead to the formation of a material with cementitious characteristics. The main characteristics of geopolymers are high mechanical performance, resistance to chemical corrosion and abrasion, low electrical conductivity, high thermal stability, low coefficient of thermal expansion, and reduced environmental impact by requiring low energy consumption during their synthesis. Furthermore, geopolymers are fire-retardant materials, giving them exceptional potential for high-tech applications [2] since they retain their integrity and mechanical properties at temperatures above 800 °C. Some research shows that the exposure of geopolymers to high temperatures (1200 °C) leads to structural densification and an increase in mechanical resistance of up to 30% [3,4,5].
Geopolymers can be synthesized from mineral resources such as clays, carbonized industrial waste, or volcanic rocks. Fly ash and calcined kaolin (metakaolin) are the most used precursors for synthesizing geopolymers [6,7]. Fly ash is a waste product from thermoelectric power plants, where coal is pulverized and burned to heat water, evaporate it, and drive a turbine for power generation. The structure of high Si and Al content clays, such as kaolinite, is also suitable for developing geopolymers [8]. Kaolinite is a stratified clay mineral with a lamellar structure composed of tetrahedra linked through oxygen atoms in alumina octahedra [9]. Kaolinite is highly reactive due to its glassy nature. The high silicon and aluminum oxide content promotes the formation of three-dimensional branched molecular structures when exposed to a highly alkaline environment.
The activators NaOH and KOH are highly alkaline solutions, with NaOH being the most used due to its commercial availability, and they have shown excellent results when synthesizing geopolymers with the desired microstructure and properties [10,11,12]. However, using K+ as an alkaline ion has some interest because the size of the cation could contribute to a more significant dissolution of the precursor, promoting an improvement in the rheological properties of the geopolymer. Furthermore, K+ can lead to a greater degree of condensation, compared to Na+, when supplied under the same conditions [13,14,15,16]. However, there is some controversy in the literature regarding which type of alkaline ion exhibits the best performance for obtaining materials with higher mechanical resistance, and results vary from one investigation to another even under similar conditions [17,18,19,20].
One strategy to increase the properties of geopolymers is to reinforce them with fibers. The references consulted report studies on using short carbon fibers to reinforce geopolymers used in civil engineering [21,22,23]. The results of these investigations agree that fibers significantly promote specific resistance and thermal stability compared to unreinforced geopolymers. Additionally, the short-oriented fibers hinder crack propagation and increase the material’s toughness, which has been attributed to the ability of the geopolymer composite to dissipate energy during deformation.
Recently, the strength of geopolymers reinforced with short fibers against UV radiation was evaluated [24], observing a much higher resistance compared to thermoset resins. A substantial number of scientific articles are related to the study of geopolymers [25,26,27,28,29,30,31]. However, most of them are focused on the analysis and understanding of the reaction mechanism that takes place during geopolymerization, including the reactivity of different aluminosilicate sources, the effect of the type of activation solution, and the effect that the synthesis conditions have on its properties.
Geopolymers have many valuable properties and are relatively inexpensive to manufactureconsidering that it is a low-energy-consuming process in comparison with other ceramic materials, so there is a need to expand the use and applications of geopolymers into high-tech industries such as aerospace. Sandwich structures have been used throughout the aerospace and shipbuilding industries. Using structures with this kind of arrangement promotes improvement in the final properties, such as high specific strength and stiffness. However, the main disadvantage is the flammability of organic polymers. James Giancaspro et al. [32] prepared two layers of a carbon-glass geopolymer fabric sandwiched with a balsa core. The results indicated that a 2 mm layer of geopolymer fiber coating is sufficient to meet Federal Aviation Administration fire requirements. Ó Brádaigh et al. [33] developed electrically heated ceramic composite tools for non-autoclave manufacturing of large composite structures for aerospace or wind energy use. The tools were designed to operate at temperatures up to 300 °C. The geopolymer was initially cured at 60 °C, followed by post-curing at approximately 400 °C. The tools obtained were light and resistant, with a low coefficient of thermal expansion. In the last decade, research has been actively carried out with geopolymers for construction on the Moon, allowing astronauts to remain on the Moon for long periods [34]. The research was oriented to use in situ resources (ISRU). The results indicated that geopolymers based on lunar regolith simulants have high application potential to protect astronauts from the harsh lunar environment [35]. However, not all simulants perfectly reproduce the lunar regolith, and the characteristics of the lunar regolith vary by site. Other researchers replicated lunar regolith to make geopolymer concrete samples (“Lunamer”) by activating the regolith with alkaline liquid [36]. Geopolymer binder technology exhibits superior mechanical and thermal performance and is compatible with an abundantly available lunar resource (lunar regolith). These investigations focus on developing lunar regolith-based geopolymer concrete and evaluating differential shielding in various geopolymer formulations to determine if sufficient radiation protection can be achieved in space environments. Protection from cosmic radiation represents a valuable opportunity for geopolymers to gradually become involved in aerospace, specifically in their application in nanosatellite structures or orbital deployers [37,38]. However, the use of geopolymers in such applications is currently limited, which makes it a potential field for research and development ofnew materials and technologies.
This work aims to develop geopolymers for space applications, such as the feasibility of placing them as panels on nanosatellites and as effective gamma radiation shields. Geopolymers were characterized using complex and robust techniques to determine their rheology, thermal conductivity capacity, electrical conductivity, and resistance to gamma rays. The results allow us to visualize new fields of application in the space sector, generate new knowledge, and innovate in the development of nanosatellites.

2. Materials and Methods

The geopolymers were synthesized using calcined kaolinite (MK), Glomax LL kaolin from IMERYS. According to the technical datasheet, MK contains 45% Al2O3, 52.4% SiO2, 1% Ti, and 0.5% Fe2O3. Other components such as CaO, MgO, Na2O, and K2O are present in MK in proportions between 0.1% and 0.2%. MK served as a precursor. The alkaline activator was prepared using sodium metasilicate nonahydrate with a 99.6% purity (Sigma-Aldrich) and sodium hydroxide (NaOH) solution.
The process for preparing the alkaline activatorconsisted of developing a solution of NaOH in distilled water until reaching a 10 M concentration. The solution was prepared under constant stirring and in an extraction hood, considering it is a highly exothermic reaction. The solution was allowed to stand for 24 h before being used. A solution of Na2SiO3 was prepared in a proportion of 40 g per 100 mL of distilled water. A new solution is obtained from the alkaline activator, maintaining a ratio of Na2SiO3/NaOH = 0.75. The use of distilled water is helpful to avoid the presence of unwanted mineral particles, usually carried in ordinary water. These mineral particles are able to chemically react with the NaOH, altering the final composition of the solution and depleting the efficiency of the alkaline activator. Also, residual contaminants could react with the Si in the metakaolin and form alkali-silica compounds, which affects the final properties of cementitious materials such as geopolymers.
Three different formulations were prepared by varying the solid-to-liquid (S/L) ratio: the amount of MK with respect to the alkaline activator. These variations resulted in geopolymers with S/L values of 0.65, 0.75, and 1.0, designated MKG-01, MKG-02, and MKG-03, respectively.

2.1. X-ray Fluorescence Spectrometry (XRF)

XRF is an elemental analysis that allows us to determine the composition of geopolymers to validate their composition based on the solid/liquid ratio (S/L). The chemical composition of the geopolymers was determined by the X-ray fluorescence technique using a SPECTRO model XEPOS III spectrometer equipped with an X-ray tube with a maximum power of 60 kV. The geopolymers were ground in a conventional laboratory (marble) mortar. The powder from each geopolymer sample was placed inside the equipment, and data analysis was performed using Turboquant-Powders software version 1.

2.2. X-ray Diffraction

Microstructural analysis of the geopolymers was carried out using X-ray diffraction (XRD) with a Rigaku D/max-2100 diffractometer (Cu Kα radiation, λ = 0.1540 nm). The analysis was run with a scanning angle 2θ from 5 to 70° by continuous scanning at a speed of 0.01° every two seconds. The different mineralogical phases were identified by comparison with spectra from the MDI software database version 2.1603.

2.3. Infrared Spectroscopy

The structural verification of the geopolymers was performed using Fourier transform infrared spectroscopy with attenuated total reflectance (FTIR-ATR) with a Perkin Elmer Frontier. The geopolymer samples were placed on a slide, and 32 scans were performed under transmittance mode in the 4000 to 400 cm−1 frequency range with a resolution of 4 cm−1.

2.4. Thermal Analysis

The thermal analysis of the geopolymers was evaluated by thermogravimetric analysis (TGA) and differential scanning calorimetry (DSC), performing simultaneous TGA/DSC measurements on a Setaram TGA/DSC thermal analyzer model Setsys Evolution. The heat of the reaction of liquid geopolymers was revealed using DSC isothermal tests, which consisted of placing samples of 170–181 mg immediately after mixing in platinum crucibles. The sample was subjected to an isotherm of 60 °C for 90 min under an inert argon atmosphere with a 30 mL/min flow rate.

2.5. Flammability and Toxicity of Smoke

Geopolymers are known to be flame-retardant materials. However, flammability tests allow visualization of other characteristic features, such as color change. In this way, the flammability tests on the geopolymers were carried out following the specifications of the UL94 standard [39], using test pieces with dimensions of 125 × 13 × 3 mm3. Before the test, the specimens were conditioned at room temperature (~21 °C) and 50% relative humidity for 24 h in a Memert CTC256 climate chamber.
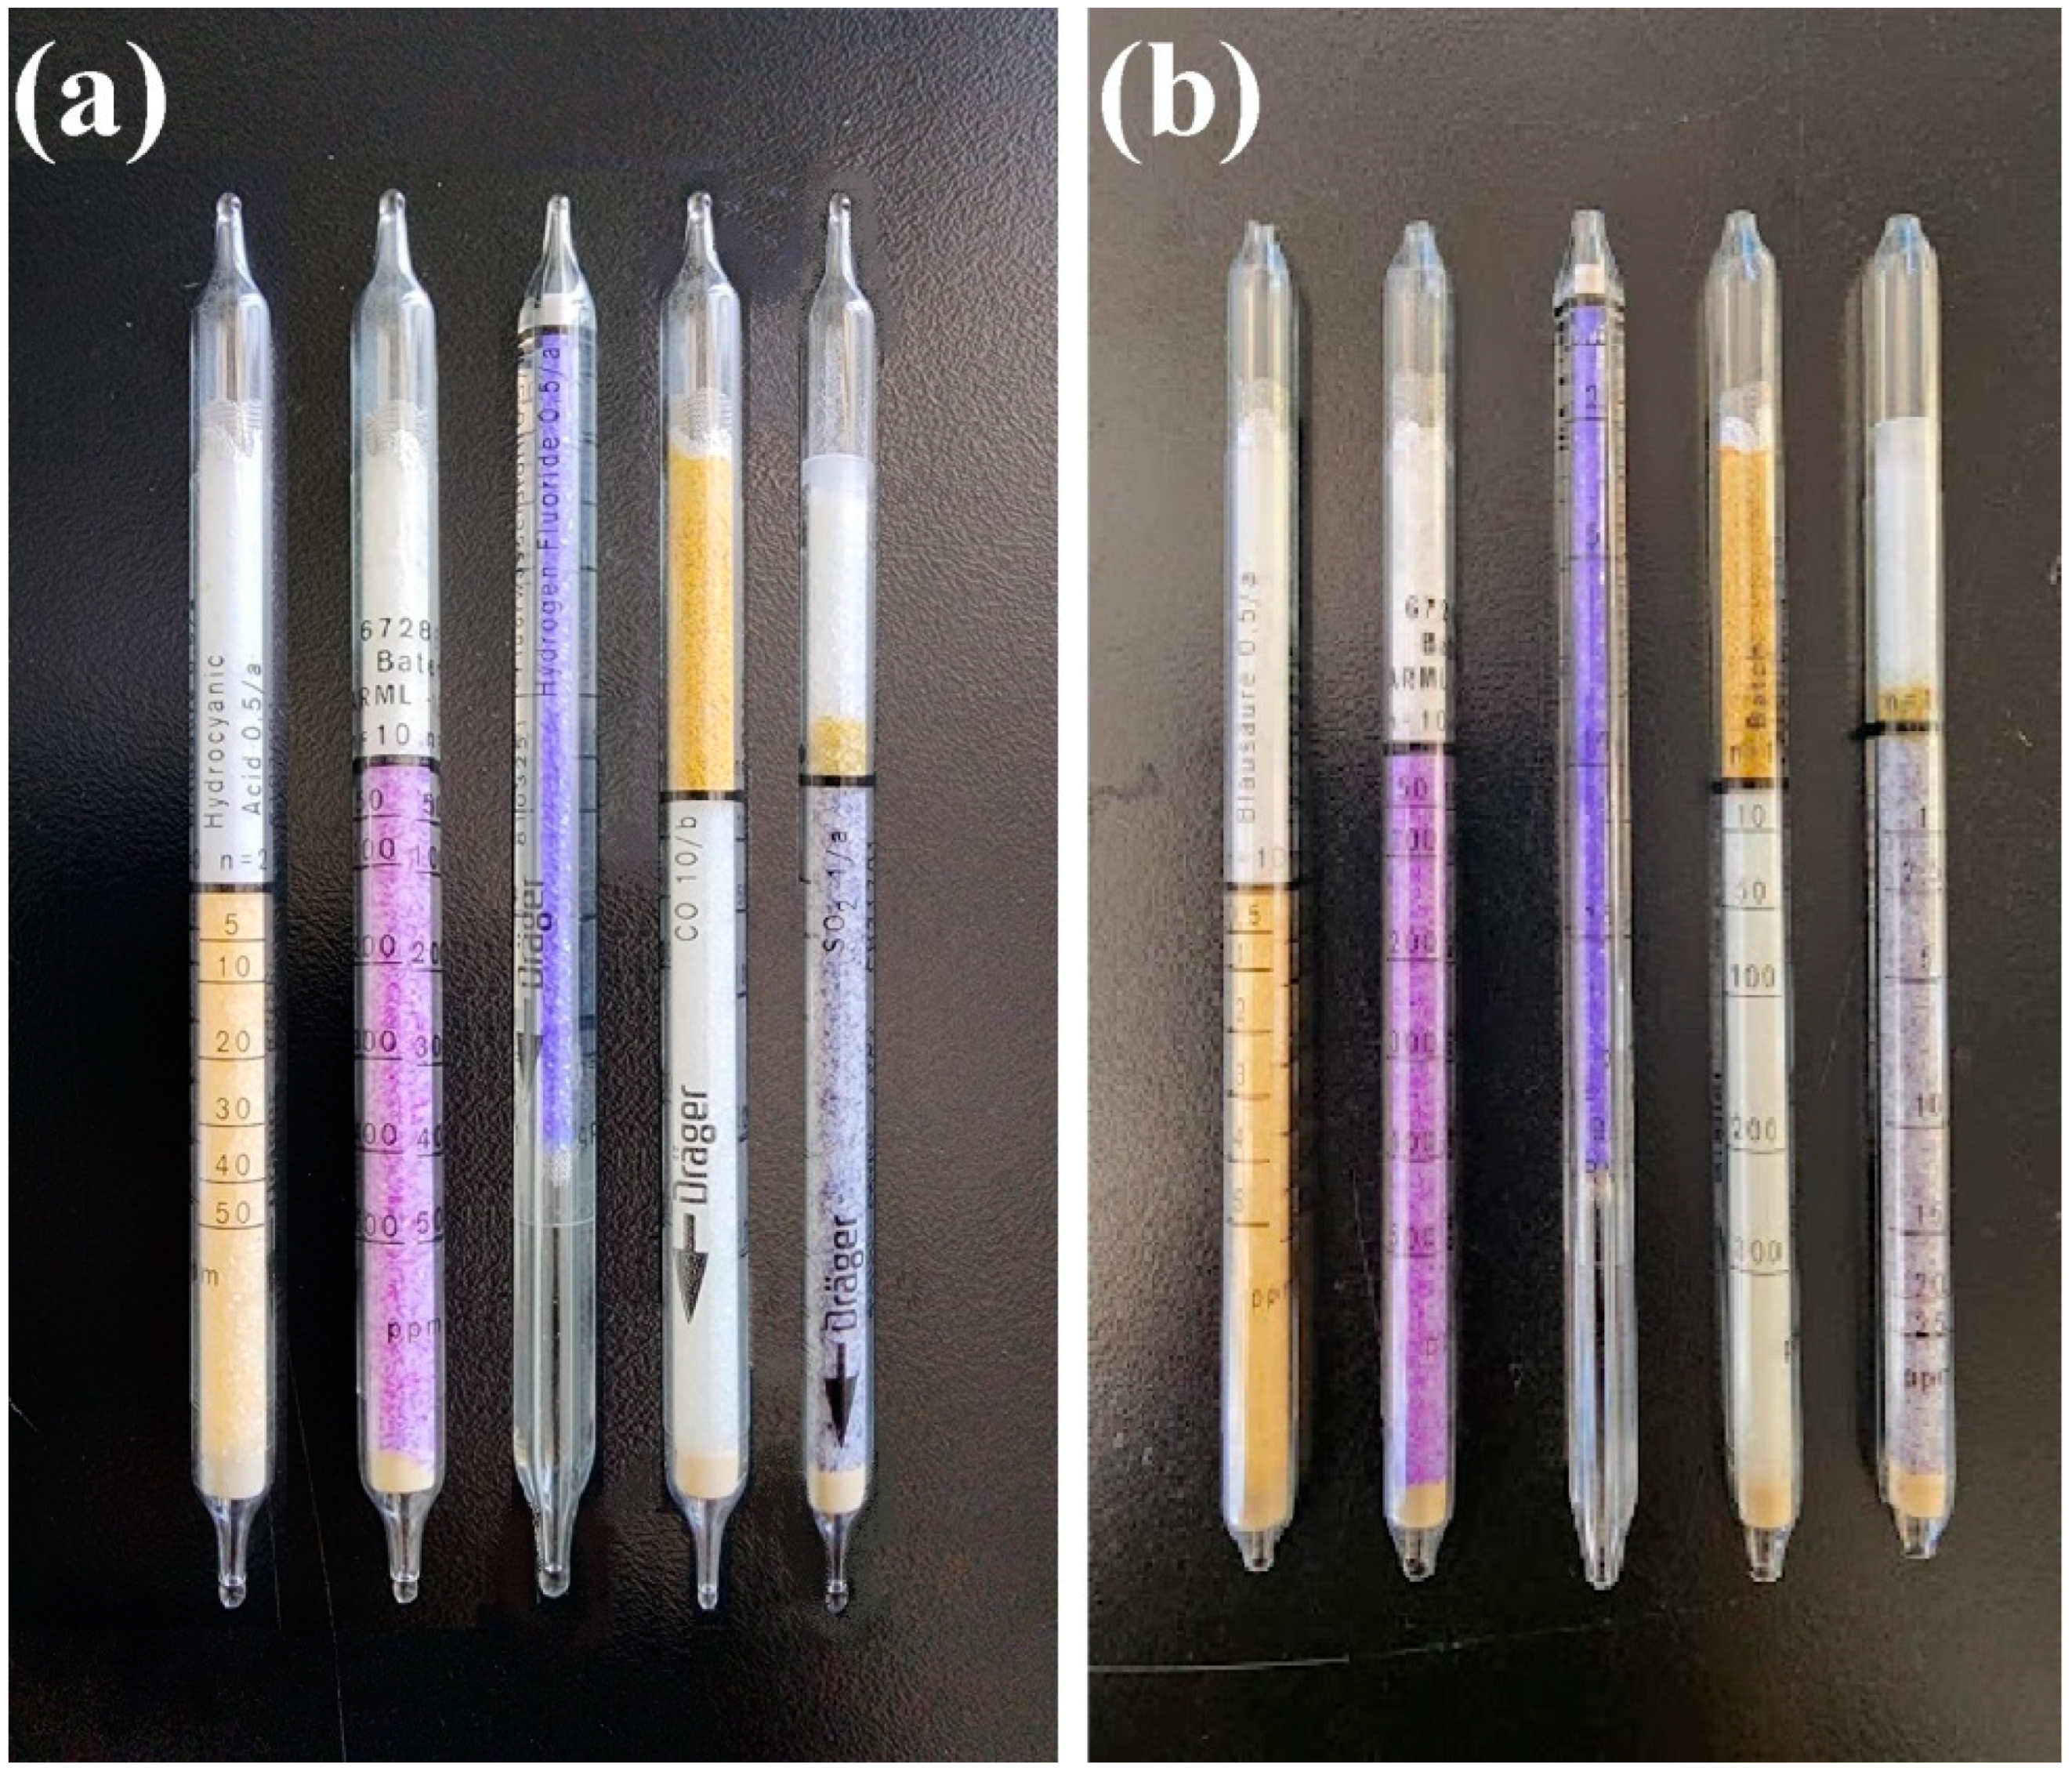
The smoke density and toxicity tests were carried out according to the Aircraft Material Fire Test Handbook Chapter 6 [40], preferring this standard over the others available because it focuses on aerospace materials. For the smoke density test, square samples with a side of 75 mm were analyzed, previously conditioned for 48 h at 23 °C and 50% RH in a Memert CTC256 chamber. The tests were performed in a Deatak model SD-3 smoke density chamber under the cone radiator configuration [41]. The test was run under 25 kW/m2 thermal radiation and without flame for 5 min. Dräger brand colorimetric tubes were connected to the SD-3 smoke density chamber and the smoke extract pump. Dräger tubes allow the detection and ppm estimation of the most common toxic components found in combustion gases, such as HCN, HCl, HF, CO, and SO2.

2.6. Thermal Conductivity

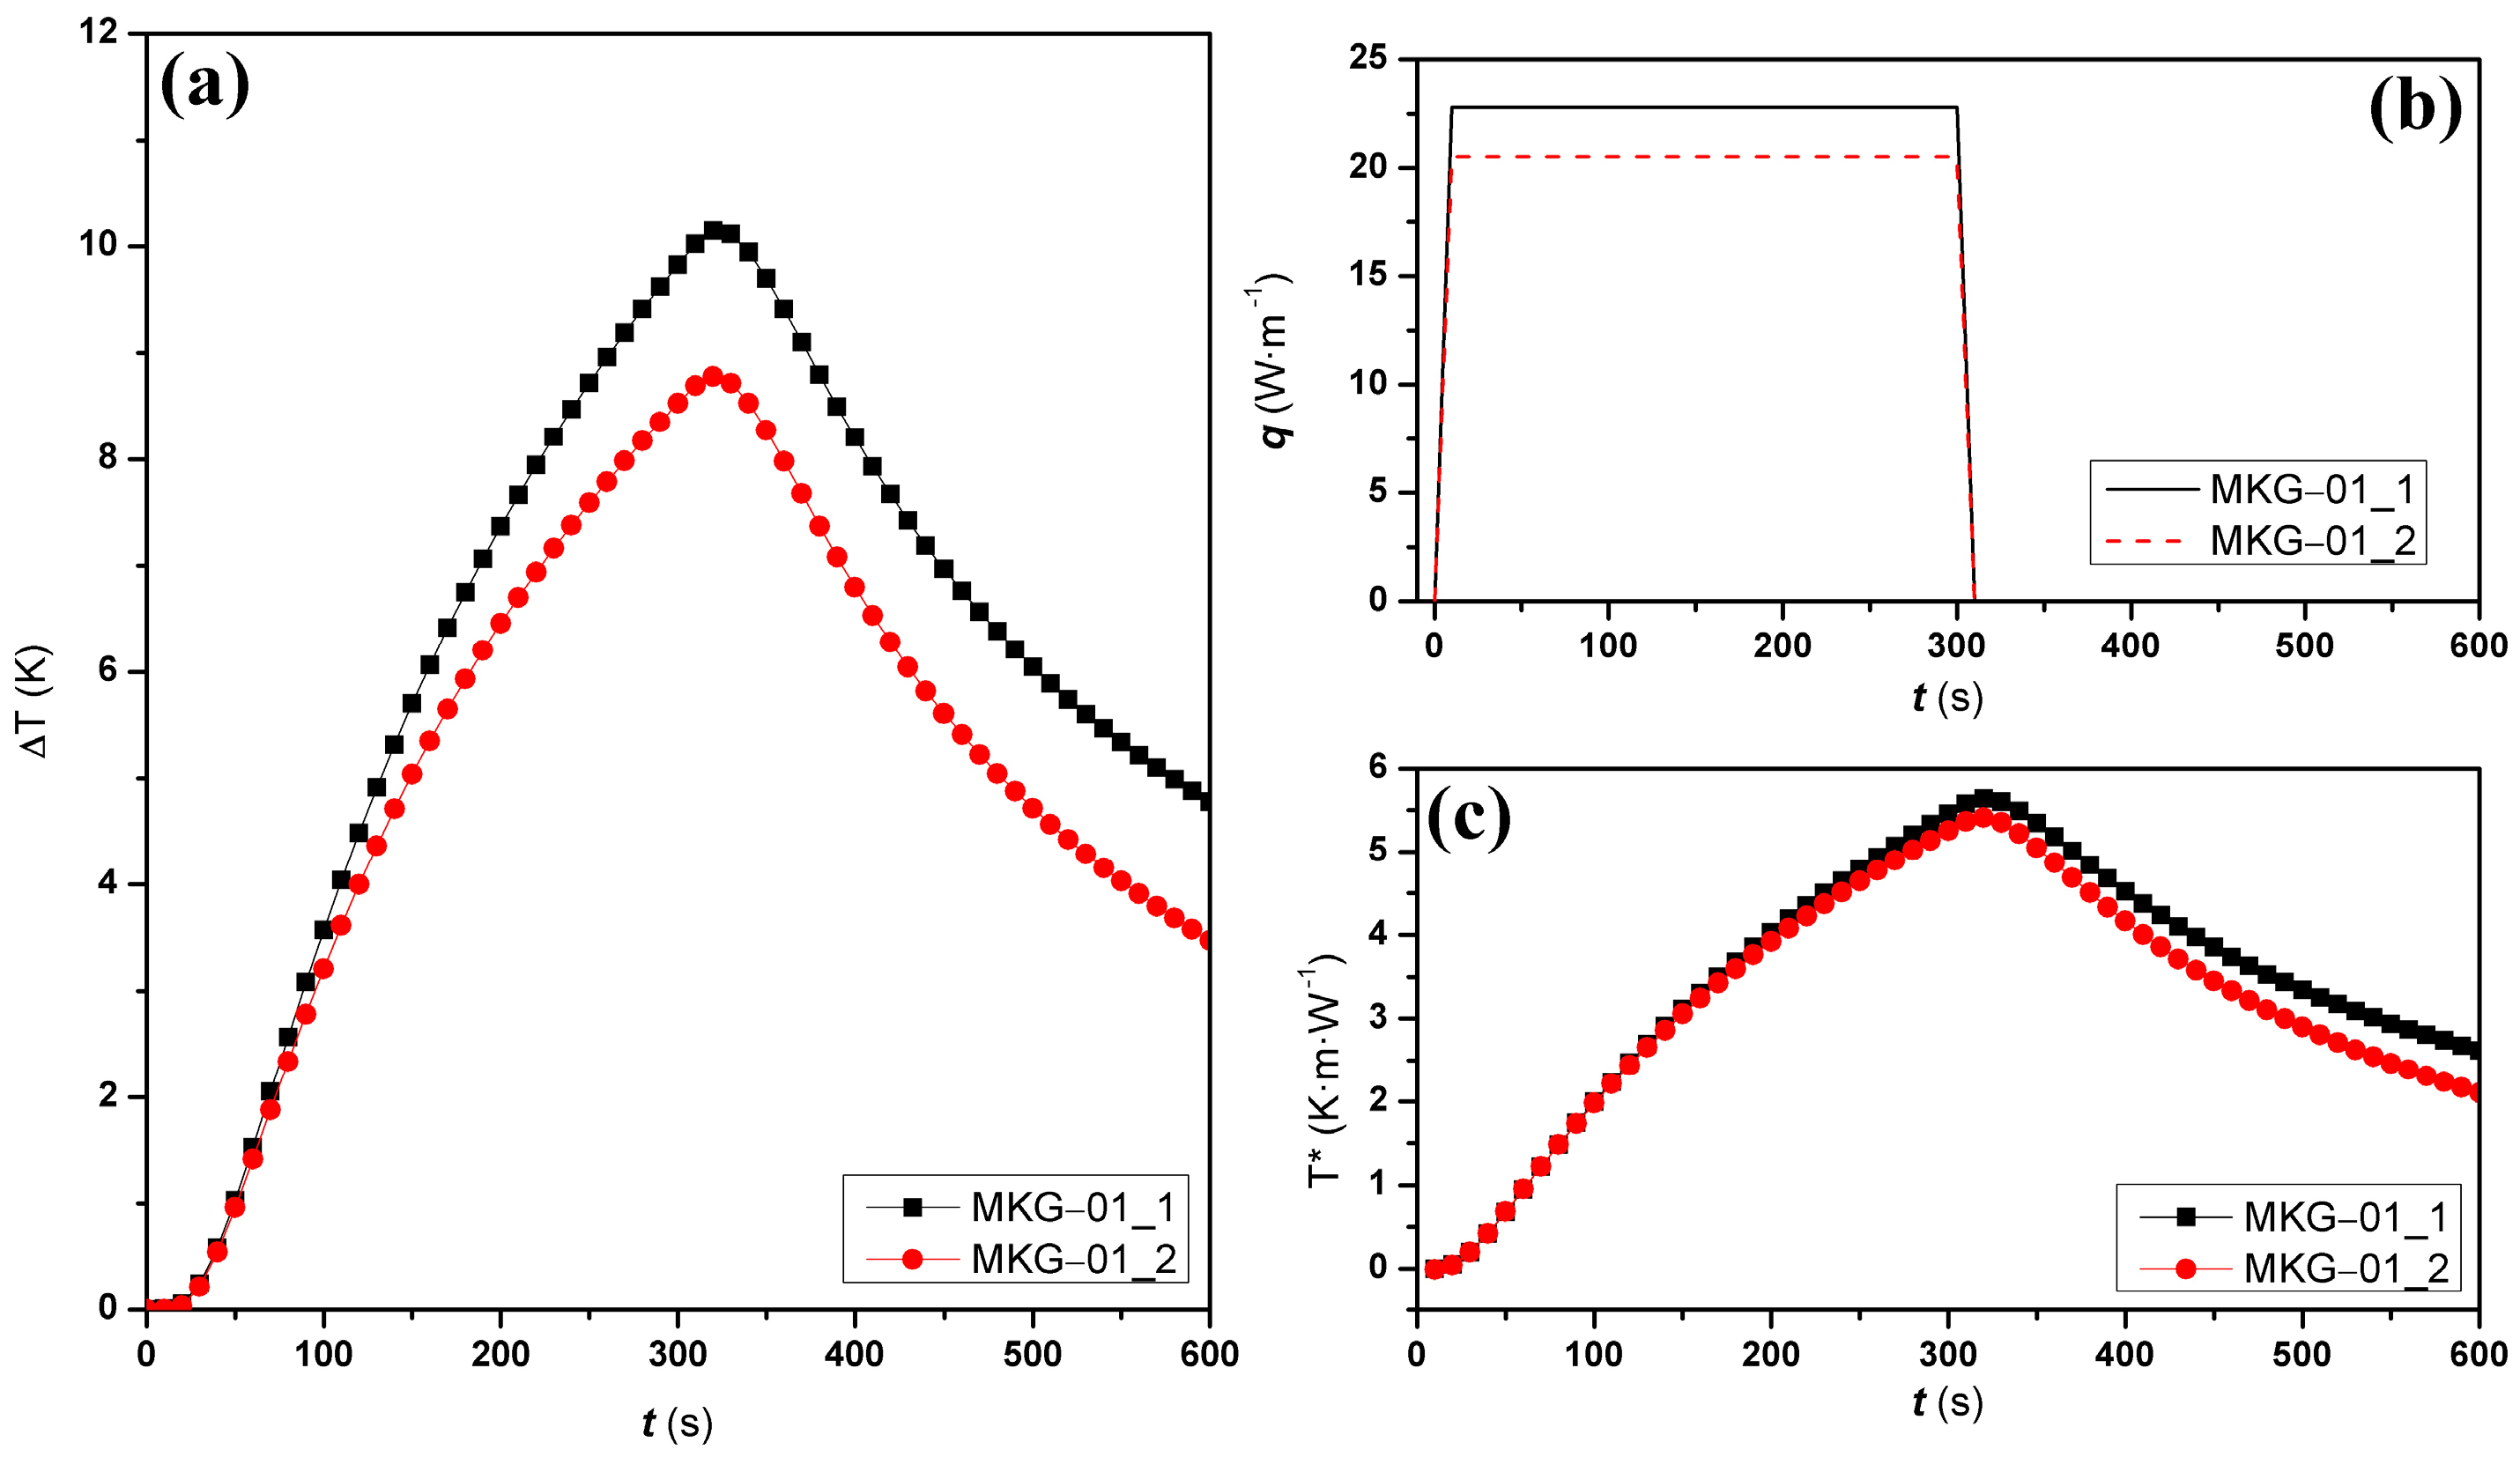
The thermal conductivity (κ) and thermal diffusivity (α) of the geopolymers were determined from the thermal response data obtained (61 measurement points) using the KD2 Pro thermal analyzer, coupled with the transient hot-wire technique. For this method, powder samples are needed, which were obtained by applying a mechanical milling process. In the measurements, a power density of 22.79 and 20.52 W/m was used to heat samples MKG-01_1 and MKG-01_2, while for samples MKG-02_1 and MKG-02_2, a heating power density of 24.32 and 21.12 W/m was used.

2.7. Gamma Radiation

Samples were subjected to gamma irradiation using a Gammacell 220 Excel irradiator (GC-220E) manufactured by MDS Nordion (4.9 kCi) (Ottawa, ON, Canada). A target dose of 10 kGy was used at a dose rate of 1.9 kGy/h, using a 60Co-γ source at room temperature (25 °C).

3. Results

The chemical composition of the geopolymers was acquired from the XRF technique. Although the composition is wellknown from the selected metakaolin raw material (Table 1, XRF allows for corroborationof the percentage of each element that constitutes the geopolymers, and the results are presented in Table 2.
As expected, the data indicate that silicon and aluminum oxides are the compounds found in the highest proportion. The presence of these elements is relevant because it promotes the development of the geopolymerization process during synthesis. The MKG-01 geopolymer presented the lowest percentages of these elements. In contrast, the composition of the MKG-02 and MKG-03 geopolymers turned out to be very similar.
The above would indicate that a significant proportion of Si, Al, and Ca reacted during the synthesis of the MKG-01 geopolymer, being able to form oxides, aluminates, and aluminosilicates. Flávio J.H. Tommasini Vieira Ramos et al. [42] evaluated the chemical composition of porous geopolymers using XRF. The authors presented the chemical composition in terms of oxides, finding calcium oxide (CaO), silicon oxide (SiO2), and aluminum oxide (Al2O3) in relevant proportions that favored the formation of geopolymers.
For the MKG-02 and MKG-03 geopolymers, a low S/L ratio implies a higher alkaline activator content, implying that the metakaolin absorbs the solution and reacts effectively to form oxides. As the S/L ratio increases, the amount of metakaolin increases, and the reaction is lower due to a deficiency of the alkaline activator.
On the other hand, there are some differences in chemical composition when comparing the raw metakaolin and the geopolymers. Some of these differences might correspond to the loss of organic matter and the decomposition of carbonates during the chemical reactions that lead to the formation of the geopolymers. In order to identify the amount of organic matter in the raw metakaolin, an additional loss on ignition (LOI) test was performed. A metakaolin sample was conditioned at 150 °C for 2 h to eliminate residual water. This process was then repeated by heating the sample at 500 °C and 900 °C to calculate the amount of organic matter and CO2 that might be lost during the synthesis process. This technique was applied based on what was previously established by Konare et al. (ISSN 1991-637X). The loss percentages of residual moisture, organic matter, and CO2 are calculated according to the following equations:
M o i s t u r e ,   % = I n i t i a l   w e i g h t w e i g h t   a t   150   ° C I n i t i a l   w e i g h t × 100
O r g a n i c ,   % = w e i g h t   a t   150   ° C w e i g h t   a t   500   ° C w e i g h t   a t   150   ° C × 100
L o s t   C O 2 ,   % = w e i g h t   a t   500   ° C w e i g h t   a t   900   ° C w e i g h t   a t   150   ° C × 100
By applying the formulae, the LOI test shows an initial loss of moisture of 2.16%, a loss of organic matter of about 1.93%, and, finally, a loss of CO2 near 0.93%. As the results show, although there is a certain amount of mass loss at each stage of the LOI test, it is not as significant as the changes observed during the XRF analysis. Considering this, the difference in composition percentage might be attributed to other effects, such as chemical decomposition due to the exothermic reaction during the geopolymerization process and other chemical reactions.
XRD analysis (Figure 1) of the geopolymers reveals the presence of peaks, suggesting a successful geopolymerization process. The most prominent peaks differ slightly according to the S/L ratio, indicating its influence on the structure of the synthesized geopolymers. The MKG-02 and MKG-03 geopolymers present similar crystalline phase patterns.
The main peaks located at 2θ angles 25° and 29° correspond to the kilchoanite compound, which is a silicate. The peaks observed at 2θ angles 32° and 34° belong to the lawsonite phase, a disilicate that can be included within the classification of aluminosilicates, the main components in forming the solid structure of cementitious materials such as geopolymers. The diffraction peaks of the mullite (2θ angle 26°) and quartz (2θ angle 38°) phases are also identified due to the presence of their secondary planes. The presence of these phases has been previously reported by other authors [43,44]. The diffraction peak at the angle 2θ = 9° corresponds to the boggsite phase, a compound of Al, Si, Ca, and O, similar to the composition of aluminosilicates.
The most prominent peaks in MKG-02 and MKG-03 geopolymers differ slightly from those revealed in the MKG-01 geopolymer. The intensity of some diffraction signals decreases significantly, especially those related to mullite and lawsonite. These variations can be attributed to the dehydroxylation of amorphous metakaolin [45]. The presence of additional phases, with diffraction peaks at very low angles, 2θ angles 6.18°, 9.98°, and 11.75°, belongs to sodium-aluminosilicate-hydrated compounds, as reported by D. Moro et al. [46]. The peak located at 2θ angle 66° of the quartz phase is maintained in all geopolymers.
Figure 2 shows the FTIR-ATR spectra of the synthesized geopolymers. The signals observed in the 3000–2700 cm−1 region correspond to the O–H stretching attributed to different bridge interactions with hydrogen [47]. The signal around 1660 cm−1 is assigned to the bending of H–O–H bonds [48]. Both signals are related to the presence of water molecules, which explains why the intensity of the bands decreases as the S/L ratio increases. The amount of free water molecules is more significant as the S/L ratio diminishes, as the amount of solid particles that can attain the water is lesser than in the samples where S/L is greater.
The bands around 1445 cm−1 are attributed to C–O bonds. The band is more noticeable in the MKG-01 geopolymer and less evident in the other geopolymers. According to other authors [48,49,50,51], this signal can be produced by a possible atmospheric carbonation reaction, which occurred during the handling of the samples since the excess sodium present in the mixtures can diffuse towards the surface, where it interacts with CO2 from the atmosphere.
The most intense band at 1000 cm−1 was the Si–O–T (T = Si or Al) stretching vibration. This band shifts to a lower wavenumber (1019–1014 cm−1), suggesting increased Si–O–Al bonds [52]. The small shoulder at 1151 cm−1 is due to the Si–O outside-the-plane-stretching vibration.
The broad and intense band at 570 cm−1 is assigned to –Si–O–Al. This signal decreases in the MKG-02 and MKG-03 geopolymers. The signal at 455 cm−1 is assigned to Si–O deformation vibrations and is much less intense in the MKG-01 geopolymer. All these changes indicate changes in the aluminosilicate structure as the synthesis of geopolymers progresses with increasing concentrations of alkaline activator [53,54].
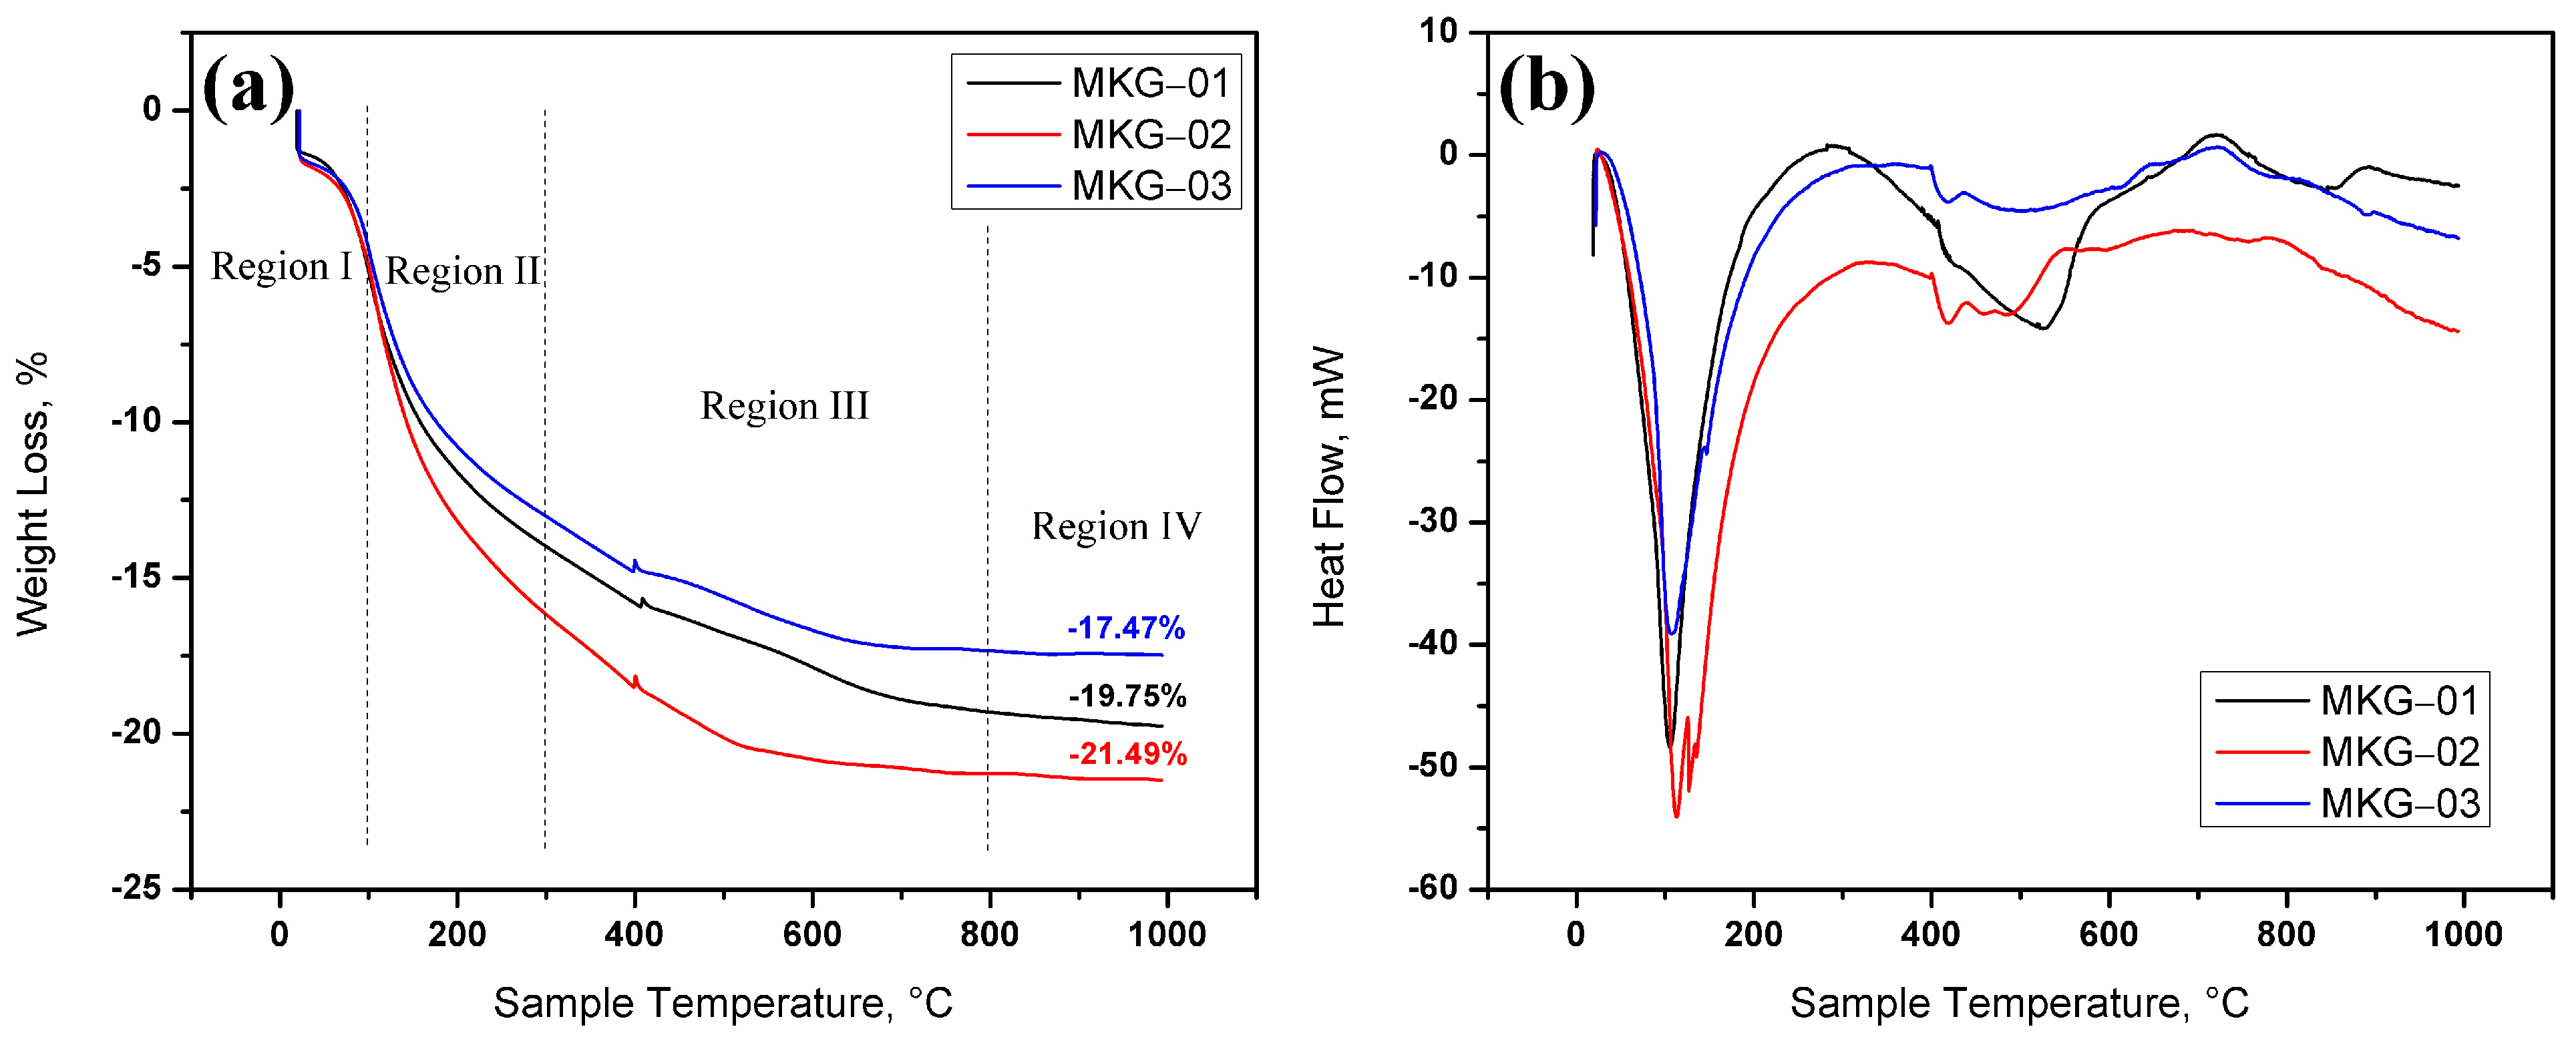
The TGA analysis corresponding to the geopolymers MKG-01, MKG-02, and MKG-03 is presented in Figure 3a. The mass loss ranged from approximately 17% to 21% at 1000 °C, depending on the geopolymer composition. In the case of the MKG-01 and MKG-02 geopolymers, a more significant mass loss was observed, attributed to a lower amount of sodium metasilicate. All weight loss percentages for each region are presented in Table 3.
The TGA curves were divided into four regions, as is commonly applied when evaluating inorganic polymers [55]. Within Region I, the weight loss below 100 °C can be seen, which is attributed to the evaporation of hygroscopic water, while the mass loss between 100 and 300 °C (Region II) is attributed to the evaporation of structural water from the geopolymer [55,56,57]. Mass loss in Region II was approximately 13.03%, 13.99%, and 16.17% for MKG-03, MKG-01, and MKG-02, respectively. Region II is where the maximum weight loss occurs.
Although less pronounced, weight loss continues in Region III, from 300 °C to approximately 800 °C. The mass loss in this region was about4.3% and 5.3% for MKG-03 and MKG-01, respectively. This weight loss is due to the dehydroxylation of SiOH and AlOH (up to 500 °C) and the loss of calcium, sodium, and potassium carbonates (between 500 and 800 °C) [58,59].
At the beginning of Region IV, the mass loss was 17.3%, 19.3%, and 21.3% for geopolymers MKG-03, MKG-01, and MKG-02, respectively. No relevant weight loss was observed above 800 °C and up to 1000 °C, indicating the absence of additional thermal decomposition reactions. Above 800 °C, the geopolymers have stabilized, achieving crystal formation and rearrangement of the molecules [57]. At 1000 °C, the mass retention of the geopolymers remained practically unchanged, indicating good thermal stability. The weight loss percentages are as low as 0.13%, 0.45%, and 0.21% for MKG-03, MKG-01, and MKG-02, respectively. These values show the tendency to maintain the weight at temperatures over 1000 °C, which confirms thegood thermal stability. The final weight loss percentages are similar to those reported by different authors [60,61,62]. A significant observation comes from the lack of consistency in weight loss regarding the S/L ratio. In Region I, there is a tendency for a lesser weight loss as the S/L ratio increases, an expected effect as the amount of free water decreases under these conditions. However, from Region II and above, sample MKG-02 presents a more evident weight lossattributed to a more significant evaporation of structural water. The following DSC curves corroborate this effect.
The mass losses related to the evaporation, dehydration, and dehydroxylation processes correspond to the endothermic effects observed in the DSC curves shown in Figure 3b. Thus, the DSC endotherms identify endothermic peaks representing phase changes or transitions that geopolymer samples undergo during TGA analysis. TGA-DSC analysis was performed for the synthesized geopolymers. The first observation of the DSC curves is the endothermic peak derived from mass loss up to 200 °C in the geopolymers. This is in accordance with the literature that associates this loss of mass with the loss of free water or lightly bound water in the structure of alkali-activated metakaolin. This endothermic peak is greater for MKG-02, which generates higher weight loss from Region II and above, as shown in the TGA curves.
The continuous mass loss observed in the TGA (Figure 3), due to the probable decomposition of calcium hydrates and the decarbonization of calcite, leads to an endothermic phase in the DSC curves in the range of 300 to 600 °C. The exothermic peak observed around 720 °C, observed for geopolymers MKG-01 and MKG-03, would be associated with the formation of sodium-containing aluminosilicates. The MKG-02 geopolymer did not present an exothermic signal.
Some authors [63] report an exothermic peak at approximately 950–970 °C in metakaolin-based geopolymers attributed to the transformation of metakaolin to the spinel phase followed by the crystallization of mullite. The absence of this exothermic peak would indicate that the synthesized geopolymers possess a complete transformation of metakaolin into geopolymer structures, even when the amount of alkaline activator was varied during the geopolymerization process.
Flame retardancy in geopolymers with aerospace applications allows us to evaluate the harsh conditions of use in which these materials could operate in nanosatellites, such as high exposure to heat or unexpected short circuits during assembly or launch into orbit. The geopolymers showed high fire resistance. The geopolymers self-extinguished once the flame was removed during the UL94 test. In this sense, the composition of the geopolymer does not have a significant influence since there is no sample burning for any of the formulations. Figure 4a presents the colorimetric tubes used to determine the presence of toxic components in the geopolymers, before the test.
The toxic compounds evaluated were hydrocyanic acid, hydrochloric acid, hydrofluoric acid, sulfur dioxide, and carbon monoxide. The colorimetric tubes did not change color at the end of the test, indicating that the geopolymers synthesized for aerospace applications are not toxic, as shown in Figure 4b.
On the other hand, the geopolymers did not show a considerable decrease in light transmission or an increase in optical density during the smoke density test, as seen in Table 4. This implies that the geopolymers synthesized for aerospace applications are stable materials that do not release smoke during continuous combustion.
Generally, the thermal conductivity of geopolymers is low. According to Rui He et al. [58], the thermal conductivity of geopolymers increases as a function of their density. Thus, the conductivity of geopolymers based on metakaolin is 0.550 to 0.650 W/(m·K) with densities of 1430 to 1890 kg/m3. However, these measurements depend on the methods and conditions for thermal conductivity.
Because conductivity is a function of density and the geopolymers with aerospace applications synthesized in this work show different densities when the S/L ratio varies, only the thermal conductivity of geopolymers MKG-01 and MKG-02 could be evaluated. The application that our research group is developing for these composite geopolymers is to develop panels for CubeSat nanosatellite structures. The panels are very thin (<2 mm), and the high viscosity of MKG-03 makes their molding and manufacturing impossible.
The determination of the thermophysical properties resulted fromanalyzing the obtained data using the KD2 Pro analyzer. The procedure consisted of the execution of a nonlinear fit by applying the following piecewise function:
T t = { b 0 t + b 1 · E 1 b 2 t   0 < t t h b 0 t + b 1 · E 1 b 2 t E 1 b 2 t t h t h < t t f
From the equation, th is the length of the heatpulse (300 s); tf is the measuring time (600 s); E1 is a function, closely related to the exponential integral function (Abramowitz and Stegun [64]), and from the model’s parameters b1 and b2, the κ and α values are calculated from the following expressions:
κ = 1 b 1   ;   α = r 2 4 b 2
where r represents the radial spacing between the sensor’s needles (6 mm). From the calculation of κ and α , the volumetric heat capacity can be estimated from the relation: c = κ − 1. Figure 5 and Figure 6 display the results of the thermal characterization, while Table 5 and Table 6 present a summary of the thermophysical properties. From the thermal analyses, MKG-01_01 and MKG-02_01 represent the samples MKG-01 and MKG-02 tested with the higher heating power density selected for each test, 22.79 and 24.32 W/m, respectively. Likewise, MKG-01_02 and MKG-02_02 refer to samples MKG-01 and MKG-02 tested with the lower power density, which, according to the experimental procedure, correspond to values of 20.52 and 21.12 W/m, respectively.
From the values in Table 5 and Table 6, the thermophysical properties of the samples differ primarily in the thermal conductivity and volumetric heat capacity. These results are consistent with the observation during the thermal response’s cooling stage, which indicates more significant thermal inertia in samples MKG-02_1 and MKG-02_2.
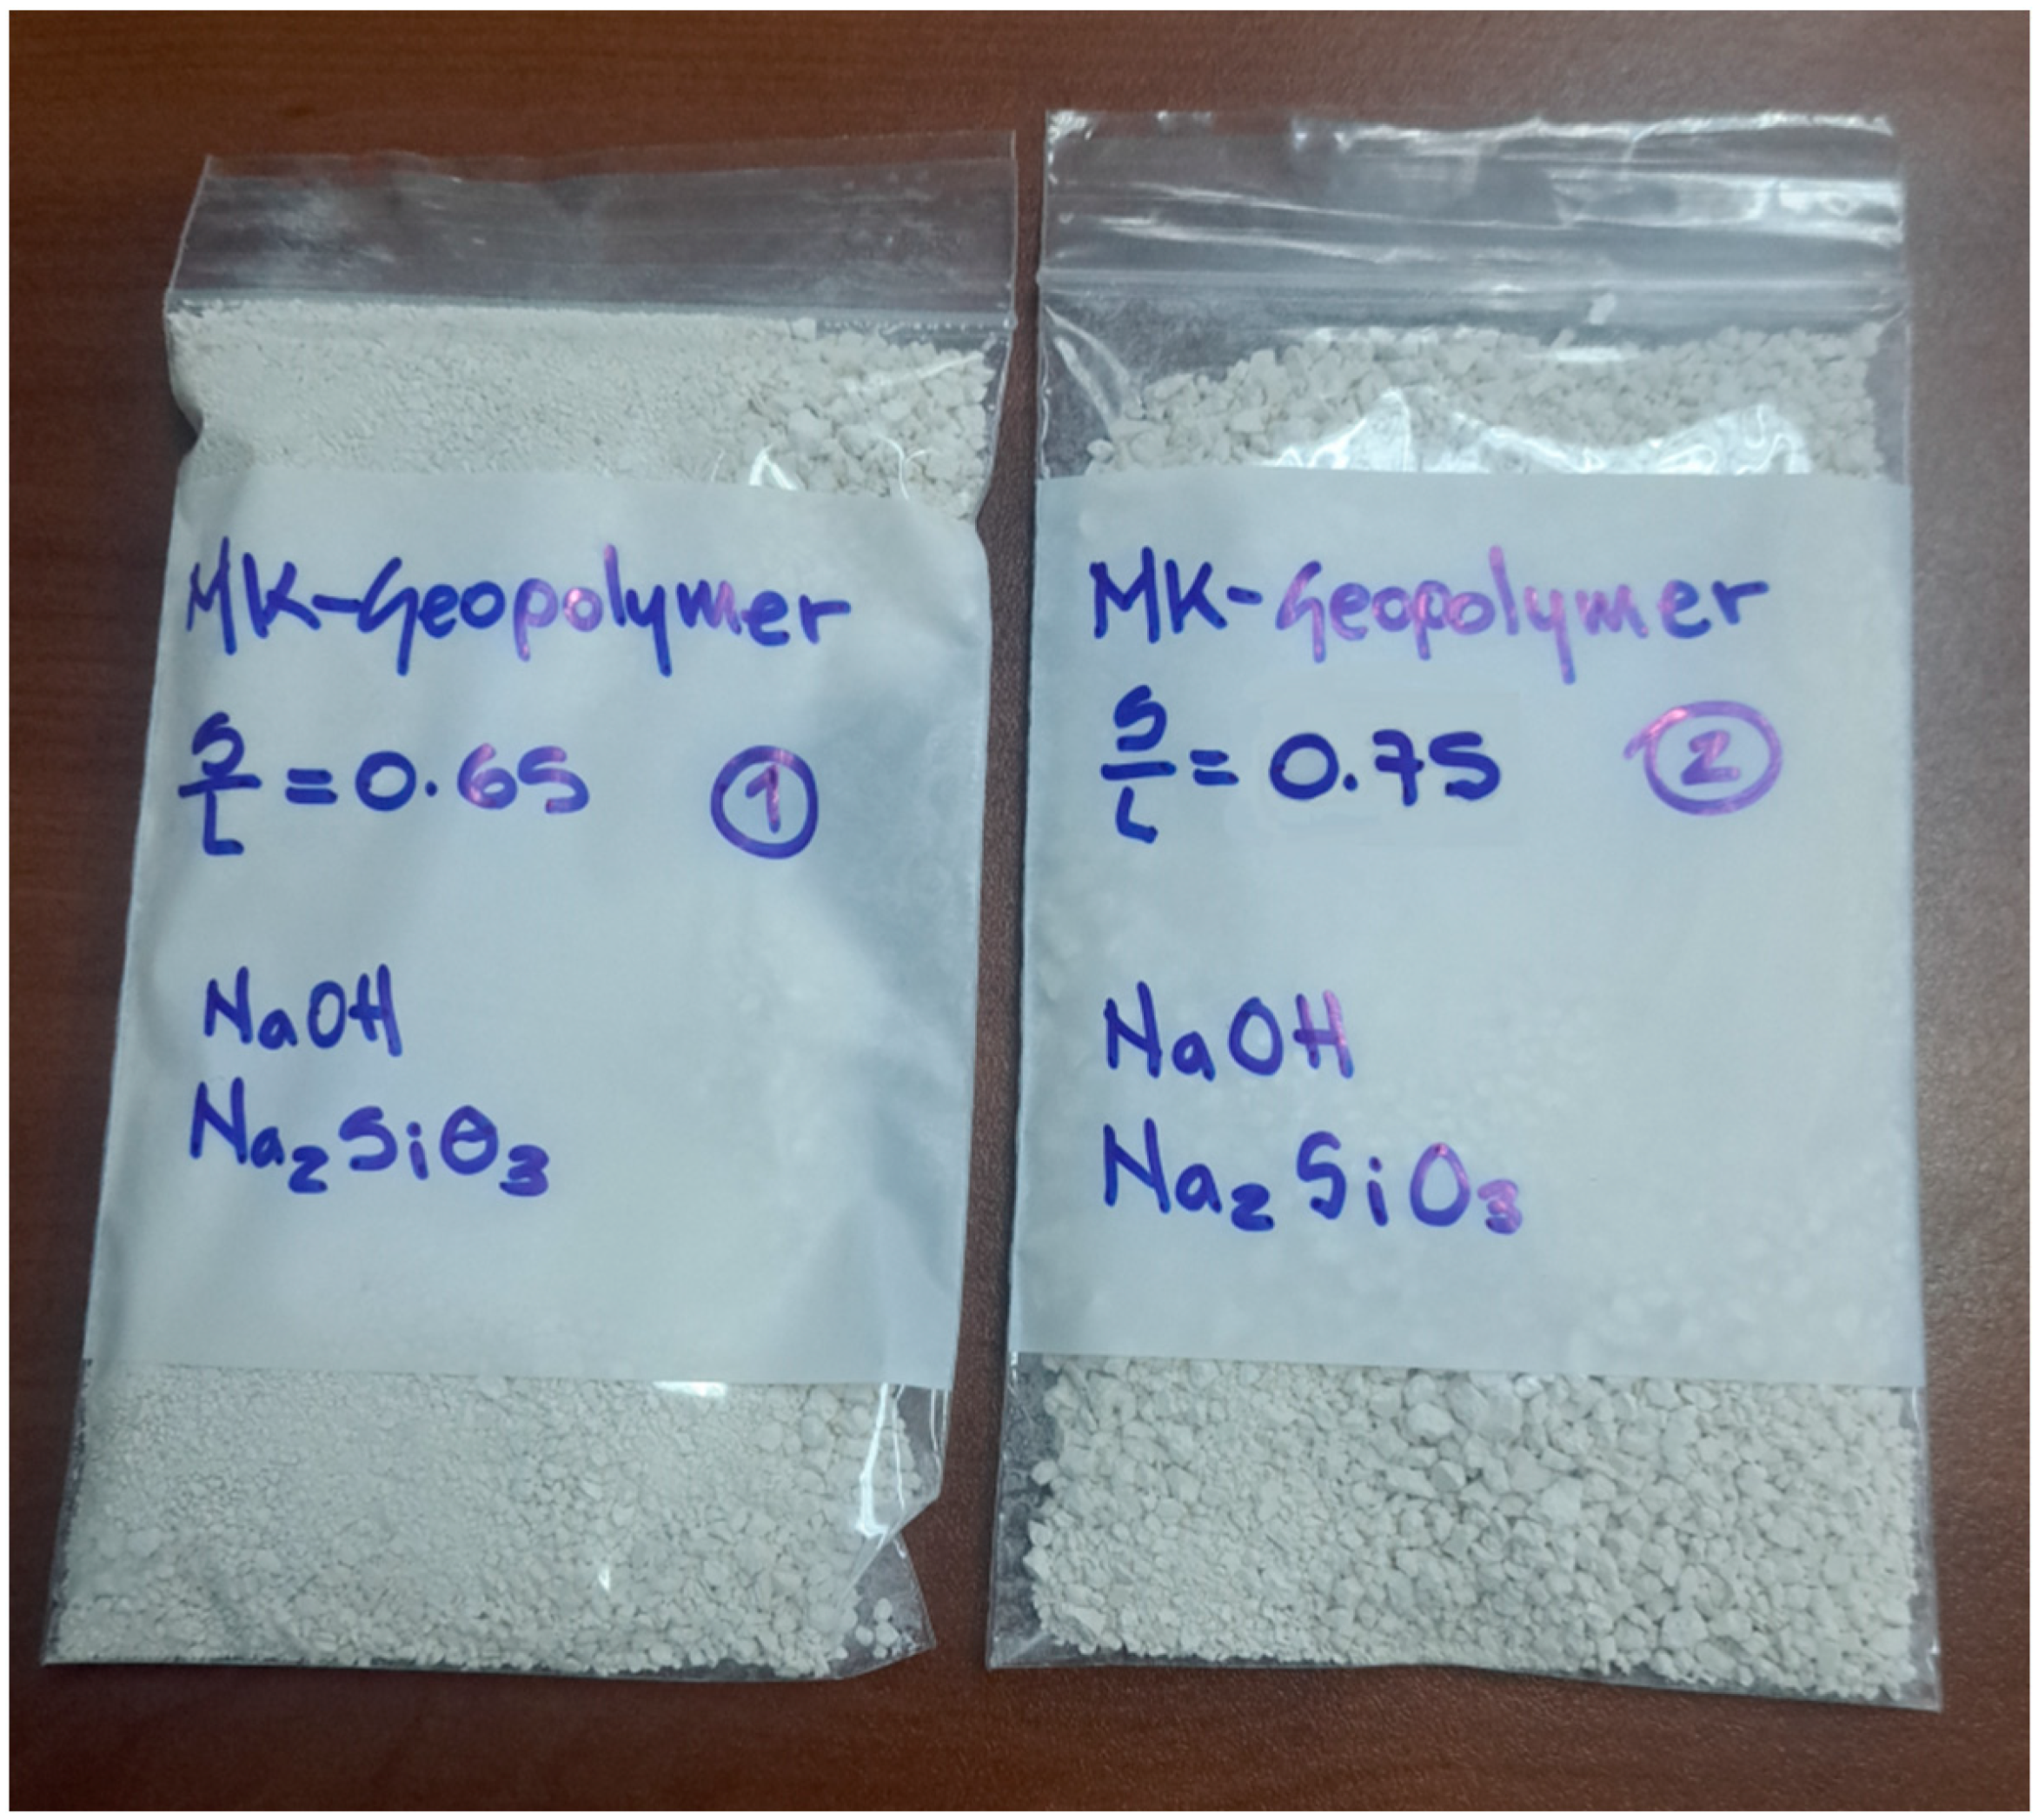
Furthermore, it is worth mentioning that, as expected, the particle size has a significant influence on the values of the thermophysical properties, particularly when comparing the values obtained for the MKG-02_1 sample (in which the particle size was larger before pulverizing and sieving, Figure 7), and those corresponding to sample MKG-02_2. Also, the root mean square error (RMSE) is presented in Table 5 and Table 6. Thesedata arehelpful for the validation of the fitting model. While the RMSE tends to zero, the model achieves better fitting.
Finally, the color change in the specimens was evaluated to determine the effect caused by the gamma irradiation applied to the geopolymer samples. The measured parameters were L, a, and b, referred to as a three-dimensional color space, as well as the hue angle (hue) and the chroma index (saturation). Table 7 presents the color values obtained before irradiation. Table 8 shows the color values measured after gamma irradiation.
As can be seen, all samples suffer changes for all color parameters, although they are relatively low, especially for parameters a and b, which have to do with the luminosity in the planes represented by the red-green and blue-yellow transitions, respectively. The most significant changes for these parameters occur in samples MKG-02 and MKG-03. On the other hand, the MKG-01 sample presents the most remarkable changes in the dimensional parameter L (black-white), the hue angle, and the chroma index.
The irradiated samples do not present significant changes in color evaluation. Thisseems to indicate that not many compounds can degrade or react by irradiation, sonew compounds or gases can be generated that cause changes in the test tubes. From this point of view, it is determined that all the geopolymer formulations evaluated are stable against gamma irradiation, so their application is appropriate when the manufactured elements require exposure to this type of radiation.

4. Conclusions

After testing and measuring the geopolymer samples with different S/L ratios, the results show that the amount of alkaline activator in the designed formulation effectively influences the properties of the final materials. Specifically, the composition and microstructure of the geopolymer change as the sodium-to-silicon ratio is also modified by an increment in sodium metasilicate and sodium hydroxide concentration from the alkaline activator. As the S/L ratio decreases, the amount of sodium in the formulation increases and becomes more significant, considering the amount of silicon available in the metakaolin powder. This effect is shown by XRF, where the silicon percentage is greater as the S/L ratio increases. In addition, the variation in the formulation results in microstructural changes, as shown by the presence of different crystalline phases in the XRD patterns, where a more complex structure is formed in the MKG-01 samples, as the larger amount of sodium available provokes the formation of different calcium-coordinated compounds. This effect is also visible in the FTIR spectra, where the intensity, position, and presence of some bands differ as the S/L ratio changes.
On the other hand, the properties of the geopolymers do not present significant changes as the formulation is modified. Considering the flame retardancy, all the samples presented similar results, as they self-extinguished and did not release toxic compounds as they burned. Also, the effect of gamma irradiation does not show significant changes, which means that all the samples are stable and are not significantly affected by exposure to this radiation. Finally, although there are no significant differences in properties by varying the formulation of the geopolymer in terms of their S/L ratio, the importance of this particular issue becomes relevant when composition and microstructure are of interest.

Author Contributions

Conceptualization, E.A.F.-U. and D.M.-C.; methodology, E.A.F.-U. and D.M.-C.; validation, D.M.-C.; formal analysis, D.M.-C., J.B.R.-T., J.H.-W. and T.J.M.-S.; investigation, D.M.-C., J.B.R.-T., J.H.-W. and T.J.M.-S.; resources, E.A.F.-U.; writing—original draft preparation, E.A.F.-U. and D.M.-C.; writing—review and editing, E.A.F.-U. and D.M.-C.; supervision, E.A.F.-U.; project administration E.A.F.-U.; funding acquisition, E.A.F.-U. All authors have read and agreed to the published version of the manuscript.

Funding

This work was funded by the Consejo Nacional de Humanidades Ciencias y Tecnologías (CONAHCyT), the Mexican Space Agency Program. Grant No. A-3-S-65807.

Data Availability Statement

The data presented in this study are available on request from the corresponding author.

Acknowledgments

The authors would like to acknowledge the technical support provided by the Centro de Ingenieria y Desarrollo Industrial (CIDESI) Querétaro. Special mention to Sergio Lopez for his work in the geopolymers preparation.

Conflicts of Interest

The authors declare no conflicts of interest.

References

  1. Davidovits, J. Synthesis of New High-Temperature Geo-Polymers for Reinforced Plastics/Composites. In Proceedings of the SPE PACTEC ’79, Costa Mesa, CA, USA, 31 January–2 February 1979; pp. 151–154. [Google Scholar]
  2. Vickers, L.; van Riessen, A.; Rickard, W. Fire-Resistant Geopolymers: Role of Fibers and Fillers to Enhance Thermal Properties; Springer: Berlin/Heidelberg, Germany, 2015; ISBN 9789812873101. [Google Scholar]
  3. Masi, G.; Rickard, W.D.A.; Bignozzi, M.C.; Van Riessen, A. The effect of organic and inorganic fibres on the mechanical and thermal properties of aluminate activated geopolymers. Compos. Part B Eng. 2015, 76, 218–228. [Google Scholar] [CrossRef]
  4. Muñiz-Villarreal, M.S.; Manzano-Ramírez, A.; Sampieri-Bulbarela, S.; Gasca-Tirado, J.R.; Reyes-Araiza, J.L.; Rubio-Ávalos, J.C.; Pérez-Bueno, J.J.; Apatiga, L.M.; Zaldivar-Cadena, A.; Amigó-Borrás, V. The effect of temperature on the geopolymerization process of a metakaolin-based geopolymer. Mater. Lett. 2011, 65, 995–998. [Google Scholar] [CrossRef]
  5. Lin, T.S.; Jia, D.C.; He, P.G.; Wang, M.R. Thermo-mechanical and microstructural characterization of geopolymers with α-Al2O3 particle filler. Int. J. Thermophys. 2009, 30, 1568–1577. [Google Scholar] [CrossRef]
  6. Franco-Urquiza, E.A.; Segundo, A. Desarrollo de geopolímeros compuestos. Parte II: Efecto de refuerzos de fibra corta y nanopartículas sobre la resistencia a la compresión. Afinidad 2021, 78, 593. Available online: https://raco.cat/index.php/afinidad/article/view/390015 (accessed on 20 March 2024).
  7. Segundo, A.; Franco-Urquiza, E.A. Desarrollo de geopolímeros compuestos. Parte I: Síntesis y caracterización. Afinidad 2021, 78, 140–147. [Google Scholar]
  8. Maspoch, M.L.; Franco-Urquiza, E.A.; Gamez-Perez, J.; Santana, O.O.; Sánchez-Soto, M. Fracture behaviour of poly [ethylene–(vinyl alcohol)]/organo-clay composites. Polym. Int. 2009, 58, 648–655. [Google Scholar] [CrossRef]
  9. Franco-Urquiza, E.A. Clay-based polymer nanocomposites: Essential work of fracture. Polymers 2021, 13, 2399. [Google Scholar] [CrossRef] [PubMed]
  10. Oshani, F.; Allahverdi, A.; Kargari, A.; Norouzbeigi, R.; Mahmoodi, N.M. Effect of preparation parameters on properties of metakaolin-based geopolymer activated by silica fume-sodium hydroxide alkaline blend. J. Build. Eng. 2022, 60, 104984. [Google Scholar] [CrossRef]
  11. Abadel, A.A.; Albidah, A.S.; Altheeb, A.H.; Alrshoudi, F.A.; Abbas, H.; Al-Salloum, Y.A. Effect of molar ratios on strength, microstructure & embodied energy of metakaolin geopolymer. Adv. Concr. Constr. 2021, 11, 127–140. [Google Scholar] [CrossRef]
  12. Pangdaeng, S.; Sata, V.; Chindaprasirt, P. Effect of sodium hydroxide concentration and sodium silicate to sodium hydroxide ratio on properties of calcined kaolin-white portland cement geopolymer. Int. J. Geomate 2018, 14, 121–128. [Google Scholar]
  13. Xu, H.; Van Deventer, J.S.J. The geopolymerisation of alumino-silicate minerals. Int. J. Miner. Process. 2000, 59, 247–266. [Google Scholar] [CrossRef]
  14. Rashad, A.M. Alkali-activated metakaolin: A short guide for civil Engineer-An overview. Constr. Build. Mater. 2013, 41, 751–765. [Google Scholar] [CrossRef]
  15. Lee, W.K. Solid-Gel Interactions in Geopolymers. Ph.D. Thesis, Department of Chemical Engineering, The University of Melbourne, Parkville, Australia, 2002. [Google Scholar]
  16. Provis, J.L.; Lukey, G.C.; Van Deventer, J.S.J. Do geopolymers actually contain nanocrystalline zeolites? A reexamination of existing results. Chem. Mater. 2005, 17, 3075–3085. [Google Scholar] [CrossRef]
  17. Shilar, F.A.; Ganachari, S.V.; Patil, V.B.; Khan, T.Y.; Javed, S.; Baig, R.U. Optimization of alkaline activator on the strength properties of geopolymer concrete. Polymers 2022, 14, 2434. [Google Scholar] [CrossRef] [PubMed]
  18. Luo, Y.; Jiang, Z.; Wang, D.; Lv, Y.; Gao, C.; Xue, G. Effects of alkaline activators on pore structure and mechanical properties of ultrafine metakaolin geopolymers cured at room temperature. Constr. Build. Mater. 2022, 361, 129678. [Google Scholar] [CrossRef]
  19. Lopes, A.V.; Lopes, S.M.; Pinto, I. Influence of the Composition of the Activator on Mechanical Characteristics of a Geopolymer. Appl. Sci. 2020, 10, 3349. [Google Scholar] [CrossRef]
  20. Sajan, P.; Jiang, T.; Lau, C.; Tan, G.; Ng, K. Combined effect of curing temperature, curing period and alkaline concentration on the mechanical properties of fly ash-based geopolymer. Cleaner Mater. 2021, 1, 100002. [Google Scholar] [CrossRef]
  21. Růžek, V.; Dostayeva, A.M.; Walter, J.; Grab, T.; Korniejenko, K. Carbon fiber-reinforced geopolymer composites: A review. Fibers 2023, 11, 17. [Google Scholar] [CrossRef]
  22. Korniejenko, K.; Łach, M.; Mikuła, J. The influence of short coir, glass and carbon fibers on the properties of composites with geopolymer matrix. Materials 2021, 14, 4599. [Google Scholar] [CrossRef] [PubMed]
  23. Samal, S. Effect of high temperature on the microstructural evolution of fiber reinforced geopolymer composite. Heliyon 2019, 5, e01779. [Google Scholar] [CrossRef]
  24. Kozub, B.; Bazan, P.; Mierzwiński, D.; Korniejenko, K. Fly-ash-based geopolymers reinforced by melamine fibers. Materials 2021, 14, 400. [Google Scholar] [CrossRef]
  25. Pacheco-Torgal, F.; Jalali, S.; Gomes, J.P.C. Utilization of mining wastes to produce geopolymer binders. In Geopolymers: Structures, Processing, Properties and Industrial Applications; Woodhead Publishing: Sawston, UK, 2009; pp. 267–293. [Google Scholar] [CrossRef]
  26. Provis, J.L.; Van Deventer, J.S.J. Introduction to geopolymers. In Geopolymers; Elsevier: Amsterdam, The Netherlands, 2009; pp. 1–11. ISBN 9781845694494. [Google Scholar]
  27. Chindaprasirt, P.; De Silva, P.; Sagoe-Crentsil, K.; Hanjitsuwan, S. Effect of SiO2 and Al2O3 on the setting and hardening of high calcium fly ash-based geopolymer systems. J. Mater. Sci. 2012, 47, 4876–4883. [Google Scholar] [CrossRef]
  28. De Vargas, A.S.; Molin, D.C.C.D.; Vilela, A.C.F.; Da Silva, F.J.; Pavão, B.; Veit, H. The effects of Na2O/SiO2 molar ratio, curing temperature and age on compressive strength, morphology and microstructure of alkali-activated fly ash-based geopolymers. Cem. Concr. Compos. 2011, 33, 653–660. [Google Scholar] [CrossRef]
  29. Kamseu, E.; Alzari, V.; Nuvoli, D.; Sanna, D.; Lancellotti, I.; Mariani, A.; Leonelli, C. Dependence of the geopolymerization process and end-products to the nature of solid precursors: Challenge of the sustainability. J. Clean. Prod. 2021, 278, 123587. [Google Scholar] [CrossRef]
  30. Provis, J.L.; Bernal, S.A. Geopolymers and Related Alkali-Activated Materials. Annu. Rev. Mater. Res. 2014, 44, 299–327. [Google Scholar] [CrossRef]
  31. Phair, J.W.; Van Deventer, J.S.J. Characterization of fly-ash-based geopolymeric binders activated withsodium aluminate. Ind. Eng. Chem. Res. 2002, 41, 4242–4251. [Google Scholar] [CrossRef]
  32. Giancaspro, J.; Balaguru, P.; Lyon, R. Fire protection of flammable materials utilizing geopolymer. Sampe J. 2004, 40, 42–49. [Google Scholar]
  33. O’Bradaigh, C.; Doyle, A.; Doyle, D.; Feerick, P.J. Electrically-Heated Ceramic Composite Tooling for Out-of-Autoclave Manufacturing of Large Composite Structures. Sampe J. 2011, 47, 6–14. [Google Scholar]
  34. Lee, S.; Van Riessen, A. A review on geopolymer technology for lunar base construction. Materials 2022, 15, 4516. [Google Scholar] [CrossRef] [PubMed]
  35. Korniejenko, K.; Pławecka, K.; Kozub, B. An overview for modern energy-efficient solutions for lunar and martian habitats made based on geopolymers composites and 3D printing technology. Energies 2022, 15, 9322. [Google Scholar] [CrossRef]
  36. Montes, C.; Broussard, K.; Gongre, M.; Simicevic, N.; Mejia, J.; Tham, J.; Allouche, E.; Davis, G. Evaluation of lunar regolith geopolymer binder as a radioactive shielding material for space exploration applications. Adv. Space Res. 2015, 56, 1212–1221. [Google Scholar] [CrossRef]
  37. Torres, M.; Burdin, L.; Rentería-Rodríguez, A.V.; Franco-Urquiza, E.A. Degradation of Epoxy–Particles Composites Exposed to UV and Gamma Radiation. Chemistry 2023, 5, 559–570. [Google Scholar] [CrossRef]
  38. Torres, M.; Franco-Urquiza, E.A.; González-García, P.; Bárcena-Balderas, J.; Piedra, S.; Madera-Santana, T.; Melendrez-Amavizca, R.; Quintana-Owen, P. Characterization of epoxy-nanoparticle composites exposed to gamma & UV radiation for aerospace applications. Nano Hybrids Compos. 2019, 27, 53–65. [Google Scholar]
  39. ANSI/UL94; Tests for Flammability of Plastic Materials for Parts in Devices and Appliances. American National Standard: Washington, DC, USA, 2023.
  40. FAA. Aircraft Materials Fire Test Handbook, Chapter 6; U.S. Department of Transportation Federal Aviation Administration: Washington, DC, USA, 2000.
  41. ISO 5659-2; Plastics—Smoke Generation, Part 2: Determination of Optical Density by a Single Chamber Test. International Organization for Standardization: Geneva, Switzerland, 2017. Available online: https://www.iso.org/standard/65243.html (accessed on 20 March 2024).
  42. Ramos, F.J.T.V.; Vieira, M.D.F.M.; Tienne, L.G.P.; de Oliveira Aguiar, V. Evaluation and characterization of geopolymer foams synthesized from blast furnace with sodium metasilicate. J. Mater. Res. Technol. 2020, 9, 12019–12029. [Google Scholar] [CrossRef]
  43. Li, Z.; Zhang, S.; Zuo, Y.; Chen, W.; Ye, G. Chemical deformation of metakaolin based geopolymer. Cem. Concr. Res. 2019, 120, 108–118. [Google Scholar] [CrossRef]
  44. Dai, S.; Wang, H.; An, S.; Yuan, L. Mechanical properties and microstructural characterization of metakaolin geopolymers based on orthogonal tests. Materials 2022, 15, 2957. [Google Scholar] [CrossRef] [PubMed]
  45. Aouan, B.; Alehyen, S.; Fadil, M.; El Alouani, M.; Saufi, H.; Taibi, M.H. Characteristics, microstructures, and optimization of the geopolymer paste based on three aluminosilicate materials using a mixture design methodology. Constr. Build. Mater. 2023, 384, 131475. [Google Scholar] [CrossRef]
  46. Moro, D.; Fabbri, R.; Romano, J.; Ulian, G.; Calafato, A.; Solouki, A.; Sangiorgi, C.; Valdrè, G. Thermal, X-ray diffraction and oedometric analyses of silt-waste/NaOH-activated metakaolin geopolymer composite. J. Compos. Sci. 2021, 5, 269. [Google Scholar] [CrossRef]
  47. Kouamo, H.T.; Elimbi, A.; Mbey, J.A.; Sabouang, C.N.; Njopwouo, D. The effect of adding alumina-oxide to metakaolin and volcanic ash on geopolymer products: A comparative study. Constr. Build. Mater. 2012, 35, 960–969. [Google Scholar] [CrossRef]
  48. El Alouani, M.; Alehyen, S.; El Achouri, M.; Taibi, M. Preparation, Characterization, and Application of Metakaolin-Based Geopolymer for Removal of Methylene Blue from Aqueous Solution. J. Chem. 2019, 14, 4212901. [Google Scholar] [CrossRef]
  49. Mustakim, S.M.; Das, S.K.; Mishra, J.; Aftab, A.; Alomayri, T.S.; Assaedi, H.S.; Kaze, C.R.; Fresh, I.I. Mechanical and Microstructural Properties of Fly Ash- Blast Furnace Slag Based Geopolymer Concrete By Addition of Nano and Micro Silica. Silicon 2021, 13, 2415–2428. [Google Scholar] [CrossRef]
  50. Zaharaki, D.; Komnitsas, K.; Perdikatsis, V. Use of analytical techniques for identification of inorganic polymer gel composition. J. Mater. Sci. 2010, 45, 2715–2724. [Google Scholar] [CrossRef]
  51. Kaya, K.; Soyer-Uzun, S. Evolution of structural characteristics and compressive strength in red mud-metakaolin based geopolymer systems. Ceram. Int. 2016, 42, 7406–7413. [Google Scholar] [CrossRef]
  52. Poggetto, G.D.; Kittisayarm, P.; Pintasiri, S.; Chiyasak, P.; Leonelli, C.; Chaysuwan, D. Chemical and Mechanical Properties of Metakaolin-Based Geopolymers with Waste Corundum Powder Resulting from Erosion Testing. Polymers 2022, 14, 5091. [Google Scholar] [CrossRef] [PubMed]
  53. Gao, L.; Zheng, Y.; Tang, Y.; Yu, J.; Yu, X.; Liu, B. Effect of phosphoric acid content on the microstructure and compressive strength of phosphoric acid-based metakaolin geopolymers. Heliyon 2020, 6, e03853. [Google Scholar] [CrossRef] [PubMed]
  54. Ivanović, M.; Nenadović, S.; Pavlović, V.P.; Radovic, I.; Kijevcanin, M.; Pavlovic, V.; Kljajević, L. The influence of thermodynamic parameters on alkaline activator of geopolymers and structure of geopolymers. Maced. J. Chem. Chem. Eng. 2021, 40, 107–117. [Google Scholar] [CrossRef]
  55. Lemougna, P.N.; Adediran, A.; Yliniemi, J.; Ismailov, A.; Levanen, E.; Tanskanen, P.; Kinnunen, P.; Roning, J.; Illikainen, M. Thermal stability of one-part metakaolin geopolymer composites containing high volume of spodumene tailings and glass wool. Cem. Concr. Comp. 2020, 114, 103792. [Google Scholar] [CrossRef]
  56. Sivasakthi, M.; Jeyalakshmi, R.; Rajamane, N.P.; Jose, R. Thermal and structural micro analysis of micro silica blended fly ash based geopolymer composites. J. Non-Cryst. Solids. 2018, 499, 117–130. [Google Scholar] [CrossRef]
  57. Zawrah, M.F.; Sawan, S.A.; Khattab, R.M.; Abdel-Shafi, A.A. Effect of nano sand on the properties of metakaolin-based geopolymer: Study on its low rate sintering. Constr. Build. Mater. 2020, 246, 118486. [Google Scholar] [CrossRef]
  58. He, R.; Dai, N.; Wang, Z. Thermal and Mechanical Properties of Geopolymers Exposed to High Temperature: A Literature Review. Adv. Civ. Eng. 2020, 1, 7532703. [Google Scholar] [CrossRef]
  59. Karunadasa, K.S.; Manoratne, C.H.; Pitawala, H.M.T.G.A.; Rajapakse, R.M.G. Thermal decomposition of calcium carbonate (calcite polymorph) as examined by in-situ high-temperature X-ray powder diffraction. J. Phys. Chem. Solids 2019, 134, 21–28. [Google Scholar] [CrossRef]
  60. Liu, X.; Jiang, J.; Zhang, H.; Li, M.; Wu, Y.; Guo, L.; Wang, W.; Duan, P.; Zhang, W.; Zhang, Z. Thermal stability and microstructure of metakaolin-based geopolymer blended with rice husk ash. Appl. Clay Sci. 2020, 196, 105769. [Google Scholar] [CrossRef]
  61. da Silva Rocha, T.; Dias, D.P.; França, F.C.C.; de Salles Guerra, R.R.; de Oliveira, L.R.D.C. Metakaolin-based geopolymer mortars with different alkaline activators (Na+ and K+). Constr. Build. Mater. 2018, 178, 453–461. [Google Scholar] [CrossRef]
  62. Chaipanich, A.; Wianglor, K.; Piyaworapaiboon, M.; Sinthupinyo, S. Thermogravimetric analysis and microstructure of alkali-activated metakaolin cement pastes. J. Therm. Anal. Calorim. 2019, 138, 1965–1970. [Google Scholar] [CrossRef]
  63. Caballero, L.R.; Paiva, M.D.D.M.; Fairbairn, E.D.M.R.; Toledo Filho, R.D. Thermal, mechanical and microstructural analysis of metakaolin based geopolymers. Mater. Res. 2019, 22, e20180716. [Google Scholar] [CrossRef]
  64. Abramowitz, M. Handbook of Mathematical Functions, with Formulas, Graphs, and Mathematical Tables; Dover Publications, Inc.: Mineola, NY, USA, 1974; ISBN 0486612724. [Google Scholar]
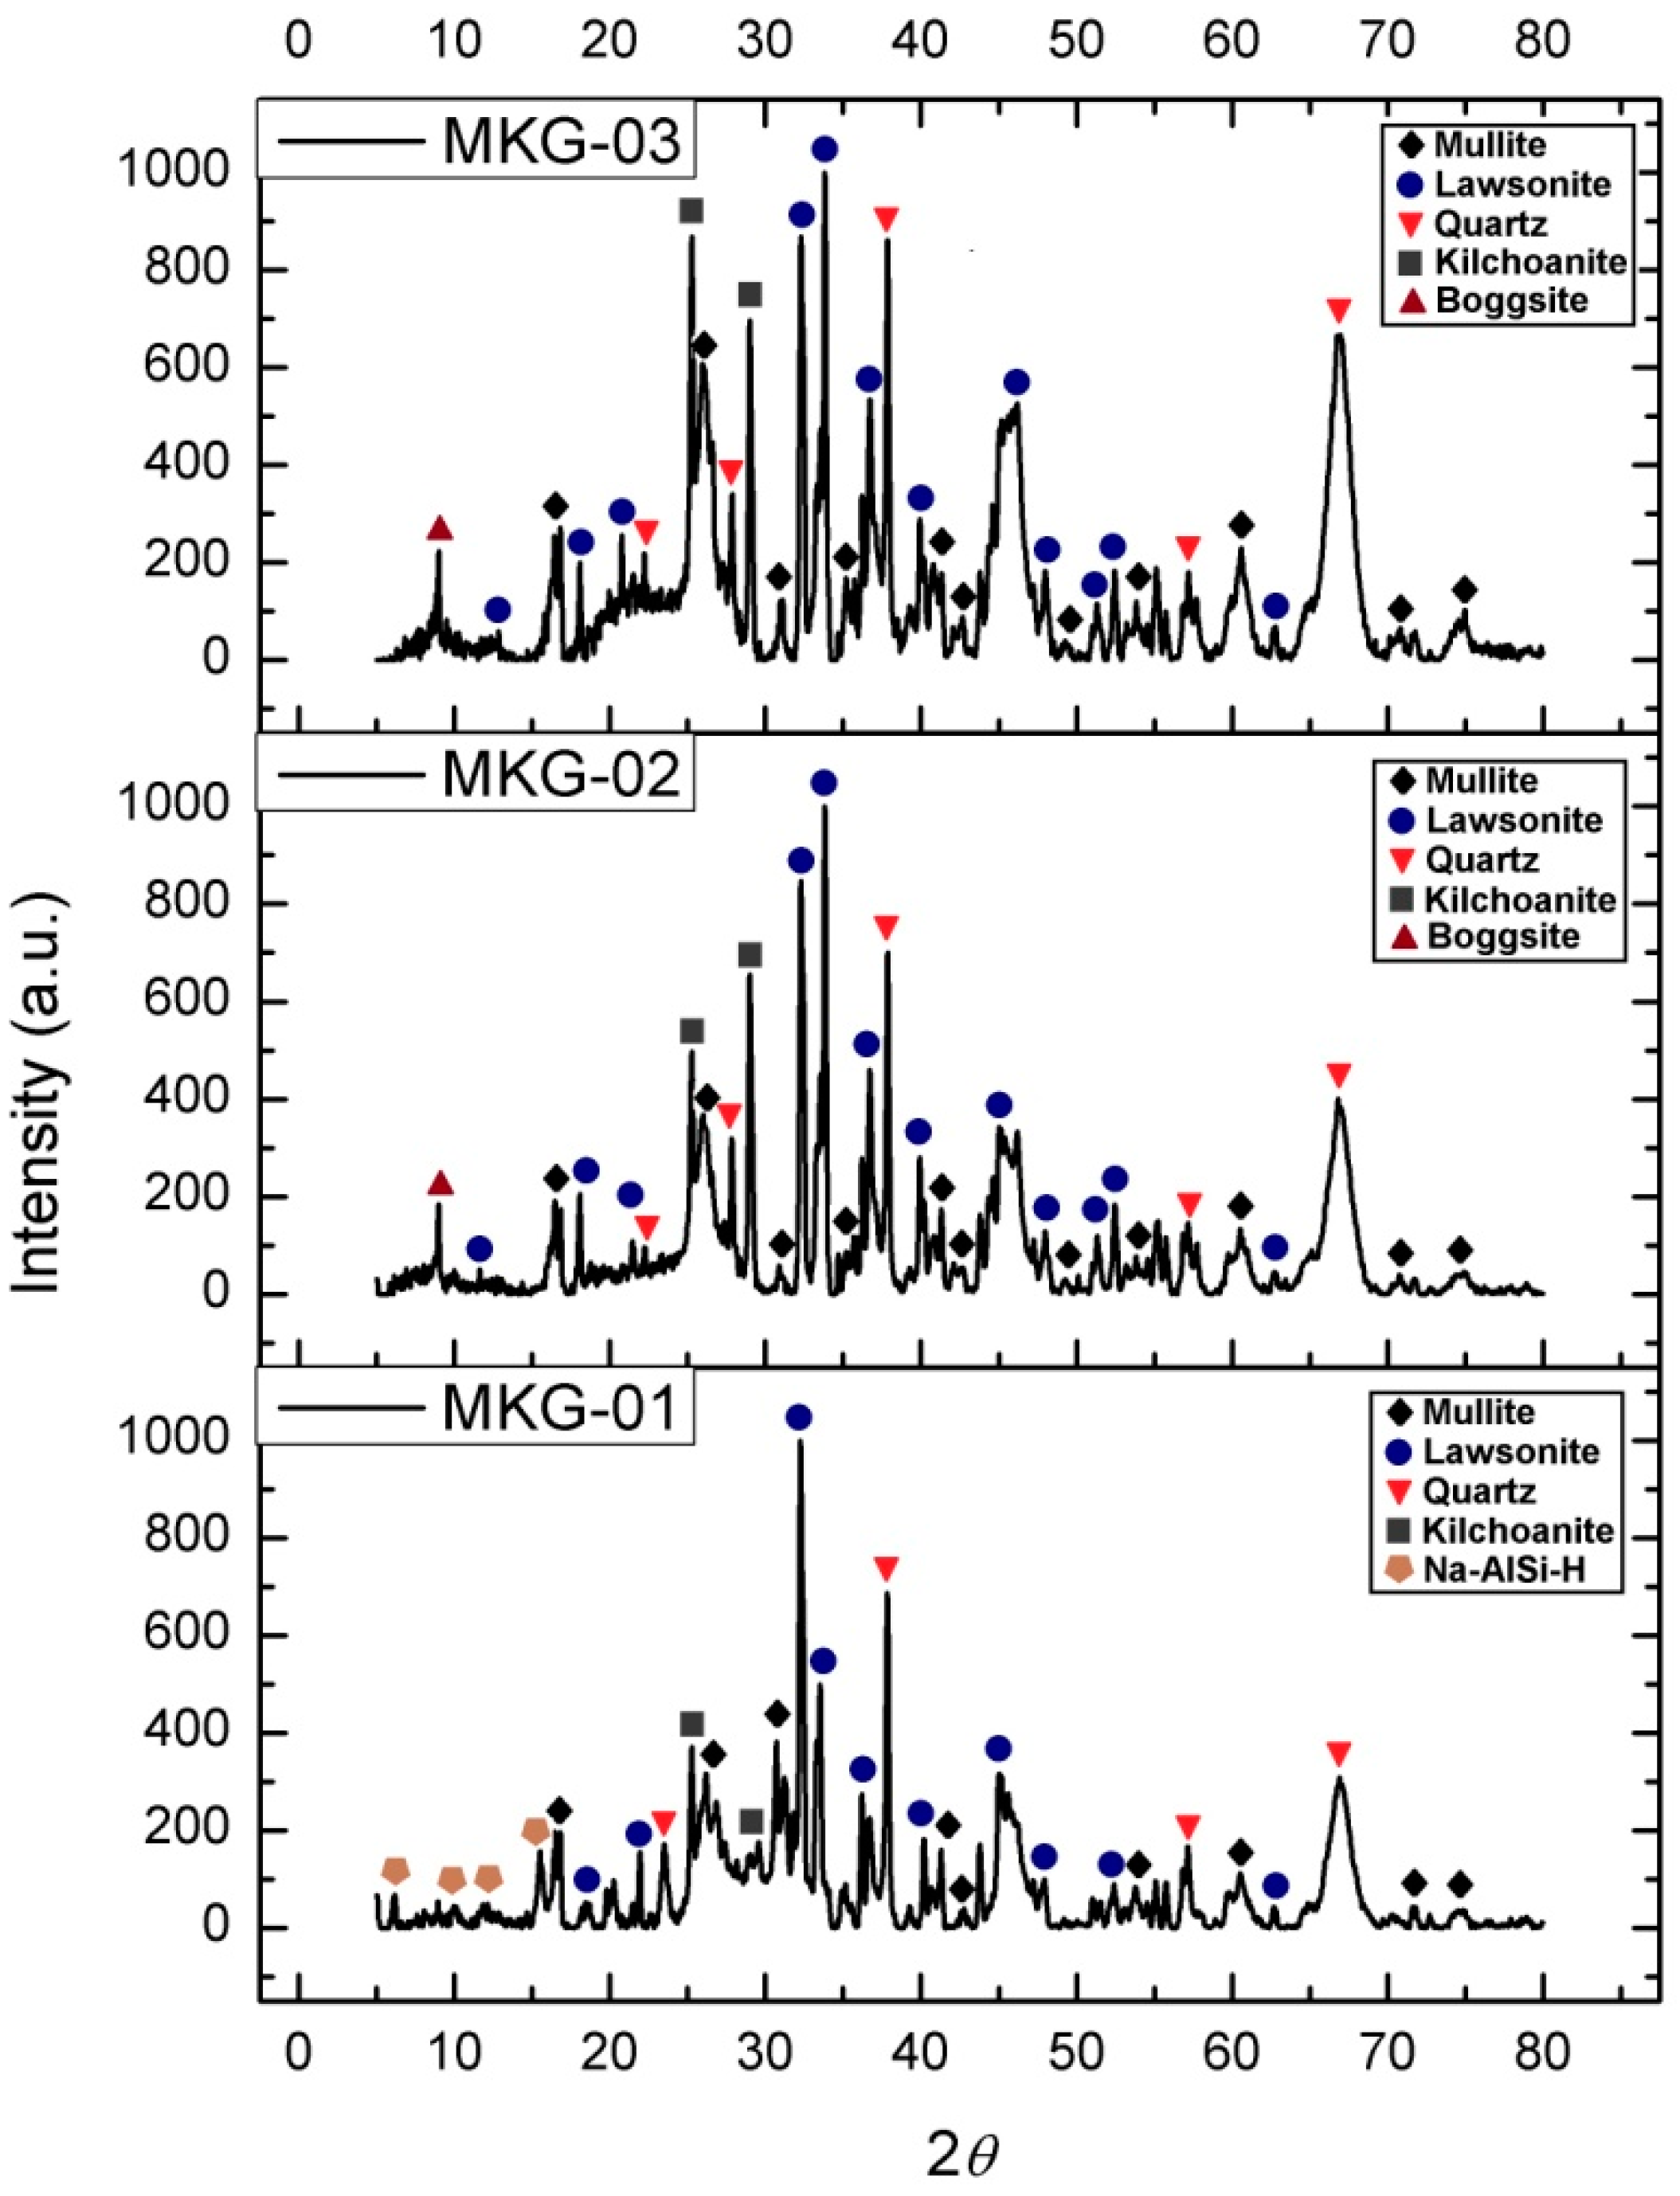
Figure 1. X-ray diffraction patterns obtained from the geopolymer samples with different S/L ratios: MKG-01 = 0.65, MKG-02 = 0.75, and MKG-03 = 1.0.
Physchem 04 00015 g001
Figure 2. FTIR-ATR spectra of the developed geopolymers.
Physchem 04 00015 g002
Figure 3. (a) TGA graphs of the geopolymers with different S/L ratios, according to the weight loss percentage. (b) DSC graphs showing endothermic and exothermic peaks for the geopolymers with different S/L ratios.
Physchem 04 00015 g003
Figure 4. Colorimetric tubes for determining the presence of toxic components of geopolymer samples. From left to right: HCN, HCl, HF, SO2,and CO: (a) before, and (b) after the test.
Physchem 04 00015 g004
Figure 5. (a) Thermal response of MKG-01_1 (black line with squares) and MKG-01_2 (red line with dots) samples. (b) Heating power density used to characterize MKG-01_1 (black solid line) and MKG-01_2 (red dashed line). (c) Best-fitting curves calculated for the MKG-01_1 (black line with squares) and MKG-01_2 (red line with dots) samples.
Physchem 04 00015 g005
Figure 6. (a) Thermal response of MKG-02_1 (black line with squares) and MKG-02_2 (red line with dots) samples. (b) Heating power density used to characterize MKG-02_1 (black solid line) and MKG-02_2 (red dashed line). (c) Best-fitting curves calculated for the MKG-02_1 (black line with squares) and MKG-02_2 (red line with dots) samples.
Physchem 04 00015 g006
Figure 7. Powder samples of the geopolymer for the evaluation of the thermal response. Sample MKG-02 (right) shows a greater particle size in comparison with MKG-01 (left).
Physchem 04 00015 g007
Table 1. Results of chemical composition analysis of the metakaolin as a raw material. The results are presented in their oxide forms and as percentage content (%).
Chemical CompositionMetakaolin
Al2O351.035
SiO244.495
P2O51.4850
TiO21.4230
Fe2O30.9201
K2O0.3005
CaO0.1466
V2O50.0605
NiO0.0259
Cr2O30.0234
Table 2. Results of chemical composition analysis of geopolymers with different S/L ratios. The results are presented in their oxide forms and as percentage content (%).
Chemical CompositionMKG-01MKG-02MKG-03
SiO220.06035.31036.130
Al2O314.11027.96031.820
TiO20.64640.79120.7831
Fe2O30.60970.61750.6148
P2O50.51100.89150.8201
K2O0.12750.16720.1638
CaO0.09180.10760.0872
NiO0.03090.03360.0354
V2O50.01780.02180.0188
Cr2O30.01170.01390.0134
Table 3. Weight loss % at the end of each identified region in the TGA graphs for the synthesized geopolymers with different S/L ratios.
Weight Loss, %
RegionMKG-01MKG-02MKG-03
I5.1864.9944.476
II13.99416.16913.026
III19.30521.27917.341
IV19.75021.49017.470
Table 4. The smoke density test results were applied to the geopolymer samples with different S/L ratios.
Sample IDMKG-01MKG-02MKG-03
Optical Density0.00.00.0
Transmittance, %99.199.199.2
Table 5. Thermophysical properties obtained for MKG-01_1 and MKG-01_2 samples from the fitting procedures.
Sample κ
(Wm−1K−1)
α
(×10−6m2s−1)
c
(×106Jm−3K−1)
R2RMSE
(KmW−1)
MKG-01_10.215 ± 0.0020.144 ± 0.0011.492 ± 0.0210.99950.035
MKG-01_20.221 ± 0.0010.151 ± 0.0011.461 ± 0.0180.99960.032
Table 6. Thermophysical properties obtained for MKG-02_1 and MKG-02_2 samples from the fitting procedures.
Sample κ
(Wm−1K−1)
α
(×10−6m2s−1)
c
(×106Jm−3K−1)
R2RMSE
(KmW−1)
MKG-02_10.228 ± 0.0020.143 ± 0.0011.592 ± 0.0240.99940.036
MKG-02_20.230 ± 0.0020.143 ± 0.0011.608 ± 0.0220.99950.033
Table 7. Color parameters of geopolymer samples before irradiation.
Sample IDLabHueCroma
MKG-0179.781.348.7281.238.93
MKG-0289.370.226.2988.256.26
MKG-0384.180.476.8985.926.44
Table 8. Color parameters of geopolymer samples after irradiation.
Sample IDLabHueCroma
MKG-0180.861.669.4680.059.60
MKG-0287.320.485.8385.315.85
MKG-0387.240.675.9583.555.95
Disclaimer/Publisher’s Note: The statements, opinions and data contained in all publications are solely those of the individual author(s) and contributor(s) and not of MDPI and/or the editor(s). MDPI and/or the editor(s) disclaim responsibility for any injury to people or property resulting from any ideas, methods, instructions or products referred to in the content.