
Exploring the Distribution of Low Molecular Weight Compounds in Water-Based Two-Phase Systems with Various Salt Additives


Abstract
:1. Introduction
2. Materials and Methods
2.1. Materials
2.1.1. Polymers
2.1.2. Other Chemicals
2.2. Methods
Partitioning
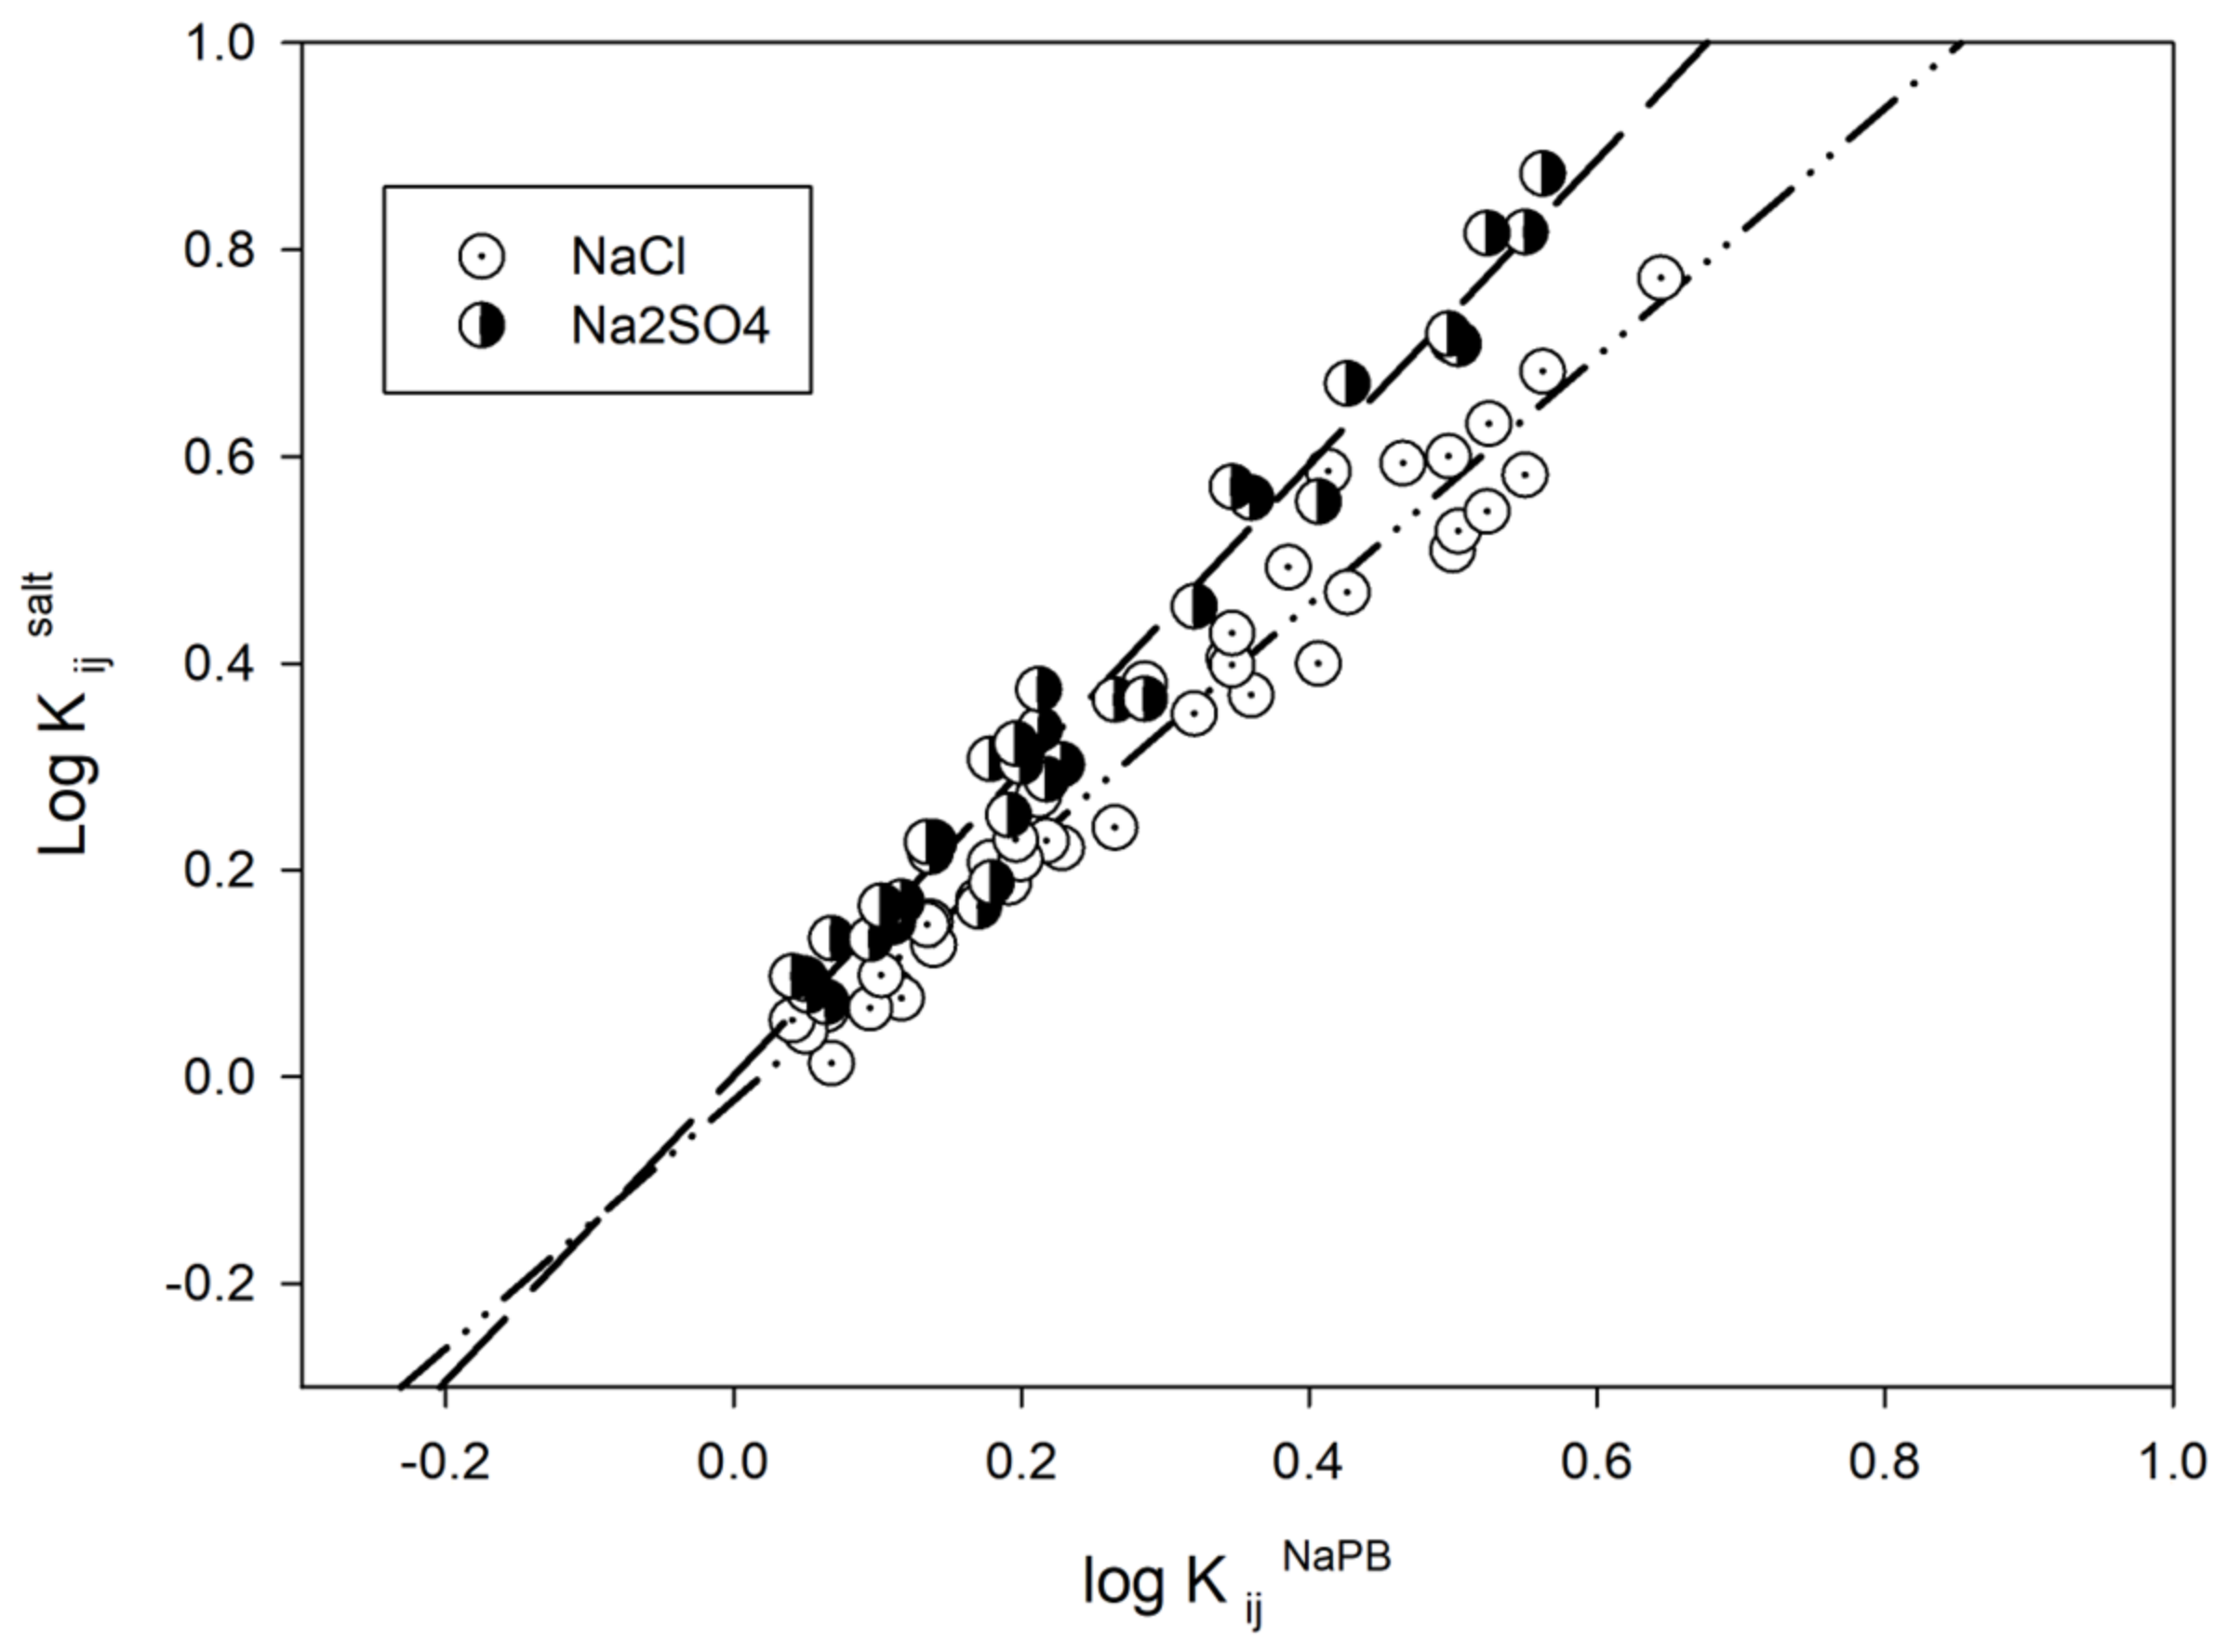
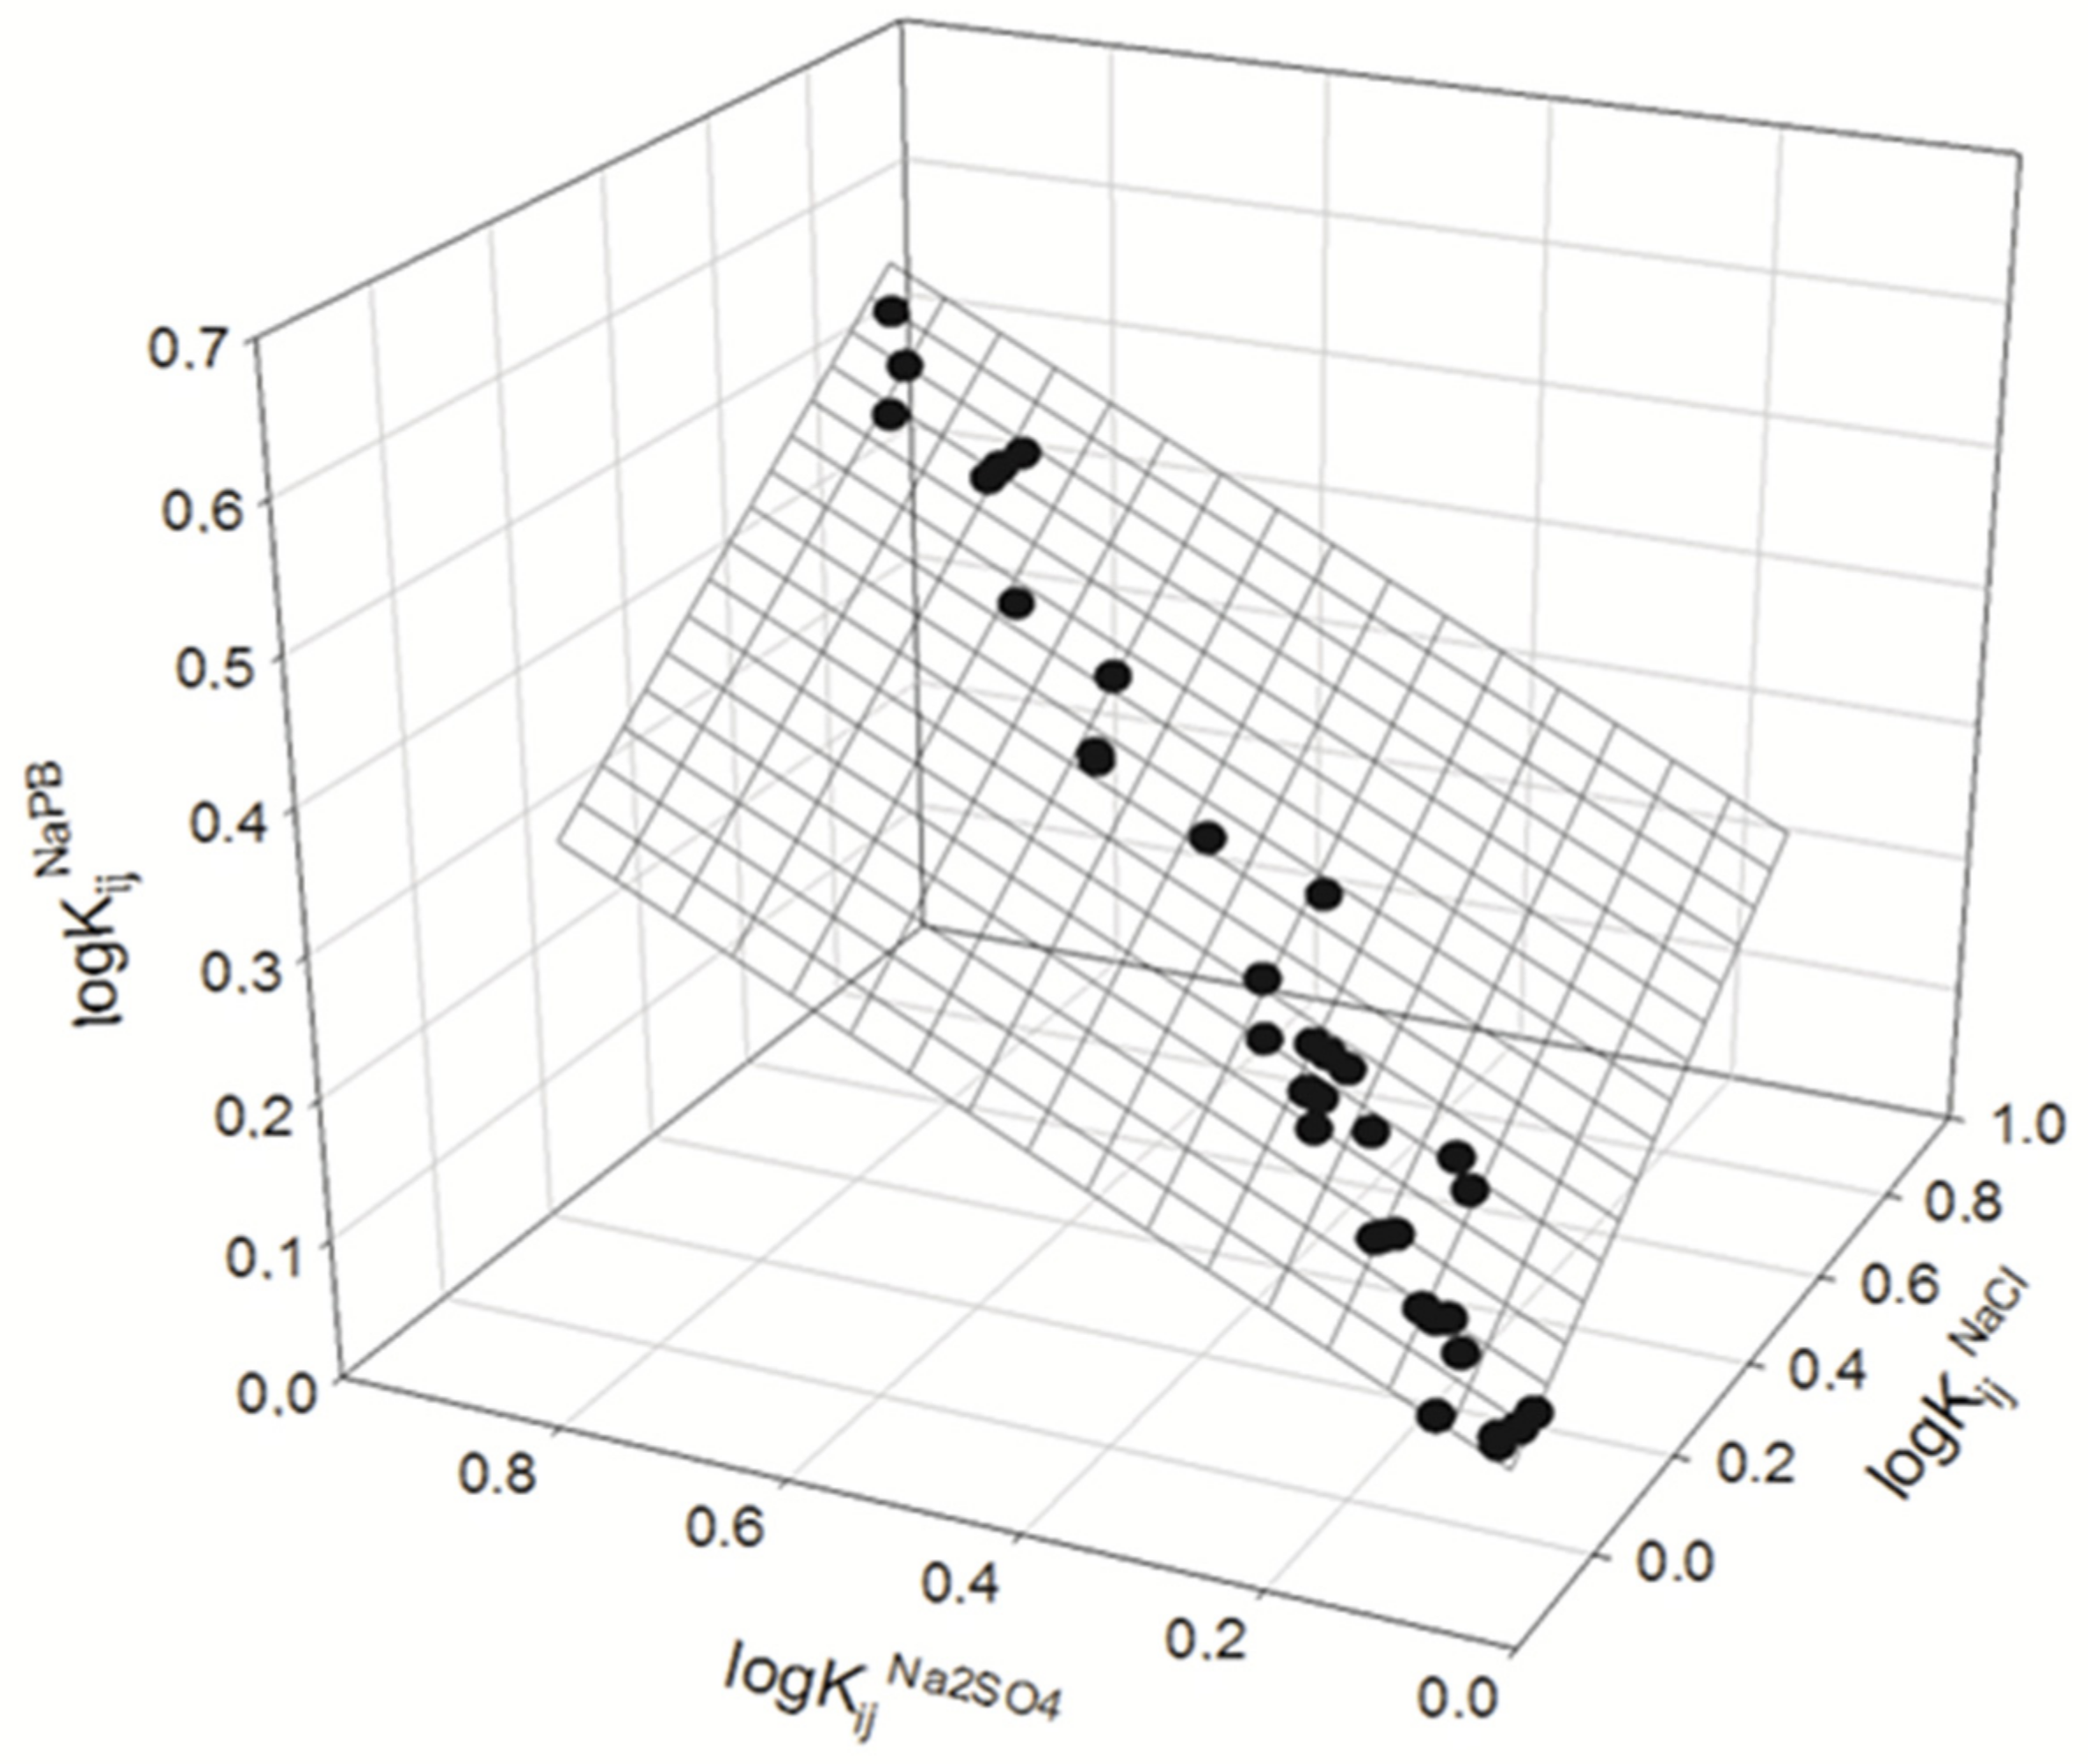
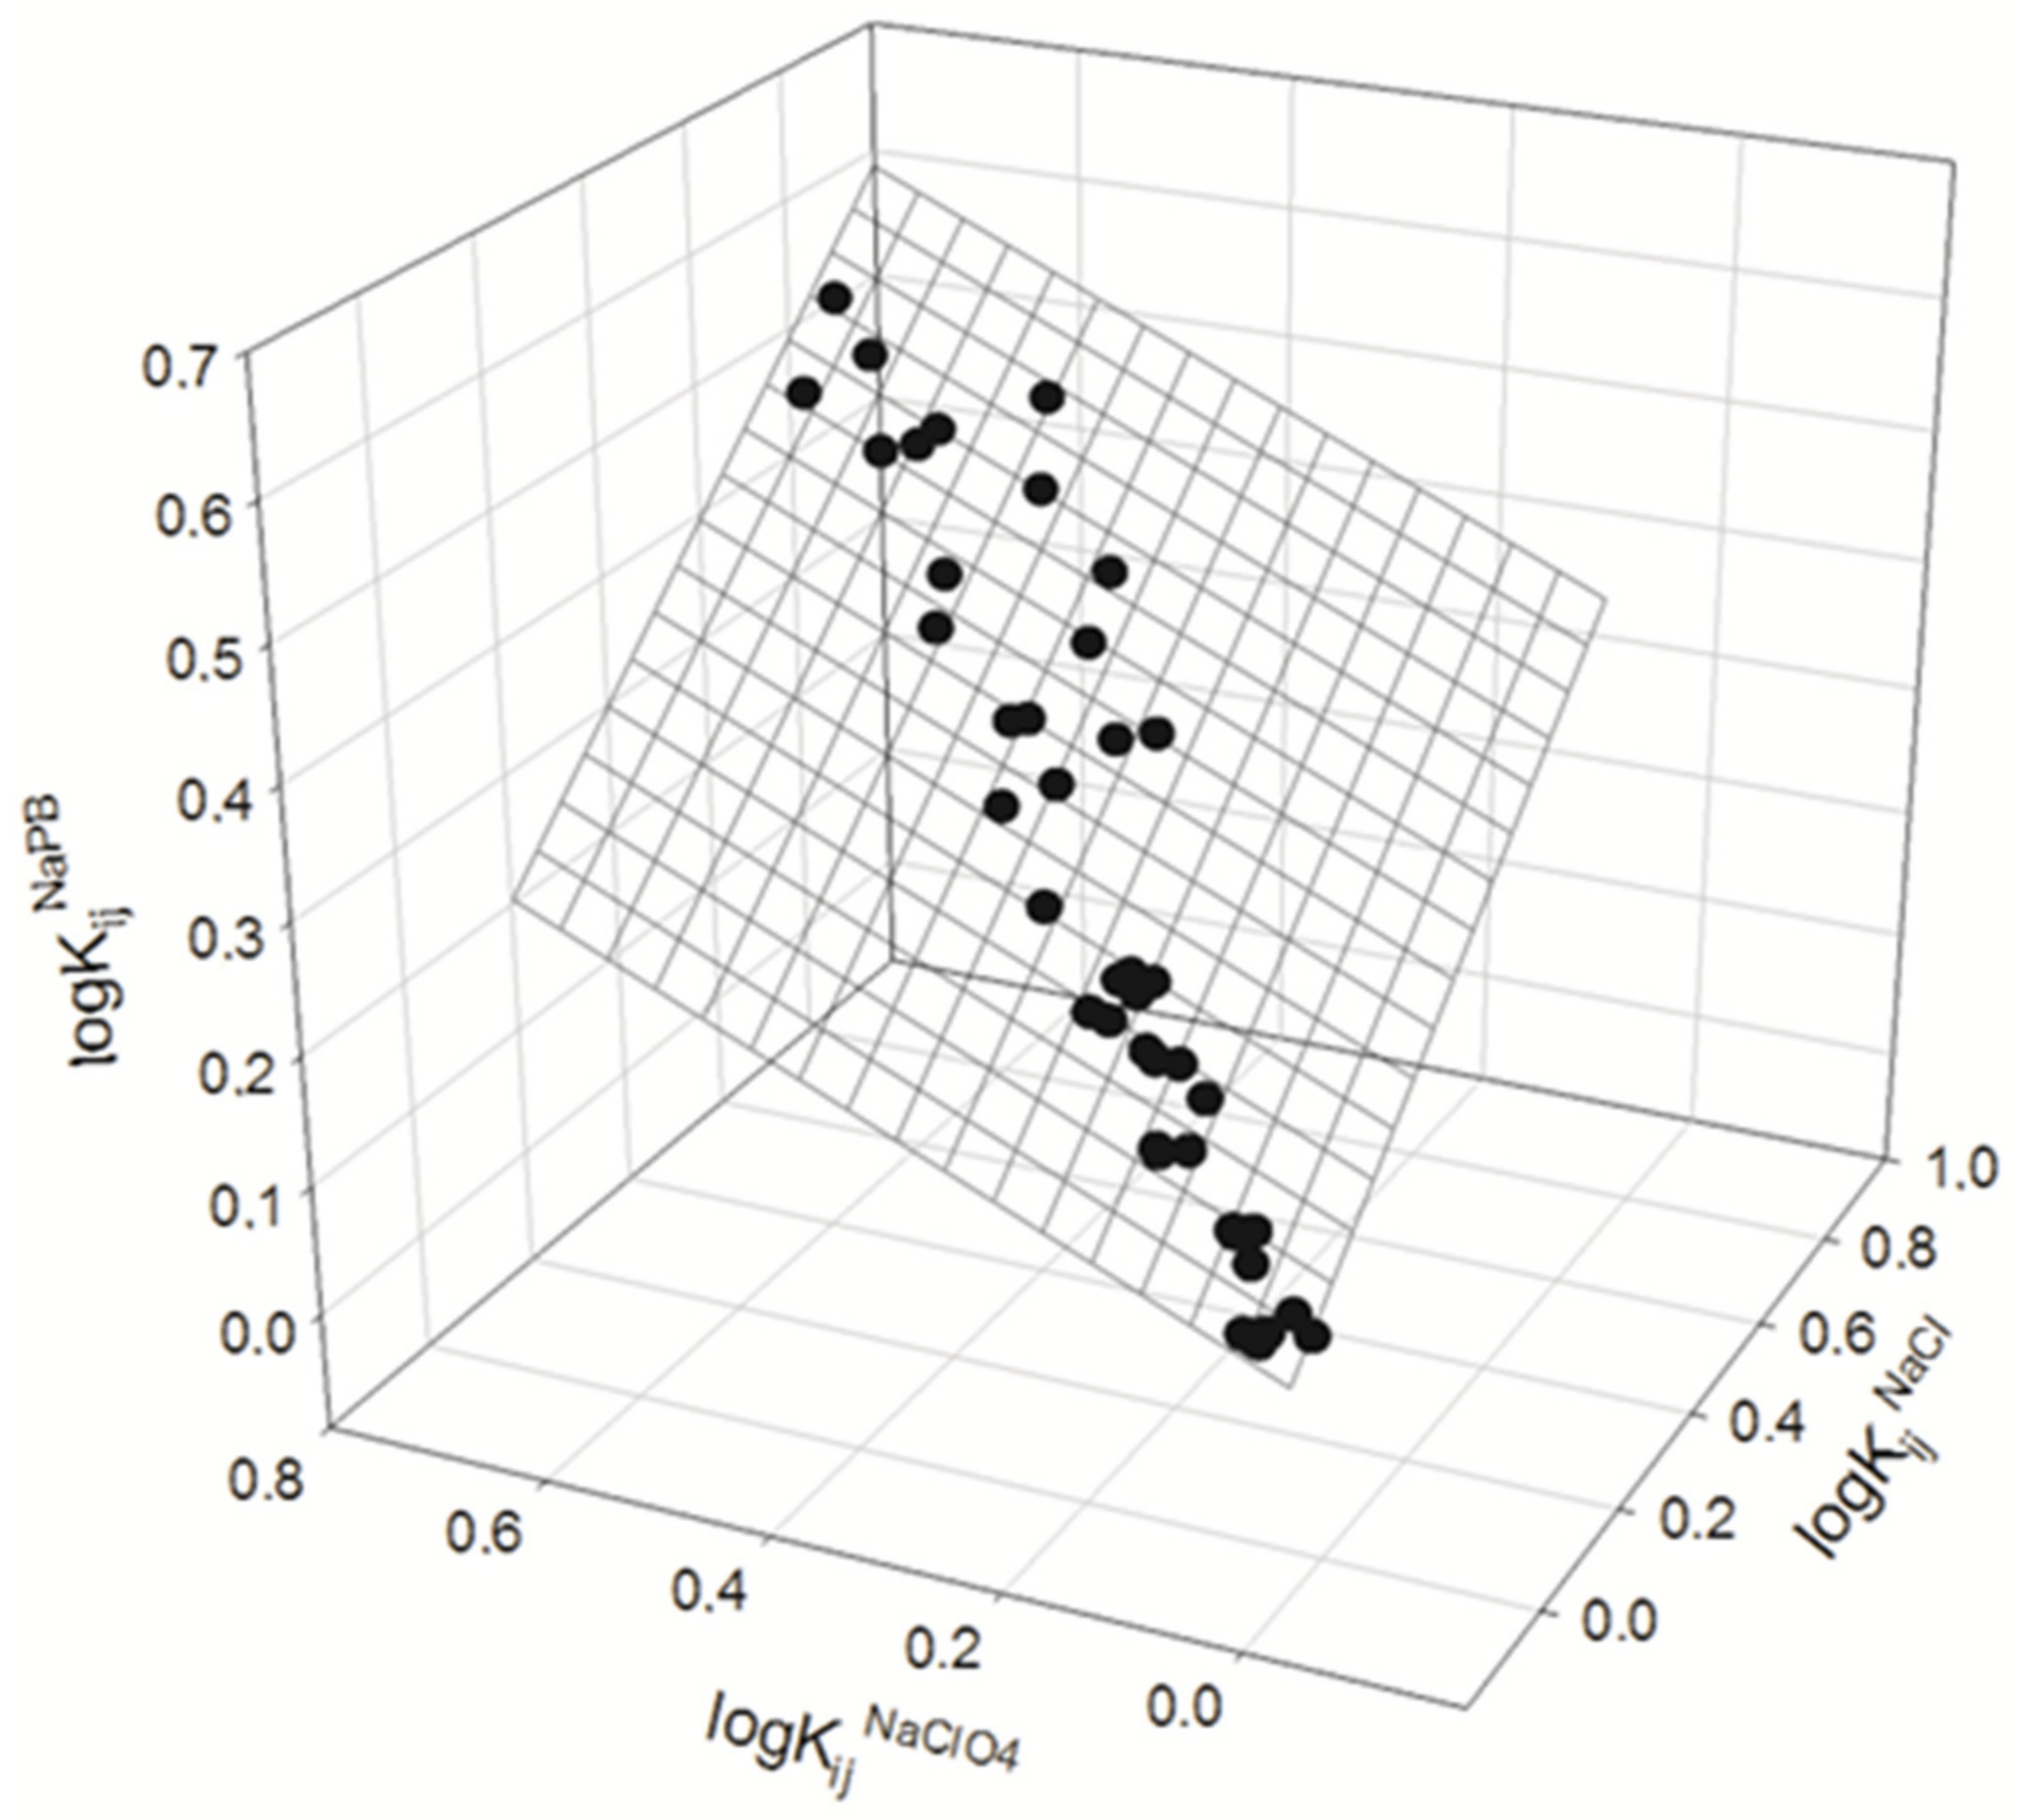
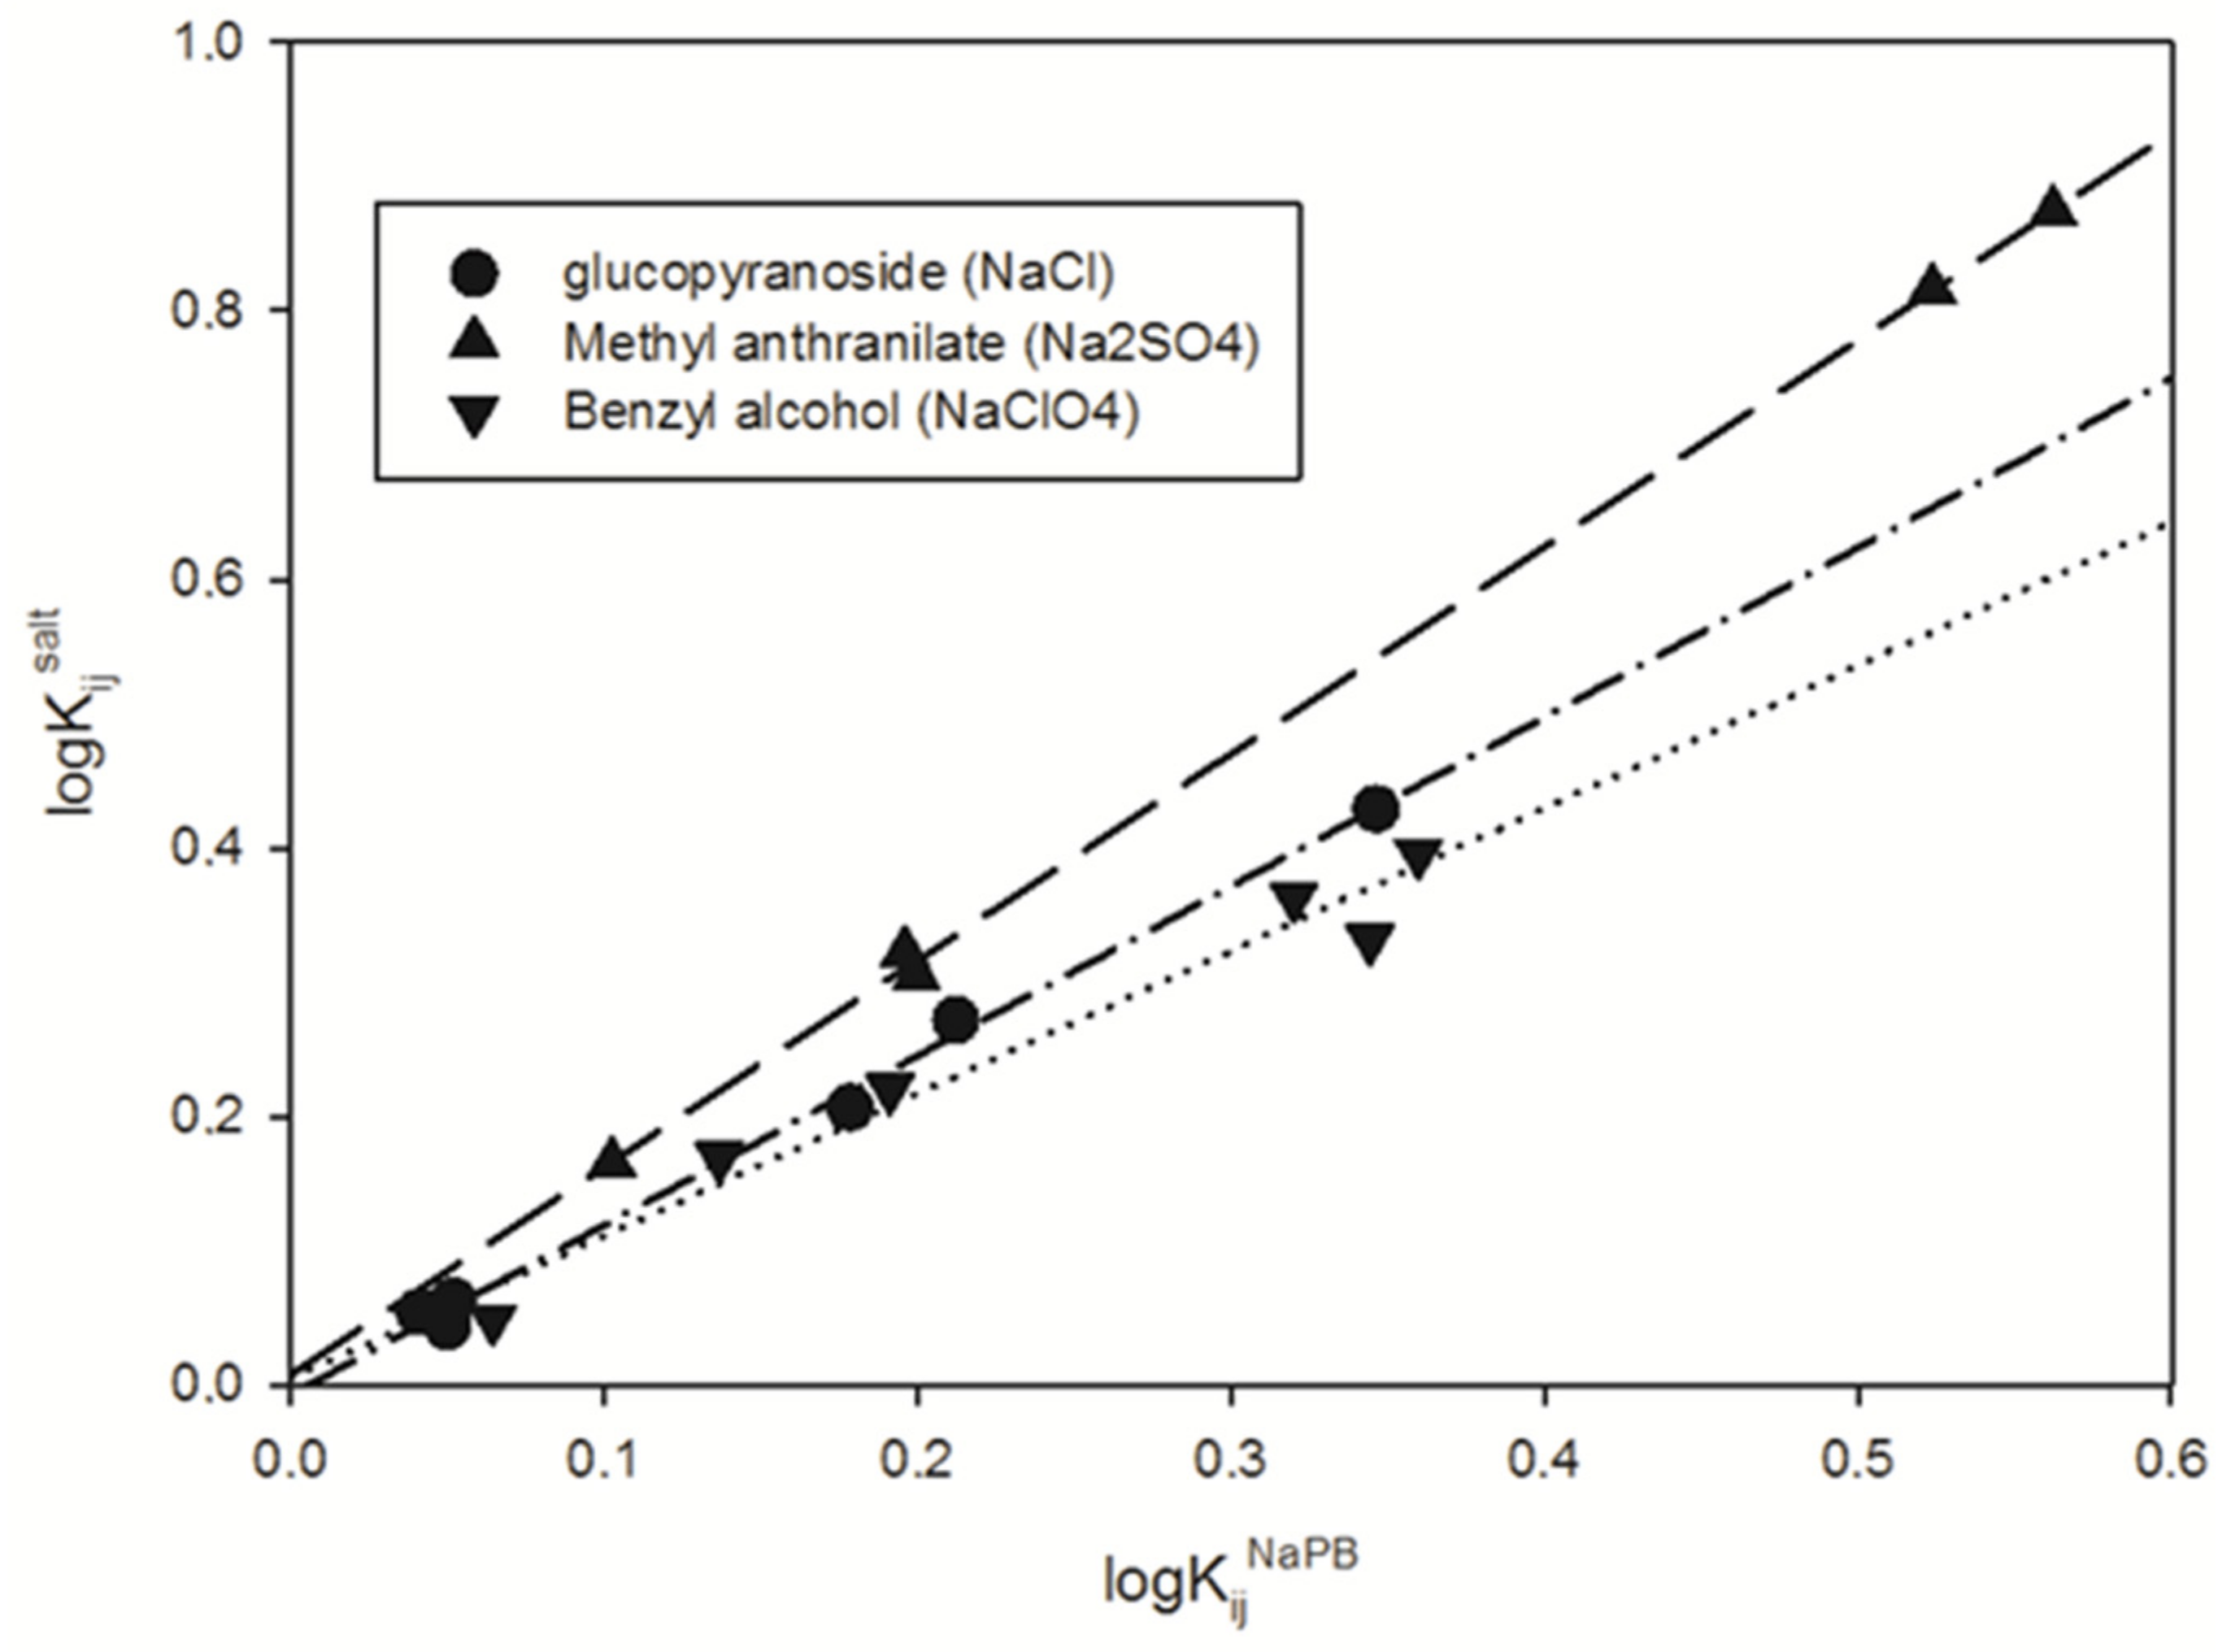
3. Results and Discussion
4. Conclusions
Author Contributions
Funding
Data Availability Statement
Acknowledgments
Conflicts of Interest
References
- Zaslavsky, B.Y. Aqueous Two-Phase Partitioning: Physical Chemistry and Bioanalytical Applications; CRC Press: Boca Raton, FL, USA, 1994. [Google Scholar]
- Titus, A.R.; Herron, P.; Streletzky, K.A.; Madeira, P.P.; Uversky, V.N.; Zaslavsky, B.Y. Effect of trimethylamine-N-oxide on the phase separation of aqueous polyethylene glycol-600-Dextran-75 two-phase systems. Phys. Chem. Chem. Phys. 2024, 26, 10546–10556. [Google Scholar] [CrossRef] [PubMed]
- Titus, A.R.; Madeira, P.P.; Ferreira, L.A.; Chernyak, V.Y.; Uversky, V.N.; Zaslavsky, B.Y. Mechanism of Phase Separation in Aqueous Two-Phase Systems. Int. J. Mol. Sci. 2022, 23, 14366. [Google Scholar] [CrossRef] [PubMed]
- Moody, M.L.; Willauer, H.D.; Griffin, S.T.; Huddleston, J.G.; Rogers, R.D. Solvent Property Characterization of Poly(ethylene glycol)/Dextran Aqueous Biphasic Systems Using the Free Energy of Transfer of a Methylene Group and a Linear Solvation Energy Relationship. Ind. Eng. Chem. Res. 2005, 44, 3749–3760. [Google Scholar] [CrossRef]
- Willauer, H.D.; Huddleston, J.G.; Rogers, R.D. Solvent Properties of Aqueous Biphasic Systems Composed of Polyethylene Glycol and Salt Characterized by the Free Energy of Transfer of a Methylene Group between the Phases and by a Linear Solvation Energy Relationship. Ind. Eng. Chem. Res. 2002, 41, 2591–2601. [Google Scholar] [CrossRef]
- Albertsson, P.A. Partition of Cell Particles and Macromolecules, 3rd ed.; Wiley: New York, NY, USA, 1986. [Google Scholar]
- Walter, H.; Brooks, D.E.; Fisher, D. Partitioning in Aqueous Two-Phase Systems: Theory, Methods, Use, and Applications to Biotechnology; Academic Press: Orlando, FL, USA, 1985. [Google Scholar]
- Rosa, P.A.J.; Azevedo, A.M.; Sommerfeld, S.; Bäcker, W.; Aires-Barros, M.R. Aqueous two-phase extraction as a platform in the biomanufacturing industry: Economical and environmental sustainability. Biotechnol. Adv. 2011, 29, 559–567. [Google Scholar] [CrossRef] [PubMed]
- Andrews, B.A.; Nielsen, S.; Asenjo, J.A. Partitioning and purification of monoclonal antibodies in aqueous two-phase systems. Bioseparation 1996, 6, 303–313. [Google Scholar] [PubMed]
- Rosa, P.A.J.; Azevedo, A.M.; Sommerfeld, S.; Mutter, M.; Aires-Barros, M.R.; Bäcker, W. Application of aqueous two-phase systems to antibody purification: A multi-stage approach. J. Biotechnol. 2009, 139, 306–313. [Google Scholar] [CrossRef] [PubMed]
- Oelmeier, S.A.; Dismer, F.; Hubbuch, J. Application of an aqueous two-phase systems high-throughput screening method to evaluate mAb HCP separation. Biotechnol. Bioeng. 2011, 108, 69–81. [Google Scholar] [CrossRef] [PubMed]
- Rito-Palomares, M. Practical application of aqueous two-phase partition to process development for the recovery of biological products. J. Chromatogr. B Anal. Technol. Biomed. Life Sci. 2004, 807, 3–11. [Google Scholar] [CrossRef] [PubMed]
- Zaslavsky, B.Y.; Uversky, V.N.; Chait, A. Analytical applications of partitioning in aqueous two-phase systems: Exploring protein structural changes and protein–partner interactions in vitro and in vivo by solvent interaction analysis method. Biochim. Biophys. Acta 2016, 1864, 622–644. [Google Scholar] [CrossRef] [PubMed]
- Chait, A.; Zaslavsky, B.Y. Characterization of Molecules. U.S. Patent US-8211714-B2, 3 July 2012. [Google Scholar]
- Zaslavsky, A.; Madeira, P.; Breydo, L.; Uversky, V.N.; Chait, A.; Zaslavsky, B. High throughput characterization of structural differences between closely related proteins in solution. Biochim. Biophys. Acta 2013, 1834, 583–592. [Google Scholar] [CrossRef] [PubMed]
- Ferreira, L.; Madeira, P.P.; Mikheeva, L.; Uversky, V.N.; Zaslavsky, B. Effect of salt additives on protein partition in polyethylene glycol–sodium sulfate aqueous two-phase systems. Biochim. Et Biophys. Acta Proteins Proteom. 2013, 1834, 2859–2866. [Google Scholar] [CrossRef] [PubMed]
- Stovsky, M.; Ponsky, L.; Vourganti, S.; Stuhldreher, P.; Siroky, M.B.; Kipnis, V.; Fedotoff, O.; Mikheeva, L.; Zaslavsky, B.; Chait, A.; et al. Prostate-specific Antigen/Solvent Interaction Analysis: A Preliminary Evaluation of a New Assay Concept for Detecting Prostate Cancer Using Urinary Samples. Urology 2011, 78, 601–605. [Google Scholar] [CrossRef] [PubMed]
- Madeira, P.P.; Reis, C.A.; Rodrigues, A.E.; Mikheeva, L.M.; Chait, A.; Zaslavsky, B.Y. Solvent properties governing protein partitioning in polymer/polymer aqueous two-phase systems. J. Chromatogr. A 2011, 1218, 1379–1384. [Google Scholar] [CrossRef] [PubMed]
- Madeira, P.P.; Reis, C.A.; Rodrigues, A.E.; Mikheeva, L.M.; Zaslavsky, B.Y. Solvent Properties Governing Solute Partitioning in Polymer/Polymer Aqueous Two-Phase Systems: Nonionic Compounds. J. Phys. Chem. B 2010, 114, 457–462. [Google Scholar] [CrossRef] [PubMed]
- Madeira, P.P.; Bessa, A.; Teixeira, M.A.; Álvares-Ribeiro, L.; Aires-Barros, M.R.; Rodrigues, A.E.; Zaslavsky, B.Y. Study of organic compounds–water interactions by partition in aqueous two-phase systems. J. Chromatogr. A 2013, 1322, 97–104. [Google Scholar] [CrossRef] [PubMed]
- Ferreira, L.A.; Chervenak, A.; Placko, S.; Kestranek, A.; Madeira, P.P.; Zaslavsky, B.Y. Responses of polar organic compounds to different ionic environments in aqueous media are interrelated. Phys. Chem. Chem. Phys. 2014, 16, 23347–23354. [Google Scholar] [CrossRef] [PubMed]
- Ferreira, L.A.; Teixeira, J.A.; Mikheeva, L.M.; Chait, A.; Zaslavsky, B.Y. Effect of salt additives on partition of nonionic solutes in aqueous PEG–sodium sulfate two-phase system. J. Chromatogr. A 2011, 1218, 5031–5039. [Google Scholar] [CrossRef] [PubMed]
- Lo Nostro, P.; Ninham, B.W.; Milani, S.; Fratoni, L.; Baglioni, P. Specific anion effects on the optical rotation of glucoseand serine. Biopolymers 2006, 81, 136–148. [Google Scholar] [CrossRef] [PubMed]
- Rossi, S.; Lo Nostro, P.; Lagi, M.; Ninham, B.W.; Baglioni, P. Specific Anion Effects on the Optical Rotation of α-Amino Acids. J. Phys. Chem. B 2007, 111, 10510–10519. [Google Scholar] [CrossRef] [PubMed]

| ATPS | Polymer 1 | Polymer 2 | Total Composition | |
|---|---|---|---|---|
| Polymer 1 | Polymer 2 | |||
| S1 | Dextran | Ficoll | 12.9 | 18.1 |
| S2 | Dextran | PEG4000 | 13.67 | 6.15 |
| S3 | Dextran | Ucon | 12.39 | 10.08 |
| S4 | Ficoll | PEG8000 | 24.67 | 10.42 |
| S5 | Ficoll | Ucon | 19.12 | 15.47 |
| S6 | Peg8000 | Ucon | 15.00 | 29.97 |
| Distribution Coefficients of Studied Compounds | |||||||||||||
|---|---|---|---|---|---|---|---|---|---|---|---|---|---|
| NaPB 0.01 M, pH 7.4 | NaCl 0.15 M + NaPB 0.01 M, pH 7.4 | ||||||||||||
| ATPS | ATPS | ||||||||||||
| Compounds | S1 | S2 | S3 | S4 | S5 | S6 | Compounds | S1 | S2 | S3 | S4 | S5 | S6 |
| Phenol | 1.29 ± 0.02 | 1.690 ± 0.006 | 3.16 ± 0.03 | 1.84 ± 0.01 | 3.55 ± 0.05 | 3.35 ± 0.06 | Phenol b | 1.21 ± 0.03 | 1.663 ± 0.003 | 3.23± 0.02 | 1.74 ± 0.01 | 3.82 ± 0.01 | 4.28 ± 0.05 |
| Benzyl alcohol | 1.16 ± 0.01 | 1.370 ± 0.006 | 2.09 ±0.01 | 1.553 ± 0.004 | 2.29 ± 0.02 | 2.21 ± 0.01 | Benzyl alcohol | 1.16 ± 0.01 | 1.41 ± 0.01 | 2.245 ± 0.006 | 1.54 ± 0.01 | 2.34 ± 0.02 | 2.54 ± 0.03 |
| 2-Phenylethanol | 1.17 ± 0.02 | 1.48 ± 0.04 | 1.93 ± 0.08 | 1.51 ± 0.03 | 2.22 ± 0.08 | 2.43 ± 0.04 | 2-Phenylethanol | 1.03 ± 0.03 | 1.48 ± 0.02 | 2.4 ± 0.1 | 1.60 ± 0.01 | 2.50 ± 0.06 | 3.11 ± 0.07 |
| Vanillin | 1.308 ± 0.008 | 1.65 ± 0.01 | 3.19 ± 0.02 | 1.632 ± 0.008 | 3.14 ± 0.02 | 2.59 ± 0.02 | Vanillin b | 1.19 ± 0.01 | 1.69 ± 0.01 | 3.37 ± 0.04 | 1.90 ± 0.02 | 3.98 ± 0.05 | 3.85 ± 0.04 |
| 4-nitrophenyl-α-D-glucopyranoside | 1.127 ± 0.003 | 1.122 ± 0.004 | 1.508 ± 0.006 | 1.099 ± 0.003 | 1.63 ± 0.01 | 2.22 ± 0.01 | 4-nitrophenyl-α-D-glucopyranoside | 1.155 ± 0.002 | 1.106 ± 0.005 | 1.61 ± 0.01 | 1.133 ± 0.004 | 1.87 ± 0.01 | 2.685 ± 0.004 |
| Coumarin | 1.244 ± 0.002 | 1.378 ± 0.004 | 2.55 ± 0.01 | 1.363 ± 0.004 | 2.67 ± 0.02 | 2.92 ± 0.02 | Coumarin b | 1.164 ± 0.007 | 1.34 ± 0.01 | 2.51 ± 0.05 | 1.402 ± 0.004 | 2.94 ± 0.05 | 3.92 ± 0.02 |
| Methyl anthranilate | 1.266 ± 0.004 | 1.583 ± 0.004 | 3.34 ± 0.02 | 1.57 ± 0.01 | 3.65 ± 0.01 | 4.41 ± 0.03 | Methyl anthranilate b | 1.253 ± 0.006 | 1.623 ± 0.008 | 3.52 ± 0.02 | 1.694 ± 0.007 | 4.81 ± 0.08 | 5.92 ± 0.07 |
| Na2SO4 0.1 M + NaPB 0.01 M, pH 7.4 | NaClO4 0.15 M + NaPB 0.01 M, pH 7.4 | ||||||||||||
| ATPS | ATPS | ||||||||||||
| Compounds | S1 | S2 | S3 | S4 | S5 | S6 a | Compounds | S1 | S2 | S3 | S4 | S5 | S6 |
| Phenol | 1.41 ± 0.01 | 2.004 ± 0.006 | 5.14 ± 0.05 | 2.316 ± 0.006 | 6.56 ± 0.04 | - | Phenol | 1.282 ± 0.002 | 1.81 ± 0.01 | 3.84 ± 0.02 | 2.14 ± 0.01 | 4.21 ± 0.02 | 3.04 ± 0.02 |
| Benzyl alcohol | 1.18 ± 0.02 | 1.649 ± 0.008 | 2.85 ± 0.03 | 1.79 ± 0.02 | 3.63 ± 0.02 | - | Benzyl alcohol | 1.121 ± 0.004 | 1.48 ± 0.02 | 2.31 ± 0.01 | 1.664 ± 0.005 | 2.49 ± 0.01 | 2.15 ± 0.01 |
| 2-Phenylethanol | 1.36 ± 0.02 | 1.46 ± 0.07 | 2.32 ± 0.06 | 1.54 ± 0.04 | 3.72 ± 0.08 | - | 2-Phenylethanol | 1.13 ± 0.04 | 1.46 ± 0.02 | 2.66 ± 0.07 | 1.66 ± 0.04 | 2.65 ± 0.07 | 2.46 ± 0.05 |
| Vanillin | 1.475 ± 0.004 | 1.94 ± 0.01 | 5.11 ± 0.03 | 2.168 ± 0.005 | 5.23 ± 0.05 | - | Vanillin | 1.223 ± 0.008 | 1.758 ± 0.008 | 3.62 ± 0.02 | 1.862 ± 0.006 | 3.72 ± 0.04 | 2.559 ± 0.006 |
| 4-nitrophenyl-α-D-glucopyranoside | 1.21 ± 0.02 | 1.242 ± 0.008 | 2.03 ± 0.01 | 1.25 ± 0.01 | 2.37 ± 0.02 | - | 4-nitrophenyl-α-D-glucopyranoside | 1.079 ± 0.005 | 1.214 ± 0.006 | 1.585 ± 0.006 | 1.187 ± 0.003 | 1.771 ± 0.007 | 2.02 ± 0.01 |
| Coumarin | 1.358 ± 0.005 | 1.684 ± 0.006 | 3.60 ± 0.02 | 1.686 ± 0.008 | 4.679 ± 0.009 | - | Coumarin | 1.219 ± 0.005 | 1.54 ± 0.01 | 3.09 ± 0.02 | 1.573 ± 0.004 | 3.24 ± 0.02 | 2.977 ± 0.009 |
| Methyl anthranilate | 1.463 ± 0.005 | 2.015 ± 0.003 | 6.54 ± 0.02 | 2.10 ± 0.02 | 7.47 ± 0.04 | - | Methyl anthranilate | 1.294 ± 0.008 | 1.828 ± 0.004 | 4.69 ± 0.02 | 1.935 ± 0.004 | 5.02 ± 0.01 | 4.25 ± 0.04 |
| Solute | ai | bi | ai | bi | ai | bi |
|---|---|---|---|---|---|---|
| NaCl | Na2SO4 | NaClO4 | ||||
| Phenol | −0.06±0.04 | 1.20±0.09 | −0.03±0.02 | 1.51±0.04 | 0.02±0.05 | 1.1±0.1 |
| Benzyl alcohol | −0.01±0.02 | 1.12±0.08 | −0.02±0.03 | 1.6±0.1 | 0.00±0.03 | 1.1±0.1 |
| 2-Phenylethanol | −0.07±0.03 | 1.5±0.1 | −0.05±0.08 | 1.6±0.4 | −0.01±0.06 | 1.2±0.2 |
| Vanillin | −0.03±0.07 | 1.3±0.2 | 0.01±0.02 | 1.42±0.07 | −0.01±0.04 | 1.1±0.1 |
| 4-nitrophenyl-α-D-glucopyranoside | −0.01±0.01 | 1.26±0.04 | 0.01±0.01 | 1.69±0.09 | 0.03±0.02 | 0.9±0.1 |
| Coumarin | −0.04±0.04 | 1.2±0.1 | 0.02±0.03 | 1.4±0.1 | 0.03±0.03 | 1.1±0.1 |
| Methyl anthranilate | −0.02±0.03 | 1.21±0.07 | 0.01±0.01 | 1.54±0.02 | 0.05±0.06 | 1.1±0.1 |
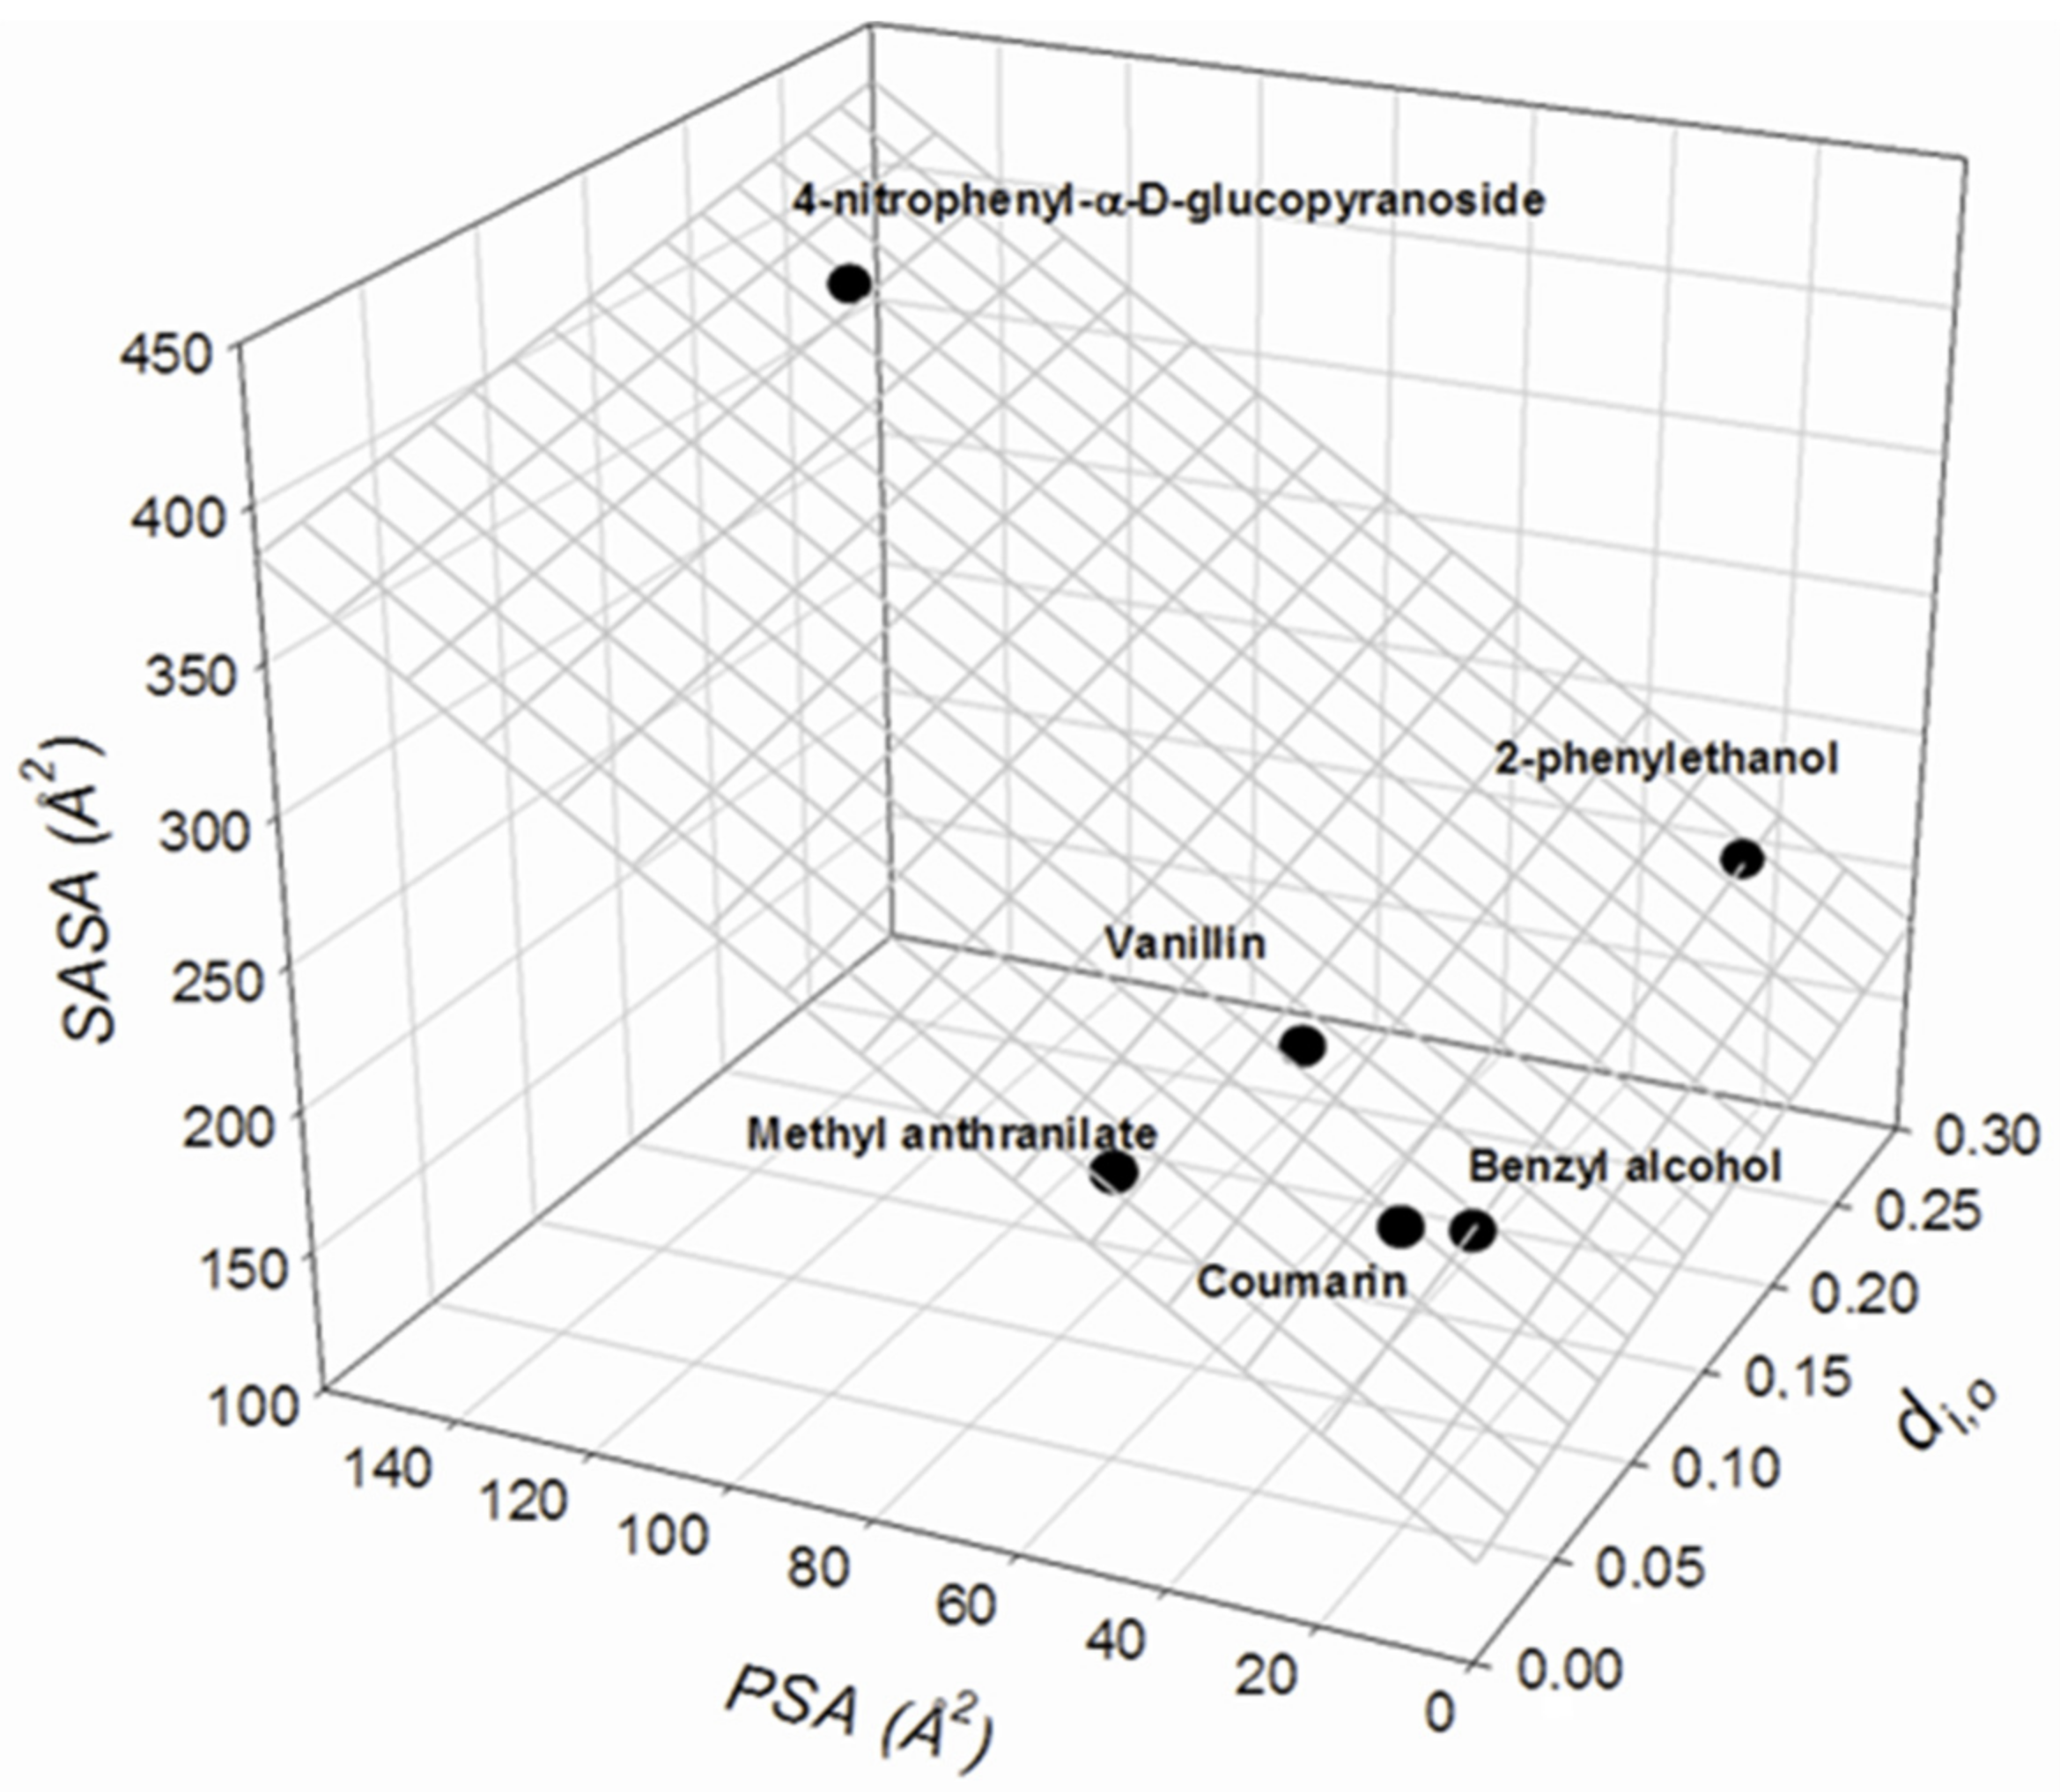
| Solute | di,0 | PSA | SASA | MP | MR |
|---|---|---|---|---|---|
| Benzyl alcohol | 0.089 | 20.23 | 177.93 | 12.79 | 32.874 |
| 2-Phenylethanol | 0.273 | 20.23 | 208.55 | 14.56 | 37.629 |
| Vanillin | 0.102 | 46.53 | 220.74 | 15.36 | 41.086 |
| 4-nitrophenyl-α-D-glucopyranoside | 0.223 | 142.52 | 390.32 | 26.65 | 66.504 |
| Coumarin | 0.073 | 26.3 | 186.18 | 15.7 | 41.549 |
| Methyl anthranilate | 0.022 | 52.32 | 222.14 | 15.89 | 42.784 |
Disclaimer/Publisher’s Note: The statements, opinions and data contained in all publications are solely those of the individual author(s) and contributor(s) and not of MDPI and/or the editor(s). MDPI and/or the editor(s) disclaim responsibility for any injury to people or property resulting from any ideas, methods, instructions or products referred to in the content. |
© 2024 by the authors. Licensee MDPI, Basel, Switzerland. This article is an open access article distributed under the terms and conditions of the Creative Commons Attribution (CC BY) license (https://creativecommons.org/licenses/by/4.0/).
Share and Cite
Costa, M.; Madeira, P.P.; Uversky, V.N.; Zaslavsky, B.Y. Exploring the Distribution of Low Molecular Weight Compounds in Water-Based Two-Phase Systems with Various Salt Additives. Physchem 2024, 4, 334-343. https://doi.org/10.3390/physchem4030023
Costa M, Madeira PP, Uversky VN, Zaslavsky BY. Exploring the Distribution of Low Molecular Weight Compounds in Water-Based Two-Phase Systems with Various Salt Additives. Physchem. 2024; 4(3):334-343. https://doi.org/10.3390/physchem4030023
Chicago/Turabian StyleCosta, Margarida, Pedro P. Madeira, Vladimir N. Uversky, and Boris Y. Zaslavsky. 2024. "Exploring the Distribution of Low Molecular Weight Compounds in Water-Based Two-Phase Systems with Various Salt Additives" Physchem 4, no. 3: 334-343. https://doi.org/10.3390/physchem4030023