
Influence of the Structure of 3D Woven Fabrics on Radiation Heat Resistance and Thermophysiology Properties


Abstract
:
1. Introduction
2. Materials and Methods
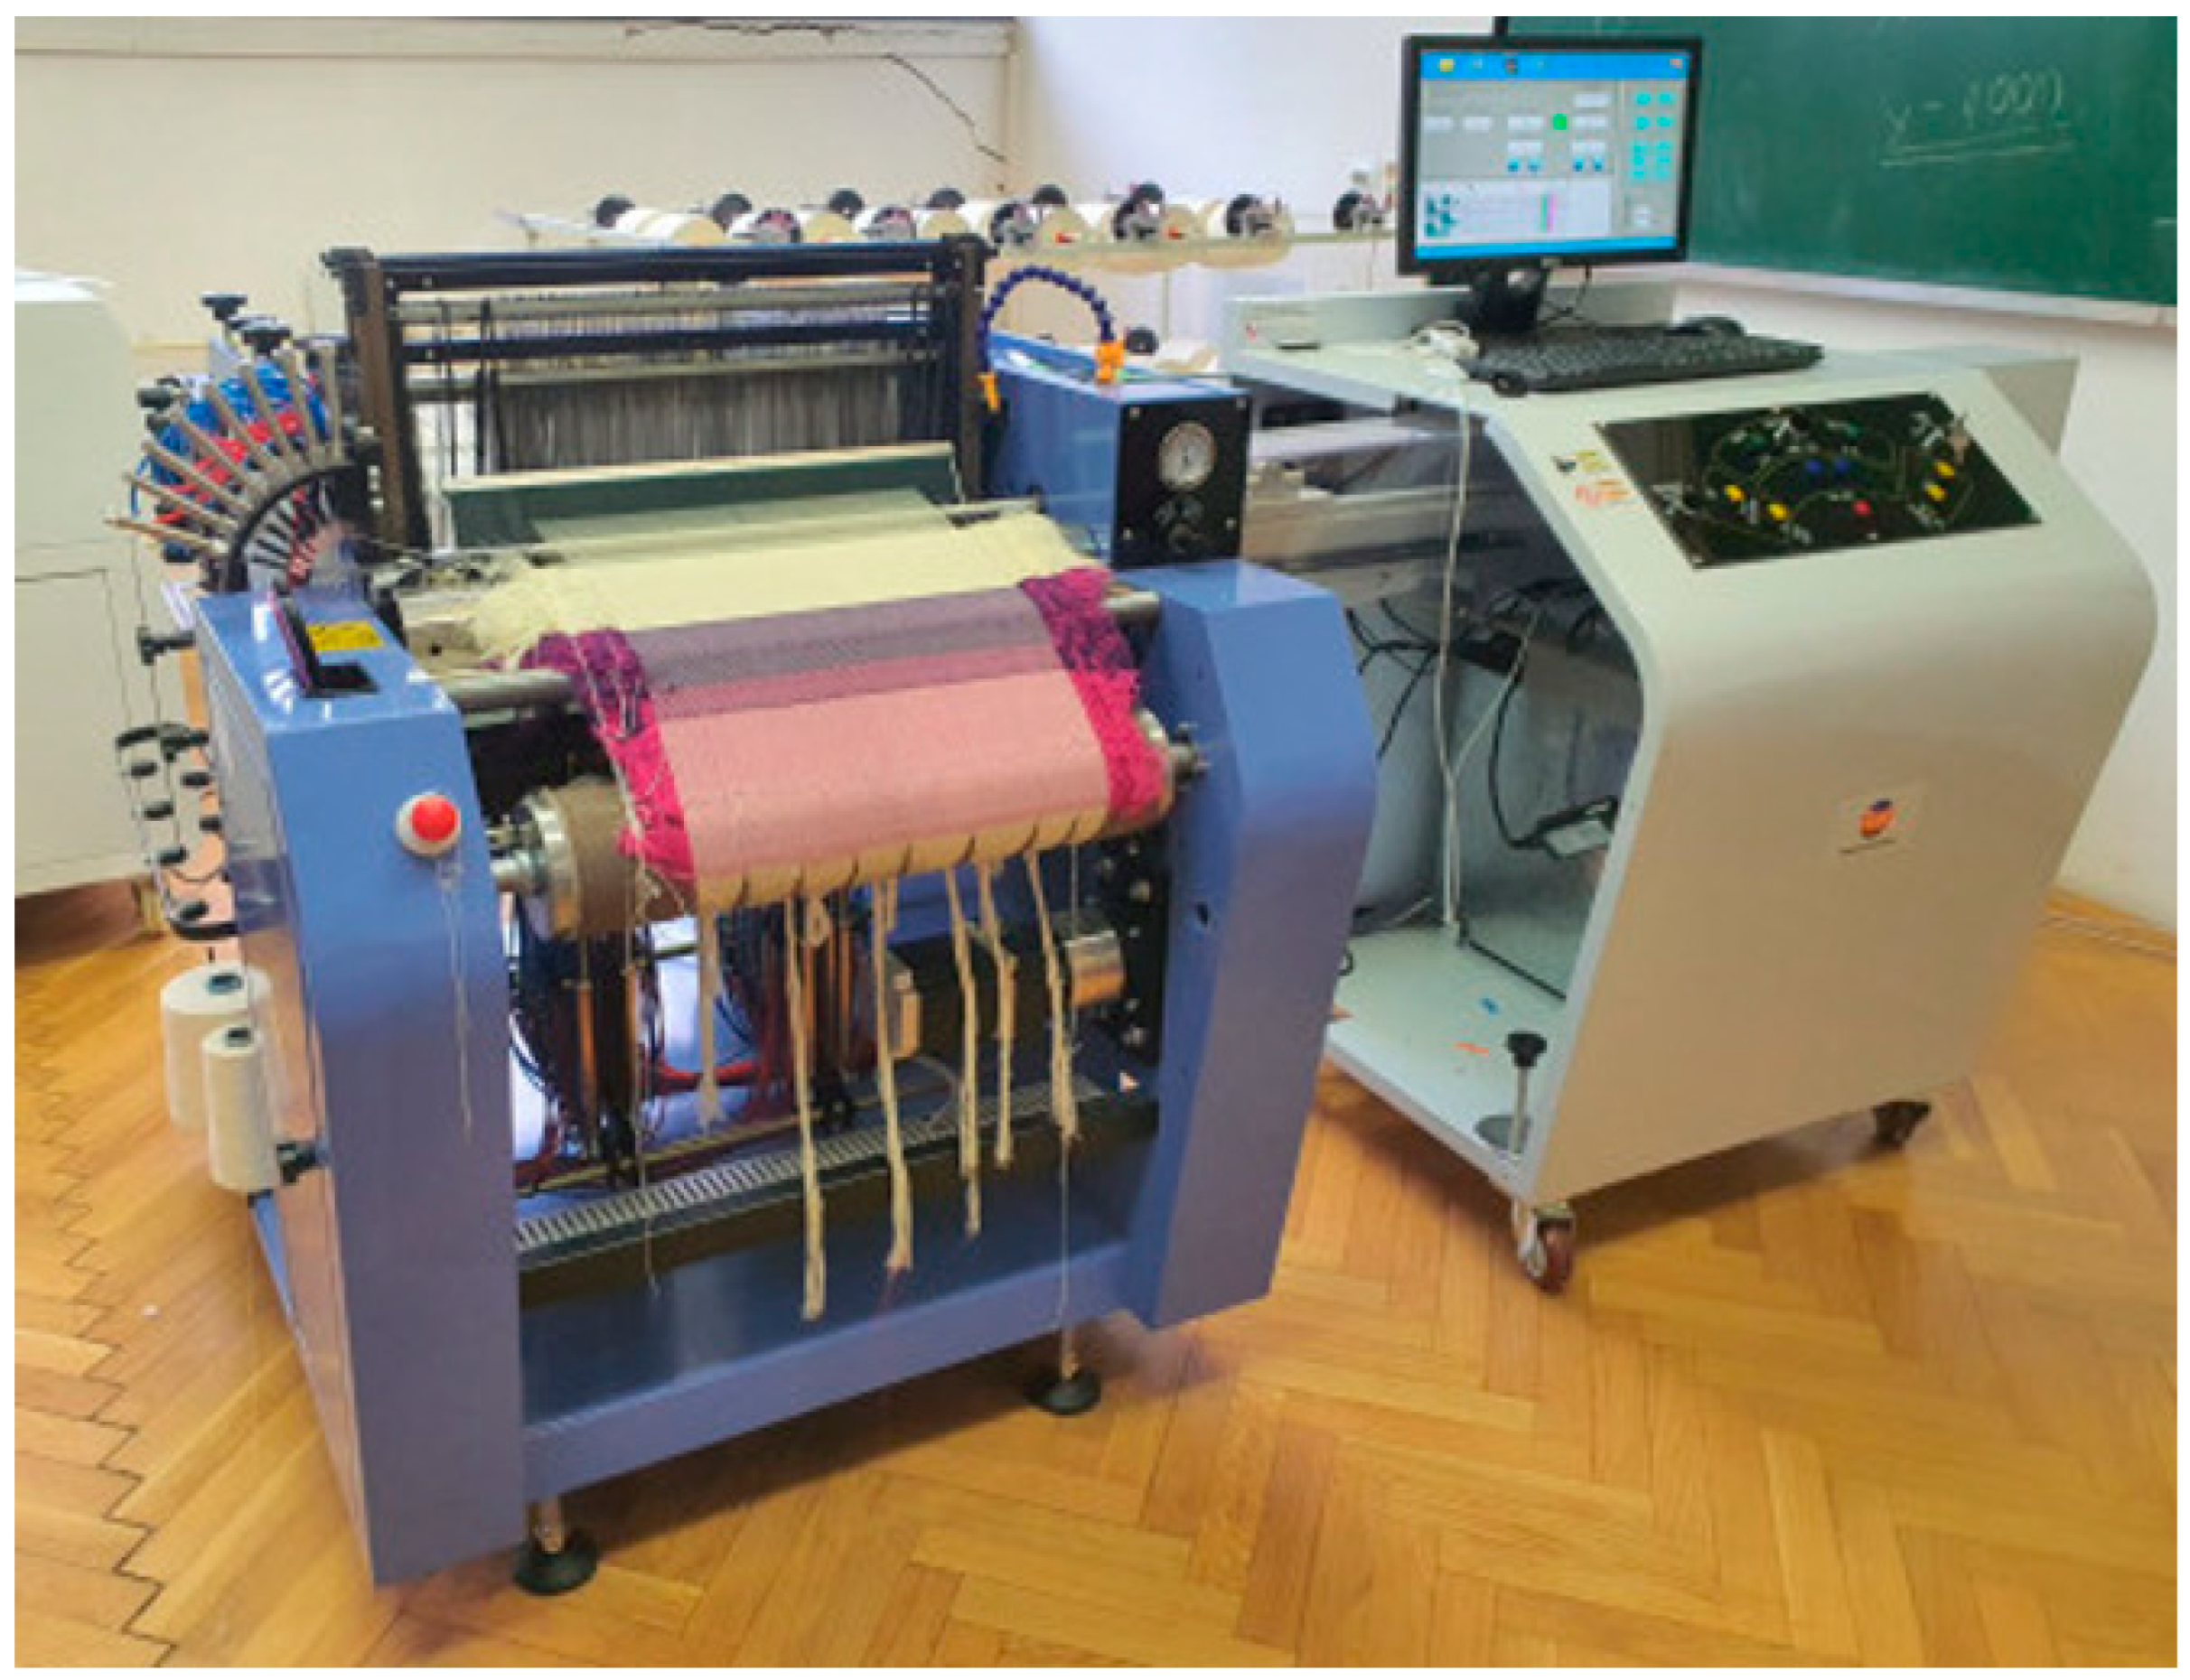
2.1. Laboratory Weaving Machine—Fanyuan Instrument, Model DW598, China
- Weft entry with one rigid weft bar.
- Automatic control with the CAD/CAM weaving system.
- Weft pinning device with the ability to adjust the pinning force.
- Maximum base width: 50 cm.
- Number of wefts per minute: 30–60.
- Maximum number of sheets: 20.
- Automatic, electronic weft selector.
- Number of jobs for bobbins for weft: 8.
- Device for releasing the warp.
- Automatic regulation of warp tension.
- Device for pulling fabric with the ability to regulate the weft density.
- Computer and specialized software for sample design.
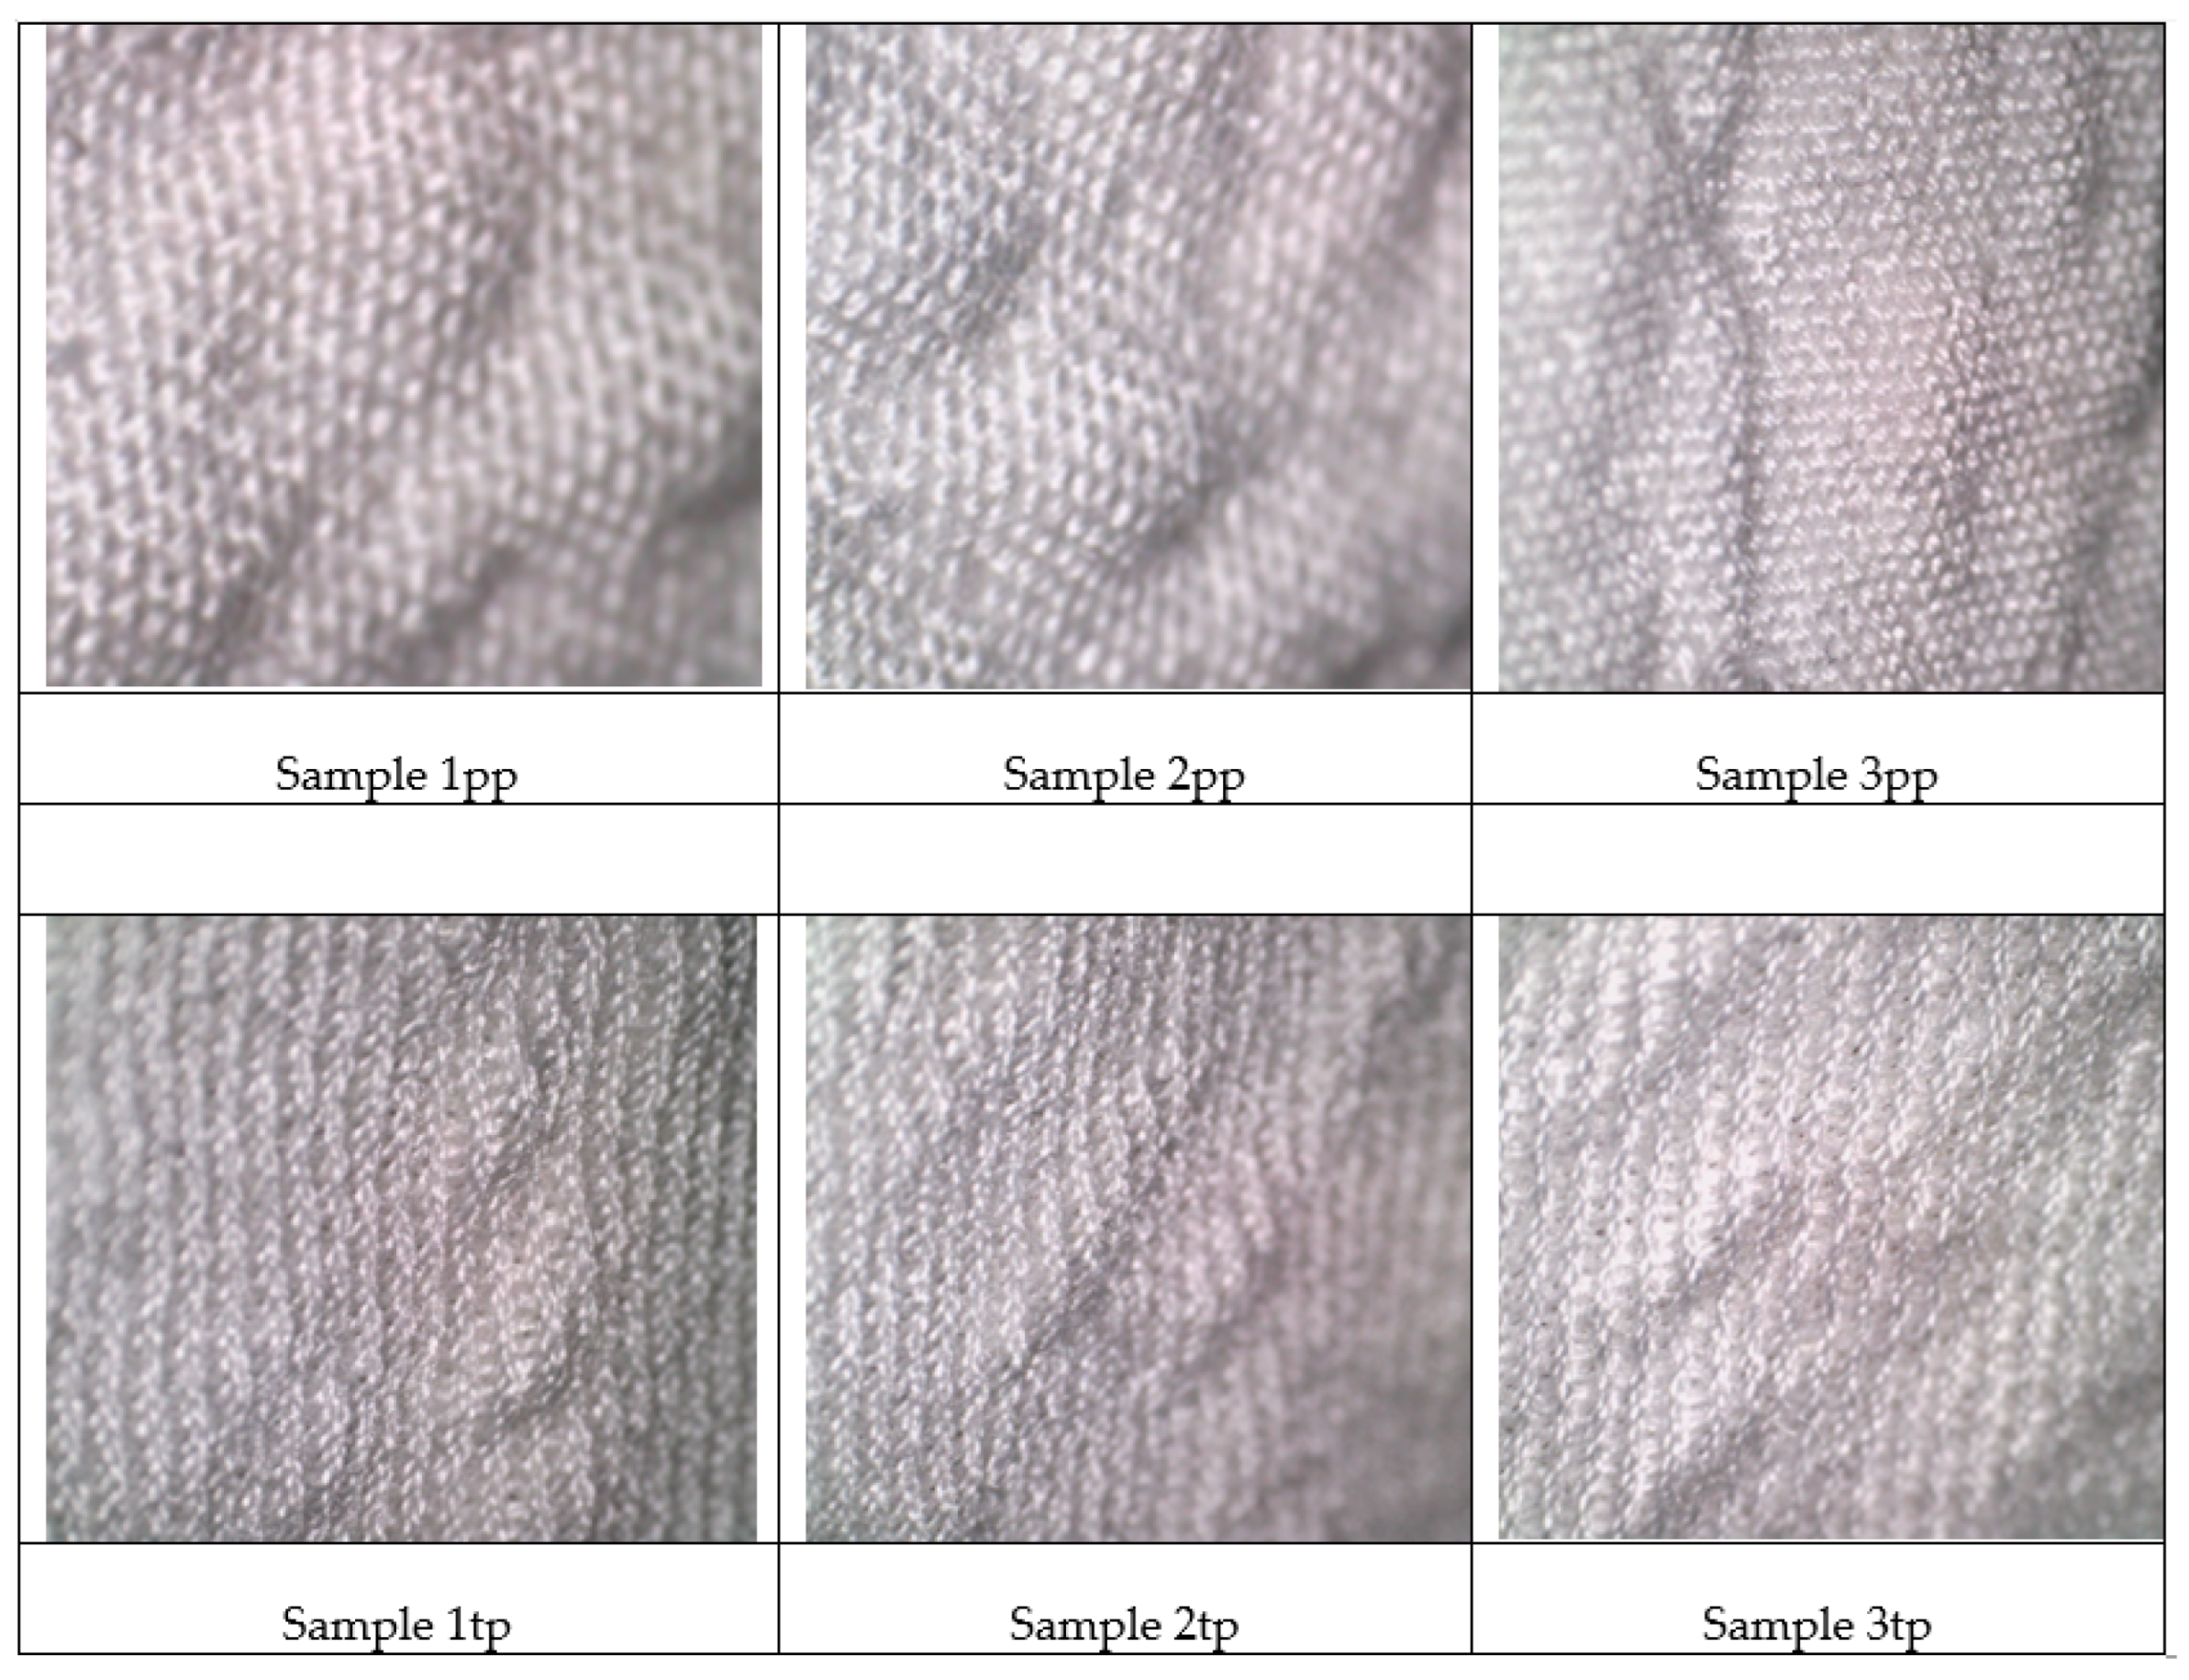
2.2. Samples of 3D Woven Fabrics
2.3. Methods
2.3.1. Resistance to Radiant Heat According to the Method EN ISO 6942:2022 [21]
- Mbp = the mass of the copper plate, which is equal to 0.036 kg.
- Cp = the specific heat of copper, which is 0.385 kJ/kg°C.
- A = the area of the copper plate, which is equal to 0.002515 m2.
- t24 and t12 = the time required for the temperature to rise from 12 °C or 24 °C.
- QC = the density of the transmitted heat flow through the sample to the calorimeter in kW/m2.
- Q0 = the given heat density (radiation source per calorimeter) in kW/m2.
- TFQ0 = heat transfer factor.
2.3.2. Measurement of Thermal and Water-Vapor Resistance EN ISO 11092:2014 [23]
- Rct = thermal resistance of the fabric, m2·K/W.
- Ret = water vapor resistance, m2·Pa/W;
- Tm = temperature of the metal plate, K;
- Ta = temperature of the test area, K;
- Pm = pressure of saturated water vapor when the temperature of the metal plate is Tm, Pa;
- Pa = water vapor pressure when the temperature of the test chamber is Ta, Pa;
- H = heating power of the metal plate, W;
- S = surface of the metal plate, m2;
- ΔHc = heating power correction in thermal resistance testing;
- ΔHe = correction of heating power when testing resistance to water vapor.
3. Results
3.1. Test Results According to the Method EN ISO 6942:2022 [21]
3.2. Test Results According to the Method EN ISO 11092:2014 [23]
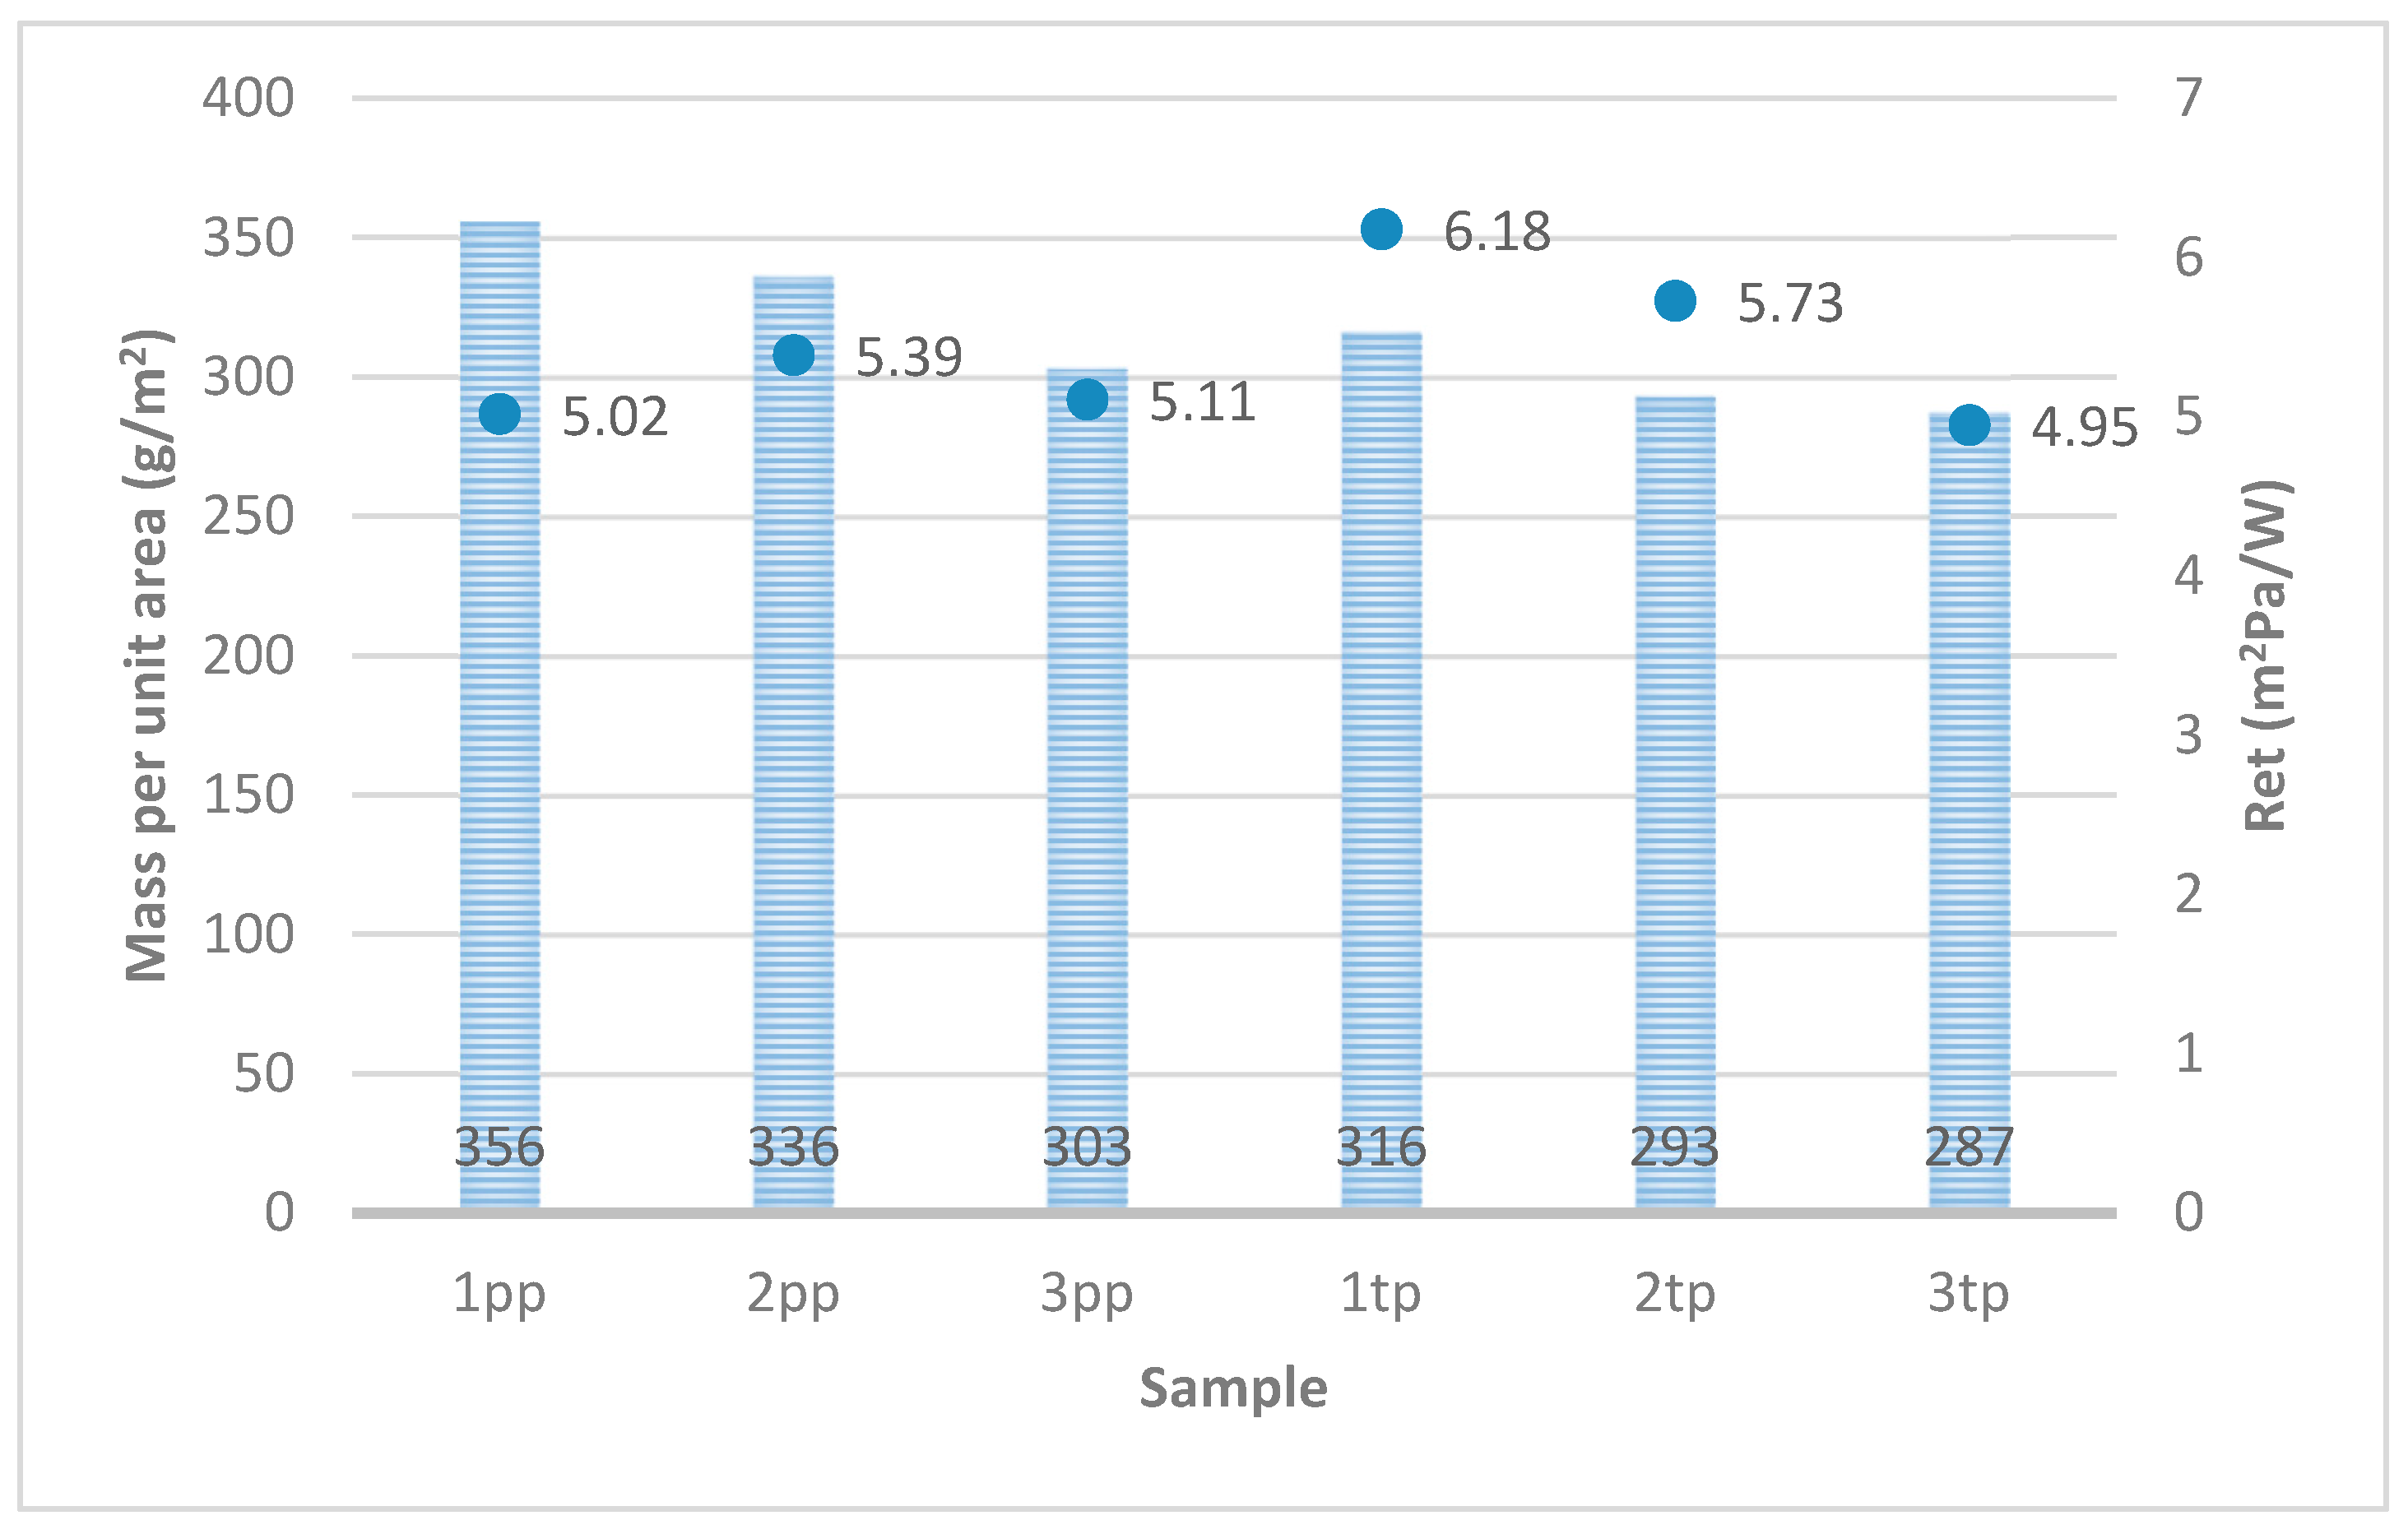
3.3. The Relationship between the Water Vapor Resistance Value (Ret) and the Surface Mass
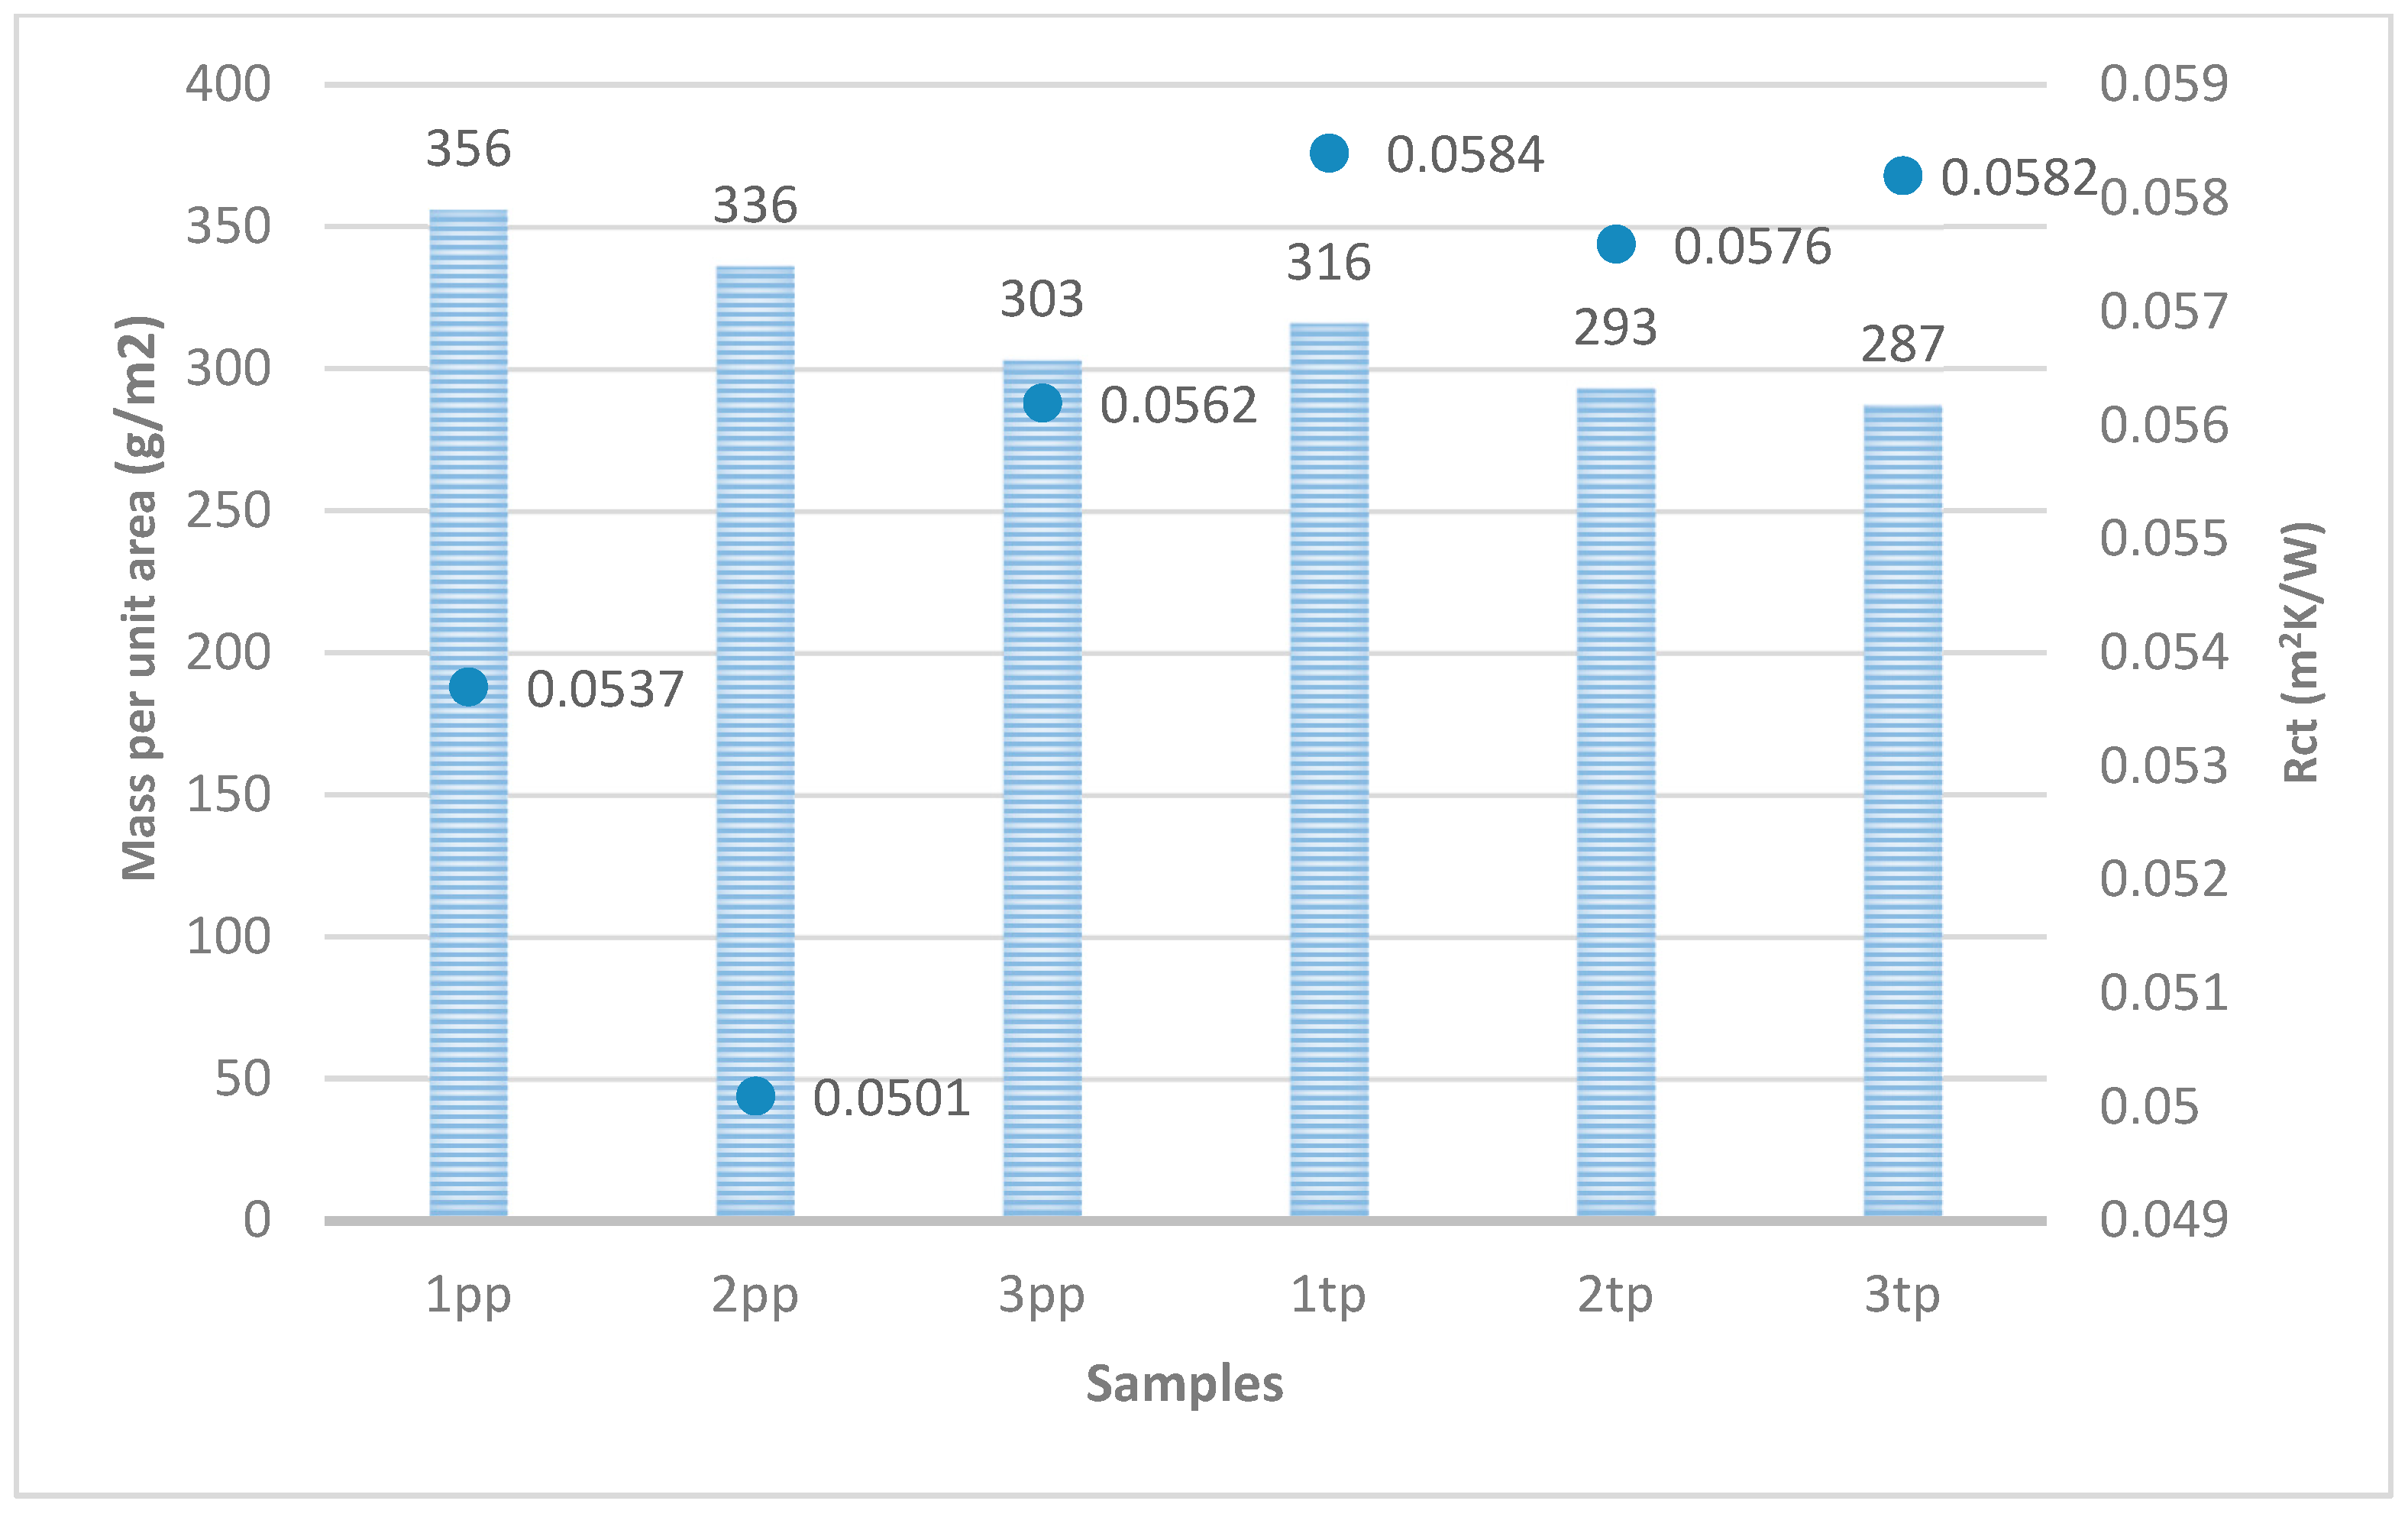
3.4. The Relationship between the Value of Thermal Resistance (Rct) and the Surface Mass
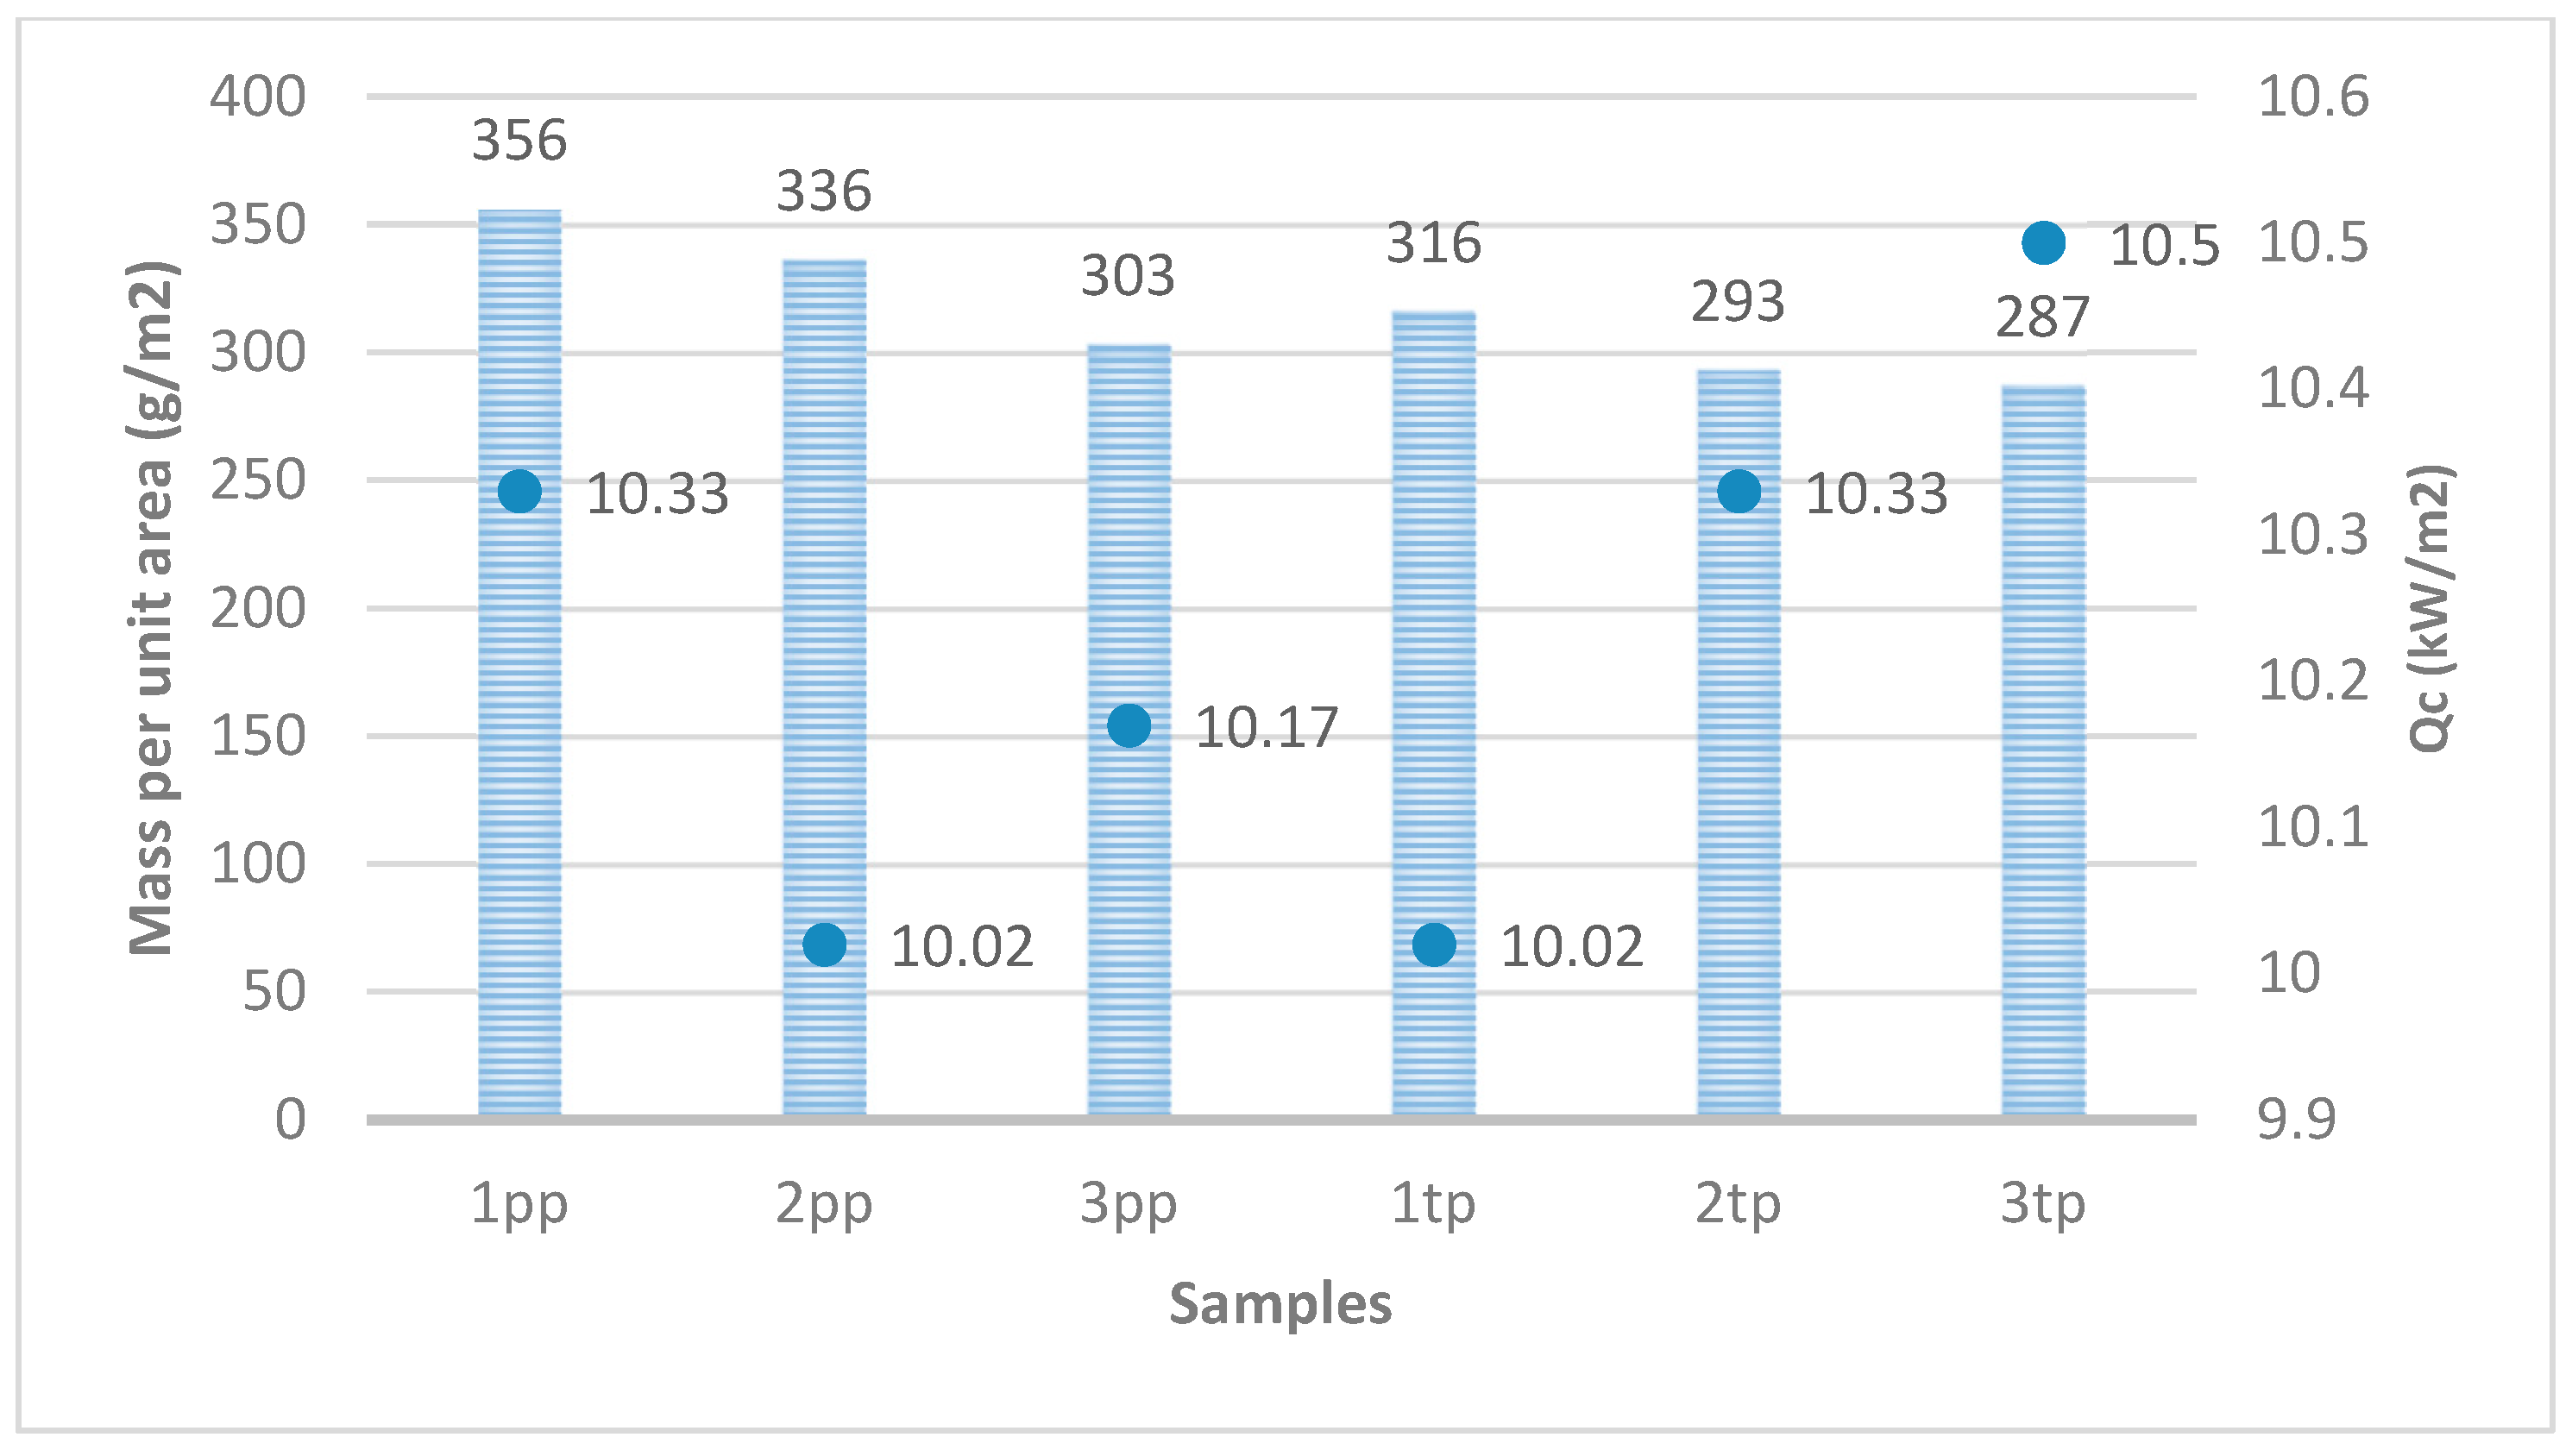
3.5. Relationship between the Density of the Transmitted Heat Flux (Qc) and the Surface Mass
3.6. Correlation of the Obtained Qc, Rct and Ret Results with the Weft Density of the Upper Fabric and the Weft Density of the Lower Fabric
- Correlation of Qc with the weft densities of the upper and lower fabric:
- Weft density upper fabric—Qc has a moderate positive correlation of 0.6109 with the weft density of the upper fabric. A lower density of the weft leads to a lower density of transmitted heat flow through the sample to the calorimeter. With the reduction in the weft, the resistance to radiant heat increases moderately.
- Weft density lower fabric—Qc has a low positive correlation of 0.3449 with weft density. A decrease in weft density in the lower fabric causes a lower density of transmitted Qc, leading to a small increase in radiant heat resistance.
- Correlation of Ret with the weft densities of the upper and lower fabric:
- Weft density upper fabric—Ret has a low negative correlation of −0.3432 with weft density in the upper fabric, which indicates that the decrease in weft density in the upper fabric has little effect on the increase in Ret, i.e., the resistance to the passage of water vapor increases.
- Weft density lower fabric—Ret has a negligible correlation of −0.0452 with the weft density of the lower fabric, i.e., the weft density of the lower fabric has a negligible influence on Ret.
- Correlation of Rct with the weft densities of the upper and lower fabric:
- Weft density upper fabric—Rct has a low negative correlation of −0.3002 with the weft density of the upper fabric.
- Weft density lower fabric—the correlation between Rct with the weft density of the lower fabric is moderately negative, i.e., −0.5729. Increasing the density of the weft in the lower fabric leads to a decrease in Rct, i.e., less thermal insulation.
- Correlation of Qc with the weft densities of the upper and lower fabric:
- Weft density upper fabric—a strong, negative correlation of 0.9987 Qc with weft density can be observed. By increasing the weft density of the upper fabric, the Qc value decreases. Thus, by increasing the density of the weft, less heat flows through the fabric, i.e., the fabric provides greater resistance to radiant heat.
- Weft density lower fabric—a strong, negative correlation of −0.9370 Qc with weft density of the lower fabric can be observed. By increasing the density of the lower fabric, the density of the transmitted heat flow through the calorimeter, i.e., the Qc value, decreases.
- Correlation of Ret with the weft densities of the upper and lower fabric:
- Weft density upper fabric—a strong positive correlation of 0.9641 Ret with the weft density of the upper fabric. A higher density of the weft provides greater resistance to the passage of water vapor. As the density of the weft increases, the comfort of the fabric decreases.
- Weft density lower fabric—a strong positive correlation 0.9993 Ret with the weft density of the lower fabric can be observed. A higher density of the weft in the lower fabric increases the resistance to the passage of water vapor. As the weft density of the bottom fabric increases, the comfort of the fabric decreases.
- Correlation of Rct with the weft densities of the upper and lower fabric:
- Weft density upper fabric—a moderately positive correlation of 0.3500 Rct with weft density can be observed. By increasing the density of the weft, the thermal resistance increases.
- Weft density lower fabric—there is no correlation between the weft density of the bottom fabric and the Rct.
4. Discussion
5. Conclusions
- The ‘pp’ samples of 3D fabrics with larger surface masses, where the upper fabric is made of aramid fibers in the fabric and the lower fabric is made of modacrylic fibers also in the fabric, have lower Ret values, i.e., they provide less resistance to the passage of water vapor than 3D’ tp’ fabric.
- The ‘pp’ samples of 3D fabrics with larger surface masses have lower Rct values, i.e., lower thermal resistance, thus good heat transfer, so the developed metabolic heat passes more easily through the fabric into the atmosphere compared to ‘tp’ fabrics.
- The amount of transmitted heat flux ‘tp’ of fabrics increases with the reduction in the surface mass. The same correlation is not observed with ‘pp’ fabrics, which provide better resistance to radiant heat with smaller surface masses.
- Increasing the weft density of the upper and lower fabric of ‘tp’ fabric affects the increase in resistance to radiant heat, but to the detriment of physiological properties.
- In the case of ‘pp’ samples, by reducing the weft, the resistance to radiation heat increases, but the thermo-physiological properties are not impaired.
- The ‘pp’ samples provide better thermophysiological properties and better resistance to radiant heat compared to ‘tp’ fabrics.
- The reason for the better results in terms of thermophysiological properties and resistance to radiant heat is in the structure of ‘pp’ fabrics compared to ‘tp’ fabrics.
- The folds present in “pp” fabrics are less frequent with a larger volume of “trapped” air in the “pockets” that create the fabric pores, which gives greater resistance to radiation heat-lines and better physiological properties.
- By increasing the weft density, the folds present in ‘tp’ fabrics are denser and more frequent, with a smaller volume of air, which affects the volume, thickness and mass of the fabric, and therefore ‘tp’ fabrics have worse thermophysiological properties and offer less resistance to radiant heat compared to ‘pp’ fabrics.
Author Contributions
Funding
Data Availability Statement
Acknowledgments
Conflicts of Interest
References
- Kahn, S.A.; Patel, J.H.; Lentz, C.W. Firefighter burn injuries: Predictable patterns influenced by turnout gear. J. Burn Care Res. 2012, 33, 152–156. [Google Scholar] [CrossRef] [PubMed]
- Song, G.; Mandal, S.; Rossi, R. Thermal Protective Clothing for Firefighters; Woodhead Publishing: Kidlington, UK, 2016; ISBN 978-0081012857. [Google Scholar]
- Song, G.; Paskaluk, S.; Sati, R. Thermal protective performance of protective clothing used for low radiant heat protection. Text. Res. J. 2011, 81, 311–323. [Google Scholar] [CrossRef]
- Lei, Z. Review of the study of relation between the thermal protection performance and the thermal comfort performance of firefighters’ clothing. J. Eng. Fibers Fabr. 2022, 17, 1–9. [Google Scholar] [CrossRef]
- Barker, R. Evaluating the heat stress and comfort of firefighter and emergency responder protective clothing. In Improving Comfort in Clothing; Woodhead Publishing: Kidlington, UK, 2011; pp. 305–319, Chapter 12; ISBN 9781845695392. [Google Scholar]
- Choudhury, A.K.R.; Majumdar, P.K.; Datta, C. Factors affecting comfort: Human physiology and the role of clothing. In Improving Comfort in Clothing; Woodhead Publishing: Kidlington, UK, 2011; pp. 3–60, Chapter 1; ISBN 9781845695392. [Google Scholar]
- Asif, M.; Kala, C.; Gilani, S.J.; Imam, S.S.; Taleuzzaman, M.; Alshehri, S.; Khan, N.A. Protective clothing for firefighters and rescue workers. In Protective Textiles from Natural Resources; Volume in The Textile Institute Book Series; Woodhead Publishing: Sawston, UK, 2022; pp. 611–647. [Google Scholar]
- Lawson, L.K.; Crown, E.M.; Ackerman, M.Y.; Douglas Dale, J. Moisture effects in heat transfer through clothing systems for wildland firefighters. Int. J. Occup. Saf. Ergon. 2004, 10, 227–238. [Google Scholar] [CrossRef] [PubMed]
- Limeneh, D.Y.; Ayele, M.; Tesfaye, T.; Liyew, E.Z.; Tesema, A.F. Effect of Weave Structure on Comfort Property of Fabric. J. Nat. Fibers 2020, 18, 8. [Google Scholar] [CrossRef]
- Frydrych, I.; Dziworska, G.; Bilska, J. Comparative analysis of the thermal insulation properties of fabrics made of natural and manmade cellulose fibres. Fibers Text. East. Eur. 2002, 10, 40–44. [Google Scholar]
- Abdel-Rehim, Z.S.; Saad, M.M.; El-Shakankery, M.; Hanafy, I. Textile fabrics as thermal insulators. Autex Res. J. 2006, 6, 148–161. [Google Scholar] [CrossRef]
- Ahmad, S.; Ahmad, F.; Afzal, A.; Rasheed, A.; Mohsin, M.; Ahmad, N. Effect of weave structure on thermo-physiological properties of cotton fabrics. Autex Res. J. 2015, 15, 30–32. [Google Scholar] [CrossRef]
- Kovačević, S.; Schwarz, I.; Brnada, S. Technical Fabrics; University of Zagreb, Faculty of Textile Technology: Zagreb, Croatia, 2019; ISBN 978-953-7105-78-5. [Google Scholar]
- Kiš, A.; Brnada, S.; Kovačević, S. Influence of Fabric Weave on Thermal Radiation Resistance and Water Vapor Permeability. Polymers 2020, 12, 525. [Google Scholar] [CrossRef] [PubMed]
- Bilisk, K. New method of weaving multiaxis three dimensional flat woven fabric: Feasibility of prototype tube carrier weaving. Fibres Text. East. Eur. 2009, 17, 63–69. [Google Scholar]
- Bilisik, K. Multiaxis three dimensional (3D) woven fabric. In Advances in Modern Woven Fabrics Technology; IntechOpen: London, UK, 2011. [Google Scholar]
- Ansar, M.; Xinwei, W.; Chouwei, Z. Modeling strategies of 3D woven composites: A review. Compos. Struct. 2011, 93, 1947–1963. [Google Scholar] [CrossRef]
- Zahid, B.; Chen, X. Manufacturing of single-piece textile reinforced riot helmet shell from vacuum bagging. J. Compos. Mater. 2013, 47, 2343–2351. [Google Scholar] [CrossRef]
- El-Dessouky, H.M.; Snape, A.E.; Turner, J.L.; Saleh, M.N.; Tew, H.; Scaife, R.J. 3D weaving for advanced composite manufacturing: From research to reality. In Proceedings of the SAMPE Conference, Seattle, DC, USA, 22–25 May 2017. [Google Scholar]
- Kovačević, S.; Rogina-Car, B.; Kiš, A. Application of 3D-Woven Fabrics for Packaging Materials for Terminally Sterilized Medical Devices. Polymers 2022, 14, 4952. [Google Scholar] [CrossRef] [PubMed]
- EN ISO 6942:2022; Protective Clothing—Protection against Heat and Fire—Method of Test: Evaluation of Materials and Material Assemblies When Exposed to a Source of Radiant heat. International Organization for Standardization: Geneva, Switzerland, 2022.
- ISO/IEC 17025:2017; General Requirements for the Competencs of Testing and Alibration Laboratories. International Organization for Standardization: Geneva, Switzerland, 2017.
- EN ISO 11092:2014; Textiles—Physiological Effects—Measurement of Thermal and Water-vapour Resistance under Steady-State Conditions (Sweating Guarded-Hotplate Test). International Organization for Standardization: Geneva, Switzerland, 2014.

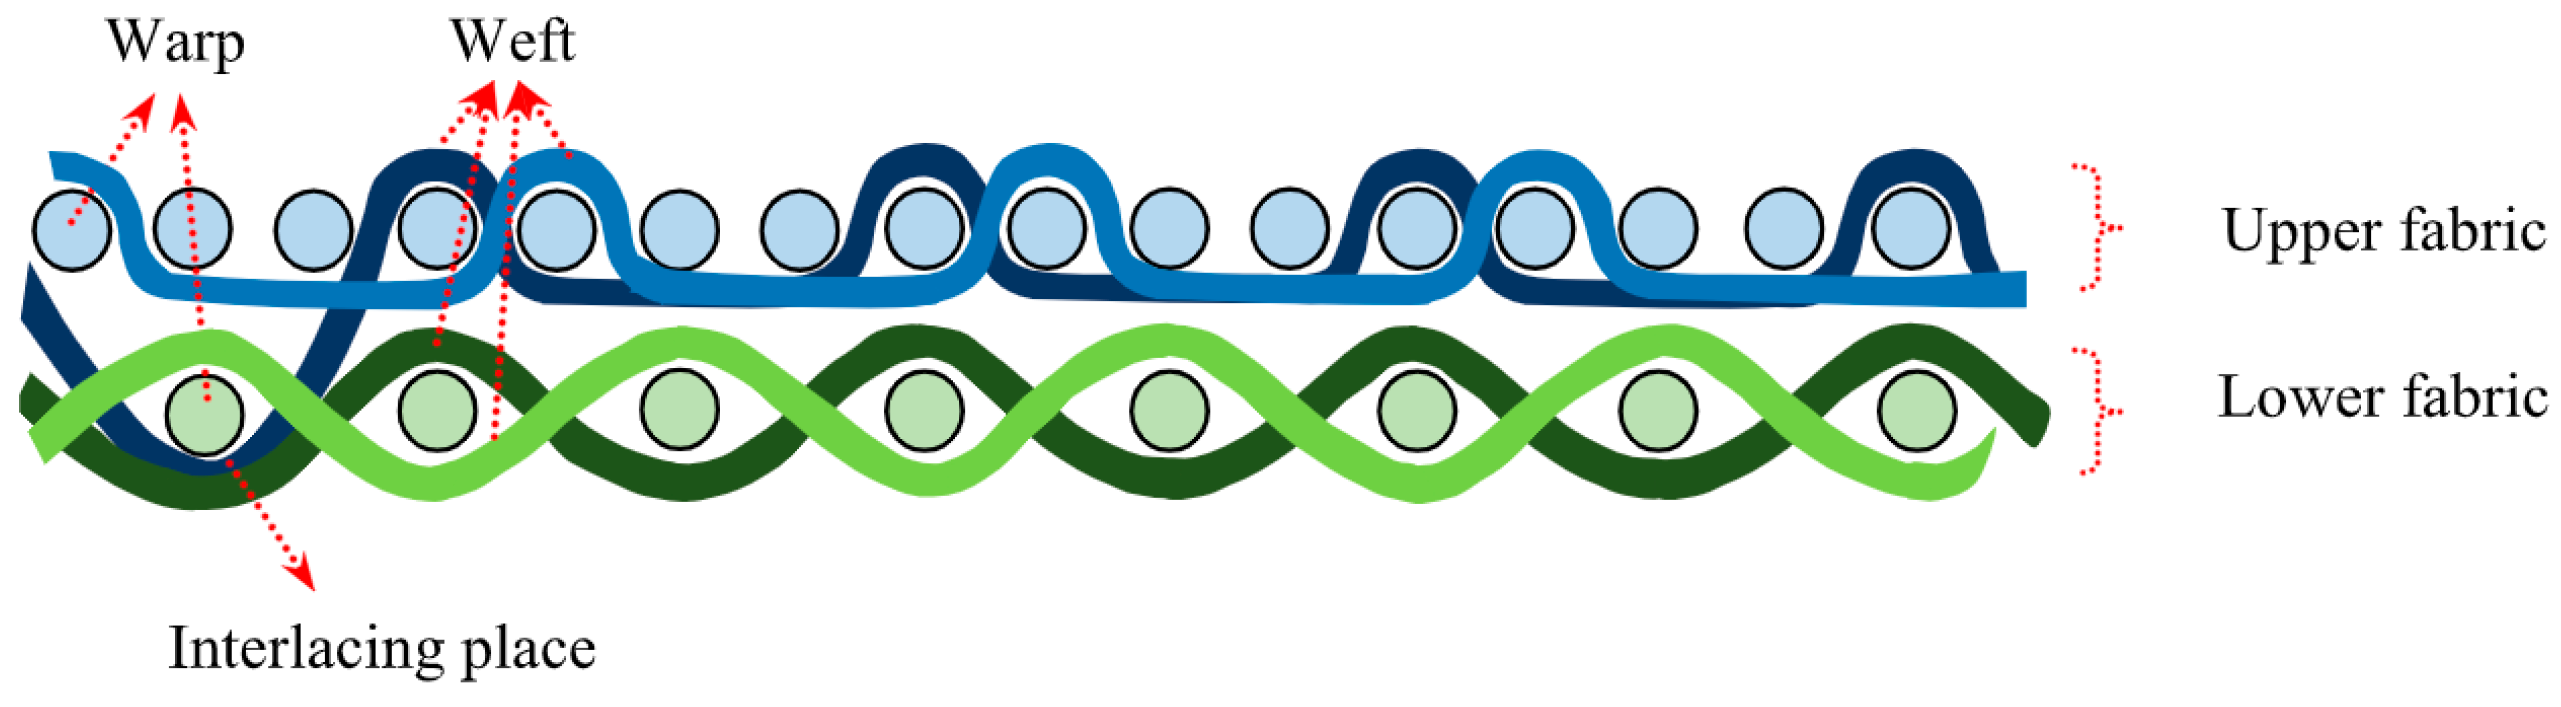
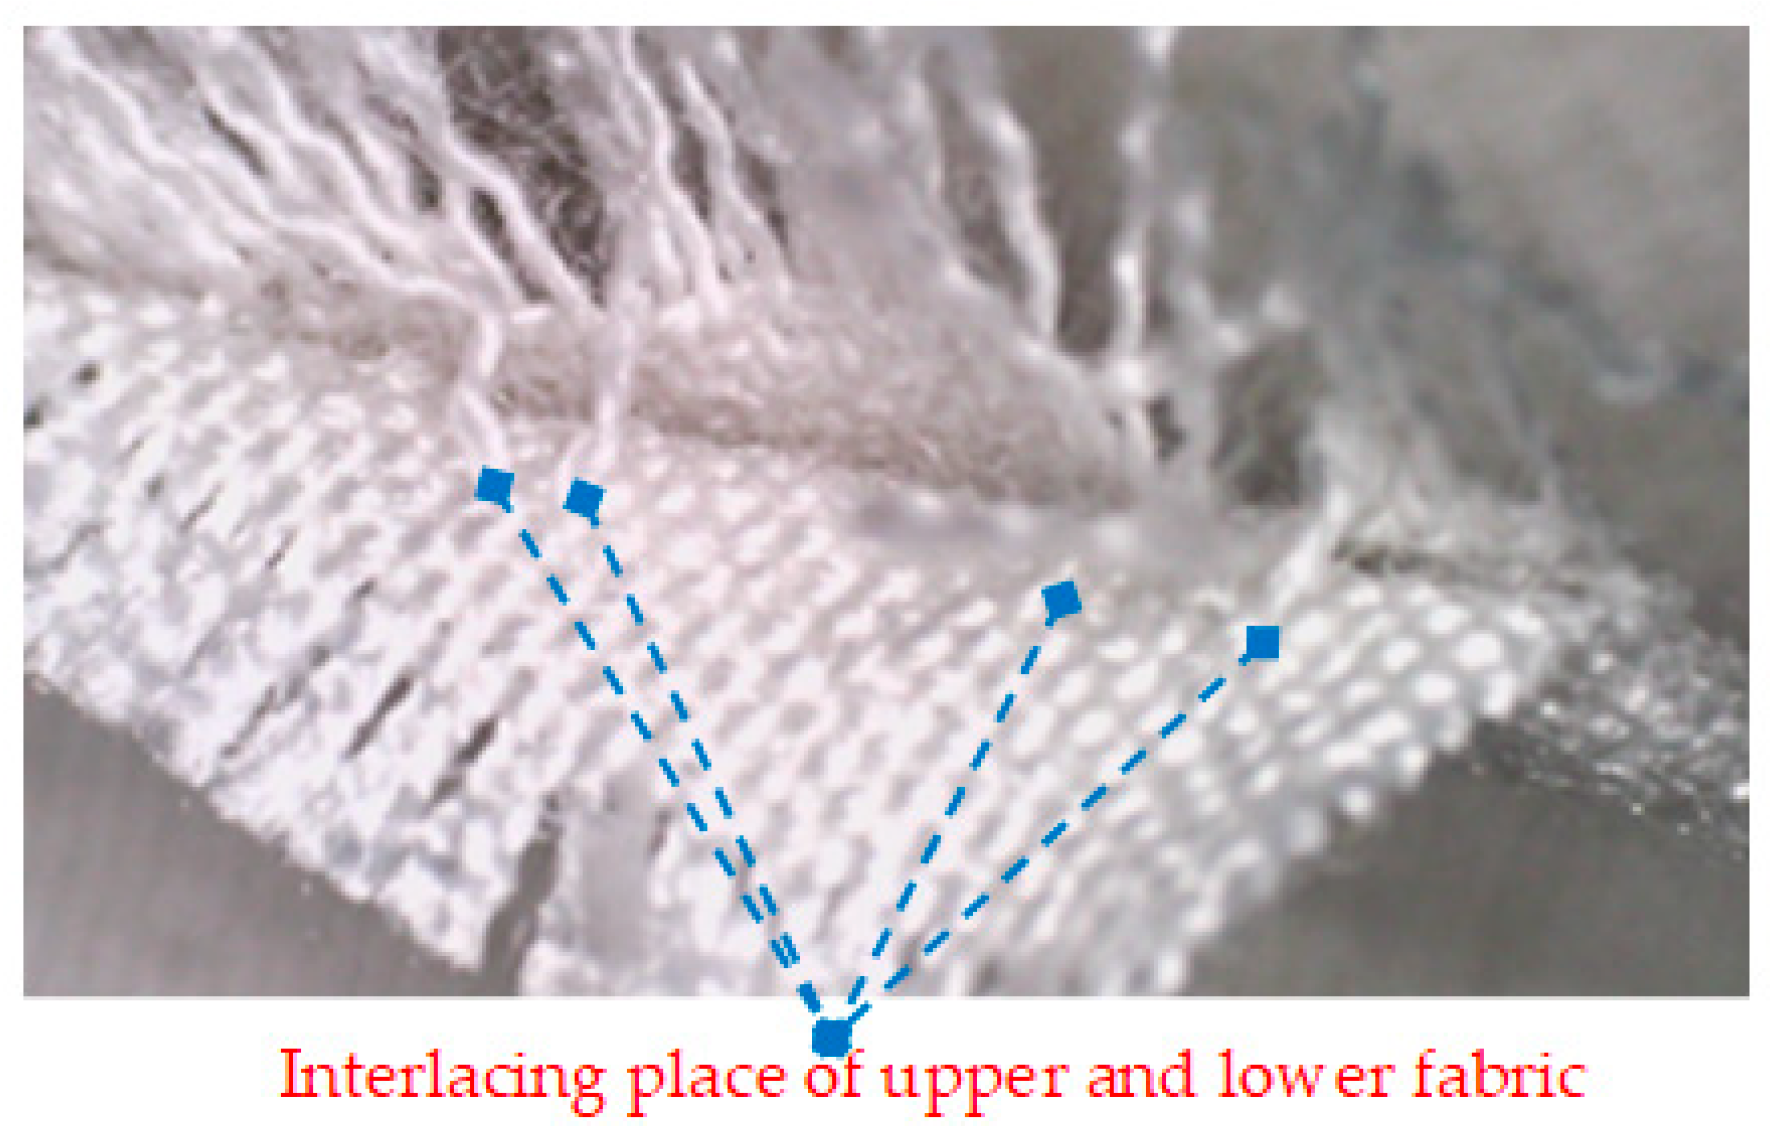
 —upper fabric,
  —lower fabric,
  —interlacing places;
  —full lifting of the warp threads of the upper fabric when weaving the weft into the lower fabric, numbers 1–16—number of sheet, letters a, b, c, d—order of wefts.
—upper fabric, —lower fabric, —interlacing places; —full lifting of the warp threads of the upper fabric when weaving the weft into the lower fabric, numbers 1–16—number of sheet, letters a, b, c, d—order of wefts.
—full lifting of the warp threads of the upper fabric when weaving the weft into the lower fabric, numbers 1–16—number of sheet, letters a, b, c, d—order of wefts.
—upper fabric, —lower fabric, —interlacing places; —full lifting of the warp threads of the upper fabric when weaving the weft into the lower fabric, numbers 1–16—number of sheet, letters a, b, c, d—order of wefts.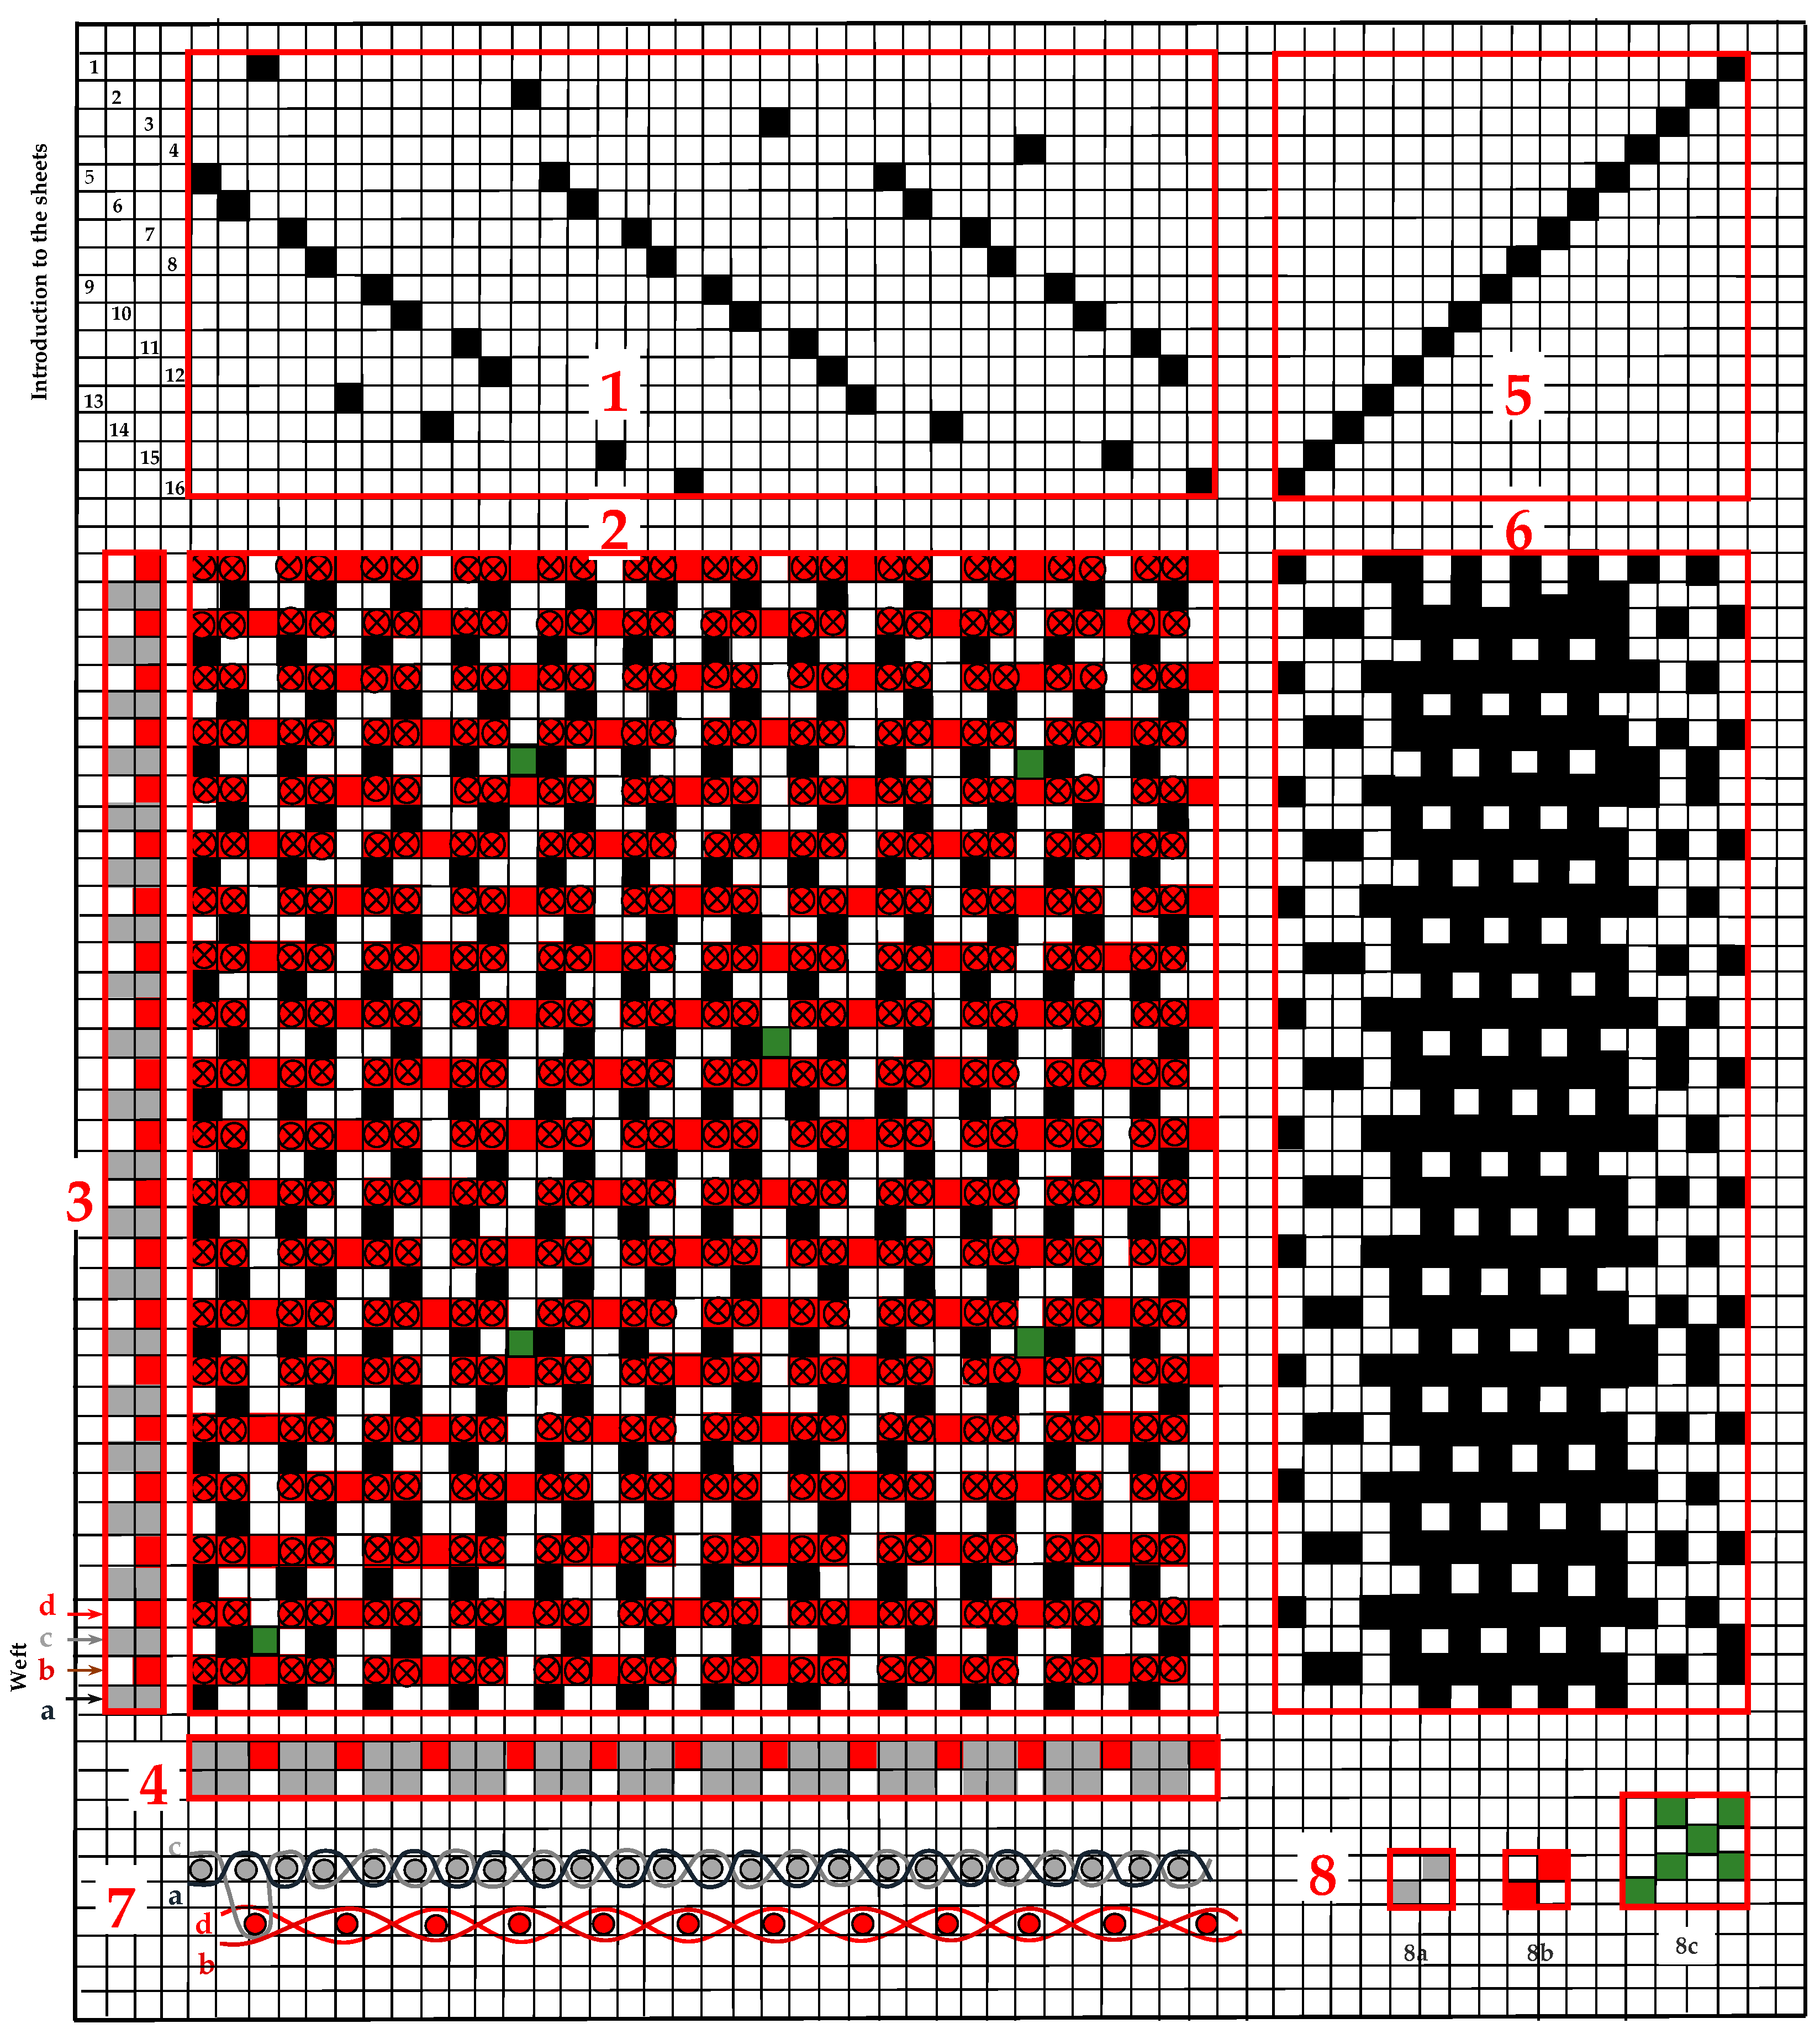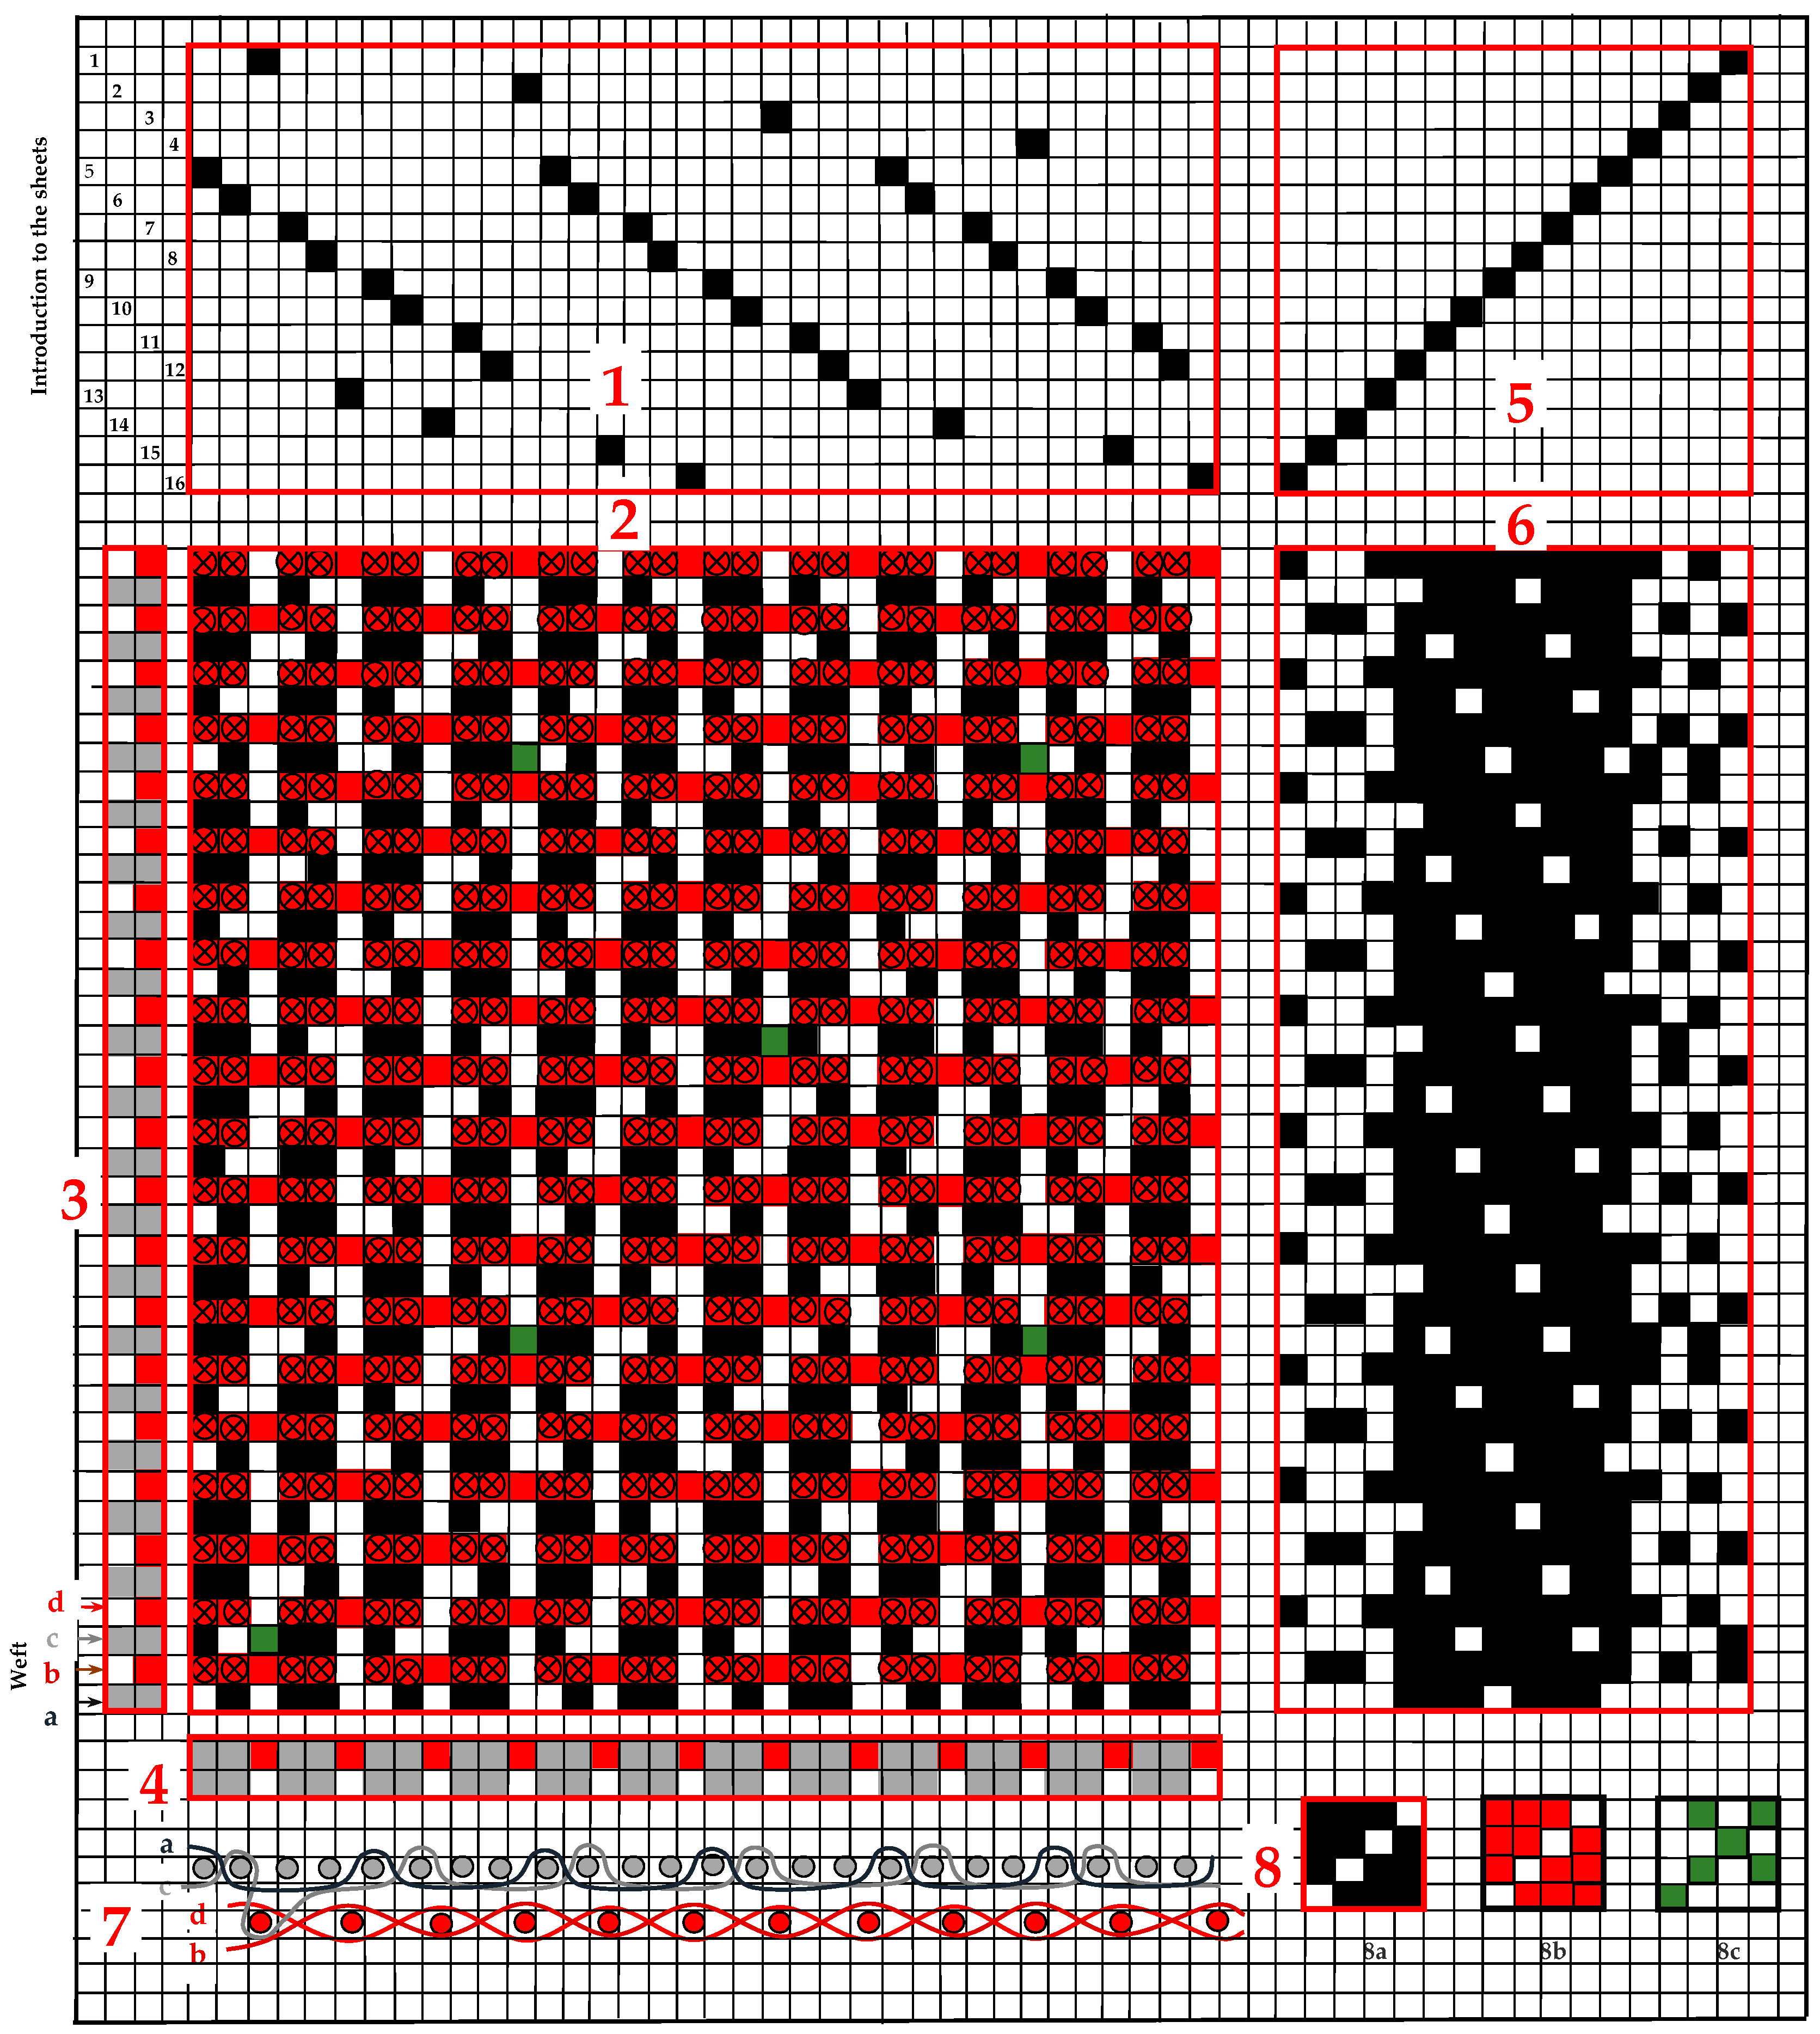


| Sample | Woven Fabric | Weave of Upper–Lower Fabric | Density of Warp–Weft (thread/cm) | Yarn Fineness (Tex) | Yarn Composition | Mass Per Unit Area (g/m2) | Thickness (mm) | |
|---|---|---|---|---|---|---|---|---|
| Warp | Weft | Warp and Weft | ||||||
| 1pp 1 | Upper | Plain | 40–35 | 12.5 × 2 | 16.7 × 2 | 95.0% M-aramid Conex NEO 5.0% P-aramid Twaron | 356 | 0.63 |
| Lower | Plain | 20–17 | 12.5 × 2 | 25 | 45.0% Cotton Long Stapel Combed 55.0% Modacrylic Sevel FRSA/L | |||
| 2pp | Upper | Plain | 40–32 | 12.5 × 2 | 16.7 × 2 | 95.0% M-aramid Conex NEO 5.0% P-aramid Twaron | 336 | 0.61 |
| Lower | Plain | 20–16 | 17 × 2 | 25 | 45.0% Cotton Long Stapel Combed 55.0% Modacrylic Sevel FRSA/L | |||
| 3pp | Upper | Plain | 40–30 | 12.5 × 2 | 16.7 × 2 | 95.0% M-aramid Conex NEO 5.0% P-aramid Twaron | 303 | 0.59 |
| Lower | Plain | 20–14 | 17 × 2 | 25 | 45.0% Cotton Long Stapel Combed 55.0% Modacrylic Sevel FRSA/L | |||
| 1tp 2 | Upper | Twill 3/1 | 40–35 | 12.5 × 2 | 16.7 × 2 | 95.0% M-aramid Conex NEO 5.0% P-aramid Twaron | 316 | 0.61 |
| Lower | Plain | 20–17 | 17 × 2 | 25 | 45.0% Cotton Long Stapel Combed 55.0% Modacrylic Sevel FRSA/L | |||
| 2tp | Upper | Twill 3/1 | 40–32 | 12.5 × 2 | 16.7 × 2 | 95.0% M-aramid Conex NEO 5.0% P-aramid Twaron | 293 | 0.58 |
| Lower | Plain | 20–16 | 17 × 2 | 25 | 45.0% Cotton Long Stapel Combed 55.0% Modacrylic Sevel FRSA/L | |||
| 3tp | Upper | Twill 3/1 | 40–30 | 12.5 × 2 | 16.7 × 2 | 95.0% M-aramid Conex NEO 5.0% P-aramid Twaron | 287 | 0.58 |
| Lower | Plain | 20–14 | 17 × 2 | 25 | 45.0% Cotton Long Stapel Combed 55.0% Modacrylic Sevel FRSA/L | |||
| 3D Samples | 1pp | 2pp | 3pp | 1tp | 2tp | 3tp | |
|---|---|---|---|---|---|---|---|
| t12 (s) | Mean | 7.9 | 7.8 | 7.9 | 8.3 | 8.2 | 7.6 |
| CV (%) | 1.91 | 1.59 | 2.16 | 1.50 | 2.08 | 0.62 | |
| t24 (s) | Mean | 14.3 | 14.4 | 14.4 | 14.9 | 14.6 | 13.9 |
| CV (%) | 1.05 | 1.18 | 1.13 | 1.10 | 1.40 | 0.59 | |
| t24–t12 (s) | Mean | 6.4 | 6.6 | 6.5 | 6.6 | 6.4 | 6.3 |
| CV (%) | 0 | 0.72 | 0.72 | 1.90 | 0.73 | 1.30 | |
| RHTI24–RHTI12 (s) | Mean | 6.4 | 6.6 | 6.5 | 6.6 | 6.4 | 6.3 |
| CV (%) | 0 | 0.72 | 0.72 | 1.90 | 0.73 | 1.30 | |
| Qc (kW/m2) | Mean | 10.33 | 10.02 | 10.17 | 10.02 | 10.33 | 10.50 |
| CV (%) | 0 | 0.14 | 0.70 | 1.90 | 0.70 | 1.29 | |
| TFQ0 (-) | Mean | 0.5165 | 0.5010 | 0.5085 | 0.5010 | 0.5165 | 0.5250 |
| CV (%) | 0 | 0.14 | 0.70 | 1.90 | 0.70 | 1.29 |
| 3D Samples | 1pp | 2pp | 3pp | 1tp | 2tp | 3tp | |
|---|---|---|---|---|---|---|---|
| Rct (m2·K/W) | Mean | 0.0537 | 0.0501 | 0.0562 | 0.0584 | 0.0576 | 0.0582 |
| CV (%) | 7.24 | 4.47 | 3.70 | 4.27 | 6.00 | 7.28 | |
| Ret (m2·Pa/W) | Mean | 5.02 | 5.39 | 5.11 | 6.18 | 5.73 | 4.95 |
| CV (%) | 3.44 | 1.47 | 1.53 | 1.28 | 2.94 | 1.11 |
| pp Samples | WDUF | WDLF | Qc | Rct | Ret |
| Weft density upper fabric (WDUF) | 1 | ||||
| Weft density lower fabric (WDLF) | 0.9538 | 1 | |||
| Qc | 0.6109 | 0.3449 | 1 | ||
| Rct | −0.3002 | −0.5729 | 0.5718 | 1 | |
| Ret | −0.3432 | −0.0452 | −0.9533 | −0.7929 | 1 |
| tp Samples | WDUF | WDLF | Qc | Rct | Ret |
| Weft density upper fabric (WDUF) | 1 | ||||
| Weft density lower fabric (WDLF) | 0.9538 | 1 | |||
| Qc | −0.9987 | −0.9370 | 1 | ||
| Rct | 0.3500 | 0.0524 | −0.3981 | 1 | |
| Ret | 0.9641 | 0.9993 | −0.9491 | 0.0888 | 1 |
Disclaimer/Publisher’s Note: The statements, opinions and data contained in all publications are solely those of the individual author(s) and contributor(s) and not of MDPI and/or the editor(s). MDPI and/or the editor(s) disclaim responsibility for any injury to people or property resulting from any ideas, methods, instructions or products referred to in the content. |
© 2024 by the authors. Licensee MDPI, Basel, Switzerland. This article is an open access article distributed under the terms and conditions of the Creative Commons Attribution (CC BY) license (https://creativecommons.org/licenses/by/4.0/).
Share and Cite
Kiš, A.; Kovačević, S. Influence of the Structure of 3D Woven Fabrics on Radiation Heat Resistance and Thermophysiology Properties. Textiles 2024, 4, 267-283. https://doi.org/10.3390/textiles4020016
Kiš A, Kovačević S. Influence of the Structure of 3D Woven Fabrics on Radiation Heat Resistance and Thermophysiology Properties. Textiles. 2024; 4(2):267-283. https://doi.org/10.3390/textiles4020016
Chicago/Turabian StyleKiš, Ana, and Stana Kovačević. 2024. "Influence of the Structure of 3D Woven Fabrics on Radiation Heat Resistance and Thermophysiology Properties" Textiles 4, no. 2: 267-283. https://doi.org/10.3390/textiles4020016
APA StyleKiš, A., & Kovačević, S. (2024). Influence of the Structure of 3D Woven Fabrics on Radiation Heat Resistance and Thermophysiology Properties. Textiles, 4(2), 267-283. https://doi.org/10.3390/textiles4020016