
Study of the Response Surface in the Photocatalytic Degradation of Acetaminophen Using TiO2

 ,
, 
Abstract
:1. Introduction
2. Materials and Methods
2.1. Chemical Reagents
2.2. Synthesis of TiO2
2.3. Characterization of TiO2
2.4. Photocatalytic Activity of TiO2
2.5. Response Surface Method (RSM)
3. Results and Discussion
3.1. Characterization
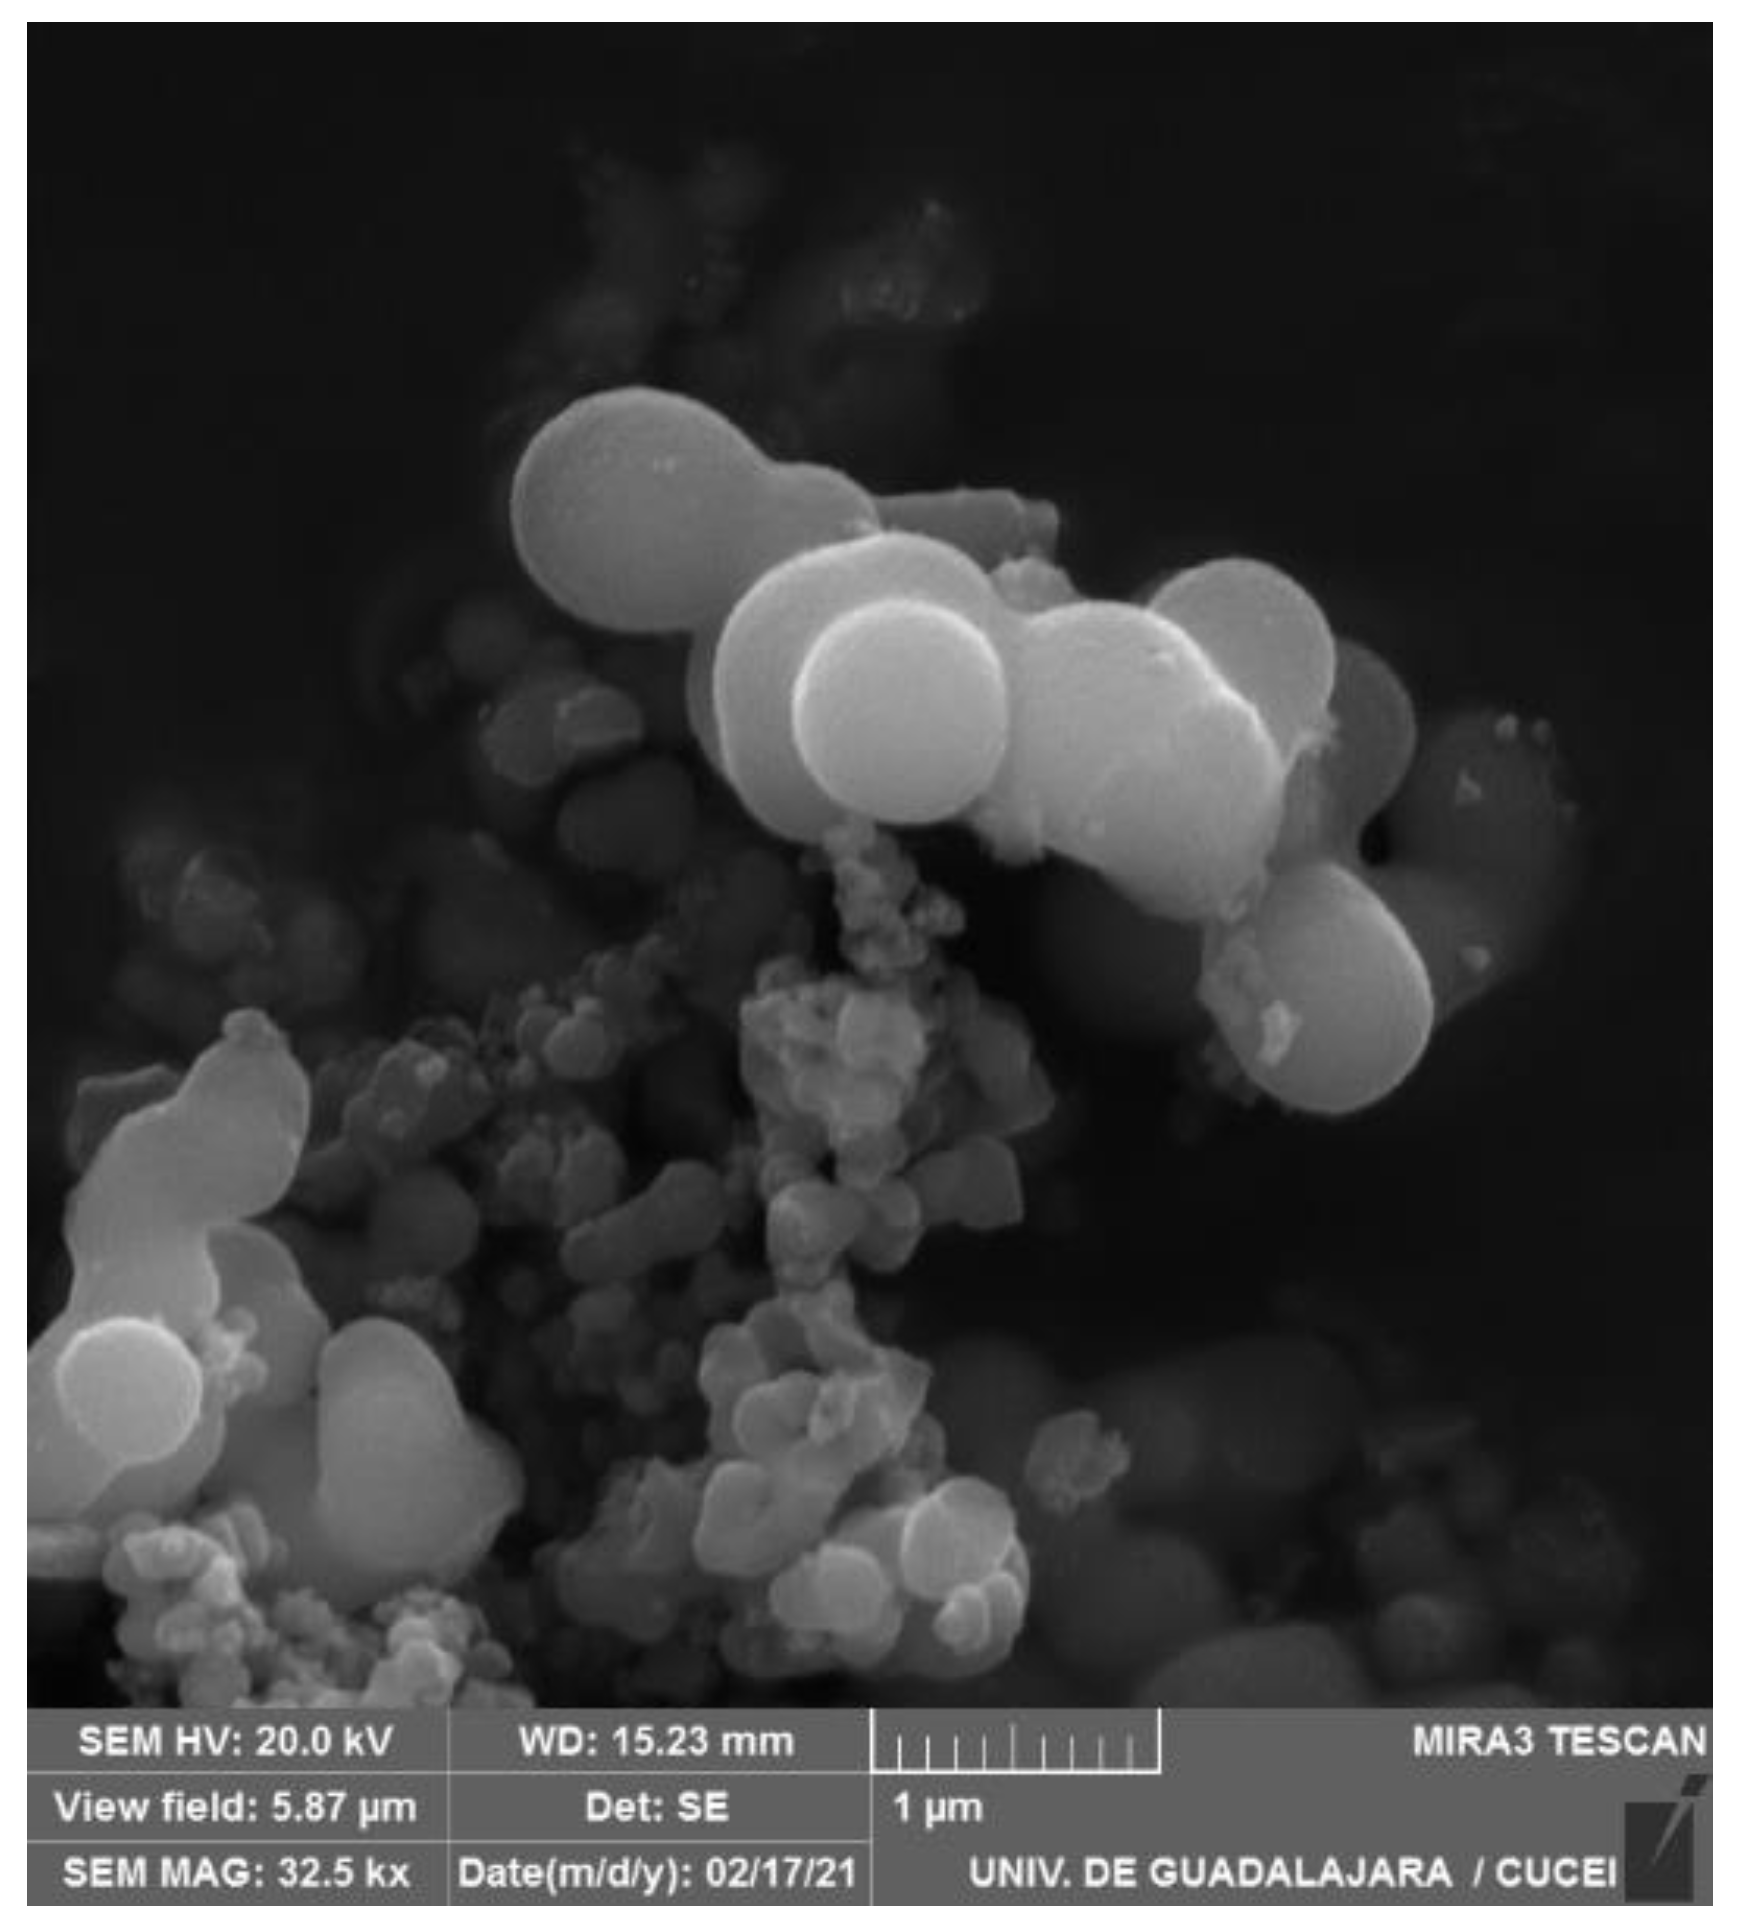
3.1.1. Scanning Electron Microscopy (SEM)
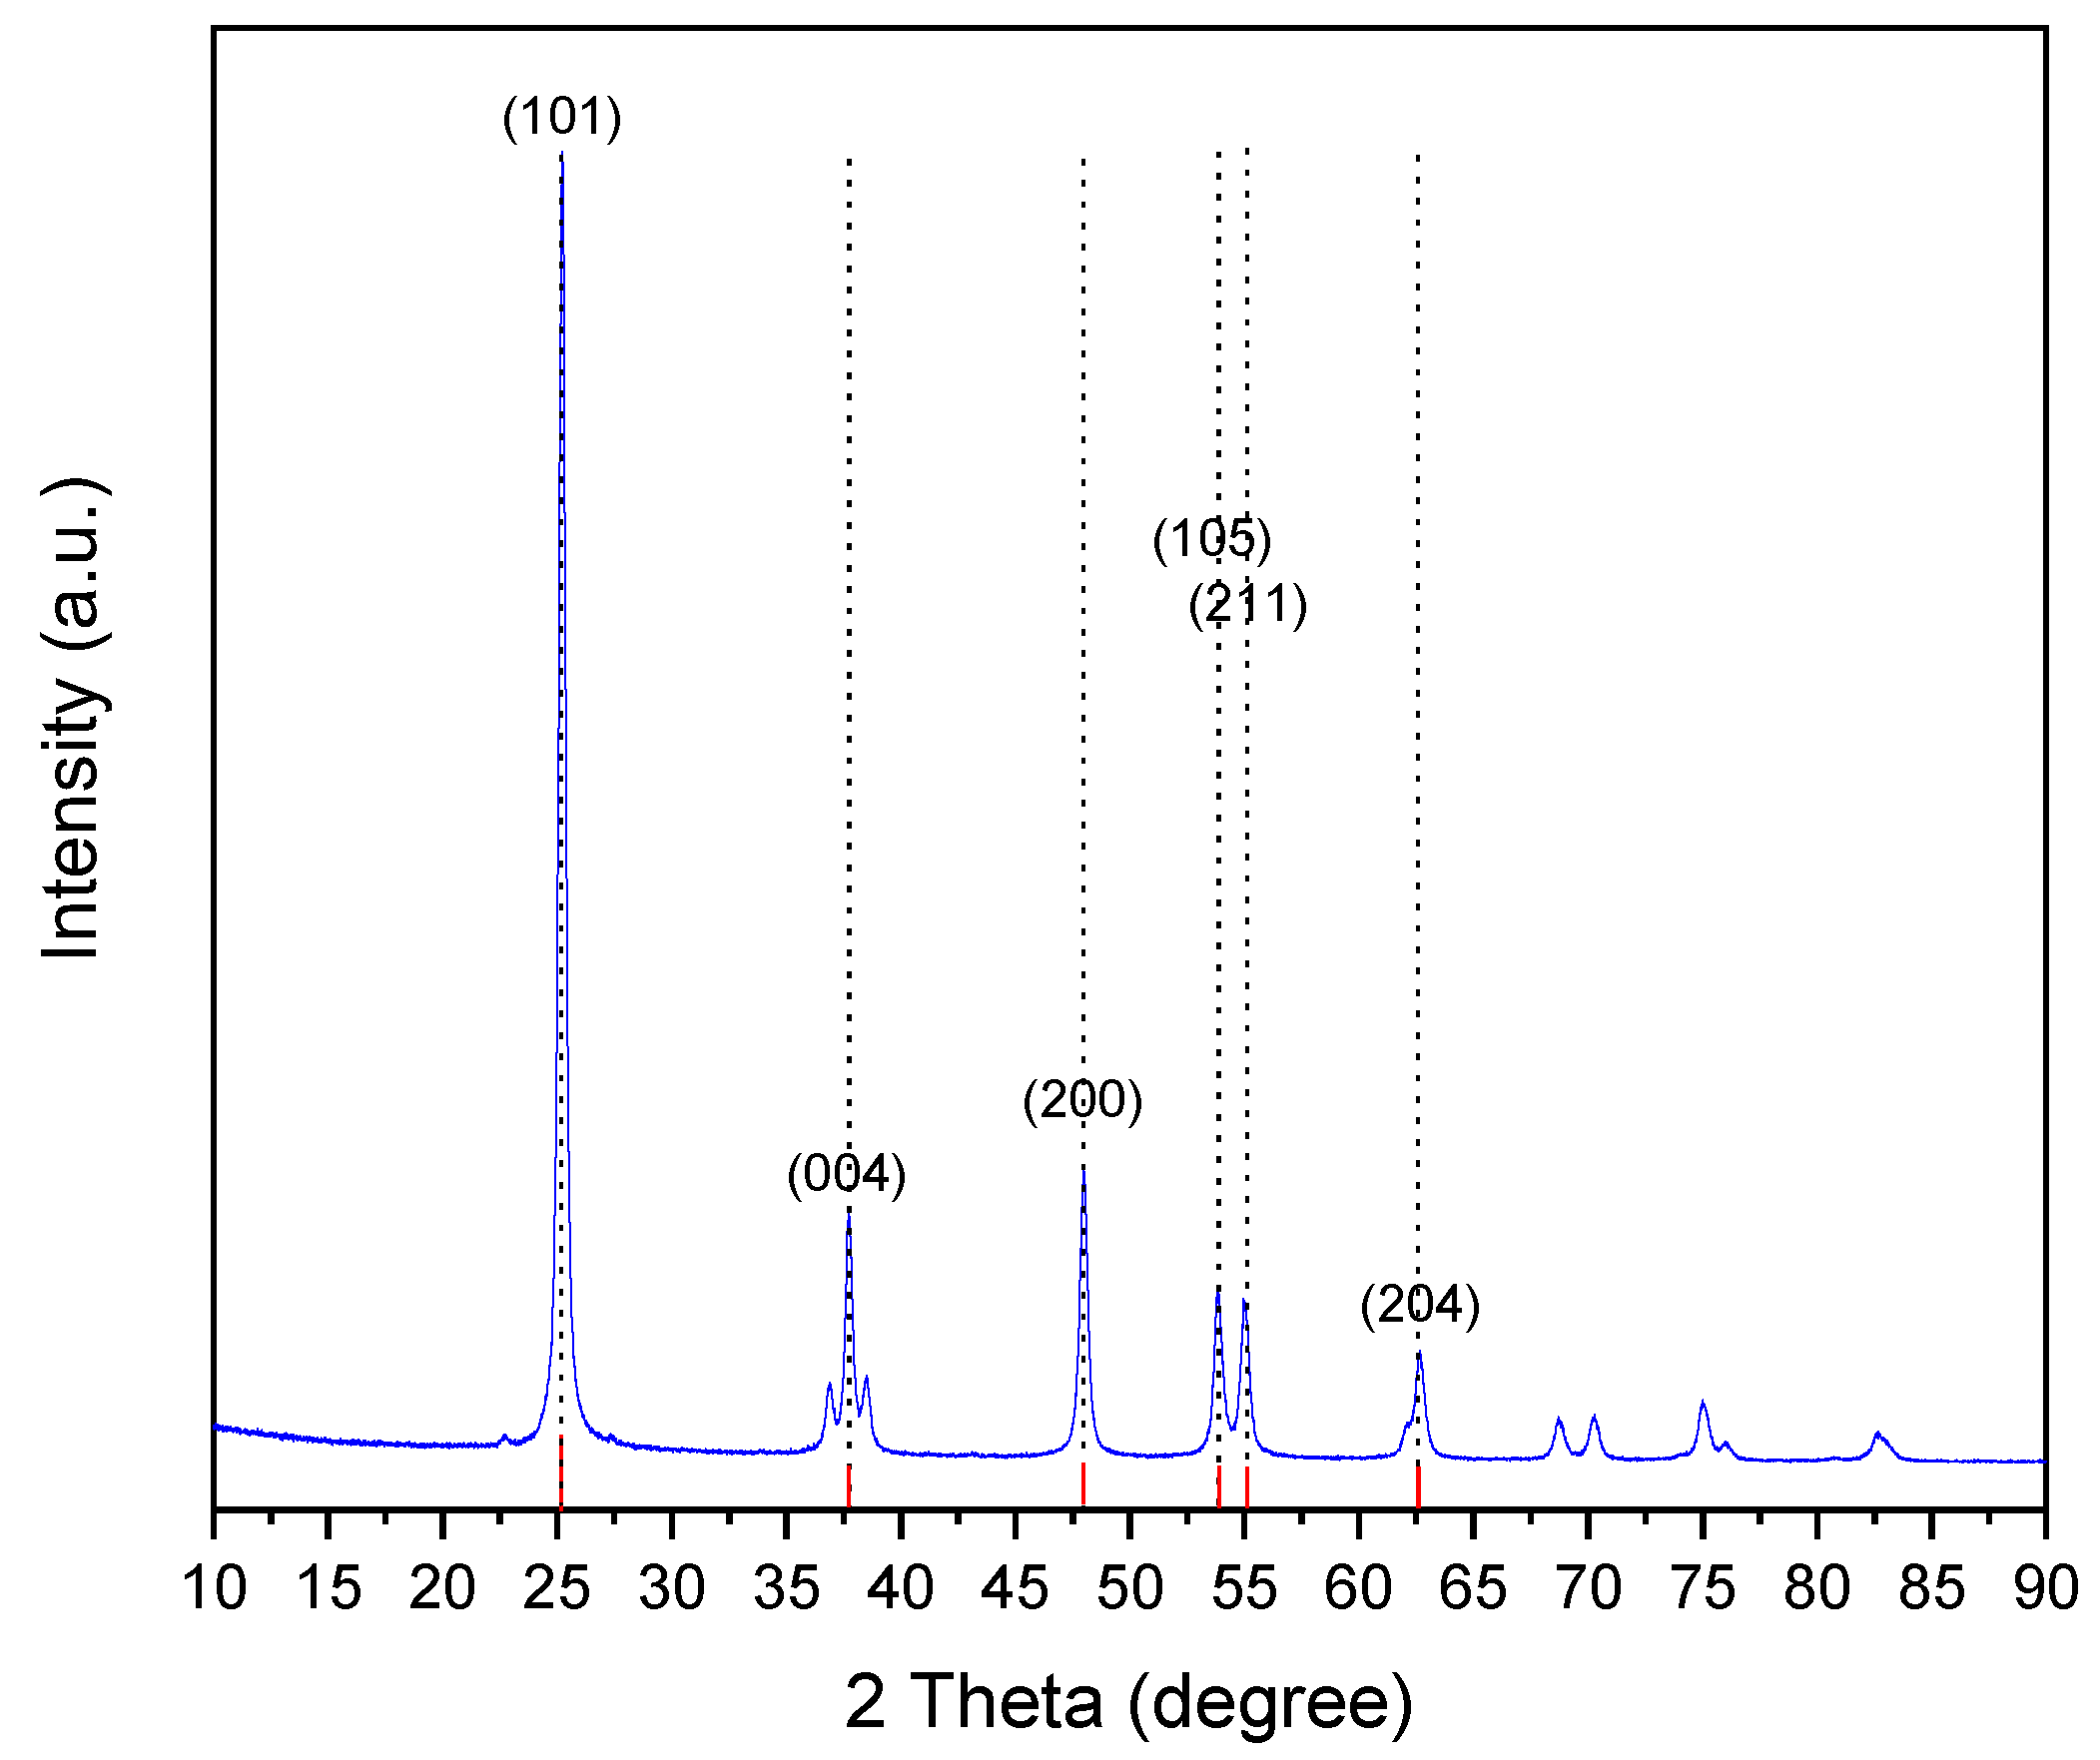
3.1.2. X-ray Diffraction (XRD)
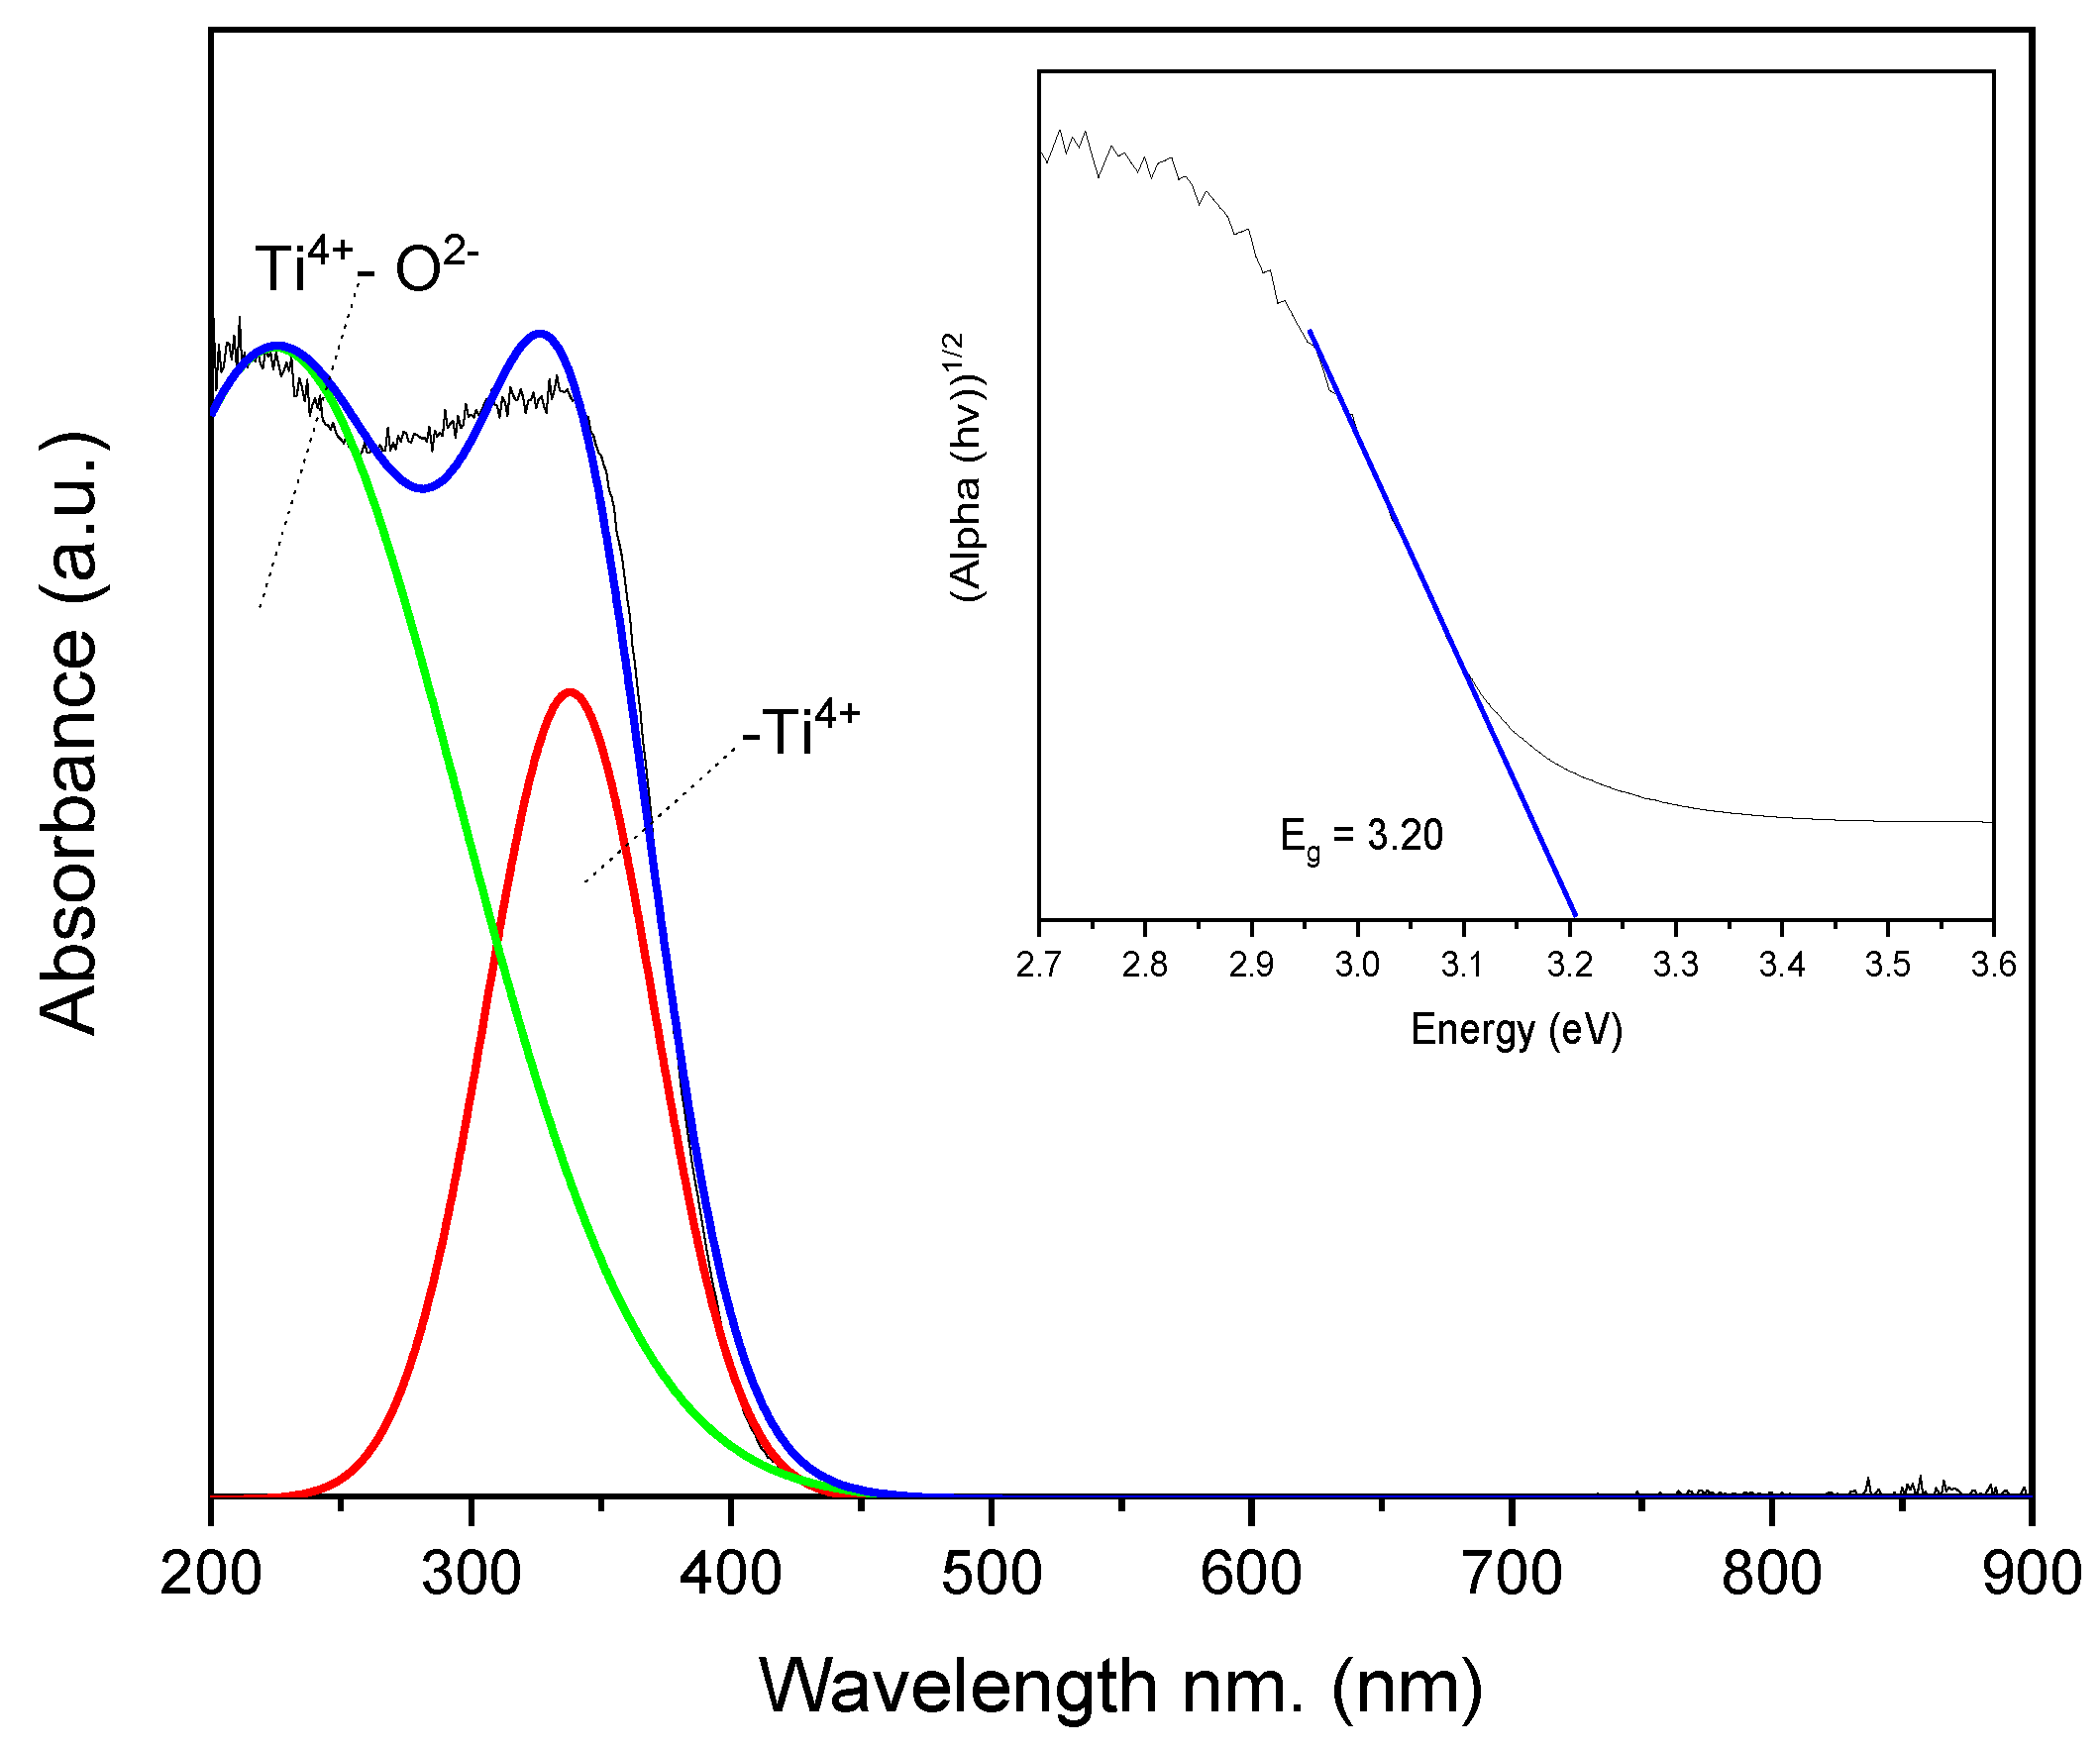
3.1.3. UV-Vis Spectroscopy
3.1.4. X-ray Photoelectron Spectroscopy
3.2. Photocatalytic Activity
3.2.1. Model Validation
3.2.2. TOC Analysis
3.2.3. Proposed Photocatalytic Mechanism
4. Conclusions
Author Contributions
Funding
Institutional Review Board Statement
Informed Consent Statement
Data Availability Statement
Acknowledgments
Conflicts of Interest
References
- Hafeez, A.; Taqvi, S.A.A.; Fazal, T.; Javed, F.; Khan, Z.; Amjad, U.S.; Bokhari, A.; Shehzad, N.; Rashid, N.; Rehman, S.; et al. Optimization on cleaner intensification of ozone production using Artificial Neural Network and Response Surface Methodology: Parametric and comparative study. J. Clean. Prod. 2020, 252, 119833. [Google Scholar] [CrossRef]
- Mortazavian, S.; Saber, A.; James, D.E. Optimization of Photocatalytic Degradation of Acid Blue 113 and Acid Red 88 Textile Dyes in a UV-C/TiO2 Suspension System: Application of Response Surface Methodology (RSM). Catalysts 2019, 9, 360. [Google Scholar] [CrossRef] [Green Version]
- Vebber, M.C.; da Silva Crespo, J.; Giovanela, M. Self-assembled thin films of PAA/PAH/TiO2 for the photooxidation of ibuprofen. Part I: Optimization of photoactivity using design of experiments and surface response methodology. Chem. Eng. J. 2019, 360, 1447–1458. [Google Scholar] [CrossRef]
- Peng, T.; Ray, S.; Veeravalli, S.S.; Lalman, J.A.; Arefi-Khonsari, F. The role of hydrothermal conditions in determining 1D TiO2 nanomaterials bandgap energies and crystal phases. Mater. Res. Bull. 2018, 105, 104–113. [Google Scholar] [CrossRef]
- Chaker, H.; Ameur, N.; Saidi-Bendahou, K.; Djennas, M.; Fourmentin, S. Modeling and Box-Behnken design optimization of photocatalytic parameters for efficient removal of dye by lanthanum-doped mesoporous TiO2. J. Environ. Chem. Eng. 2021, 9, 104584. [Google Scholar] [CrossRef]
- Ray, S.; Lalman, J.A.; Biswas, N. Using the Box-Benkhen technique to statistically model phenol photocatalytic degradation by titanium dioxide nanoparticles. Chem. Eng. J. 2009, 150, 15–24. [Google Scholar] [CrossRef]
- Mohamad, N.S.; Kasolang, S. Optimized characterization of response surface methodology on lubricant with titanium oxide nanoparticles. Ind. Lubr. Tribol. 2017, 69, 387–392. [Google Scholar] [CrossRef]
- Li, L.; Ma, Q.; Wang, S.; Song, S.; Li, B.; Guo, R.; Cheng, X.; Cheng, Q. Photocatalytic performance and degradation mechanism of aspirin by TiO2 through response surface methodology. Catalysts 2018, 8, 118. [Google Scholar] [CrossRef] [Green Version]
- KC, C.; Prabhu, T.N.; Kiran, R.R.S.; Krishna, R.H. Applications of artificial neural network and Box-Behnken Design for modelling malachite green dye degradation from textile effluents using TiO2 photocatalyst. Environ. Eng. Res. 2021, 27, 200553. [Google Scholar] [CrossRef]
- Tetteh, E.K.; Rathilal, S.; Naidoo, D.B. Photocatalytic degradation of oily waste and phenol from a local South Africa oil refinery wastewater using response methodology. Sci. Rep. 2020, 10, 8850. [Google Scholar] [CrossRef]
- Yap, H.C.; Pang, Y.L.; Lim, S.; Lai, C.W.; Abdullah, A.Z. Enhanced sonophotocatalytic degradation of paracetamol in the presence of Fe-doped TiO2 nanoparticles and H2O2. Environ. Earth Sci. 2020, 79, 457. [Google Scholar] [CrossRef]
- Sun, S.; Ding, H.; Hou, X. Preparation of CaCO3-TiO2 composite particles and their pigment properties. Materials 2018, 11, 1131. [Google Scholar] [CrossRef] [PubMed] [Green Version]
- Kim, W.T.; Choi, W.Y. Fabrication of TiO2 photonic crystal by anodic oxidation and their optical sensing properties. Sens. Actuators A Phys. 2017, 260, 178–184. [Google Scholar] [CrossRef]
- Musial, J.; Krakowiak, R.; Mlynarczyk, D.T.; Goslinski, T.; Stanisz, B.J. Titanium dioxide nanoparticles in food and personal care products—What do we know about their safety? Nanomaterials 2020, 10, 1110. [Google Scholar] [CrossRef]
- Tareen, A.K.; Khan, K.; Aslam, M.; Liu, X.; Zhang, H. Confinement in two-dimensional materials: Major advances and challenges in the emerging renewable energy conversion and other applications. Prog. Solid State Chem. 2021, 61, 100294. [Google Scholar] [CrossRef]
- Ameur, N.; Bachir, R.; Bedrane, S.; Choukchou-Braham, A. A Green Route to Produce Adipic Acid on TiO2–Fe2O3 Nanocomposites. J. Chin. Chem. Soc. 2017, 64, 1096–1103. [Google Scholar] [CrossRef]
- Pérez-Larios, A.; Rico, J.L.; Anaya-Esparza, L.M.; Vargas, O.A.G.; González-Silva, N.; Gómez, R. Hydrogen production from aqueous methanol solutions using Ti–Zr mixed oxides as photocatalysts under UV irradiation. Catalysts 2019, 9, 938. [Google Scholar] [CrossRef] [Green Version]
- Lin, L.; Wang, H.; Xu, P. Immobilized TiO2-reduced graphene oxide nanocomposites on optical fibers as high performance photocatalysts for degradation of pharmaceuticals. Chem. Eng. J. 2017, 310, 389–398. [Google Scholar] [CrossRef] [Green Version]
- Li, F.; Huang, Y.; Peng, H.; Cao, Y.; Niu, Y. Preparation and Photocatalytic Water Splitting Hydrogen Production of Titanium Dioxide Nanosheets. Int. J. Photoenergy 2020, 2020, 3617312. [Google Scholar] [CrossRef]
- Eidsvåg, H.; Bentouba, S.; Vajeeston, P.; Yohi, S.; Velauthapillai, D. TiO2 as a photocatalyst for water splitting—An experimental and theoretical review. Molecules 2021, 26, 1687. [Google Scholar] [CrossRef]
- Abel, S.; Jule, L.T.; Belay, F.; Shanmugam, R.; Dwarampudi, L.P.; Nagaprasad, N.; Krishnaraj, R. Application of Titanium Dioxide Nanoparticles Synthesized by Sol-Gel Methods in Wastewater Treatment. J. Nanomater. 2021, 2021, 3039761. [Google Scholar] [CrossRef]
- Lee, J.; Seong, S.; Jin, S.; Jeong, Y.; Noh, J. Synergetic photocatalytic-activity enhancement of lanthanum doped TiO2 on halloysite nanocomposites for degradation of organic dye. J. Ind. Eng. Chem. 2021, 100, 126–133. [Google Scholar] [CrossRef]
- Rao, T.N.; Hussain, I.; Anwar, M.S.; Koo, H. Photocatalytic degradation kinetics of pesticide residues in different pH waters using metal-doped metal oxide nanoparticles. EQA Int. J. Environ. Qual. 2020, 36, 37–44. [Google Scholar] [CrossRef]
- Martínez, C.P.C.; Ortega, I.A.A.; Sarmiento, H.A.R.; Morales, F.J.T.; Romero, J.R.G. Photocatalytic degradation of the 2,4-dichlorophenoxyacetic acid herbicide using supported iridium materials. Cienc. Desarro. 2021, 12, 125–134. [Google Scholar] [CrossRef]
- da Cunha, R.; do Carmo Batista, W.V.F.; de Oliveira, H.L.; dos Santos, A.C.; dos Reis, P.M.; Borges, K.B.; Martelli, P.B.; Furtado, C.A.; de Fátima Gorgulho, H. Carbon Xerogel/TiO2 composites as photocatalysts for acetaminophen degradation. J. Photochem. Photobiol. A Chem. 2021, 412, 113248. [Google Scholar] [CrossRef]
- Jallouli, N.; Elghniji, K.; Trabelsi, H.; Ksibi, M. Photocatalytic degradation of paracetamol on TiO2 nanoparticles and TiO2/cellulosic fiber under UV and sunlight irradiation. Arab. J. Chem. 2017, 10, S3640–S3645. [Google Scholar] [CrossRef] [Green Version]
- Rimoldi, L.; Meroni, D.; Falletta, E.; Ferretti, A.M.; Gervasini, A.; Cappelletti, G.; Ardizzone, S. The role played by different TiO2 features on the photocatalytic degradation of paracetamol. Appl. Surf. Sci. 2017, 424, 198–205. [Google Scholar] [CrossRef]
- Inger, M.; Dobrzyńska-Inger, A.; Rajewski, J.; Wilk, M. Optimization of ammonia oxidation using response surface methodology. Catalysts 2019, 9, 249. [Google Scholar] [CrossRef] [Green Version]
- Hegyi, A.; Szilagyi, H.; Grebenișan, E.; Sandu, A.V.; Lăzărescu, A.-V.; Romila, C. Influence of TiO2 Nanoparticles Addition on the Hydrophilicity of Cementitious Composites Surfaces. Appl. Sci. 2020, 10, 4501. [Google Scholar] [CrossRef]
- Pérez-Larios, A.; Torres-Ramos, I.; Zanella, R.; Rico, J.L. Ti-Co mixed oxide as photocatalysts in the generation of hydrogen from water. Int. J. Chem. React. Eng. 2022, 20, 129–140. [Google Scholar] [CrossRef]
- Li, S.; Yang, Y.; Su, Q.; Liu, X.; Zhao, H.; Zhao, Z.; Li, J.; Jin, C. Synthesis and photocatalytic activity of transition metal and rare earth element co-doped TiO2 nano particles. Mater. Lett. 2019, 252, 123–125. [Google Scholar] [CrossRef]


| Variables | Factor | Range and Established Levels | ||
|---|---|---|---|---|
| −1 | 0 | 1 | ||
| XA | ACTP concentration 1 | 20 | 30 | 40 |
| XD | Catalyst dosageTiO2 2 | 50 | 100 | 150 |
| XpH | pH of solution | 4 | 7 | 10 |
| Factor | Effect | Std.Err. | t (27) | p |
|---|---|---|---|---|
| Mean/Interc. | 87.117 | 0.977 | 89.178 | 0.000 |
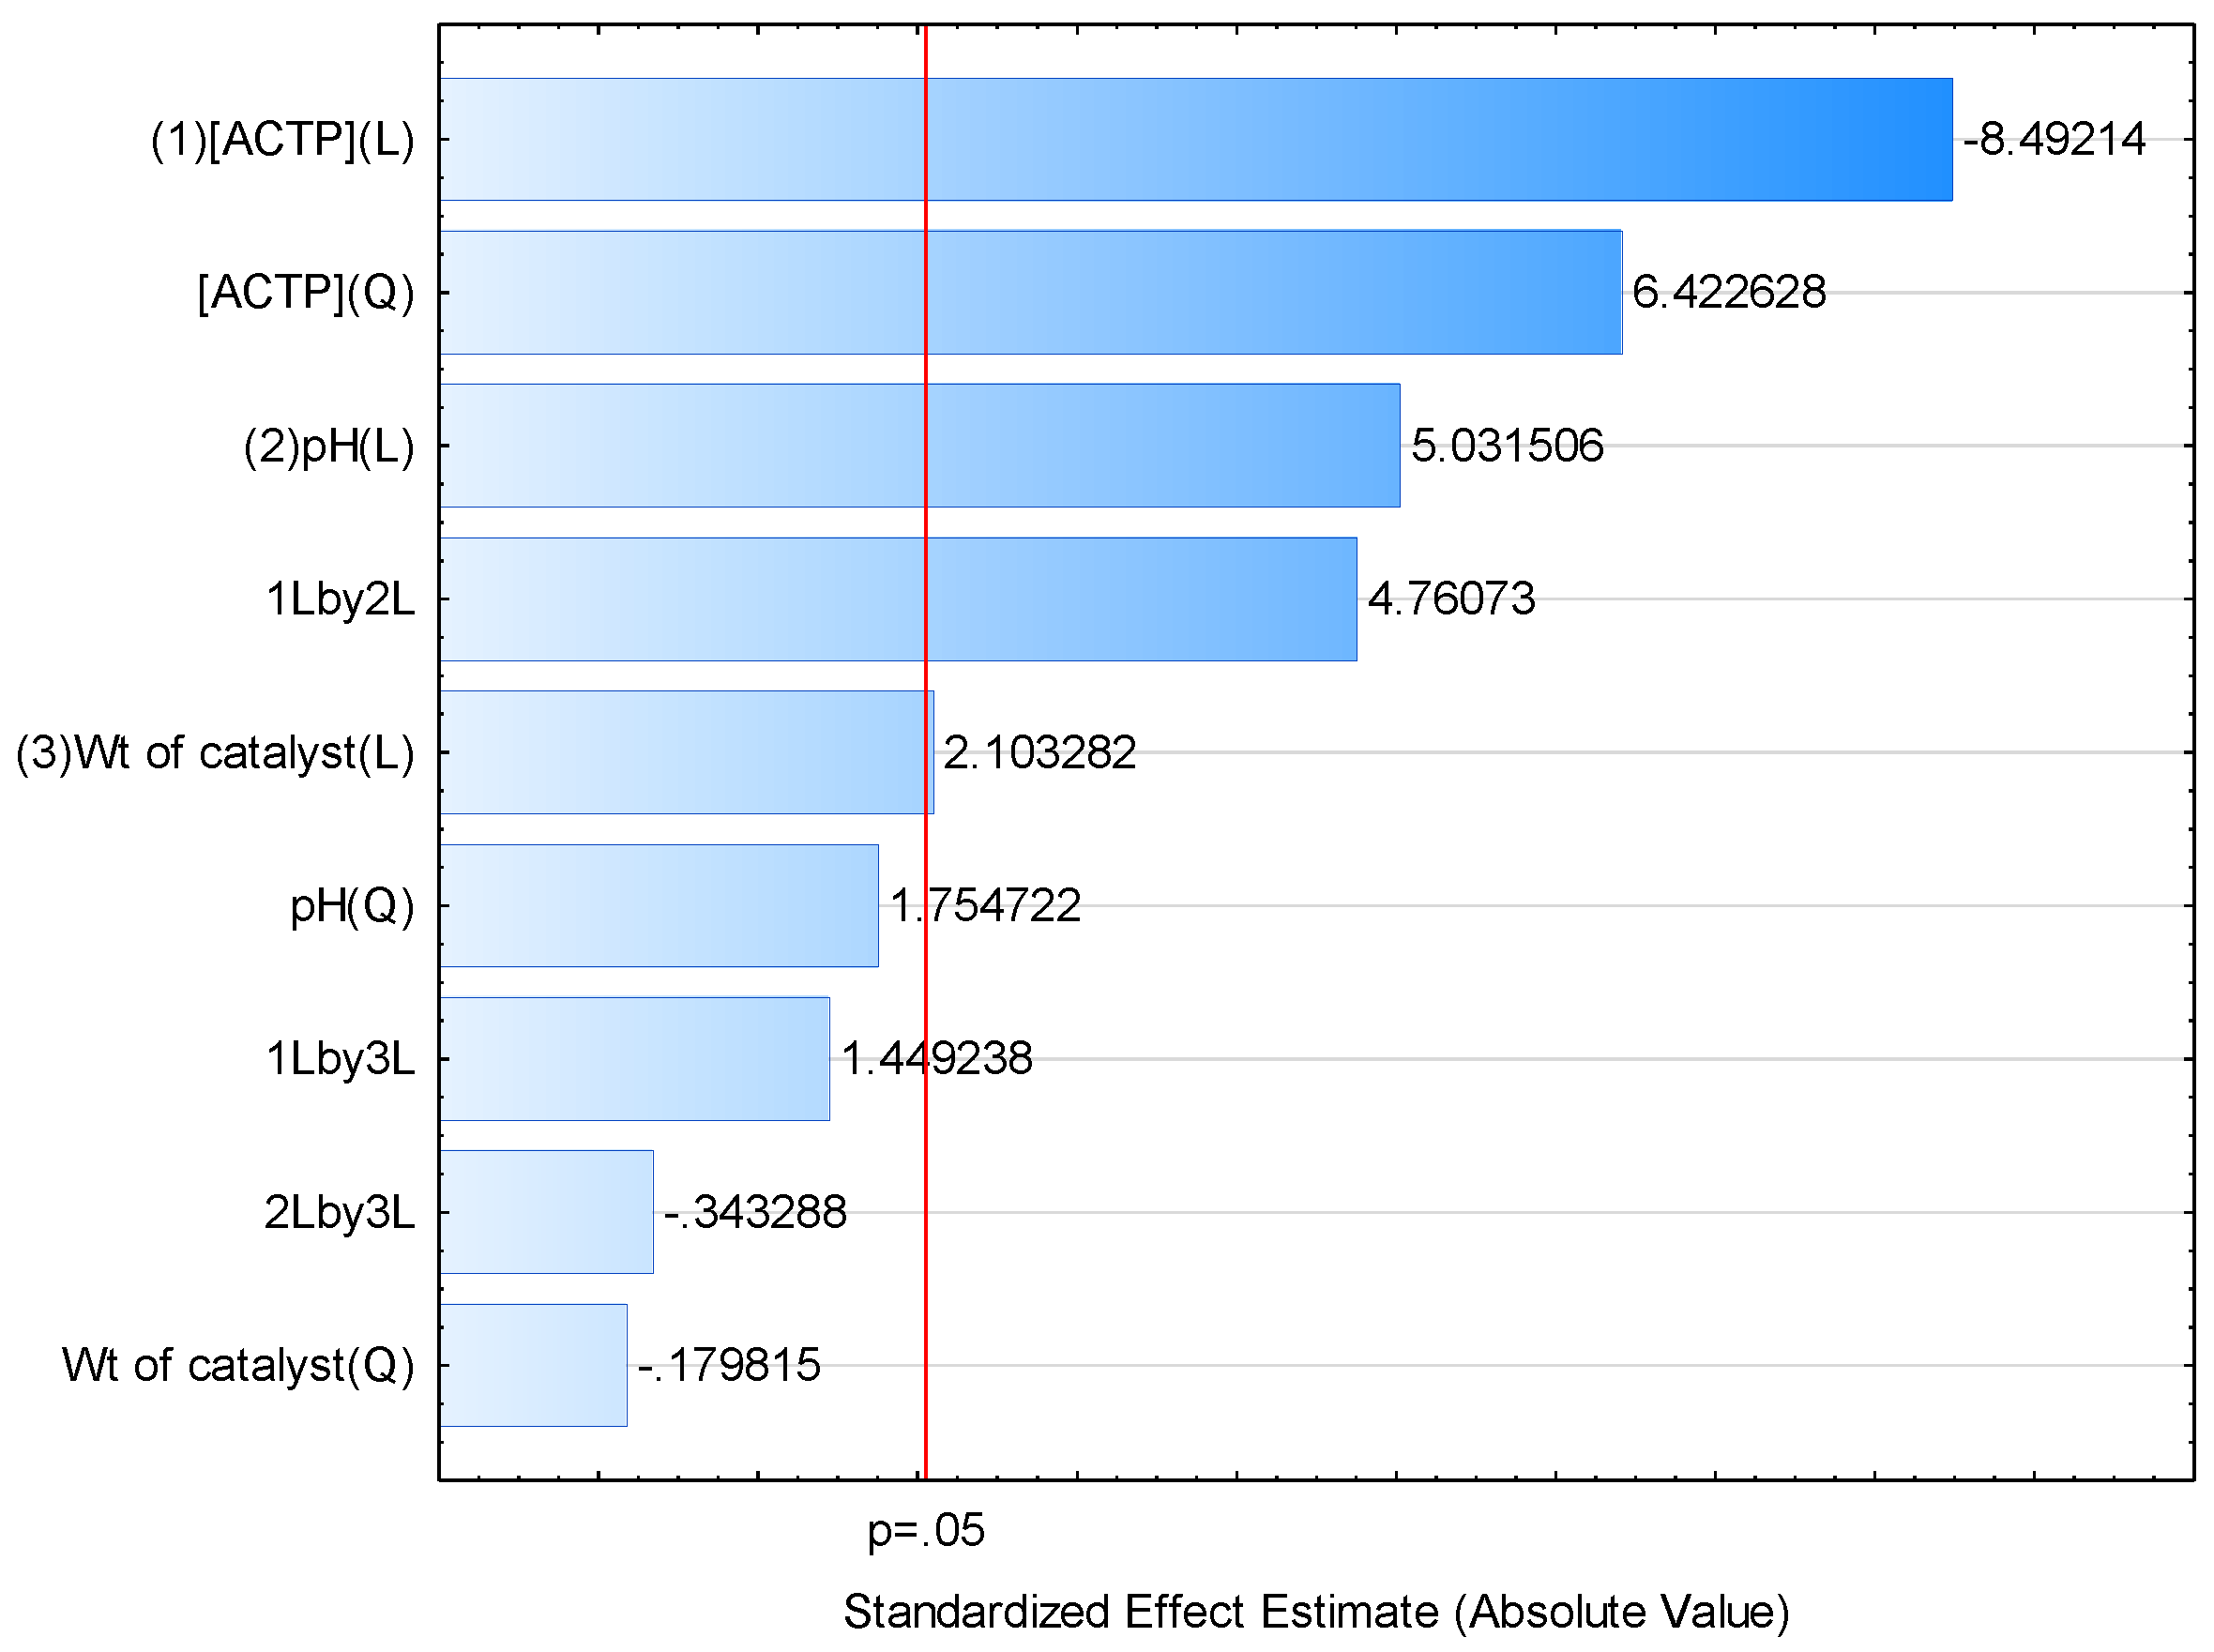
| (1) [ACTP] (L) | −20.361 | 2.398 | −8.492 | 0.000 |
| [ACTP] (Q) | 11.037 | 1.718 | 6.423 | 0.000 |
| (2) pH (L) | 12.128 | 2.41 | 5.032 | 0.000 |
| pH (Q) | 3.03 | 1.727 | 1.755 | 0.091 |
| (3) Wt of catalyst (L) | 4.934 | 2.346 | 2.103 | 0.045 |
| Wt of catalyst (Q) | −0.309 | 1.718 | −0.18 | 0.859 |
| 1L by 2L | 16.57 | 3.481 | 4.761 | 0.000 |
| 1L by 3L | 4.832 | 3.334 | 1.449 | 0.159 |
| 2L by 3L | −1.133 | 3.3 | −0.343 | 0.734 |
| Factor | Level Factor | Predicted Efficiency | Desirability Value | −95% CI Efficiency | +95% CI Efficiency |
|---|---|---|---|---|---|
| ACTP concentration 1 | 35 | 99.034 | 1.000 | 93.062 | 105.006 |
| Catalyst dosageTiO2 2 | 150 | ||||
| pH of solution | 10 |
| Factor | Regression Coefficients | Value | Value |
|---|---|---|---|
| Constant | 63.005 | 0 | 0 |
| (1) [ACTP] (L) | 3.188 | 35 | 111.569 |
| [ACTP] (Q) | −0.11 | 1225 | −135.202 |
| (2) pH (L) | −1.174 | 10 | −11.736 |
| pH (Q) | −0.337 | 100 | −33.662 |
| (3) Wt of catalyst (L) | −0.094 | 150 | −14.084 |
| Wt of catalyst (Q) | 0 | 22,500 | 2.781 |
| 1L by 2L | 0.276 | 350 | 96.661 |
| 1L by 3L | 0.005 | 5250 | 25.366 |
| 2L by 3L | −0.004 | 1500 | −5.664 |
| Predicted | 99.034 | ||
| −95% Conf. | 93.062 | ||
| +95% Conf. | 105.006 |
Publisher’s Note: MDPI stays neutral with regard to jurisdictional claims in published maps and institutional affiliations. |
© 2022 by the authors. Licensee MDPI, Basel, Switzerland. This article is an open access article distributed under the terms and conditions of the Creative Commons Attribution (CC BY) license (https://creativecommons.org/licenses/by/4.0/).
Share and Cite
Marizcal-Barba, A.; Sanchez-Burgos, J.A.; Zamora-Gasga, V.; Perez Larios, A. Study of the Response Surface in the Photocatalytic Degradation of Acetaminophen Using TiO2. Photochem 2022, 2, 225-236. https://doi.org/10.3390/photochem2010017
Marizcal-Barba A, Sanchez-Burgos JA, Zamora-Gasga V, Perez Larios A. Study of the Response Surface in the Photocatalytic Degradation of Acetaminophen Using TiO2. Photochem. 2022; 2(1):225-236. https://doi.org/10.3390/photochem2010017
Chicago/Turabian StyleMarizcal-Barba, Adriana, Jorge Alberto Sanchez-Burgos, Victor Zamora-Gasga, and Alejandro Perez Larios. 2022. "Study of the Response Surface in the Photocatalytic Degradation of Acetaminophen Using TiO2" Photochem 2, no. 1: 225-236. https://doi.org/10.3390/photochem2010017
APA StyleMarizcal-Barba, A., Sanchez-Burgos, J. A., Zamora-Gasga, V., & Perez Larios, A. (2022). Study of the Response Surface in the Photocatalytic Degradation of Acetaminophen Using TiO2. Photochem, 2(1), 225-236. https://doi.org/10.3390/photochem2010017