Article

Mass-Resolved Momentum Imaging of Three Dichloroethylene Isomers by Femtosecond Laser-Induced Coulomb Explosion

1
Kansai Photon Science Institute, National Institutes for Quantum Science and Technology, Kizugawa 619-0215, Japan
2
Japan Atomic Energy Agency, Tokai-mura, Ibaraki 319-1195, Japan
3
Department of Chemistry, School of Science and Engineering, Kindai University, Higashi-Osaka 577-8502, Japan
*
Author to whom correspondence should be addressed.
Photochem 2022, 2(3), 798-809; https://doi.org/10.3390/photochem2030051
Submission received: 18 August 2022 / Revised: 11 September 2022 / Accepted: 13 September 2022 / Published: 16 September 2022

Abstract

:
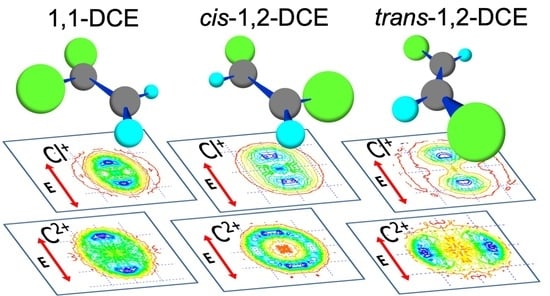
Coulomb explosion experiments using linearly polarized intense 60 fs laser pulses were conducted for structural characterization of three dichloroethylene (DCE) isomers, 1,1-DCE, cis-1,2-DCE, and trans-1,2-DCE. Under relatively low laser intensity at 1.8 × 10¹⁴ W/cm2, mass-resolved momentum imaging (MRMI) for selected fragment ions of 35Cl+ and C2+ revealed different patterns for the three isomers. The C2+ ion fragmented from multiply charged trans-1,2-DCE was forced to leave perpendicularly to the direction of the laser polarization, due to recoil forces from adjacent cations. In contrast, the fast ions of C2+ from cis-1,2-DCE exhibited an isotropic distribution, whereas the fast ions of C2+ from 1,1-DCE recoiled along the laser polarization together with the slow C2+ ions, and thereby distinction of the three isomers was demonstrated. Coulomb explosion occurs predominantly at specific orientation, which is useful for potential applications of MRMI analysis to molecular structure assays.

Graphical Abstract

1. Introduction

Coulomb explosion is a molecular process in a multiply charged ion, resulting in explosive release of fragment ions by their Coulomb repulsion. Tracing back trajectories of the fragment ions, molecular structure of the nascent parent ion can be reconstructed to understand the structure and dynamics of the multiply charged ion. Coulomb explosion imaging (CEI) is a technique pioneered by Naaman and co-workers to study geometric structures of small molecules, where valence electrons are stripped off from a projectile ion by a thin foil of gold [1]. This technique has been developed to identify each of the chiral pair of epoxide molecules [2]. Momentum analysis of fragment ions by CEI has been applied by introducing intense ultrafast laser pulses for ionization [3,4,5,6,7,8,9,10]. Thus far, applications are found for small molecules such as water vapor molecules, H2O [3] and D2O [4], sulfur dioxide, SO2 [4], carbon disulfide, CS2 [5], dichloromethane, CH2Cl2 [6], and weakly bound clusters of N2Ar, O2Ar, and O2Xe [7]. This has been extended to relatively large molecules of 3,5-dibromo-3′,5′-difluoro-4′-cyanobiphenyl [8] and group-6 metal hexacarbonyls, Cr(CO)6, Mo(CO)6, and W(CO)6 [9].
Structural characterization of reactive chemical species such as atomic clusters and reaction intermediates has long been a central subject in chemistry, where fragility and reactivity have thwarted attempts to make a crystalline form necessary for the X-ray diffraction analysis to identify definite molecular structures [11,12]. As a recent example, we refer to a series of photo-sensitive sp-conjugated polyyne-iodine adducts, C2nH2I6 (n = 5–9), which have been identified only in solutions by UV–VIS absorption, 13C-NMR, and infrared absorption (FTIR) spectroscopy [13,14,15]. Despite the analysis of chemical shifts [13] and vibrational-mode frequencies [14], positions of six iodine atoms in the molecular adduct, namely, the molecular structure, could not be located unequivocally on the experimental bases. Recently, an sp-hybridized carbon molecule of diiodediacetylene, I(C≡C)2I, has been studied by Coulomb explosion experiments to find anisotropic angular distribution of fragment ions [16]. The experimental results imply that Coulomb explosion experiments would be able to characterize the structure of such fragile or reactive molecules, if they could be introduced into a high vacuum. For the investigation of molecular structures in such complexes as organic halogen adducts, we focus herein on the gas phase experiment utilizing mass-resolved momentum imaging (MRMI) for fragment ions generated upon Coulomb explosion.
Characterization of isomeric forms in a molecular species is one of the challenging issues in Coulomb explosion experiments [17,18,19,20,21,22,23,24,25]. Thus far, distinction of enantiomers of CHBrClF and CF3CHBrCl has been reported [17,18,19]. Instantaneous chirality induced by zero-point vibrations has been observed for a symmetric molecule of CD4 [20]. For structural isomers, distinction of 2,6- and 3,5-difluoroiodobenzene isomers has been demonstrated [21]. Recently, laser-induced alignment has been combined with CEI for determination of enantiomeric state of an axially chiral molecule (3,5-dibromo-3′,5′-diflouro-4′-cyanobiphenyl molecule) [22], and identification of difluoroiodobenzene isomers [23] and dihydroxybromobenzene isomers [23]. Yatsuhashi et al. conducted Coulomb explosion experiments on the isomers of dichloroethylene (DCE) C2H2Cl2, namely, 1,1-DCE, cis-1,2-DCE, and trans-1,2-DCE, using linearly polarized intense femtosecond laser pulses [24]. From dissimilarity observed for angular distributions of fragment ions, e.g., 35Cly+ (y = 1,2), 12Cz+ (z = 2,3), and H+, the authors concluded that trans-1,2-DCE was clearly distinguishable from the other two [24]. Additionally, for a similar species of dibromoethylene C2H2Br2, the cis-1,2 and trans-1,2 isomers have been identified with X-ray-induced Coulomb explosion, but the 1,1-isomer has not been treated [25]. In order to complete a protocol for discrimination of all the three isomers in DCE, an additional tool is necessary for distinction between the two isomers, cis-1,2-DCE and 1,1-DCE.
In this work, three isomers of DCE were examined by the momentum imaging for fragment ions, on the basis of new experimental data from laser-induced Coulomb explosion. In addition to a similar laser-intensity condition to the previous experiments [24], 1.7 × 10¹⁵ W/cm2 (1.7 PW/cm2), we studied a condition of an order-of-magnitude-lower intensity, 1.8 × 10¹⁴ W/cm2 (0.18 PW/cm2), where saturation of ionization is avoided whereas the high degree of geometrical alignment is maintained. MRMI, i.e., simultaneous mapping of angular and velocity distributions for fragment ions [26,27,28], is demonstrated to be a powerful tool for identification of the three isomers of DCE.

2. Experiment and Analysis

2.1. Measurement of Time-of-Flight (TOF) Spectra

Figure 1 shows a schematic diagram of the experimental setup. Linearly polarized femtosecond laser pulses (pulse width ~60 fs, wavelength ~795 nm, pulse energy ~3 mJ/pulse) from a Ti:sapphire laser system (Thales α10US-A, France) at a repetition rate of 10 Hz were led through the neutral density (ND) filter to adjust the pulse energy, and focused in a vacuum chamber by using a plano-convex lens (f = 254 mm at 785 nm). The laser intensity at the focus was estimated on the basis of drift momentum of D2+ produced by ionization of gaseous D2 molecules in a circularly polarized laser field [29,30].
Commercially available reagents, 1,1-DCE (Aldrich, 99%, Tokyo, Japan), cis-1,2-DCE (Wako Chemicals, 99.0%, Tokyo, Japan), and trans-1,2-DCE (Aldrich, 98%, Tokyo, Japan), were degassed by repeated freeze–thaw cycles. The vapor molecules were introduced into the vacuum chamber through a pulsed valve (Parker Hight-Speed Pulse Valve, Series 9, USA). To avoid negative effects on the momentum images due to clustering and space charge effects, the backing pressure of the pulsed valve was kept below 1.3 × 10³ Pa. The pressure in the vacuum chamber was below 8 × 10⁻⁵ Pa throughout the experiments. The present condition has no relevance to filamentation or plasma-induced terahertz radiation at relatively high pressure [31].
Photoinduced ions at the laser focus were extracted in an electric field of 0.2 kV/cm, then accelerated in the second electric field of 1.9 kV/cm with a standard Wiley–McLaren-type mass spectrometer [32]. In order to avoid concomitant detection of excess ions produced in front of and behind the laser focus, a slit of 0.5 mm was placed on the extraction electrode (EXT) [24]. The ions passing through the slit were mass-separated during the travel through a field-free region of 1.5 m, and detected by a micro-channel-plate detector (MCP, Jordan C-0701, φ 18 mm). The signal was averaged for 1000 laser shots by using a digitizing oscilloscope (LeCroy WaveRunner 104Xi-A, 1 GHz, USA).
For a limited surface area on the MCP detector, only a part of the ions exploding forward and backward to the detector was counted as signals. Taking the detection geometry into account, the ion intensity was plotted as a function of angle θ between the direction of the laser polarization and the direction of the flight axis toward the MCP detector (see the inset in Figure 1) to obtain the angular distribution of fragment ions.

2.2. Analysis

The polarization angle of the linearly polarized laser field was rotated from θ = 0° to 90° by an interval of 5° using a zeroth-order half-wave plate mounted on a motorized rotary stage (Thorlabs PRM1/MZ8E, USA). A series of time-of-flight (TOF) spectra were recorded by changing the polarization angle, from which the angular distribution was deduced for two fragment ions of 35Cl+ and C2+.
Using the same set of TOF spectra, the momentum image (MRMI) was constructed [26,27,28]. Equation (1) represents the relation between the displacement of flight times, Δt, from the central position of a peak in the TOF spectrum (p// = 0) for a fragment ion and the momentum due to Coulomb explosion, p//, in parallel with the flight axis. Transformation from the TOF spectrum to the momentum distribution was performed by Equation (1):
p// = qFΔt,
where q denotes the charge of the fragment ion and F the strength of the extraction electric field [28]. Momentum distributions thus calculated were plotted as a function of the laser polarization angle to obtain a contour map, representing both the angular distribution and the velocity distribution in a single 2D image. To obtain better statistics, the distributions in the positive and negative momentum ranges are averaged and plotted in the first quadrant in the MRMI map. On the basis of the symmetry with respect to the laser polarization direction, the momentum distributions in the three other quadrants are the same as that in the first quadrant.

3. Results

3.1. TOF Spectra

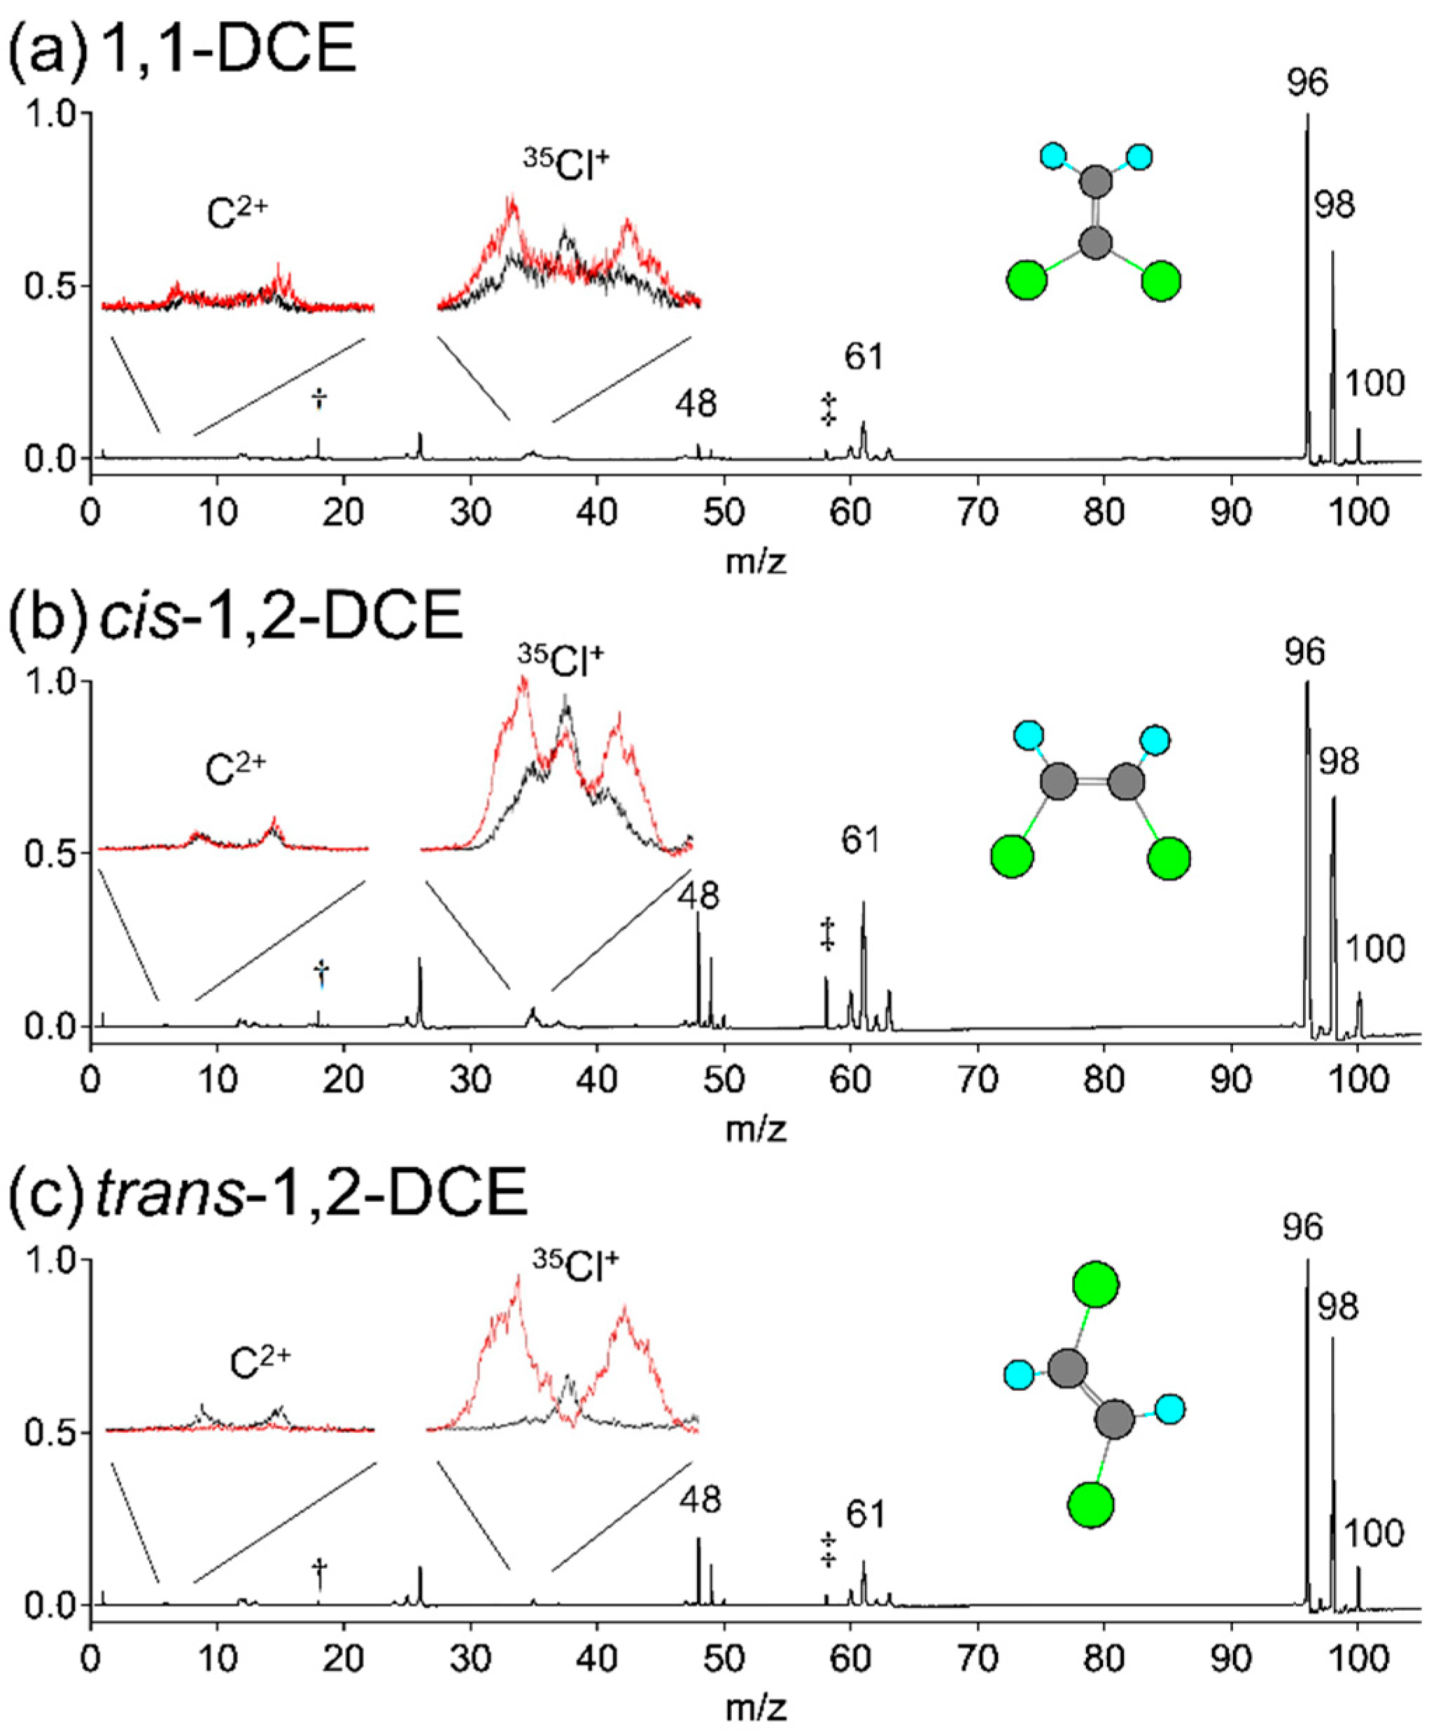
Figure 2 shows TOF spectra for three isomers of DCE under the low-laser-intensity condition, 1.8 × 10¹⁴ W/cm2. Laser polarization is set perpendicular to the flight axis. Each spectrum is normalized to the peak intensity of the ion signal for C2H235Cl2+ (m/z 96). Major peaks commonly observed for the three isomers are C2H2Cl2+ (m/z 96, 98, 100), C2H2Cl+ (m/z 61, 63), C2HCl+ (m/z 60, 62), C2H2Cl22+ (m/z 48, 49, 50), and C2H2+ (m/z 26). Minor but important peaks are noted for atomic ions of Cl+ (m/z 35, 37), C+ (m/z 12), C2+ (m/z 6), and H+ (m/z 1).
Inset spectra in Figure 2 depict split TOF profiles for C2+ and 35Cl+ as a result of Coulomb explosion. In a multiply charged molecular ion, nascent ionic fragments recoil to each other by repulsive forces to leave the center of mass of the molecular framework, acquiring additional velocity components. Deviation, Δt, from the center of symmetry of the TOF peak profile is proportional to the magnitude of parallel momentum, p//, forward or backward with respect to the direction toward the MCP detector (See Equation (1) for the relation between the magnitude of momentum and the splitting). Traces in red are the spectra with laser polarization parallel to the flight axis. A split pair of peaks for 35Cl+ is commonly observed for the three isomers of DCE, as seen in traces in red in Figure 2a–c. Black traces of 35Cl+, for which laser polarization is perpendicular to the extraction electric field show smaller splitting in Figure 2a,b or no split component in Figure 2c. The smaller the splitting, the slower the velocity acquired from the Coulomb explosion.
For two selected ion signals of 35Cl+ (m/z 35) and C2+ (m/z 6), angular distributions are obtained from a series of the TOF data measured in the present work and compared with those in the preceding work [24]. Concerning the signal at m/z 12 mainly of C+, possibilities of overlapping signals of doubly charged carbon dimer ions of C22+, and triply charged chlorine ions of 35Cl3+ (m/z 11.7) and 37Cl3+ (m/z 12.3) cannot be ruled out. Thus, we choose C2+ rather than C+.

3.2. Angular Distribution

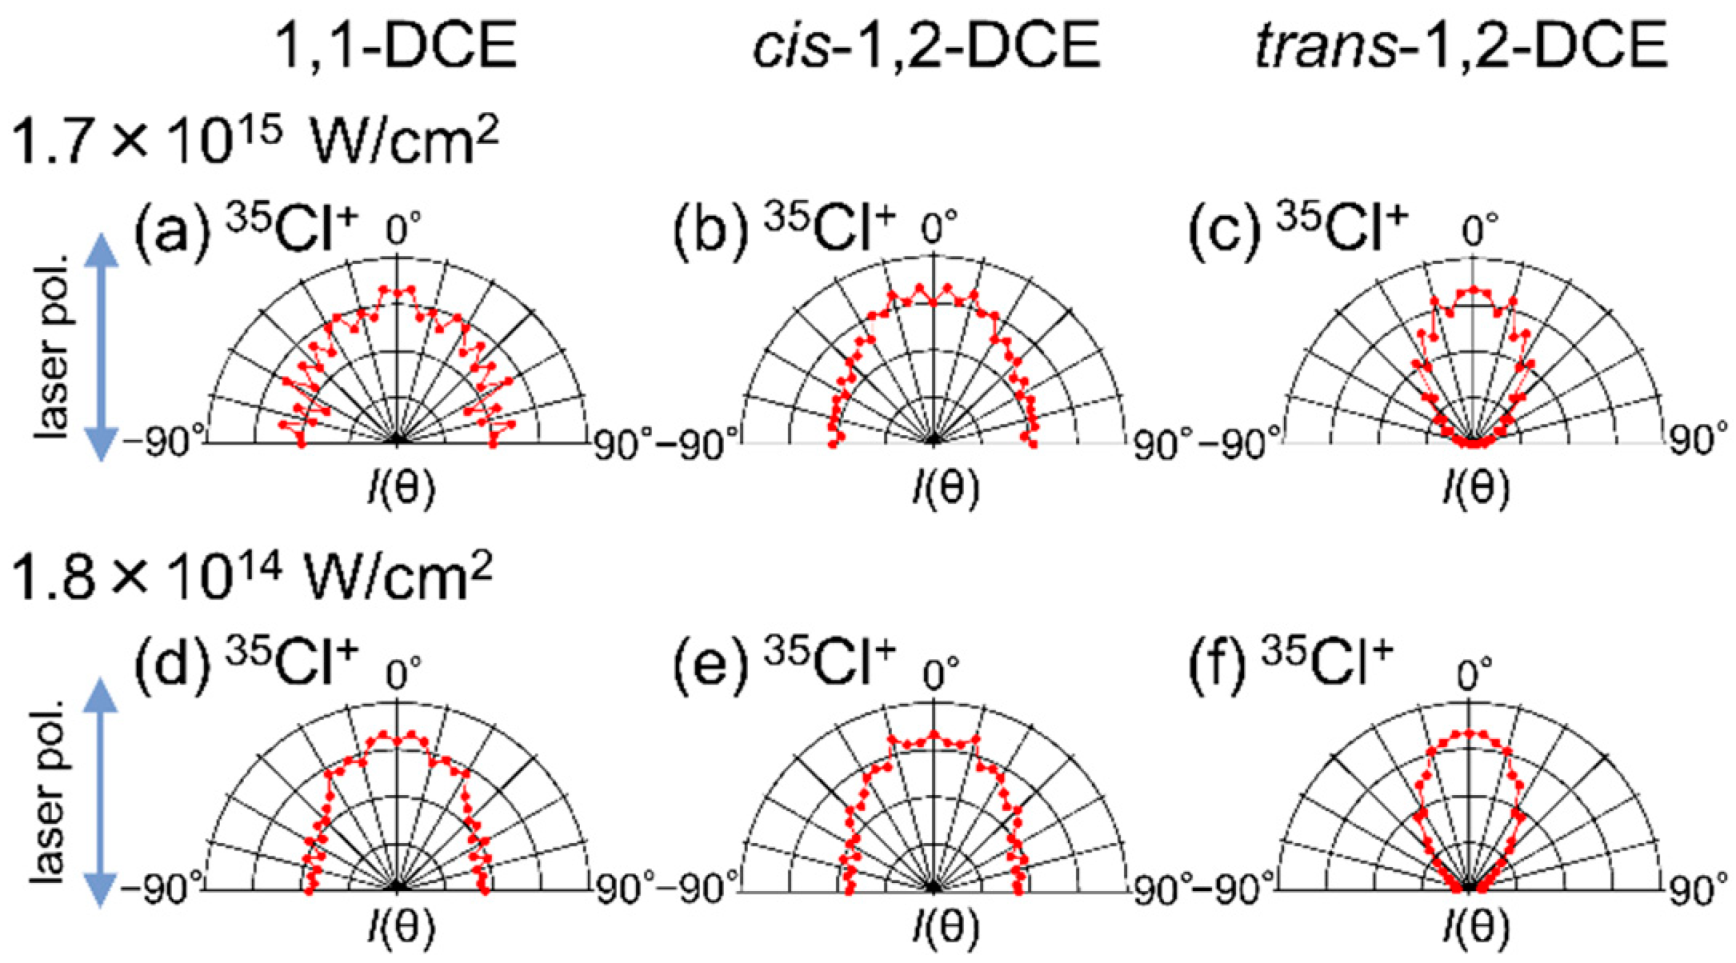
35Cl+: Angular distributions of 35Cl+ generated upon Coulomb explosion are shown in Figure 3 for three isomers of DCE. At a glance, trans-1,2-DCE can be easily identified by its little intensity in the direction of ±90° both under the high- (Figure 3c) and low- (Figure 3f) laser-intensity conditions. In contrast, it seems to be difficult to distinguish 1,1-DCE (Figure 3a,d) from cis-1,2-DCE (Figure 3b,e). At this point, the situation has not been very much improved for identification of the isomers. Our new experimental data on 35Cl+ in Figure 3 merely reproduce the reported angular distributions [24].
In more detail, under the high-laser-intensity condition in Figure 3a–c, 1,1-DCE (Figure 3a) exhibits non-vanishing components in all directions, larger by a factor of ~1.5 in 0° (parallel) than in ±90° (perpendicular). Similar distribution is observed for cis-1,2-DCE (3b). A qualitative difference is noted for trans-1,2-DCE (Figure 3c), exhibiting an anisotropic distribution with a strong parallel component at 0° and no perpendicular component at ±90°, indicating that the 35Cl+ ion in trans-1,2-DCE is ejected solely along the direction parallel to the laser polarization.
The characteristic feature under the high-laser-intensity condition is found also under the low-laser-intensity condition in Figure 3d–f. Two isomers, 1,1-DCE (Figure 3d) and cis-1,2-DCE (Figure 3e), exhibit oval distribution, having a slightly larger component in the parallel direction at 0°. In contrast, trans-1,2-DCE (Figure 3f) exhibits again a distinctly different distribution from the other two isomers. The predominating distribution at 0° with little component at ±90° for 35Cl+ (Figure 3f) is similar to that observed under the high-laser-intensity condition (Figure 3c). From the angular distribution of 35Cl+, trans-1,2-DCE can be identified, but discrimination between 1,1-DCE and cis-1,2-DCE remains difficult.
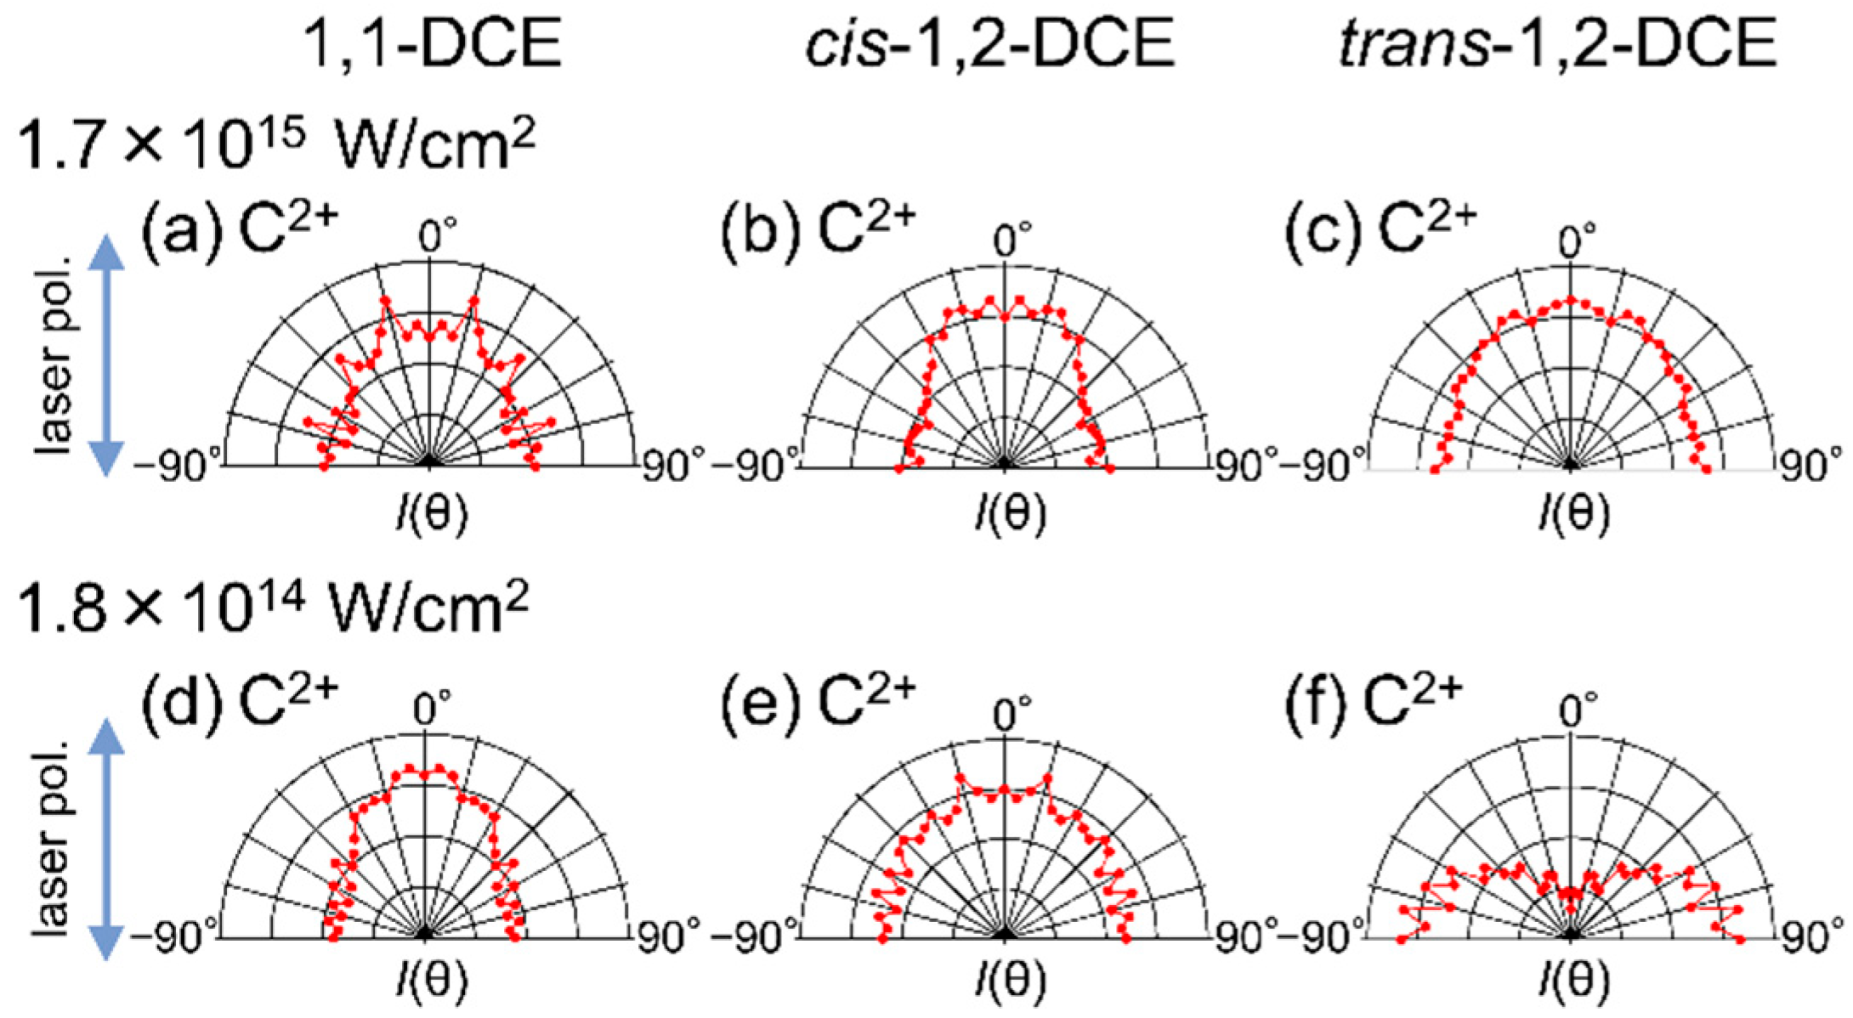
C2+: Under the high-laser-intensity condition at 1.7 × 10¹⁵ W/cm2 in Figure 4, angular distributions of C2+ for 1,1-DCE (Figure 4a) and cis-1,2-DCE (Figure 4b) resemble each other, i.e., a larger component in 0° (parallel), whereas isotropic distribution is noted for trans-1,2-DCE (Figure 4c). According to the preceding work, trans-1,2-DCE releases more C2+ ions into the direction perpendicular to the laser polarization under the moderate laser intensity at 1.3 × 10¹⁵ W/cm2, whereas an isotropic distribution is seen under the extremely high laser intensity at 2.2 × 10¹⁵ W/cm2 [24]. The present experimental condition, 1.7 × 10¹⁵ W/cm2, falls in-between the two conditions in the literature [24], and our result is close to the latter extremity, as shown in Figure 3c.
It is noted that the angular distribution of C2+ for trans-1,2-DCE changes dramatically by lowering the laser intensity to 1.8 × 10¹⁴ W/cm2. In Figure 4f, C2+ ions are emitted mostly in the direction perpendicular to the laser polarization at the angle of ±90° and little emission is seen in the parallel direction at 0°. Even under the condition at the low laser intensity, a difference is not noticeable in Figure 4d,e. Thus, discrimination of the isomers between 1,1-DCE and cis-1,2-DCE is impossible from the angular distribution of the C2+ fragment ion.

3.3. Momentum Image

35Cl+: Using the series of the TOF data used for Figure 3 and Figure 4, MRMI analysis is performed for 35Cl+ and C2+. Since the TOF signals of 35Cl+ and C2+ are well-separated from those of the other ionic species, clean momentum images are obtained. Momentum images of 35Cl+ are presented in Figure 5. In addition to the angular distribution of momentum, the magnitude of momentum for the leaving ion is represented by distance from the origin, i.e., faster at the outer rim and slower around the center. The contour plot stands for the population of ions having a specific direction and a specific velocity. Independently on the laser intensity, two components are discernible in the momentum images for 1,1-DCE (Figure 5a,d) and cis-1,2-DCE (Figure 5b,e), i.e., one for the fast ions traveling forward or backward along the laser polarization, which appear as a split pair of spots at the upper and lower parts of the image, and the other for the slow ions spreading around the center of the image. Therefore, the momentum image of 35Cl+ is not sufficient to distinguish 1,1-DCE and cis-1,2-DCE. In the momentum images for trans-1,2-DCE (Figure 5c,f), only the component of fast ions is discernible along the parallel laser polarization without any slow component.
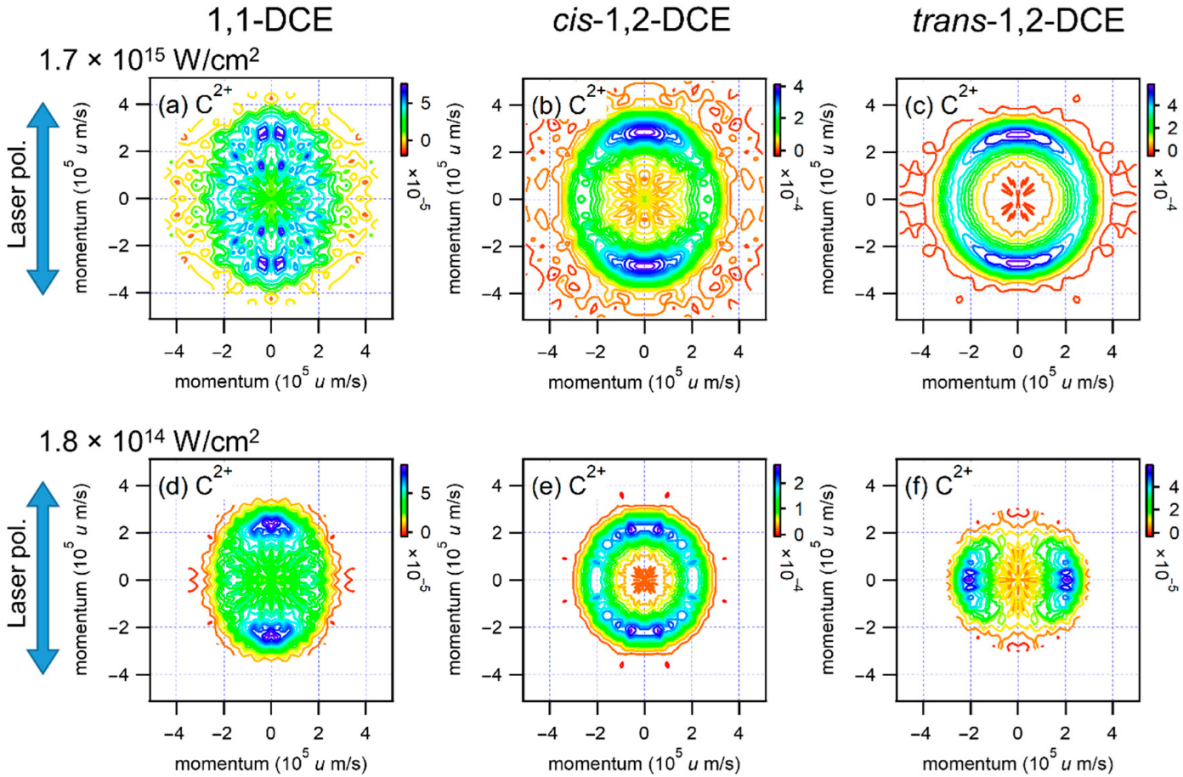
C2+: Using momentum images of C2+ in Figure 6, appreciable difference between two isomers of 1,1-DCE and cis-1,2-DCE is noticed. The image of C2+ for 1,1-DCE (Figure 6a) under the high-laser-intensity condition at 1.7 × 10¹⁵ W/cm2 contains at least two groups of ions, i.e., a group of fast ions slightly polarized in parallel with laser polarization and a group of slow ions locating near the center of the image, as is seen more clearly under the low laser intensity condition in Figure 6d. On the other hand, for cis-1,2-DCE (Figure 6b) and trans-1,2-DCE (Figure 6c), a single component of rather isotropic angular distribution is conspicuous, demonstrating a visible difference between 1,1-DCE (Figure 6a) and the cis (Figure 6b) and trans (Figure 6c) isomers of 1,2-DCE.
At the appropriately low laser intensity, namely, 1.8 × 10¹⁴ W/cm2, momentum images for the three isomers in DCE clearly show different patterns as shown in Figure 6d–f. First, the image of C2+ for 1,1-DCE (Figure 6d) shows again the groups of fast and slow ions. Second, the image for cis-1,2-DCE (Figure 6e) shows a single velocity component of fast ions whose angular distribution is almost isotropic and slightly polarized in the direction along the laser polarization. Finally, a drastic change is noted in the image of C2+ for trans-1,2-DCE (Figure 6f). The single velocity component of fast ions in Figure 6f directs perpendicularly to the laser polarization, exhibiting a sharp contrast to the observation of the isotropic distribution in the high laser-intensity counterpart in Figure 6c.
The magnitude of the momentum, 2.0 × 10⁵ u m/s, for trans-1,2-DCE at the pair of spots with maximum population in Figure 6f, is appreciably smaller than that in Figure 6c, 2.7 × 10⁵ u m/s. This implies that the total charge number of the cation is smaller and/or that enhanced ionization at a deformed molecular structure [33,34] takes place predominantly at the low-laser-intensity condition.
Using the momentum image of the C2+, it is possible to discern the structural isomer of 1,1-DCE from the cis and trans isomers of 1,2-DCE, even under the relatively high-laser-intensity condition. Furthermore, by lowering the laser intensity, in addition to the 1,1-DCE isomer, the pair of cis and trans isomers of 1,2-DCE can be distinguished by differently polarized emission of C2+, i.e., isotropic but slightly polarized in parallel with the laser polarization for cis-1,2-DCE and perpendicularly polarized emission of C2+ from trans-1,2-DCE, as evidenced by the series of momentum images in Figure 6d–f. Under the laser intensity at 1.8 × 10¹⁴ W/cm2, it is demonstrated that all the three isomers in DCE can be identified by the momentum images of the C2+ fragment ion.

4. Discussion

The laser polarization can select molecules at specific orientation upon ionization with a short laser pulse, whereby only a fraction of molecules is preferentially ionized into multiply charged ions for Coulomb explosion. In this case, the angular distribution of fragment ions reflects intrinsic anisotropy of the parent molecule. This selection of molecular geometrical alignment, or the idea of a preferential ionization axis, was proposed for DCE isomers [24,35,36]. Geometrical alignment is determined by orientation-dependent probability of ionization, which primarily depends on the shape of the outer edge of a molecular orbital with respect to the laser polarization [37,38]. However, in the case of multiple ionization, it is difficult to identify which orbitals are contributing. Furthermore, when the chemical bond can be elongated to possibly twice the bond length for the equilibrium geometry in the neutral ground state within the exposure time of an intense laser pulse, probability of multiple ionization is significantly enhanced at an alignment angle in which the chemical bond is parallel to the laser electric field [39]. In addition, dynamical alignment by the interaction between the induced dipole moment and the laser electric field influences significantly the angular distribution of the recoiled fragment ions [40,41,42,43].
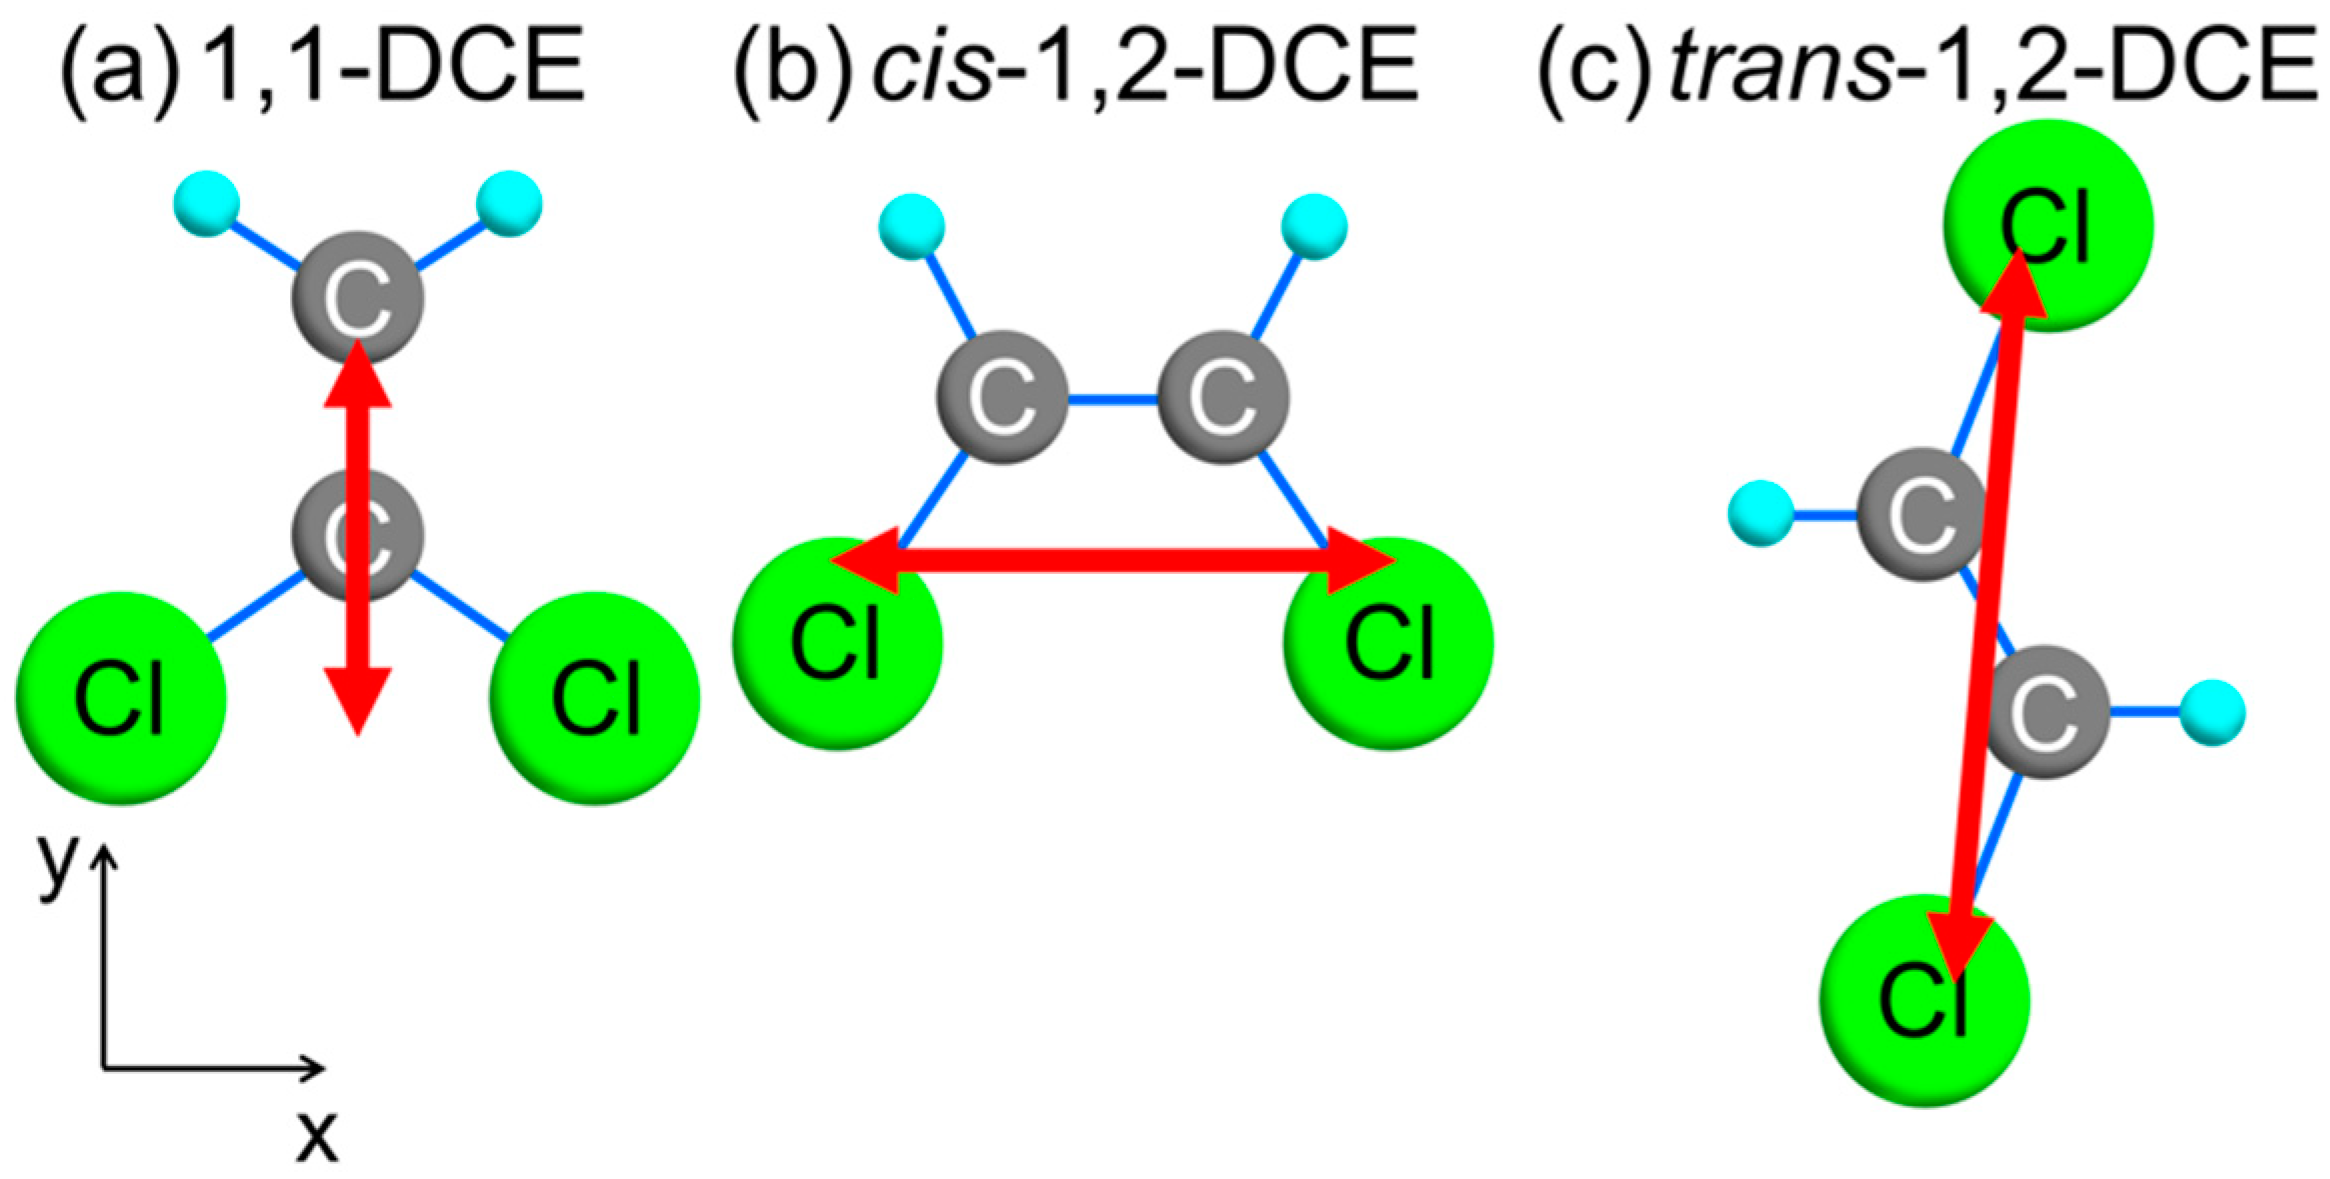
Here, we discuss the momentum distribution of fragment ions of DCE isomers on the basis of the specific molecular orientation upon ionization. We simply assume that the molecules whose most polarizable axis is oriented along the laser polarization are preferentially ionized into multiply charged ions. Anisotropic nature of polarizability of a molecule is represented by a tensor property. The six components of the polarizability tensor, α, are diagonalized to three orthogonal components along the principal axes of the ellipsoid. For a molecule of DCE isomers, two of them along the molecular plane, αxx and αyy, have characteristic values of 42–82 in the unit of cubic Bohr radius, a03, whereas the other component perpendicular to the molecular plane, αzz, is smaller than the two, having a value of ~33.7 commonly for the three DCE isomers [44]. In this work, the principal axis of the largest polarizability among the three components is defined as the most polarizable axis of the target molecule, which is indicated by the solid red arrow in each of Figure 7a–c.

4.1. Momentum Distribution of 35Cl+

Having the momentum parallel to the laser polarization, the fast component of the fragment ion, Cl+, commonly observed for the three isomers of DCE, is released upon ionization of the molecule aligned along the relevant C–Cl bond. Since the leaving Cl+ ion is located at an edge of the molecular framework, the nascent molecular ion of minimum charges for Coulomb explosion is Cl+-(C2H2Cl)+. The slow component of the fragment ion, Cl+, observed for 1,1-DCE in Figure 5a,d and for cis-1,2-DCE in Figure 5b,e is possibly a superposition of Cl+ signals from singly charged molecular ions, Cl+-C2H2Cl. The parallel release of the fast Cl+ ions to the laser polarization might have relevance to the most polarizable axis for cis-1,2-DCE in Figure 7b and for trans-1,2-DCE in Figure 7c (solid arrows in red). However, the close resemblance of split patterns in Figure 5a–f rather indicates a common mechanism where the molecule aligned with its C–Cl bond axis parallel to the laser axis is preferentially ionized into the least multiply charged repulsive pair of ions, C+ and Cl+, for Coulomb explosion. This molecular geometrical alignment along the C–Cl bond is compatible qualitatively with the ionization axis discussed previously [24].

4.2. Momentum Distribution of C2+

For the doubly charged fragment ion, C2+, more than three charges, >+3e, are expected for the molecular ion. The momentum images of C2+ show appreciable differences between 1,1-DCE (Figure 6a,d) and cis-1,2-DCE (Figure 6b,e), which are explainable by the difference in relative positions of carbon atoms in a molecule. In 1,1-DCE, one carbon atom is bonded to two chlorine atoms and the other is located away from the chlorine atoms. The former, locating close to the molecular center of mass, contributes to the isotropic low-velocity (slow) component, and the latter, located at the edge of a molecule, contributes to the anisotropic high-velocity (fast) component. As a result, two types of components emerge in the momentum image in Figure 6a,d. In cis-1,2-DCE, each of the two carbon atoms is bonded to one chlorine atom and both are equivalent in a molecule, and thus the majority of C2+ fragment ions from cis-1,2-DCE constitute a single-velocity component in Figure 6b,e.
The momentum image of C2+ for trans-1,2-DCE in Figure 6f at the low-laser-intensity condition shows a pattern extending in the direction perpendicular to the laser polarization. This makes a sharp contrast to those of C2+ for the other two isomers in Figure 6d,e, which extend more or less in parallel with the direction of laser polarization. To cause C2+ to be Coulomb-exploded, at least one counter cation, namely, a carbon or chlorine ion, is necessary. Regardless of which ion is the counterpart, the repulsive force will point in a direction rather parallel to the laser polarization, considering the stable structure shown in Figure 7c. However, heavy chlorine nuclei locating along the most polarizable axis force the C2+ ion to leave more or less perpendicularly to the axis of laser polarization. The Cl nuclei move slower than the C2+ ion because the mass of Cl (m = 35 or 37) is roughly three times heavier than that of 12C. Thus, the Cl nuclei stay longer near the molecular center of mass, preventing the C2+ from leaving in the direction parallel to the laser polarization. The disturbance by Cl nuclei will cause the trajectory of C2+ to be bent, resulting in deviation from the expected momentum distribution on the basis of the initial geometrical structure. The structural deformation also causes deviated momentum distribution [33,34]. Nevertheless, the initial acceleration determines overall properties of the Coulomb explosion event.

4.3. Molecular Structure Assay

The momentum image of 35Cl+ fragment ions obtained in the present work represents molecular geometrical alignment along the C–Cl bond of the molecule. Moreover, the momentum image of C2+ reflects the relative position of multiply charged fragment ions in a highly charged molecule. A key feature to be noted is to conduct experiments under the condition at the lowest possible laser intensity, as long as sufficient signal counts of fragment ions formed by Coulomb explosion are detectable, where the number of ionization channels is reduced and the intrinsic anisotropy is maximized in MRMI. Ultra-short laser pulses, <10 fs, would be advantageous to surmise a molecular structure from MRMI by avoiding extensive deformation [3,4,5,6,33,34], enhanced ionization [39], and dynamical alignment [40,41,42,43] of molecules prior to Coulomb explosion. A combination of MRMI with laser-induced alignment might be helpful for applying this method for other molecules and/or to determine molecular structure more precisely, as shown previously [22,23]. Although one should relent on locating the position of hydrogen atoms in a molecule because of their migration being inevitably large [45,46,47], it will not be a serious problem as it can be reasonably guessed from the position of heavier atoms.

5. Conclusions

According to the different momentum distributions of 35Cl+, trans-1,2-DCE was easily discriminated from the other two. Moreover, the momentum image of C2+ enabled us to identify all the three isomers by intensifying the difference in anisotropic distributions between the pair of structural isomers, cis-1,2-DCE and 1,1-DCE. Mass-resolved momentum imaging, MRMI, was demonstrated to reflect the difference in the location of constituent atoms in a molecule. This, in turn, implies a potential application of MRMI to acquiring information that enables one to reconstruct the relative position of constituent atoms in a molecule, namely, the molecular structure. The analysis of MRMI can be exploited to guess unknown structures of molecular species as long as their chemical compositions are known.

Author Contributions

Conceptualization, R.I. and T.W.; investigation, Y.W., H.A. and T.K.; data curation, Y.W.; visualization, Y.W.; writing—original draft preparation, Y.W. and T.W.; writing—review and editing, H.A. and R.I.; funding acquisition, R.I. and T.W. All authors have read and agreed to the published version of the manuscript.

Funding

This study is partly supported by JSPS KAKENHI (Grant No. JP26288013) and MEXT—Supported Program for the Strategic Research Foundation at Private Universities.

Institutional Review Board Statement

Not applicable.

Informed Consent Statement

Not applicable.

Data Availability Statement

The data presented in this study are available upon request from the corresponding author.

Acknowledgments

The authors are grateful to Y. Hagihara for support in data analysis. The authors thank M. Nishikino and N. Hasegawa for the support in laser operation. Y.W. acknowledges Grant-in-Aid for JSPS Research Fellow (Grant No. JP24-10606).

Conflicts of Interest

The authors declare no conflict of interest.

References

  1. Vager, Z.; Naaman, R.; Kanter, E.P. Coulomb explosion imaging of small molecules. Science 1989, 244, 426–431. [Google Scholar] [CrossRef]
  2. Herwig, P.; Zawatzky, K.; Grieser, M.; Heber, O.; Jordon-Thaden, B.; Krantz, C.; Novotný, O.; Repnow, R.; Schurig, V.; Schwalm, D.; et al. Imaging the absolute configuration of a chiral epoxide in the gas phase. Science 2013, 342, 1084–1086. [Google Scholar] [CrossRef] [PubMed]
  3. Sanderson, J.H.; El-Zein, A.; Bryan, W.A.; Newell, W.R.; Langley, A.J.; Taday, P.E. Geometry modifications and alignment of H2O in an intense femtosecond laser pulse. Phys. Rev. A 1999, 59, R2567–R2570. [Google Scholar] [CrossRef]
  4. Légaré, F.; Lee, K.F.; Litvinyuk, I.V.; Dooley, P.W.; Wesolowski, S.S.; Bunker, P.R.; Dombi, P.; Krausz, F.; Badrauk, A.D.; Villeneuve, D.M.; et al. Laser Coulomb explosion imaging of small molecules. Phys. Rev. A 2005, 71, 013415. [Google Scholar] [CrossRef]
  5. Hasegawa, H.; Hishikawa, A.; Yamanouchi, K. Coincidence imaging of Coulomb explosion of CS2 in intense laser fields. Chem. Phys. Lett. 2001, 349, 57–63. [Google Scholar] [CrossRef]
  6. Gagnon, J.; Lee, K.F.; Rayner, D.M.; Corkum, P.B.; Bhardwaj, V.R. Coincidence imaging of polyatomic molecules via laser-induced Coulomb explosion. J. Phys. B At. Mol. Opt. Phys. 2008, 41, 215104. [Google Scholar] [CrossRef]
  7. Wu, J.; Kunitski, M.; Schmidt, L.P.H.; Jahnke, T.; Dörner, R. Structures of N2Ar, O2Ar, and O2Xe dimers studied by Coulomb explosion imaging. J. Chem. Phys. 2012, 137, 104308. [Google Scholar] [CrossRef]
  8. Slater, C.S.; Blake, S.; Brouard, M.; Lauer, A.; Vallance, C.; John, J.J.; Turchetta, R.; Nomerotski, A.; Christensen, L.; Nielsen, J.H.; et al. Covariance imaging experiments using a pixel-imaging mass-spectrometry camera. Phys. Rev. A 2014, 89, 11401. [Google Scholar] [CrossRef]
  9. Tanaka, H.; Nakashima, N.; Yatsuhashi, T. Anisotropic Coulomb explosion of CO ligands in group 6 metal hexacarbonyls: Cr(CO)6, Mo(CO)6, W(CO)6. J. Phys. Chem. A 2016, 120, 6917–6928. [Google Scholar] [CrossRef]
  10. Mathur, D. Structure and dynamics of molecules in high charge states. Phys. Rep. 2004, 391, 1–118. [Google Scholar] [CrossRef]
  11. Castleman, A.W.; Bowen, K.H. Clusters: Structures, energies, and dynamics of intermediate states of matter. J. Phys. Chem. 1996, 100, 12911–12944. [Google Scholar]
  12. Wakabayashi, T.; Ong, A.-L.; Strelnikov, D.; Krätschmer, W. Flashing carbon on cold surfaces. J. Phys. Chem. B 2004, 108, 3686–3690. [Google Scholar] [CrossRef]
  13. Wada, Y.; Wakabayashi, T.; Kato, T. Photoinduced reaction of hydrogen-end-capped polyynes with iodine molecules. J. Phys. Chem. B 2011, 115, 8439–8445. [Google Scholar] [CrossRef] [PubMed]
  14. Wada, Y.; Morisawa, Y.; Wakabayashi, T. Spectroscopic characterization of a series of polyyne-iodine molecular complexes of H(C≡C)nH(I6) n=5-9. Chem. Phys. Lett. 2012, 541, 54–59. [Google Scholar] [CrossRef]
  15. Wada, Y.; Koma, K.; Ohnishi, Y.; Sasaki, Y.; Wakabayashi, T. Photoinduced reaction of methylpolyynes H(C≡C)nCH3 (n=5-7) and H(C≡C)nH with I2 molecules. Eur. J. Phys. D 2012, 66, 322. [Google Scholar] [CrossRef]
  16. Mitsubayashi, N.; Yatsuhashi, T.; Tanaka, H.; Furukawa, S.; Kozai, M.; Okada, K.; Nakashima, N. Anisotropic Coulomb explosion of acetylene and diacetylene derivatives. Int. J. Mass Spetrom. 2016, 403, 43–52. [Google Scholar] [CrossRef]
  17. Pitzer, M.; Kunitski, M.; Johnson, A.S.; Jahnke, T.; Sann, H.; Sturm, F.; Schmidt, L.P.H.; Schmidt-Böcking, H.; Dörner, R.; Stohner, J.; et al. Direct determination of absolute molecular stereochemistry in gas phase Coulomb explosion imaging. Science 2013, 341, 1096–1100. [Google Scholar] [CrossRef]
  18. Pitzer, M.; Kastirke, G.; Burzynski, P.; Weller, M.; Metz, D.; Neff, J.; Waitz, M.; Trinter, F.; Schmidt, L.P.H.; Williams, J.B.; et al. Stereochemical configuration and selective excitation of the chiral molecule halothane. J. Phys. B At. Mol. Opt. Phys. 2016, 49, 234001. [Google Scholar] [CrossRef]
  19. Pitzer, M.; Kastirke, G.; Kunitski, M.; Jahnke, T.; Bauer, T.; Goihl, C.; Trinter, F.; Schober, C.; Henrichs, K.; Becht, J.; et al. Absolute configuration from different multifragmentation pathways in light-induced Coulomb explosion imaging. ChemPhysChem 2016, 17, 2465–2472. [Google Scholar] [CrossRef]
  20. Kitamura, T.; Nishide, T.; Shiromaru, H.; Achiba, Y.; Kobayashi, N. Direct observation of “dynamic” chirality by Coulomb explosion imaging. J. Chem. Phys. 2001, 115, 5–6. [Google Scholar] [CrossRef]
  21. Ablikim, U.; Bomme, C.; Savelyev, E.; Xiong, H.; Kushawaha, R.; Boll, R.; Amini, K.; Osipov, T.; Kilcoyne, D.; Rudenko, A.; et al. Isomer-dependent fragmentation dynamics of inner-shell photoionized difluoroiodobenzene. Phys. Chem. Chem. Phys. 2017, 19, 13419–13431. [Google Scholar] [CrossRef] [PubMed] [Green Version]
  22. Christensen, L.; Nielsen, J.H.; Slater, C.S.; Lauer, A.; Brouard, M.; Stapelfeldt, H. Using laser-induced Coulomb explosion of aligned chiral molecules to determine their absolute configuration. Phys. Rev. A 2015, 92, 033411. [Google Scholar] [CrossRef]
  23. Burt, M.; Amini, K.; Lee, J.W.L.; Christiansen, L.; Johansen, R.R.; Kobayashi, Y.; Pickering, J.D.; Vallance, C.; Brouard, M.; Stapelfeldt, H. Communication: Gas-phase structural isomer identification by Coulomb explosion of aligned molecules. J. Chem. Phys. 2018, 148, 091102. [Google Scholar] [CrossRef]
  24. Yatsuhashi, T.; Nakashima, N.; Azuma, J. Coulomb explosion of dichroloethylene geometric isomers at 1 PW cm−2. J. Phys. Chem. A 2013, 117, 1393–1399. [Google Scholar] [CrossRef]
  25. Ablikim, U.; Bomme, C.; Xiong, H.; Savelyev, E.; Obaid, R.; Kaderiya, B.; Augustin, S.; Schnorr, K.; Dumitriu, I.; Osipov, T.; et al. Identification of absolute geometries of cis and trans molecular isomers by Coulomb explosion imaging. Sci. Rep. 2016, 6, 38202. [Google Scholar] [CrossRef]
  26. Hishikawa, A.; Iwamae, A.; Hoshina, K.; Kono, M.; Yamanouchi, K. Mass-resolved two-dimensional momentum imaging of the Coulomb explosion of N2 and SO2 in an intense laser field. Chem. Phys. Lett. 1998, 282, 283–291. [Google Scholar] [CrossRef]
  27. Hishikawa, A.; Iwamae, A.; Hoshina, K.; Kono, M.; Yamanouchi, K. Coulomb explosion dynamics of N2 in intense laser field by mass-resolved momentum imaging. Chem. Phys. 1998, 231, 315–329. [Google Scholar] [CrossRef]
  28. Iwamae, A.; Hishikawa, A.; Yamanouchi, K. Extraction of molecular dynamics in intense laser fields from mass-resolved momentum imaging maps: Application to Coulomb explosion of NO. J. Phys. B At. Mol. Opt. Phys. 2000, 33, 223–240. [Google Scholar] [CrossRef]
  29. Litvinyuk, I.V.; Lee, K.F.; Dooley, P.W.; Rayner, D.M.; Villeneuve, D.M.; Corkum, P.B. Alignment-dependent strong field ionization of molecules. Phys. Rev. Lett. 2003, 90, 233003. [Google Scholar] [CrossRef]
  30. Alnaser, A.S.; Tong, X.M.; Osipov, T.; Voss, S.; Maharjan, C.M.; Shan, B.; Chang, Z.; Cocke, C.L. Laser-peak-intensity calibration using recoil-ion momentum imaging. Phys. Rev. A 2004, 70, 023413. [Google Scholar] [CrossRef]
  31. Jahangri, F.; Hashida, M.; Tokita, S.; Nagashima, T.; Hangyo, M.; Sakabe, S. Enhancing the energy of terahertz radiation from plasma-produced by intense femtosecond laser pulses. Appl. Phys. Lett. 2013, 102, 191106. [Google Scholar] [CrossRef] [Green Version]
  32. Wiley, W.C.; McLaren, I.H. Time-of-flight mass spectrometer with improved resolution. Rev. Sci. Instrum. 1955, 26, 1150. [Google Scholar] [CrossRef]
  33. Hishikawa, A.; Iwamae, A.; Yamanouchi, K. Ultrafast deformation of the geometrical structure of CO2 induced in intense laser fields. Phys. Rev. Lett. 1999, 83, 1127–1130. [Google Scholar] [CrossRef]
  34. Hishikawa, A.; Iwamae, A.; Yamanouchi, K. Ultrafast structural deformation of NO2 in intense laser fields studied by mass-resolved momentum imaging. J. Chem. Phys. 1999, 111, 8871–8878. [Google Scholar] [CrossRef]
  35. Wong, M.C.H.; Brichta, J.-P.; Spanner, M.; Patchkovskii, S.; Bhardwaj, V.R. High-harmonic spectroscopy of molecular isomers. Phys. Rev. A 2011, 84, 051403, Erratum in Phys. Rev. A 2012, 85, 049901. [Google Scholar] [CrossRef]
  36. Le, A.-T.; Lucchese, R.R.; Lin, C.D. High-order harmonic generation from molecular isomers with midinfrared intense laser pulses. Phys. Rev. A 2013, 88, 021402. [Google Scholar] [CrossRef]
  37. Tong, X.M.; Zhao, Z.X.; Lin, C.D. Theory of molecular tunneling ionization. Phys. Rev. A 2002, 66, 033402. [Google Scholar] [CrossRef]
  38. Alnaser, A.S.; Voss, S.; Tong, X.M.; Maharjan, C.M.; Ranitovic, P.; Ulrich, B.; Osipov, T.; Shan, B.; Chang, Z.; Cocke, C.L. Effect of molecular structure on ion disintegration patterns in ionization of O2 and N2 by short laser pulses. Phys. Rev. Lett. 2004, 93, 113003. [Google Scholar] [CrossRef]
  39. Posthumus, J.H.; Giles, A.J.; Thompson, M.R.; Codling, K. Field-ionization, Coulomb explosion of diatomic molecules in intense laser fields. J. Phys. B 1996, 29, 5811–5829. [Google Scholar] [CrossRef]
  40. Rosca-Pruna, F.; Vrakking, M.J.J. Experimental observation of revival structures in picosecond laser-induced alignment of I2. Phys. Rev. Lett. 2001, 87, 153902. [Google Scholar] [CrossRef]
  41. Stapelfeldt, H.; Seideman, T. Colloquium: Aligning molecules with strong laser pulses. Rev. Mod. Phys. 2003, 75, 543–557. [Google Scholar] [CrossRef] [Green Version]
  42. Tong, X.M.; Zhao, Z.X.; Alnaser, A.S.; Voss, S.; Cocke, C.L.; Lin, C.D. Post ionization alignment of the fragmentation of molecules in an ultrashort intense laser field. J. Phys. B 2005, 38, 333–341. [Google Scholar] [CrossRef]
  43. Koch, C.P.; Lemeshko, M.; Sugny, D. Quantum control of molecular rotation. Rev. Mod. Phys. 2019, 91, 035005. [Google Scholar] [CrossRef]
  44. Frisch, M.J.; Trucks, G.W.; Schlegel, H.B.; Scuseria, G.E.; Robb, M.A.; Cheeseman, J.R.; Scalmani, G.; Barone, V.; Petersson, G.A.; Nakatsuji, H.; et al. B3LYP/6-311++G(2d,p) Optimized Molecular Geometries and Polarizability Tensors for DCE Isomers, Gaussian 16; Revision A.03; Gaussian, Inc.: Wallingford, CT, USA, 2016. [Google Scholar]
  45. Hishikawa, A.; Matsuda, A.; Fushitani, M.; Takahashi, E. Visualizing recurrently migrating hydrogen in acetylene dication by intense ultrashort laser pulses. Phys. Rev. Lett. 2007, 99, 258302. [Google Scholar] [CrossRef]
  46. Itakura, R.; Liu, P.; Furukawa, Y.; Okino, T.; Yamanouchi, K.; Nakano, H. Two-body Coulomb explosion and hydrogen migration in methanol induced by intense 7 and 21 fs laser pulses. J. Chem. Phys. 2007, 127, 104306. [Google Scholar] [CrossRef] [PubMed]
  47. Ibrahim, H.; Wales, B.; Beaulieu, S.; Schmidt, B.E.; Thiré, N.; Fowe, E.P.; Bisson, É.; Hebeisen, C.T.; Wanie, V.; Giguére, M.; et al. Tabletop imaging of structural evolutions in chemical reactions demonstrated for the acetylene cation. Nat. Commun. 2014, 5, 4422. [Google Scholar] [CrossRef] [PubMed] [Green Version]
Figure 1. Schematic diagram of the experimental setup; MCP, micro-channel plate; GND, ground electrode; EXT, extracting electrode with a slit; RPL, repelling electrode; ND, neutral density filter; TMP, turbo molecular pump.
Photochem 02 00051 g001
Figure 2. TOF mass spectra of dichloroethylene isomers obtained at the laser intensity of 1.8 × 10¹⁴ W/cm2. Inset spectra show detailed profiles for C2+ and 35Cl+. Traces in black correspond to laser polarization perpendicular to the flight axis, while traces in red parallel to the flight axis. Peaks with daggers are due to impurities: water (m/z 18) and acetone (m/z 58). Molecular structures are depicted for the three dichloroethylene isomers; Carbon atoms in gray, hydrogen atoms in light blue, and chlorine atoms in green.
Photochem 02 00051 g002
Figure 3. Angular distributions of 35Cl+ generated from 1,1-DCE (a,d), cis-1,2-DCE (b,e), and trans-1,2-DCE (c,f). Laser intensities are 1.7 × 10¹⁵ W/cm2 for (ac) and 1.8 × 10¹⁴ W/cm2 for (df). The vertical arrows represent the direction of laser polarization.
Photochem 02 00051 g003
Figure 4. Angular distributions of C2+ generated from 1,1-DCE (a,d), cis-1,2-DCE (b,e), and trans-1,2-DCE (c,f). Laser intensities are 1.7 × 10¹⁵ W/cm2 for (ac) and 1.8 × 10¹⁴ W/cm2 for (df). The vertical arrows represent the direction of laser polarization.
Photochem 02 00051 g004
Figure 5. Momentum images of 35Cl+ generated from 1,1-DCE (a,d), cis-1,2-DCE (b,e), and trans-1,2-DCE (c,f). Laser intensities are 1.7 × 10¹⁵ W/cm2 for (ac) and 1.8 × 10¹⁴ W/cm2 for (df). The vertical arrows represent the direction of laser polarization.
Photochem 02 00051 g005
Figure 6. Momentum images of C2+ generated from 1,1-DCE (a,d), cis-1,2-DCE (b,e), and trans-1,2-DCE (c,f). Laser intensities are 1.7 × 10¹⁵ W/cm2 for (ac) and 1.8 × 10¹⁴ W/cm2 for (df). The vertical arrows represent the direction of laser polarization.
Photochem 02 00051 g006
Figure 7. The largest component of polarizability along the principal axis (red arrow) evaluated for (a) 1,1-DCE, (b) cis-1,2-DCE, and (c) trans-1,2-DCE isomers by density functional theory calculations [44].
Photochem 02 00051 g007
Publisher’s Note: MDPI stays neutral with regard to jurisdictional claims in published maps and institutional affiliations.