
Photobehavior of an Acidochromic Dinitrophenyl-Hydrazinylidene Derivative: A Case of Total Internal Conversion
 , , , ,
Abstract
:
1. Introduction
2. Materials and Methods
2.1. Synthesis
2.2. Characterization
2.3. Solvents
2.4. Spectroscopic Stationary Techniques
2.5. Föster Cycle for Determining pKa*
2.6. ns Flash Photolysis
2.7. fs Transient Absorption Measurements
2.8. Computational Details
3. Results
3.1. Acidochromism
3.1.1. Spectral Properties
3.1.2. pKa Determination
3.1.3. Thermal Reaction
3.1.4. pK* Determination
3.1.5. Photobehaviour
3.1.6. Transient Absorption (fs Domain)
3.2. Quantum-Mechanics Calculations
3.3. Solvatochromism
Spectral Properties and Photobehaviour
4. Discussion
Supplementary Materials
Author Contributions
Funding
Data Availability Statement
Acknowledgments
Conflicts of Interest
References
- Carlotti, B.; Spalletti, A.; Šindler-Kulyk, M.; Elisei, F. Ultrafast Photoinduced Intramolecular Charge Transfer in Push–Pull Distyryl Furan and Benzofuran: Solvent and Molecular Structure Effect. Phys. Chem. Chem. Phys. 2011, 13, 4519–4528. [Google Scholar] [CrossRef]
- Carlotti, B.; Kikaš, I.; Škorić, I.; Spalletti, A.; Elisei, F. Photophysics of Push–Pull Distyrylfurans, Thiophenes and Pyridines by Fast and Ultrafast Techniques. ChemPhysChem 2013, 14, 970–981. [Google Scholar] [CrossRef]
- Carlotti, B.; Cesaretti, A.; Fortuna, C.G.; Spalletti, A.; Elisei, F. Experimental Evidence of Dual Emission in a Negatively Solvatochromic Push–Pull Pyridinium Derivative. Phys. Chem. Chem. Phys. 2015, 17, 1877–1882. [Google Scholar] [CrossRef]
- Carlotti, B.; Consiglio, G.; Elisei, F.; Fortuna, C.G.; Mazzucato, U.; Spalletti, A. Intramolecular Charge Transfer of Push–Pull Pyridinium Salts in the Singlet Manifold. J. Phys. Chem. A 2014, 118, 3580–3592. [Google Scholar] [CrossRef] [PubMed]
- Cesaretti, A.; Carlotti, B.; Consiglio, G.; Del Giacco, T.; Spalletti, A.; Elisei, F. Inclusion of Two Push–Pull N-Methylpyridinium Salts in Anionic Surfactant Solutions: A Comprehensive Photophysical Investigation. J. Phys. Chem. B 2015, 119, 6658–6667. [Google Scholar] [CrossRef]
- Cesaretti, A.; Carlotti, B.; Germani, R.; Spalletti, A.; Elisei, F. Inclusion of Push–Pull N -Methylpyridinium Salts within Surfactant Hydrogels: Is Their Excited State Intramolecular Charge Transfer Mediated by Twisting? Phys. Chem. Chem. Phys. 2015, 17, 17214–17220. [Google Scholar] [CrossRef] [PubMed]
- Carlotti, B.; Benassi, E.; Cesaretti, A.; Fortuna, C.G.; Spalletti, A.; Barone, V.; Elisei, F. An Ultrafast Spectroscopic and Quantum Mechanical Investigation of Multiple Emissions in Push–Pull Pyridinium Derivatives Bearing Different Electron Donors. Phys. Chem. Chem. Phys. 2015, 17, 20981–20989. [Google Scholar] [CrossRef]
- Mencaroni, L.; Bonaccorso, C.; Botti, V.; Carlotti, B.; Consiglio, G.; Elisei, F.; Fortuna, C.G.; Spalletti, A.; Cesaretti, A. Nonlinear Optical Properties of a New Panchromatic Series of Water-Soluble Bicationic Push-Pull Fluorophores. Dye. Pigment. 2021, 194, 109620. [Google Scholar] [CrossRef]
- Benassi, E.; Carlotti, B.; Fortuna, C.G.; Barone, V.; Elisei, F.; Spalletti, A. Acid–Base Strength and Acidochromism of Some Dimethylamino–Azinium Iodides. An Integrated Experimental and Theoretical Study. J. Phys. Chem. A 2015, 119, 323–333. [Google Scholar] [CrossRef] [PubMed]
- Cesaretti, A.; Bonaccorso, C.; Carboni, V.; Giubila, M.S.; Fortuna, C.G.; Elisei, F.; Spalletti, A. Four Styryl Phenanthroline Derivatives as Excellent Acidochromic Probes. Dye. Pigment. 2019, 162, 440–450. [Google Scholar] [CrossRef]
- Mencaroni, L.; Cesaretti, A.; Elisei, F.; Škorić, I.; Mlakić, M.; Spalletti, A. Acid–Base Strength and Acido(Fluoro)Chromism of Three Push–Pull Derivatives of 2,6-Distyrylpyridine. Photochem. Photobiol. Sci. 2022, 21, 935–947. [Google Scholar] [CrossRef] [PubMed]
- Kautny, P.; Kriegner, H.; Bader, D.; Dušek, M.; Reider, G.A.; Fröhlich, J.; Stöger, B. Ethyne-Linked Push–Pull Chromophores: Implications of Crystal Structure and Molecular Electronics on the Quadric Nonlinear Activity. Cryst. Growth Des. 2017, 17, 4124–4136. [Google Scholar] [CrossRef]
- Sezgin, E.; Sadowski, T.; Simons, K. Measuring Lipid Packing of Model and Cellular Membranes with Environment Sensitive Probes. Langmuir 2014, 30, 8160–8166. [Google Scholar] [CrossRef]
- Demchenko, A.P.; Mély, Y.; Duportail, G.; Klymchenko, A.S. Monitoring Biophysical Properties of Lipid Membranes by Environment-Sensitive Fluorescent Probes. Biophys. J. 2009, 96, 3461–3470. [Google Scholar] [CrossRef] [PubMed] [Green Version]
- Klymchenko, A.S.; Duportail, G.; Demchenko, A.P.; Mély, Y. Bimodal Distribution and Fluorescence Response of Environment-Sensitive Probes in Lipid Bilayers. Biophys. J. 2004, 86, 2929–2941. [Google Scholar] [CrossRef] [Green Version]
- Tiecco, M.; Di Guida, I.; Gentili, P.L.; Germani, R.; Bonaccorso, C.; Cesaretti, A. Probing the Structural Features and the Micro-Heterogeneity of Various Deep Eutectic Solvents and Their Water Dilutions by the Photophysical Behaviour of Two Fluorophores. J. Mol. Liq. 2021, 331, 115718. [Google Scholar] [CrossRef]
- Carlotti, B.; Elisei, F.; Spalletti, A. A Peculiar Dependence of Intersystem Crossing of P-Nitro-2,5-Distyrylfuran on the Dielectric Properties of the Solvent. Phys. Chem. Chem. Phys. 2011, 13, 20787–20793. [Google Scholar] [CrossRef] [PubMed]
- Carlotti, B.; Elisei, F.; Mazzucato, U.; Spalletti, A. Unusual High Fluorescence of Two Nitro-Distyrylbenzene-like Compounds Induced by CT Processes Affecting the Fluorescence/Intersystem-Crossing Competition. Phys. Chem. Chem. Phys. 2015, 17, 14740–14749. [Google Scholar] [CrossRef] [PubMed]
- Carlotti, B.; Cesaretti, A.; Cacioppa, G.; Elisei, F.; Odak, I.; Škorić, I.; Spalletti, A. Fluorosolvatochromism and Hyperpolarizability of One-Arm and Two-Arms Nitro-Compounds Bearing Heterocyclic Rings. J. Photochem. Photobiol. A Chem. 2019, 368, 190–199. [Google Scholar] [CrossRef]
- Cesaretti, A.; Bonaccorso, C.; Elisei, F.; Fortuna, C.G.; Mencaroni, L.; Spalletti, A. Photoinduced Intramolecular Charge Transfer and Hyperpolarizability Coefficient in Push-Pull Pyridinium Salts with Increasing Strength of the Acceptor Group. ChemPlusChem 2018, 83, 1021–1031. [Google Scholar] [CrossRef] [PubMed]
- Mencaroni, L.; Carlotti, B.; Cesaretti, A.; Elisei, F.; Grgičević, A.; Škorić, I.; Spalletti, A. Competition between Fluorescence and Triplet Production Ruled by Nitro Groups in One-Arm and Two-Arm Styrylbenzene Heteroanalogues. Photochem. Photobiol. Sci. 2020, 19, 1665–1676. [Google Scholar] [CrossRef]
- Wilson, T.M.; Tauber, M.J.; Wasielewski, M.R. Toward an N-Type Molecular Wire: Electron Hopping within Linearly Linked Perylenediimide Oligomers. J. Am. Chem. Soc. 2009, 131, 8952–8957. [Google Scholar] [CrossRef]
- Stolar, M.; Baumgartner, T. Organic N-Type Materials for Charge Transport and Charge Storage Applications. Phys. Chem. Chem. Phys. 2013, 15, 9007–9024. [Google Scholar] [CrossRef]
- Yue, Q.; Liu, W.; Zhu, X. N-Type Molecular Photovoltaic Materials: Design Strategies and Device Applications. J. Am. Chem. Soc. 2020, 142, 11613–11628. [Google Scholar] [CrossRef]
- Ashcraft, A.; Liu, K.; Mukhopadhyay, A.; Paulino, V.; Liu, C.; Bernard, B.; Husainy, D.; Phan, T.; Olivier, J.-H. A Molecular Strategy to Lock-in the Conformation of a Perylene Bisimide-Derived Supramolecular Polymer. Angew. Chem. 2020, 132, 7557–7563. [Google Scholar] [CrossRef]
- Abbotto, A.; Beverina, L.; Manfredi, N.; Pagani, G.A.; Archetti, G.; Kuball, H.-G.; Wittenburg, C.; Heck, J.; Holtmann, J. Second-Order Nonlinear Optical Activity of Dipolar Chromophores Based on Pyrrole-Hydrazono Donor Moieties. Chem.—Eur. J. 2009, 15, 6175–6185. [Google Scholar] [CrossRef]
- Lehn, J.-M. Conjecture: Imines as Unidirectional Photodriven Molecular Motors—Motional and Constitutional Dynamic Devices. Chem.—Eur. J. 2006, 12, 5910–5915. [Google Scholar] [CrossRef]
- Su, X.; Aprahamian, I. Hydrazone-Based Switches, Metallo-Assemblies and Sensors. Chem. Soc. Rev. 2014, 43, 1963–1981. [Google Scholar] [CrossRef] [Green Version]
- Chen, M.-C.; Chen, D.-G.; Chou, P.-T. Fluorescent Chromophores Containing the Nitro Group: Relatively Unexplored Emissive Properties. ChemPlusChem 2021, 86, 11–27. [Google Scholar] [CrossRef]
- Rodríguez-Córdoba, W.; Gutiérrez-Arzaluz, L.; Cortés-Guzmán, F.; Peon, J. Excited State Dynamics and Photochemistry of Nitroaromatic Compounds. Chem. Commun. 2021, 57, 12218–12235. [Google Scholar] [CrossRef]
- Görner, H. Photophysics and Photochemistry of Trans-4-Nitrostilbenes and Trans-2,4-Dinitrostilbenes: Effect of Intramolecular Charge Transfer. Ber. Der Bunsenges. Für Phys. Chem. 1998, 102, 726–737. [Google Scholar] [CrossRef]
- El-Sayed, M.A. Vanishing First- and Second-Order Intramolecular Heavy-Atom Effects on the (Π*→n) Phosphorescence in Carbonyls. J. Chem. Phys. 1964, 41, 2462–2467. [Google Scholar] [CrossRef]
- El-Sayed, M.A. Spin–Orbit Coupling and the Radiationless Processes in Nitrogen Heterocyclics. J. Chem. Phys. 1963, 38, 2834–2838. [Google Scholar] [CrossRef]
- Poronik, Y.M.; Sadowski, B.; Szychta, K.; Quina, F.H.; Vullev, V.I.; Gryko, D.T. Revisiting the Non-Fluorescence of Nitroaromatics: Presumption versus Reality. J. Mater. Chem. C 2022, 10, 2870–2904. [Google Scholar] [CrossRef]
- Amos, B. Lessons from the History of Light Microscopy. Nat. Cell Biol. 2000, 2, E151–E152. [Google Scholar] [CrossRef]
- James, M.L.; Gambhir, S.S. A Molecular Imaging Primer: Modalities, Imaging Agents, and Applications. Physiol. Rev. 2012, 92, 897–965. [Google Scholar] [CrossRef] [Green Version]
- Ntziachristos, V. Going Deeper than Microscopy: The Optical Imaging Frontier in Biology. Nat. Methods 2010, 7, 603–614. [Google Scholar] [CrossRef]
- Tsien, R.Y. Building and Breeding Molecules to Spy on Cells and Tumors. FEBS Lett. 2005, 579, 927–932. [Google Scholar] [CrossRef] [Green Version]
- Tsien, R.Y. Nobel Lecture: Constructing and Exploiting the Fluorescent Protein Paintbox. Integr. Biol. 2010, 2, 77–93. [Google Scholar] [CrossRef]
- Giepmans, B.N.G.; Adams, S.R.; Ellisman, M.H.; Tsien, R.Y. The Fluorescent Toolbox for Assessing Protein Location and Function. Science 2006, 312, 217–224. [Google Scholar] [CrossRef]
- Whitley, M.J.; Cardona, D.M.; Lazarides, A.L.; Spasojevic, I.; Ferrer, J.M.; Cahill, J.; Lee, C.-L.; Snuderl, M.; Blazer, D.G.; Hwang, E.S.; et al. A Mouse-Human Phase 1 Co-Clinical Trial of a Protease-Activated Fluorescent Probe for Imaging Cancer. Sci. Transl. Med. 2016, 8, 320ra4. [Google Scholar] [CrossRef] [PubMed] [Green Version]
- Cesaretti, A.; Mencaroni, L.; Bonaccorso, C.; Botti, V.; Calzoni, E.; Carlotti, B.; Fortuna, C.G.; Montegiove, N.; Spalletti, A.; Elisei, F. Amphiphilicity-Controlled Localization of Red Emitting Bicationic Fluorophores in Tumor Cells Acting as Bio-Probes and Anticancer Drugs. Molecules 2022, 27, 3713. [Google Scholar] [CrossRef]
- Rosencwaig, A.; Gersho, A. Theory of the Photoacoustic Effect with Solids. J. Appl. Phys. 1976, 47, 64–69. [Google Scholar] [CrossRef]
- Ntziachristos, V.; Razansky, D. Molecular Imaging by Means of Multispectral Optoacoustic Tomography (MSOT). Chem. Rev. 2010, 110, 2783–2794. [Google Scholar] [CrossRef] [PubMed]
- Gujrati, V.; Mishra, A.; Ntziachristos, V. Molecular Imaging Probes for Multi-Spectral Optoacoustic Tomography. Chem. Commun. 2017, 53, 4653–4672. [Google Scholar] [CrossRef]
- Nie, L.; Chen, X. Structural and Functional Photoacoustic Molecular Tomography Aided by Emerging Contrast Agents. Chem. Soc. Rev. 2014, 43, 7132–7170. [Google Scholar] [CrossRef]
- Luo, S.; Zhang, E.; Su, Y.; Cheng, T.; Shi, C. A Review of NIR Dyes in Cancer Targeting and Imaging. Biomaterials 2011, 32, 7127–7138. [Google Scholar] [CrossRef]
- Gagliardi, L.G.; Castells, C.B.; Ràfols, C.; Rosés, M.; Bosch, E. δ Conversion Parameter between PH Scales (and) in Acetonitrile/Water Mixtures at Various Compositions and Temperatures. Anal. Chem. 2007, 79, 3180–3187. [Google Scholar] [CrossRef]
- Birks, J.B. Photophysics of Aromatic Molecules; Wiley Monographs in Chemical Physics; Wiley-Interscience: London, UK, 1970; ISBN 978-0-471-07420-5. [Google Scholar]
- Bartocci, G.; Masetti, F.; Mazzucato, U.; Spalletti, A.; Baraldi, I.; Momicchioli, F. Photophysical and Theoretical Studies of Photoisomerism and Rotamerism of Trans-Styrylphenanthrenes. J. Phys. Chem. 1987, 91, 4733–4743. [Google Scholar] [CrossRef]
- Förster, T. Fluoreszenzspektrum und Wasserstoffionen-Konzentration. Naturwissenschaften 1949, 36, 186–187. [Google Scholar] [CrossRef]
- Förster, T. Die pH-Abhängigkeit der Fluoreszenz von Naphthalinderivaten. Z. Für Elektrochem. Und Angew. Phys. Chem. 1950, 54, 531–535. [Google Scholar] [CrossRef]
- Weller, A. Allgemeine Basenkatalyse bei der elektrolytischen Dissoziation angeregter Naphthole. Z. Für Elektrochem. Ber. Der Bunsenges. Für Phys. Chem. 1954, 58, 849–853. [Google Scholar] [CrossRef]
- Urban, W.; Weller, A. Fluoreszenzuntersuchungen zum Mechanismus protolytischer Reaktionen in nichtwäßrigen Medien I. Die Dissoziationsreaktion starker Säuren. Ber. Der Bunsenges. Für Phys. Chem. 1963, 67, 787–791. [Google Scholar] [CrossRef]
- Weller, A. Outer and Inner Mechanism of Reactions of Excited Molecules. Discuss. Faraday Soc. 1959, 27, 28–33. [Google Scholar] [CrossRef]
- Carmichael, I.; Hug, G.L. Triplet–Triplet Absorption Spectra of Organic Molecules in Condensed Phases. J. Phys. Chem. Ref. Data 1986, 15, 1–250. [Google Scholar] [CrossRef]
- Cesaretti, A.; Carlotti, B.; Elisei, F.; Fortuna, C.G.; Spalletti, A. Photoinduced ICT vs. Excited Rotamer Intercoversion in Two Quadrupolar Polyaromatic N -Methylpyridinium Cations. Phys. Chem. Chem. Phys. 2018, 20, 2851–2864. [Google Scholar] [CrossRef] [PubMed]
- Van Stokkum, I.H.M.; Larsen, D.S.; van Grondelle, R. Global and Target Analysis of Time-Resolved Spectra. Biochim. Biophys. Acta (BBA)—Bioenerg. 2004, 1657, 82–104. [Google Scholar] [CrossRef] [Green Version]
- Snellenburg, J.J.; Laptenok, S.; Seger, R.; Mullen, K.M.; van Stokkum, I.H.M. Glotaran: A Java-Based Graphical User Interface for the R Package TIMP. J. Stat. Softw. 2012, 49, 1–22. [Google Scholar] [CrossRef] [Green Version]
- Frisch, M.E.; Trucks, G.W.; Schlegel, H.B.; Scuseria, G.E.; Robb, M.A.; Cheeseman, J.R.; Scalmani, G.; Barone, V.; Petersson, G.A.; Nakatsuji, H. Gaussian 16; Gaussian inc.: Wallingford, CT, USA, 2016. [Google Scholar]
- Yanai, T.; Tew, D.P.; Handy, N.C. A New Hybrid Exchange–Correlation Functional Using the Coulomb-Attenuating Method (CAM-B3LYP). Chem. Phys. Lett. 2004, 393, 51–57. [Google Scholar] [CrossRef] [Green Version]
- Yanai, T.; Harrison, R.J.; Handy, N.C. Multiresolution Quantum Chemistry in Multiwavelet Bases: Time-Dependent Density Functional Theory with Asymptotically Corrected Potentials in Local Density and Generalized Gradient Approximations. Mol. Phys. 2005, 103, 413–424. [Google Scholar] [CrossRef]
- Chai, J.-D.; Head-Gordon, M. Long-Range Corrected Hybrid Density Functionals with Damped Atom–Atom Dispersion Corrections. Phys. Chem. Chem. Phys. 2008, 10, 6615–6620. [Google Scholar] [CrossRef] [PubMed] [Green Version]
- Barone, V.; Cossi, M. Quantum Calculation of Molecular Energies and Energy Gradients in Solution by a Conductor Solvent Model. J. Phys. Chem. A 1998, 102, 1995–2001. [Google Scholar] [CrossRef]
- Kalia, J.; Raines, R.T. Hydrolytic Stability of Hydrazones and Oximes. Angew. Chem. Int. Ed. 2008, 47, 7523–7526. [Google Scholar] [CrossRef] [Green Version]
- Duvanel, G.; Grilj, J.; Chaumeil, H.; Jacques, P.; Vauthey, E. Ultrafast Excited-State Dynamics of a Series of Zwitterionic Pyridinium Phenoxides with Increasing Sterical Hindering. Photochem. Photobiol. Sci. 2010, 9, 908–915. [Google Scholar] [CrossRef] [PubMed]
- Saltiel, J.; Sun, Y.P. Photochromism: Molecules and Systems; Elsevier: Amsterdam, The Netherlands, 1990. [Google Scholar]
- Mazzucato, U.; Momicchioli, F. Rotational Isomerism in Trans-1, 2-Diarylethylenes. Chem. Rev. 1991, 91, 1679–1719. [Google Scholar] [CrossRef]
- Fischer, E.; Frei, Y. Photoisomerization Equilibria Involving the C=N Double Bond. J. Chem. Phys. 1957, 27, 808–809. [Google Scholar] [CrossRef]
- Wettermark, G.; Weinstein, J.; Sousa, J.; Dogliotti, L. Kinetics of Cis-Trans Isomerization of Para-Substituted N-Benzylideneanilines. J. Phys. Chem. 1965, 69, 1584–1587. [Google Scholar] [CrossRef]


| Species | Protonation Site | λmax b | pKaexp a | pKaexp b | pKath c | pK* d |
|---|---|---|---|---|---|---|
| Anion Hy(−H+) | N2-hydrazone | 520 | 12.1 ± 0.1 | 11.461 ± 0.008 | 12.7 ± 0.5 | 6.7 |
| Neutral Hy | 451 | 3.2 ± 0.1 | 3.45 ± 0.01 | 5.9 ± 0.3 | 6.4 | |
| Monoprotonated HyH+ | N-pyridine | 496 | ||||
| Biprotonated HyH2++ | N1-hydrazone | n.d | n.d. | n.d. | 0.5 ± 0.7 |
| pH/H0 | λan/nm | k/104 s−1 | r2 |
|---|---|---|---|
| 0.3 | 400 | 5.61 ± 0.19 | 0.983 |
| 495 | 7.03 ± 0.07 | 0.999 | |
| 0.3 a | 400 | 13.6 ± 0.4 | 0.990 |
| 495 | 13.9 ± 0.3 | 0.995 | |
| −1 a | 495 | 64 ± 3 | 0.987 |
| Solvent | Compound | λabsmax (nm) | λemmax (nm) | ΦF |
|---|---|---|---|---|
| AcCN/w pH 2 | HyH+ | 495 | 690 | 2 × 10⁻⁵ |
| AcCN/w pH 8 | Hy | 450 | broad | 1 × 10⁻⁵ |
| AcCN/w pH 13 | Hy(−H+) | 520 | broad | not detected |
| AcCN/w pH 0.3 | Thermal Product | 400 | 505 | 3 × 10⁻³ |
| Solvent | Compound | τ (ps) | λmax (nm) | Assignment |
|---|---|---|---|---|
| AcCN/w pH = 13 | Hy(−H+) | 0.1 1.9 | 600 (+)<490 (−); 560 (+) | Solv.i S1 |
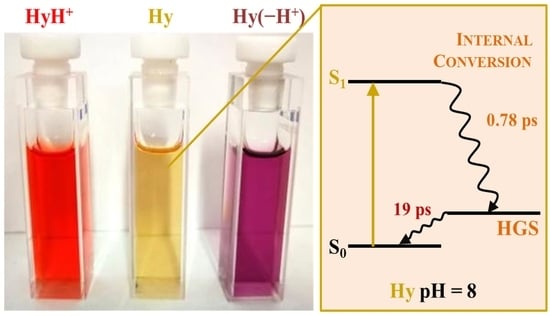
| AcCN/w pH = 8 | Hy | 0.78 19 | <495(−); 575 (+) <505 (−); 550 (+) | S1 HGS |
| AcCN/w H0 = −1 | Thermal Product | 0.1 1.3 31 | broad 510 (−); 660 (+) 520 (−); 650 (+) | Solv.i Solv.d S1 |
| Solvent | ΦF | kF (s−1) a |
|---|---|---|
| Tol | 1 × 10⁻⁴ | 1 × 10⁸ |
| An | 3 × 10⁻⁴ | 2 × 10⁸ |
| CHCl3 | 8 × 10⁻⁵ | − |
| THF | not detected | − |
| AcCN | 8 × 10⁻⁶ | 1 × 10⁷ |
| DMSO | not detected | − |
| Solvent | τ (ps) | λmax (ps) | Assignment |
|---|---|---|---|
| DMSO | < 0.1 0.84 5.3 | 610 (+) <500 (−); 605 (+) <505 (−); 575 (+) | Solv.i S1 HGS |
| AcCN | 0.77 12 | <495(−); 580 (+) <505 (−); 550 (+) | S1 HGS |
| THF | 0.1 1.4 8.8 | 630 (+) <505 (−); 620 (+) <505 (−); 555 (+) | Solv.i S1 HGS |
| An | 0.11 1.7 12 | 610 (+) <520 (−); 630 (+) <530 (−); 580 (+) | Solv.i S1 HGS |
| Tol | 0.17 1.5 16 | 620 (+) <505 (−); 625 (+) <490 (−); 580 (+) | Solv.i S1 HGS |
Publisher’s Note: MDPI stays neutral with regard to jurisdictional claims in published maps and institutional affiliations. |
© 2022 by the authors. Licensee MDPI, Basel, Switzerland. This article is an open access article distributed under the terms and conditions of the Creative Commons Attribution (CC BY) license (https://creativecommons.org/licenses/by/4.0/).
Share and Cite
Mencaroni, L.; Cesaretti, A.; Consiglio, G.; Elisei, F.; Fortuna, C.G.; Spalletti, A. Photobehavior of an Acidochromic Dinitrophenyl-Hydrazinylidene Derivative: A Case of Total Internal Conversion. Photochem 2022, 2, 849-865. https://doi.org/10.3390/photochem2040054
Mencaroni L, Cesaretti A, Consiglio G, Elisei F, Fortuna CG, Spalletti A. Photobehavior of an Acidochromic Dinitrophenyl-Hydrazinylidene Derivative: A Case of Total Internal Conversion. Photochem. 2022; 2(4):849-865. https://doi.org/10.3390/photochem2040054
Chicago/Turabian StyleMencaroni, Letizia, Alessio Cesaretti, Giuseppe Consiglio, Fausto Elisei, Cosimo Gianluca Fortuna, and Anna Spalletti. 2022. "Photobehavior of an Acidochromic Dinitrophenyl-Hydrazinylidene Derivative: A Case of Total Internal Conversion" Photochem 2, no. 4: 849-865. https://doi.org/10.3390/photochem2040054