Article

Power and Energy Requirements for Carbon Capture and Sequestration

by
Efstathios E. Michaelides
Department of Engineering, Texas Christian University, Fort Worth, TX 76129, USA
Submission received: 24 January 2025 / Revised: 23 February 2025 / Accepted: 27 February 2025 / Published: 2 March 2025

Abstract

:
Carbon capture and sequestration have been recently presented as a viable option to reduce atmospheric carbon dioxide emissions and mitigate global climate change. The concept entails the capture, compression, transportation, and injection of the gas into a medium suitable for storage. This paper examines the thermodynamic and transport properties of carbon dioxide that are pertinent to its sequestration and storage, describes the various methods that have been recommended for its separation from the mixture of the flue gases, and determines the mechanical power and heat rate required for the capture of the gas. The power required for the compression and transportation of the gas by a pipeline is also determined, as well as the effect of the ambient temperature on the transportation power. Calculations for the total power required are performed for two cases, one a cement production unit and the second a coal power plant. The mechanical power needed for the sequestration of CO2 is substantial in both cases, with the cement unit needing less power because of the availability of high-temperature waste heat. In both cases, the equivalent mechanical work needed for the sequestration and storage of this gas is on the order of 1 MJ per kg CO2 sequestered.

1. Introduction

The consequence of fossil fuel combustion since the beginning of the Industrial Revolution has been the gradual accumulation of carbon dioxide (CO2) in the atmosphere and the significant increase of the concentration of this gas, from 280 ppm in 1800 to more than 423 ppm (seasonally adjusted) in 2024 [1]. Several scientific organizations have sounded the alarm on the accumulation of greenhouse gases, and CO2 in particular, and the Intergovernmental Panel on Climate Change (IPCC) has issued warnings about global climate change (GCC) [2]. The entire world has agreed that action must be taken to decrease global atmospheric CO2 emissions and mitigate GCC. The most effective ways to reduce CO2 emissions are energy conservation, higher energy efficiency in homes and industry, and accelerated conversion to renewable energy sources [3,4], with, perhaps, contributions from nuclear energy power [5]. Other decarbonization methods and systems, such as carbon capture and sequestration (CCS), will assist in the reduction of atmospheric CO2 concentration. Indicative of the perceived importance of CCS is that the more recent studies and roadmaps to achieve zero CO2 emissions by the International Energy Agency (IEA) include the CCS option [6].
The main premise of CCS is the separation of CO2 from other effluents of combustion processes, transportation of this greenhouse gas, and storage in a safe subterranean reservoir or in the deep ocean. The best candidates for CO2 harvesting are major point sources, such as fossil fuel power plants, cement production facilities, steel manufacturing factories, and chemical syngas production plants. These are all stationary point sources of the gas that accounted for 48% of the total global CO2 emissions in 2022 [7]. The capture of the gas from these land-based sources and its long-term storage will decrease CO2 accumulation in the atmosphere.
It must be noted that, oftentimes, the term carbon capture utilization and storage (CCUS) appears in the scientific literature and trade journals [8]. However, a higher global utilization plan suffers from the significant drawback that only 230 million tons of gas, which represents less than 0.6% of the global emissions, are currently utilized, according to the EIA [9]. Some utilization applications, such as the production of urea for fertilizers, may be promising since only 5–6.5% of the CO2 in the molecules of urea is released into the atmosphere [10]. Also, the injection of CO2 (in a supercritical state) in mature oil fields, the so-called enhanced oil recovery, appears to be promising because most of the injected gas is trapped in rock formations [11]. However, one of the most popular applications, carbonated drinks, which currently utilize 26% of the captured gas, does not have any sequestration effect because all of the CO2 in carbonated drinks is released by human eructation.
Several investigators studied the application of CCS technology in specific industries with a heavy dependence on fossil fuels and significant CO2 emissions. CO2 capture and sequestration would enable these energy-intensive industries to continue their operations while contributing to the mitigation of GCC. Among these, Paltsev et al. performed a numerical study for “hard to abate sectors” of industry that include the cement, chemical, and steel industries [12]. Lee et al. used an economic model to examine the applicability and any advantages of CCS technologies in the steel industry [13]. Al Baradi et al. performed a review of the CO2 shipping methods (batch methods) to extend carbon sequestration by industries to geographic regions where CCS is not feasible [14].
This paper presents a holistic analysis of the energy requirements for CCS by analyzing all the processes involved and calculating the total power and energy that are necessary for long-term CO2 sequestration. The processes are analyzed using thermodynamics methodology to determine realistic efficiencies and use the exergy concept for CO2 capture. Novel aspects of this paper include a critical presentation of the pertinent information for the sequestration properties of CO2; the separation thermodynamic efficiencies, which are based on an established thermodynamic benchmark for the minimum separation work for gases; the required power for the compression of CO2; the choice of realistic pipelines for its long-range transportation; and the effects of the ambient temperature on the transportation power. The paper shows that deep-ocean injection is a realistic storage option for the long run. The power requirements of the combined CCS processes are calculated for two units, one a cement factory and the second a coal power plant currently in operation. In summary, this study offers a holistic and complete evaluation of all the energy/power needed for CCS to become a realistic solution to alleviate the GCC.
The following sections briefly outline the thermodynamic and transport properties of CO2 that are relevant to CCS processes, including the density of the water–CO2 mixtures; include a brief description of the most common methods for CO2 capture from the flue gases; present in detail the calculations for the CO2 compression, transportation, and injection; and finally apply the methodology to two actual plants (one a cement plant and the second a power plant) for the determination of the total energy needed for the sequestration of this greenhouse gas.

2. Properties of CO2 Pertinent to CCS

This section exposes the thermodynamic and transport properties of CO2 that are relevant to the CCS processes.

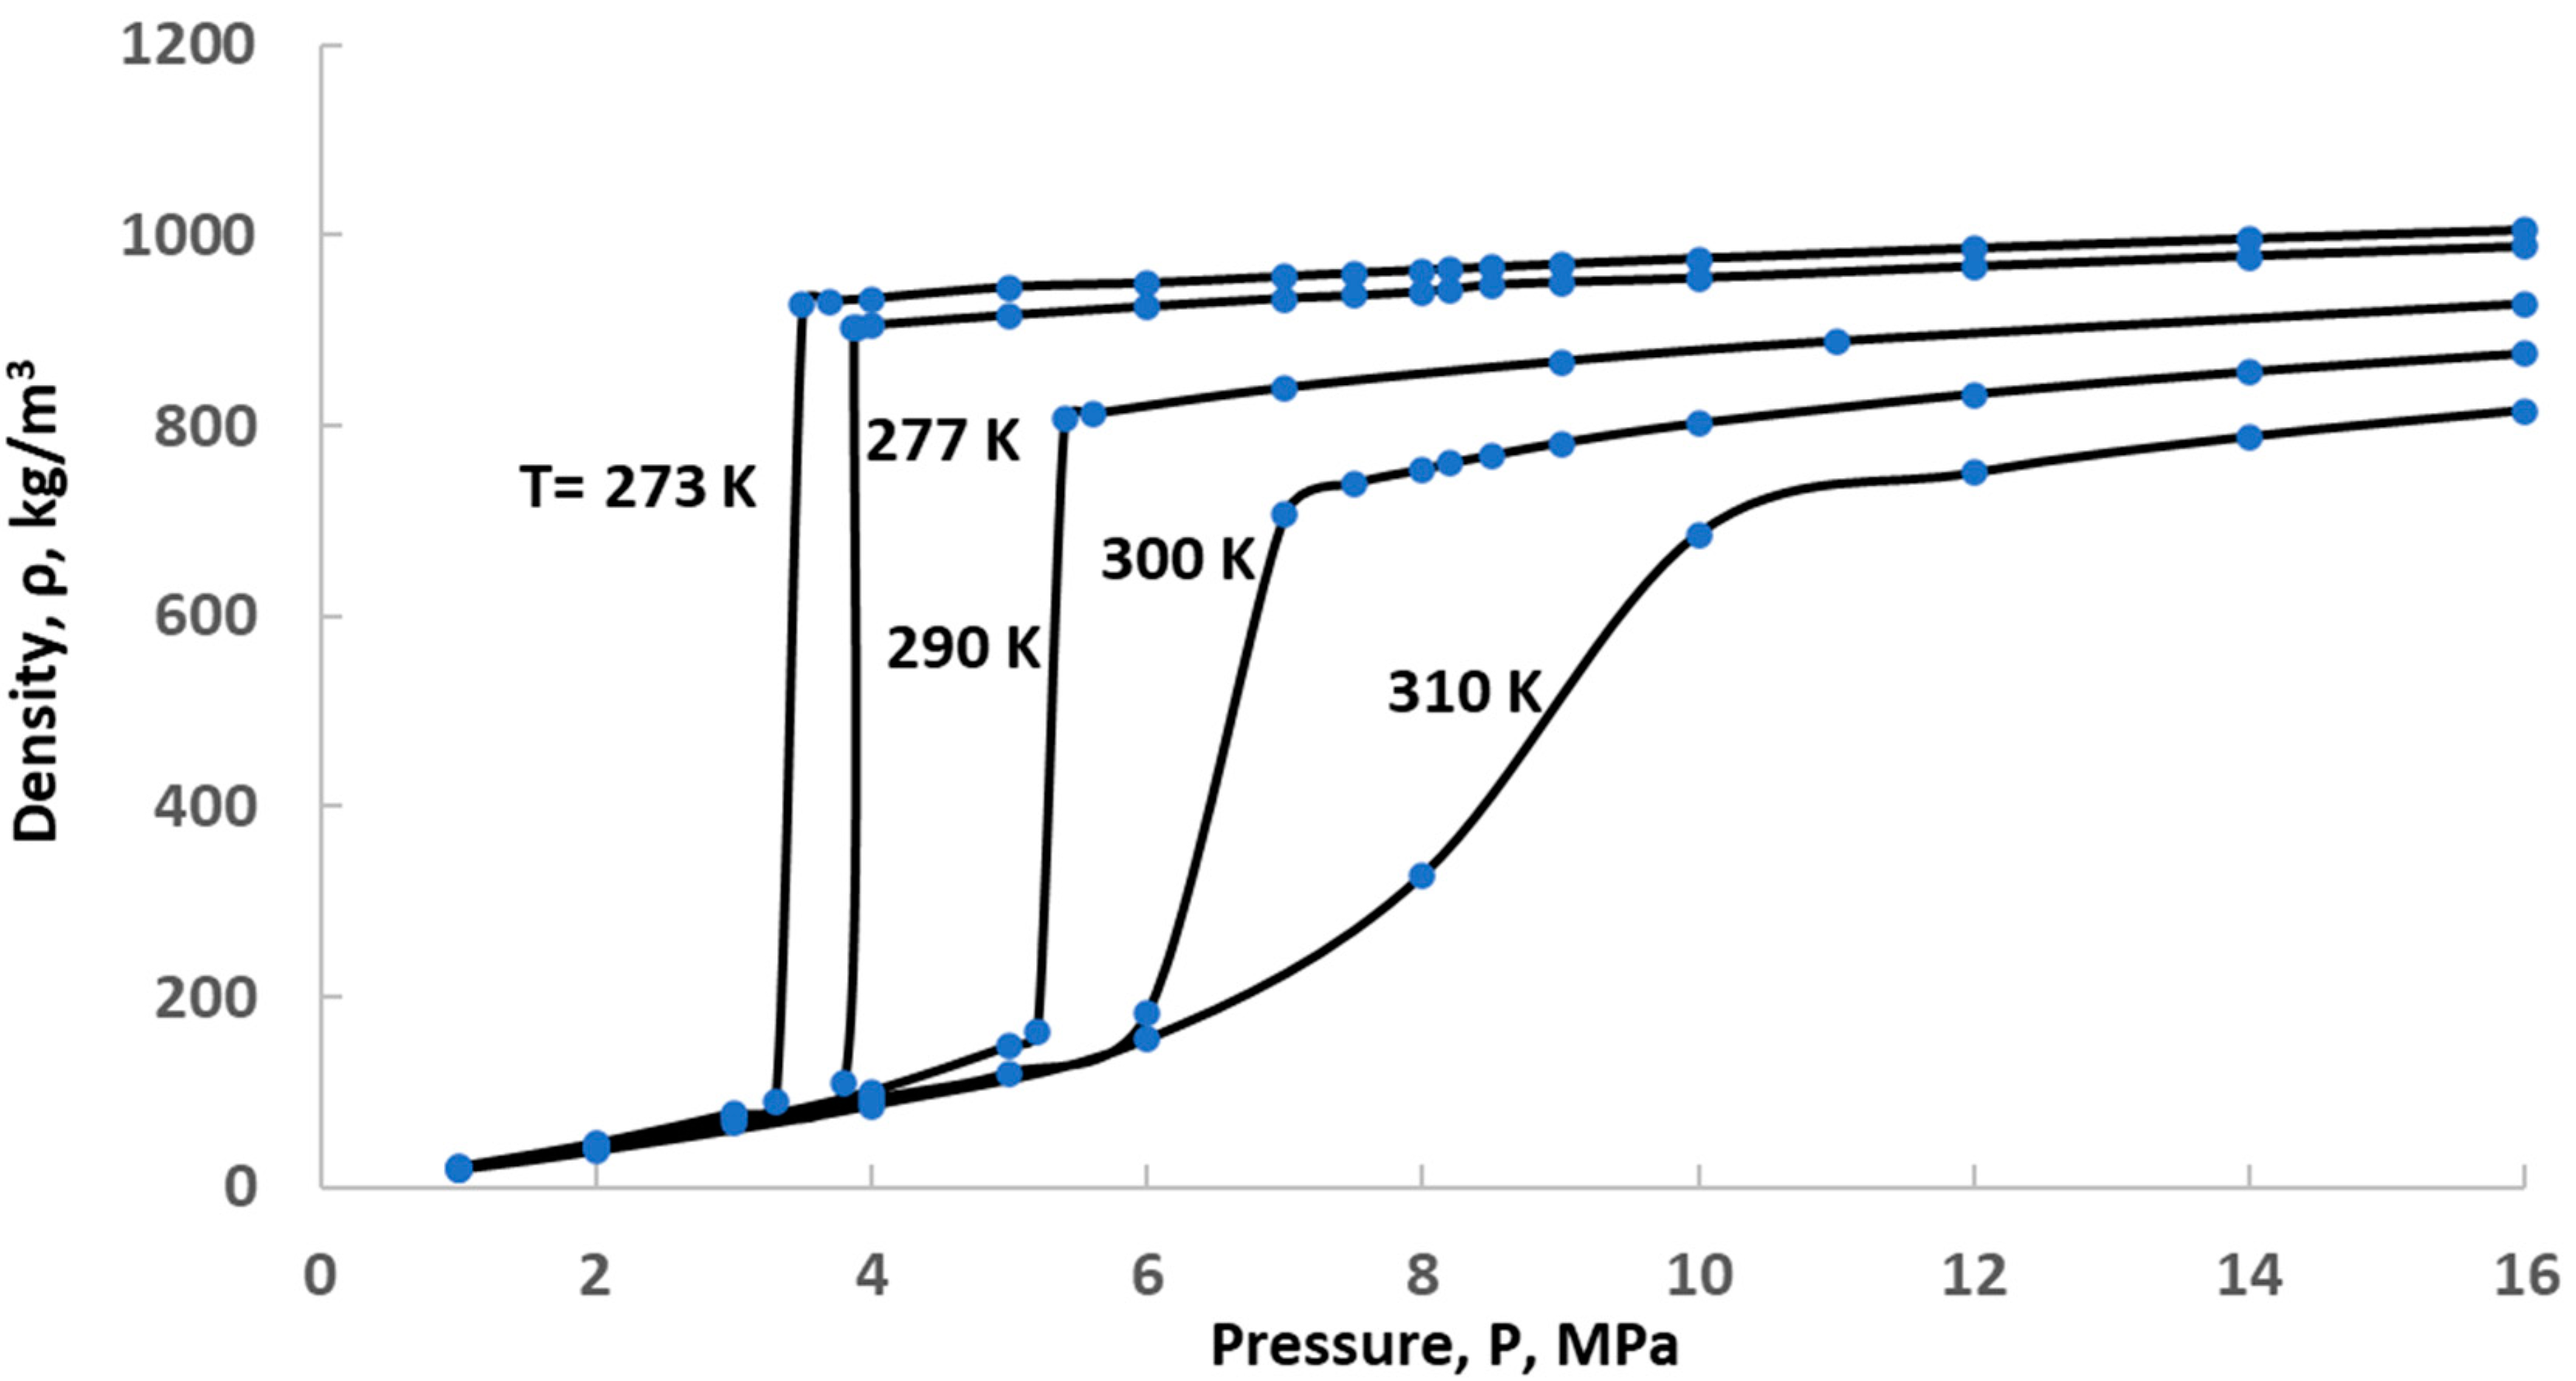
2.1. Thermodynamic Properties

Carbon dioxide is a gas at ambient conditions (0.1 MPa and 300 K); its properties are accurately described by the ideal gas model. The critical pressure of CO2 is 7.377 MPa, and its critical temperature is 304.13 K, which implies that the gas can be liquified at relatively low ambient temperatures. Figure 1 is a thermodynamic diagram of CO2 with four isobars shown close to the critical point. It is apparent that CO2 may become liquid at ambient temperatures and turn to a dense supercritical state at ambient temperatures and sufficiently high pressures [15].
To guarantee low pressure losses in a transport pipeline, it is imperative that this gas is transported at high-density conditions in the liquid or supercritical state. While it appears to be possible to transport CO2 in the liquid state at subcritical pressures, oftentimes, the ambient temperature rises above the saturation temperature (e.g., on summer days). In this case, vapor bubbles would form in the pipeline, the average flow velocity would increase, and the pipeline pressure losses would substantially increase. In addition, the presence of the vapor phase would increase the risk of pipeline erosion. As a consequence, long-distance CO2 transportation is not recommended as a pressurized liquid; it is used at supercritical pressures, even if its temperature is below critical.
Since the frictional power dissipation of all fluids is proportional to the third power of the average transportation velocity, V, it is essential for the long-distance transportation of CO2 to be at high densities. Figure 2 shows the density of CO2 as a function of the local pressure for five isotherms at 273 K, 277 K (the temperature at the bottom of deep sea, where the seawater density is highest), 290 K, 300 K, and 310 K. The Figure shows that at pressures above 10 MPa, the transported fluid is at sufficiently high densities to guarantee a reasonable velocity and low frictional dissipation. This is also the transportation practice in most enhanced oil recovery pipelines, where supercritical CO2 fluid typically enters the pipeline at pressures higher than 10 MPa [16].

2.2. Transport and Storage Properties

The dynamic viscosity of all homogeneous substances significantly varies close to the critical point, and CO2 is no exception to this rule. The dynamic viscosity of all substances in two-phase vapor–liquid states is between two limits: the viscosity of the vapor state and the viscosity of the liquid state. CO2 is transported at ambient conditions, and the typical transportation temperatures are between 260 K and 310 K, a temperature range in which the dynamic viscosity of this substance is in the range of 10 × 10−6 < μ < 18 × 10−6 Pa*s [17,18], a rather wide range, which is, however, lower than the viscosity of liquid water. The high variability of the CO2 dynamic viscosity is somehow mitigated by the fact that all long-distance CO2 pipelines for CCS should be 1–2 m underground, where the temperature variability is less than that of the ambient air.
The CO2 readily dissolves in water, including saline water. For this reason, CO2 was originally named “the carbonic acid gas”. Its solubility in water at ambient conditions is 1.69 kg/m3 and increases with pressure according to Henry’s law, becoming 14.52 kg/m3 at 1.0 MPa [19]. When CO2 is dissolved in saline water, the solution has a slightly higher density than that of the water itself. This is a very interesting property for storage in the oceans because the heavier CO2–water solution sinks to the bottom of the sea and stays there. For example, the seawater density at 4 MPa and 276.15 K is 1031 kg/m3, but the density of the CO2–seawater solution (at 6% CO2 concentration by mass) is 1048 kg/m3, a 1.65% increase that acts to sink the CO2–seawater solution [20]. This is very helpful for CO2 sequestration in the deep ocean, where the timescale of the sequestered solution is expected to be on the order of 500 years [21].

3. Methods of CO2 Capture and Energy Requirements

3.1. Methods of Capture

Since the main stationary CO2 emission sources are power plants, several processes have been developed for the separation of CO2 from the combustion products and its subsequent capture. Among the most frequently used processes for CO2 capture are chemical reactions with ammonia and ammonia compounds. Valenti et al. used chilled ammonia and performed a detailed study on the NH3-CO2 reaction and the separation of the gas from the other combustion products [22]. A detailed study by Bonalumi et al., also using ammonia, estimated that this process will cause significant electricity generation costs, close to USD 124/MWh—three to four times higher than the wholesale electricity price in most States of the USA [23]. In addition, chilled ammonia processes (CAPs) suffer other disadvantages such as un-reacted ammonia, which escapes into the atmosphere (ammonia slip), additional cooling and acid wash recovery systems, substantial energy expenditure for the cooling, dedicated cooling equipment, as well as health and safety concerns (including toxicity, explosion hazards, and corrosiveness).
Another CO2 separation method utilizes the absorption of the gas with amines, followed by the subsequent regeneration of the amine. Weiland et al. proposed a solution of monoethanolamine (MEA) and methyldiethanolamine (MDEA) for the separation of CO2 from the combustion gases [24]. Aqueous MEA and piperazine were proposed by Aliyon et al. [25], while Carapellucci et al. also considered MEA capture with a molten carbonate fuel cell, which concentrates the gaseous CO2 in its anode and simplified the capture process [26]. Rao and Rubin [27] also worked with amines and developed methods to improve the capture efficiency of the gas. In general, 0.5 kmol of CO2 is captured per kmol of amine, and the latter is regenerated by heat addition [28]. Other chemical separation methods for CO2 include the use of the carbonate mineral trisodium hydrogendicarbonate dihydrate (trona) [29]. An extensive review of the ecological and environmental impacts of CO2 capture using ammonia and amines concluded that there are fewer environmental impacts of the latter and that amines are preferable to ammonia in the long run [30]. Whether amines or ammonia are used for CO2 capture, heat must be supplied to the reaction products in order to separate the CO2 and regenerate the original chemical compounds.
A number of studies on CCS used the exergy and exergetic efficiency concepts [31] to evaluate the energy/power performance of the chemical separation methods. These studies pointed out methods to minimize the energy requirements and improve the efficiency of specific types of plants [32,33]. A thermoeconomics study [34] and an exergoeconomics analysis [35] of CO2 removal from combustion products by chemical methods (including the regeneration process of the chemicals) highlighted the ecological and environmental advantages of the chemical processes. However, the same studies showed considerable amounts of high-temperature heat inputs in the chemical regeneration processes, which is an exergetic drawback for chemical separation. A review article by Akinola et al. [36] summarizes the performance of several absorbent materials for CO2 capture.
Another method for CO2 separation from the flue gases is mechanical separation using membranes. The study by Zhang et al. [37] showed that membranes need substantially high quantities of energy for flue-gas pressurization, and this has become a constraint for membrane separation technology. The same study determined that the selectivity of state-of-the-art membranes is in the range of 70−90%, which implies that the captured CO2 is mixed with some of the other combustion products. Extensive research worldwide in the last ten years has developed new materials for membranes, and an extensive study by Dai and Deng [38] determined that some of these membranes are currently competitive with chemical methods of separation. An encouraging fact for membrane technology is that the semipermeable membranes may deliver the theoretically minimum work for the separation of CO2, as described in Section 3.2 below.
A third general method of CO2 separation is liquefaction, which entails pressurization of the entire mixture of flue gases and the subsequent cooling of the mixture for the CO2 to separate as liquid. However, the exergetic efficiency of the liquefaction/separation process is very low, less than 8% [31]. Significant work has also been performed to develop the physical adsorption of CO2 in other chemicals. This method is based on the adsorption of CO2 molecules on the surface of materials by the weaker van der Waals forces. An analysis of the recent progress of physical adsorption methods and materials, including the regeneration process, appears in the review article in [39].
In order to supplement the high energy consumed by the separation processes, additional energy generation in existing power plants has been suggested, e.g., a solar-assisted cycle [40] or a biomass-assisted secondary combustion [41]. A review of the solar-assisted processes in coal power plants concluded that large solar collectors could be used to supply high-temperature heat for chemical separation and avoid the decline of the power plant’s efficiency [42]. However, this addition to the existing power plants entails additional capital cost and, equally important, additional exergy dissipation associated with the conversion of the local solar irradiance to heat [31,43].

3.2. Minimum Mechanical Work

The chemical separation methods for the capture of CO2 gas from the combustion effluents entail both heat and mechanical work, while the separation by membranes only entails mechanical work for the pressurization of the combustion gases. Michaelides [44] considered the separation of the gases using the classical concept of semipermeable membranes—a concept introduced by Maxwell and readily used in classical thermodynamics [45]. He determined that the minimum work required for the CO2 separation, regardless of the separation method used (chemical, electrochemical, mechanical, etc.), with the partial pressure of the gas increasing from Pi to P0 = 1 atm is:
w s e p 0 = T 0 R ln P i P 0 T 0 R ln x i ,
where R is the gas constant of CO2, 0.189 kJ/kgK, and T0 is the temperature at which separation occurs, typically the ambient temperature. CO2 is modeled as an ideal gas at low pressures, and the ratio of the pressures, Pi/P0, is equal to the molar fraction of the gas, xi, in the mixture of the combustion gases, which is indicated by the second part of Equation (1). Since xi < 1 and w0sep < 0, this equation signifies that mechanical work must be spent for the separation of the gas. When the original volumetric concentration of CO2 is 0.15—a typical value for flue gases—the minimum separation work is 107 kJ/kg and becomes higher at lower concentrations. For example, if CO2 is removed from the atmospheric air, where its concentration is close to 0.00042, the separation work would be 3.5 times higher than its removal from the flue gases. Such calculations lead to the conclusion that the separation and removal of CO2 at the sources of production is by far more advantageous than its removal from the atmosphere.
The concept of reversible semipermeable membranes is theoretical, and such membranes that would efficiently separate the CO2 from a gaseous mixture have not been developed in practice. Continuing research with new membrane materials [38] may reduce the currently high energy needs for CO2 separation by membranes. The actual methods for CO2 separation entail higher actual separation work, wact, and are characterized by efficiency, which is defined as follows:
η s e p = w s e p 0 w a c t ,
At the state of membrane technology in the early 21st century, the actual membrane separation efficiencies were very low compared to the benchmark of Equation (1). Actual membranes operating with high pressure and several stages have low selectivity, and their efficiencies are in the order of 10% [37,38]. Separation of CO2 from flue gases by a liquefaction process entails a series of energy-consuming processes—e.g., pressurization of the entire mixture of the flue gases, cooling, and throttling—and its efficiency is in the range of 5–8% [31]. Chemical methods (such as ammonia or amine separation) include mechanical (parasitic) work, as well as heat at temperatures in the range of 81–115 °C. This heat is equivalent to mechanical work, and when this work is calculated, the efficiencies of the chemical methods drop to the range of 8–15% [46,47], a range that is consistent with the conclusions in the original IPCC report of 2007 [48] and the more recent study by Davison et al. [49] (who only considered the CO2 capture process). A recent experimental process suggested the use of gravity separation of the amines using phase-change solvents for the reduction of the parasitic work [50]. Such processes would slightly improve the separation efficiency to the range of 15–18% but not much higher.
Undoubtedly, the separation of CO2 from the flue gases of a combustor is currently the most inefficient part of the CCS processes. If new and more efficient technologies for gas separation are developed in the future, the required mechanical work will drop, and CCS will be less energy consuming.

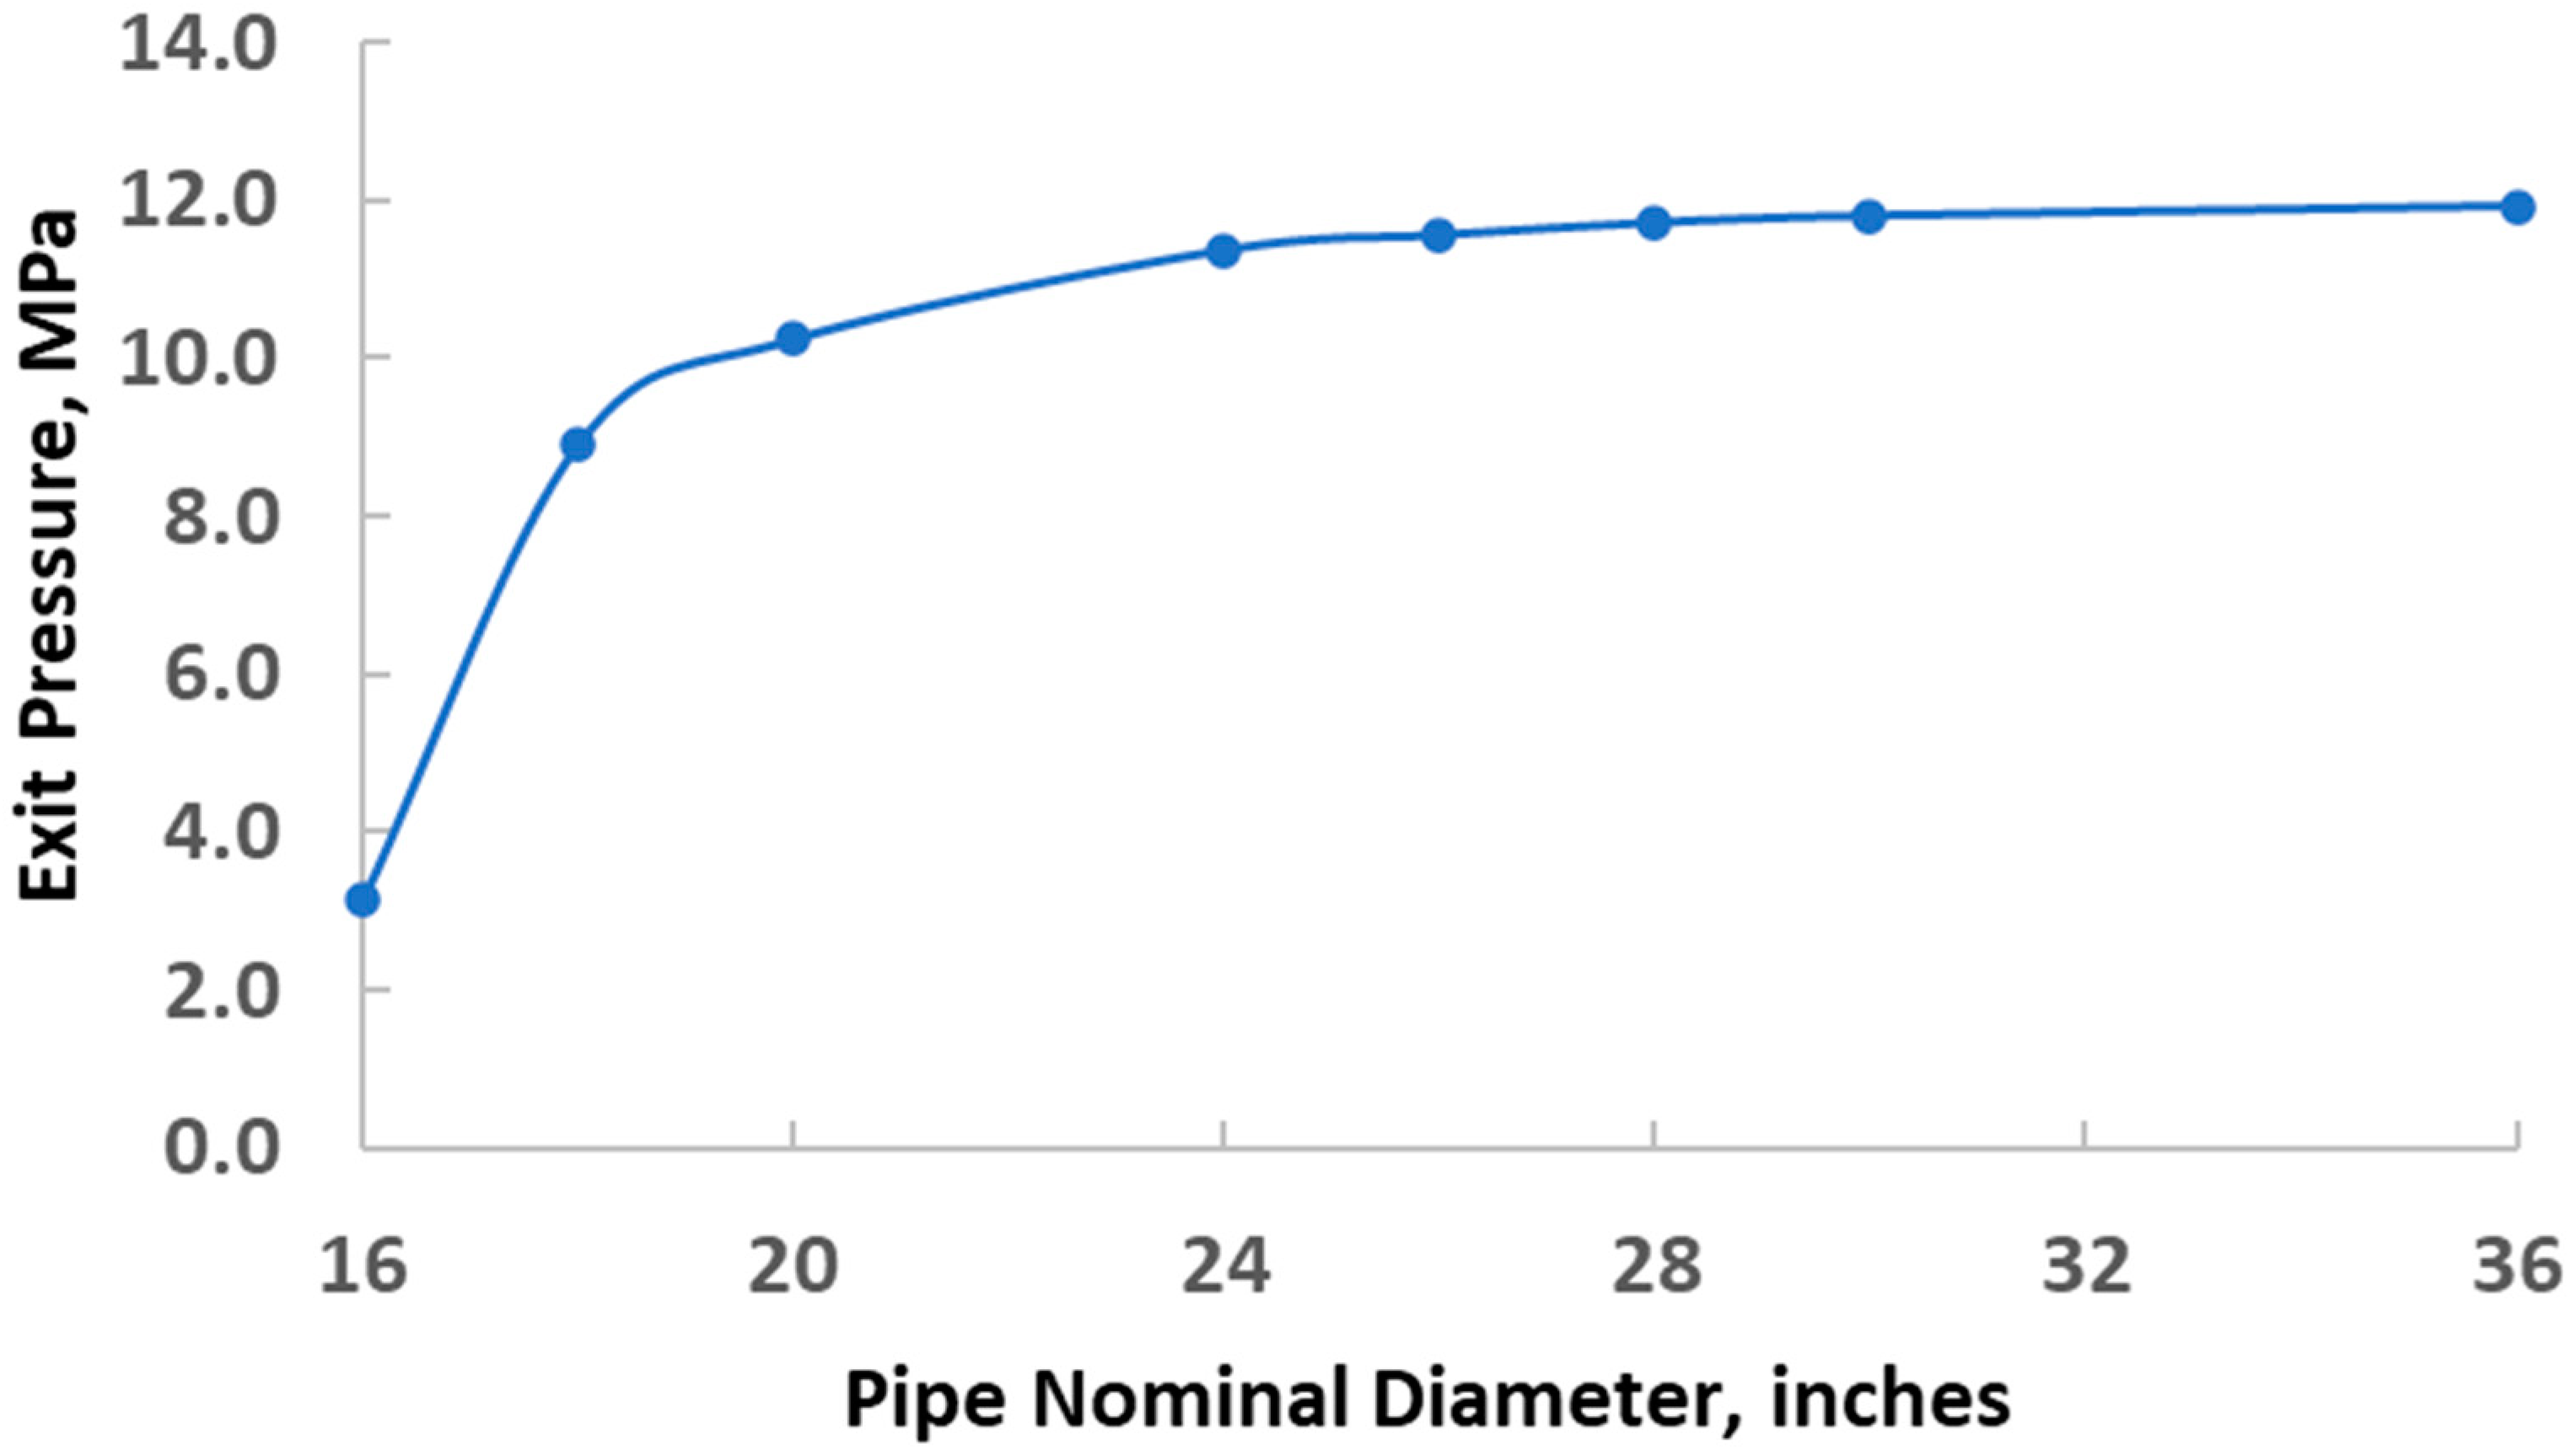
4. Compression and Transportation

It is apparent in Figure 2 that CO2 may form a two-phase mixture at ambient temperatures and pressures below 8 MPa. For any kind of long-distance transportation, this type of mixture is avoided because the density of the transported fluid is very low (and the transportation velocities high); also, because the interactions of the two phases (bubbles or slugs in liquids) cause vibrations, erosion, and significant deterioration of the pipelines [51]. Liquefaction of CO2 and its transportation in batch processes (e.g., by trucks, railway cars, and ships) is energy inefficient and very expensive.
Such considerations eliminate most choices of CO2 transportation and leave transportation as a supercritical fluid the only viable option for the long-haul transportation of the gas. The current pipelines in the USA that transport CO2 for enhanced oil recovery follow this method of supercritical gas transportation [16,48].
Multistage compressors are used to compress CO2 to supercritical pressures. The power consumed by the compressors in a multistage compression system is:
W ˙ p r a c t = m ˙ 1 η C 1 Δ h s 1 + 1 η C 2 Δ h s 2 + 1 η C 3 Δ h s 3 + ,
where Δhsi and ηCi denote the isentropic enthalpy difference and the corresponding isentropic efficiency of every compressor. The sum extends to the number of stages/compressors. The efficiency of large, state-of-the-art compressors is in the range of 80–85%. The small parasitic power consumed by the intercooler fans may be incorporated into the compressor efficiencies, ηCi.
The mechanical energy equation for the transportation of a fluid from point 1 to point 2 of a pipeline is [52]:
P 1 + ρ g z 1 + 1 2 ρ V 1 2 + W ˙ t r 0 ρ m ˙ = P 2 + ρ g z 2 + 1 2 ρ V 2 2 + 1 2 ρ V a v 2 f L D + K m l
where P is the static pressure; Vav is the average velocity of the fluid in the pipeline; ρ is the density of the transported fluid; g is the gravitational constant; m ˙ is the mass flow rate of the fluid; W ˙ t r 0 is the actual power needed for the transportation; D is the internal diameter of the pipe; f is the pipe friction factor, which depends on the flow and the type of pipeline material [52]; L is the total pipeline length; and Kml denotes the so-called “minor losses” in the pipeline that include bends, elbows, valves, etc.
The last term in Equation (4) represents the power dissipation in the pipeline. This term is the dominant term in long-distance fluid transportation, where the length is greater than 10 km and L>>D. Hence, the power needed for the long-distance transportation of any fluid becomes [52]:
W ˙ a c t t r = π 8 D 2 ρ V a v 3 f L D + K m l + 2 g z 2 z 1 V a v 2 ,
In the majority of the existing CO2 pipelines, the gas compression at the origin (in the range 10–15 MPa) is sufficient to overcome the dissipation in the entire length and for the gas to arrive at the end of the pipeline at supercritical pressure and high density. In this case, W ˙ t r 0 = 0 in Equation (4). If this is not the case—e.g., in very long pipelines exceeding 1000 km—intermediate compression stations must be built to boost the pressure by supplying additional power.
CO2 emanating from power plant combustors and cement kilns contains a small fraction of corrosive gases, such as SO2 and nitric oxides. These gases would react chemically and corrode carbon steel pipelines unless the CO2 stream is cleaned [53]. The use of carbon-resistive alloys (e.g., 316L, 22%Cr, and 25%Cr steel) in pipelines to inhibit corrosion is highly unlikely because these alloys are very expensive. In addition, impurities, if they are in significant quantities, will affect the compression work, alter the density and viscosity of the transported fluid, may form bubbles and other vapor formations that would impact the power requirements for long-distance transportation, and will influence the injection process. More importantly, impurities are usually environmental pollutants that should not be released into the aquatic environment. The solution to all these problems is to clean the CO2 gas from all corrosive and offensive materials before transportation. Other solutions (depending on the type of impurities) are (a) to use non-corrosive cladding materials on the carbon steel pipe and (b) to use polymer-lined carbon steel. The adoption of any of these solutions significantly adds to the cost of pipeline materials [53]. It must be noted that the pipeline construction materials and laying underground entail an additional CO2 footprint, which is not included in this analysis.

Effect of Temperature

The temperature significantly affects the thermodynamic and transport properties of all fluids close to the critical point [44]. As a result, the ambient temperature has a substantial effect on the long-distance transportation of CO2. Figure 3 depicts the pressure drop and power dissipation for two horizontal pipelines carrying CO2, one with a 30” (ID is 730 mm) nominal diameter and the other with a 24” (ID is 581 mm) nominal diameter, with dimensions and properties obtained from the ASME standards [54]. Both pipelines carry 300 kg/s of supercritical CO2, which is approximately the mass generated in a 620 MW coal power plant, for a distance of 500 km [55]. The pipelines are wide enough for all the dissipated power to be conducted to the atmosphere, and therefore, the transport is isothermal at ambient conditions. The calculations were conducted with a finite difference numerical algorithm using segments of 1 km length. It is observed in Figure 3 that when the ambient temperature rises above 308 K (35 °C), both the dissipated power and the pressure drop increase substantially. This implies that during the very hot summer days (when more power is demanded by the consumers because of air conditioning), higher power would also be needed for CO2 transportation. The temperature effect is mitigated on land by burying the pipeline in the ground at depths of 1–2 m, where the annual temperature variability is limited—a rather costly but necessary undertaking. Undersea pipelines, where the water temperature does not reach 300 K, do not suffer from this problem.

5. Injection, Storage, and Monitoring

The storage of CO2 has to be either inland or in the ocean. Oil fields have been proposed for the inland storage of this gas, where the CO2 will displace the petroleum (and will also facilitate enhanced recovery). A moment’s reflection, however, proves that oil fields cannot store a high fraction of the generated CO2. The oil fields are deep underground, where the temperature is on the order of 50 °C or higher. Supercritical CO2 at this temperature and pressure of 12 MPa has a material density of 587 kg/m3. Given that the annually and anthropogenically generated mass of this gas is approximately 36.6 × 10¹² kg [56], the volume needed for the storage of the generated CO2 is 62.4 × 10⁹ m3 or 392.3 × 10⁹ bbl. However, the total annual production of petroleum is only 32.8 × 10⁹ bbl, which means that only 8.4% of the annually emitted CO2 could be stored, even if all the oil fields in the world were used for CO2 storage. In the case of Texas (a major oil production state), a single coal power plant (the Martin Lake plant) generates enough CO2 to fill more than 13% of the oil fields in operation in the entire State of Texas. The entire capacity of the famous Uchira formation, offshore in the west of Norway, could only store one to two years of anthropogenic CO2 emissions [57].
Storage in the deep ocean is a different matter because CO2 readily dissolves in water and seawater to form mild carbonic acid. The seawater–CO2 solution is heavier than the seawater and slowly sinks to the bottom of the ocean, where it can be stored under low temperatures and extremely high pressures at the bottom of the sea [19,20,21]. The volume of the oceans (1.4 × 10¹⁸ m3) is high enough to contain the entire mass of the generated CO2 for centuries, and if the CO2 is well mixed with the water, the ocean acidification would be insignificant. Essentially, the ocean has all the characteristics of a mass reservoir (in the thermodynamic sense) for this gas, and for this reason, only deep ocean sequestration is considered in the two cases described in Section 6.
It is axiomatic that, after completion, every technical project needs to be appraised and assessed. Carbon sequestration systems are no exception to this rule. Periodic monitoring of the CO2 storage sites needs to be performed to primarily assess the following two outcomes:
  • Leakage of CO2 into the atmosphere.
  • Environmental effects (local and regional) of the stored CO2.
Since the stored CO2 is essentially in the form of liquid carbonic acid, after its injection into the ocean, negligible leakage is expected from its ocean storage. However, if the dissolved CO2 does not sink fast in the bottom, it may cause local or regional acidification, which is detrimental to the ecosystem. The monitoring of the injection site will determine if the injection location needs to be periodically moved. The IPCC report for CCS estimated the cost of monitoring to be approximately 3% of the total costs [47].

6. Total Power for Sequestration—The Cases of a Coal Power Plant and a Cement Plant

Results of calculations are presented for the total power and energy needed for the capture, compression, transportation, and injection of 90% of the average mass flow rate of CO2 generated (and currently emitted in the atmosphere) from two CO2-intensive plants in Texas, a cement production facility and a coal power plant. The value of 90% is chosen because the separation and capture of higher fractions of the gas by chemical or mechanical means entails much higher energy expenditure.

6.1. A Cement Production Plant in Midlothian Texas

Limestone (CaCO3) is the primary ingredient for the production of cement. The north-central part of Texas—close to the city of Midlothian—has very large deposits of limestone. The cement production industry has been attracted to the region because of the limestone deposits. For the production of cement, the limestone is heated to about 1200 K and disintegrates into CaO and CO2. The CaO is further heated to approximately 1800 K with other oxides (primarily SiO2 and Al2O3) to produce the clinker, the base chemical from which cement is finally made. Most of the high enthalpy of the produced hot clinker is transferred to the environment as waste heat. The entire cement manufacturing process is very energy intensive, with most of the energy currently derived from fossil fuels. As a result, the production of cement is a major source of CO2, which is emitted both from the combustion of fossil fuels and from the chemical conversion of CaCO3 to CaO. Actually, cement production accounts for 61% of CO2 emissions from all of the mineral sectors in the USA and 76% in Texas [58]. It is apparent, however, that a cement production plant has very high quantities of waste heat, which may be used for the capture of CO2 with amines.
We consider a cement plant that produces approximately 2.5 tons of cement annually in the north-central region of Texas. Taking into consideration the statistics of the CO2 production from cement units [59], the plant would also emit approximately 2.1 million tons of CO2 per year, or an average of 63.7 kg/s. Given the large amount of waste heat in the cement production facilities, the CO2 capture and separation from other gases can be accomplished with any of the amine processes and only the consumption of parasitic work, which is calculated to be approximately 0.1 kWh per kg CO2 (0.36 MJ/kg) [22]. It is noted that this work pertains to amine separation only and not to the work required by the chilled ammonia processes (CAP), which require significantly more work for refrigeration [22,23].

6.2. CCS for the Welsh Coal Power Plant in Pittsburgh, Texas

The J. Robert Welsh coal power plant has a nominal capacity of 1 GW, with 1056 MW available peak capacity, and is located in Pittsburg, Texas, approximately 120 km northeast of Dallas. In 2023, it generated 3579 GWh of electric energy, consuming 41,422 × 109 Btu (43,700 million MJ), mostly generated from Wyoming sub-bituminous coal combustion [55]. The CO2 emissions from this power plant in the year 2023 were 4039 × 106 kg [55] or approximately 128 kg/s. The average conversion thermal efficiency of the power plant is calculated to be slightly less than 30%, and the generated electricity is primarily transmitted to the Dallas-Fort Worth Metroplex.

6.3. Power and Energy Needed for the CCS of 90% of the Produced CO2

Calculations were performed for the capture, pressurization, transportation, and injection of 90% of the CO2 produced by the cement plant and the coal power plant from their locations to injection sites in the Gulf of Mexico, where the water depth is at least 600 m. Given that the northern part of the Gulf is rather shallow, such locations are within 140–200 km offshore. The average CO2 mass flow rates to be sequestered are approximately 57.3 kg/s from the cement plant and 115.2 kg/s from the power plant. The corresponding distances for pipeline transportation are 680 km and 740 km.
At first, the power requirements for capture (separation from other gases) were calculated. Amine separation for both plants was stipulated because this chemical method is most commonly used and has the highest exergetic efficiency, as explained in Section 3.1. The cement plant has the advantage that a great deal of waste heat is available for the regeneration of the amine, and this heat does not have to be generated from fossil fuel combustion. Thus, the power requirements for the separation of CO2 from other gases are limited to the parasitic losses, 0.1 kWh per kg CO2 (0.36 MJ/kg) [22], or 20.6 MW for the entire mass rate of captured CO2. For the Welsh power plant, Equation (1) implies that the reversible work of separation from a 15% flue gas mixture is 107.5 kJ/kg. Given the state of separation technology, a 15% exergetic efficiency was stipulated for the power plant, and the power requirement for the capture of 115.2 kg/s CO2 is 82.6 MW. Based on these, the annual electricity requirements are 180,456 MWh for the cement plant and 723,576 MWh for the Welsh power plant—a very large amount of energy by any means.
The second stage for CCS is gas pressurization, which is a requirement for its transportation. Since the pipeline temperatures may reach and exceed 300 K, it is apparent from Figure 2 that supercritical pressures (higher than 7.4 MPa) would be needed along the entire pipeline for the density of CO2 to be high enough for transportation.
For the complete dissolution of CO2 in seawater, a good injection depth is 600 m, where the hydrostatic pressure in the ocean is 6.033 MPa. At this depth, the temperature of the seawater is close to 277 K (which is lower than the critical temperature of CO2). Because the last 120 km of the pipeline are underwater, the temperature of the CO2 is expected to be close to the water temperature, and for this reason, the CO2 will be in a liquid state. The liquid state is still at high density as long as the pipeline pressure at the exit is above the saturation pressure.
For the cement plant located in Midlothian, calculations were performed for the pressure loss in a pipeline using Equation (4) for several nominal pipe diameters. The initial compression of the gas is 12 MPa. Figure 4 shows the results for nominal diameters in the range of 16–36 inches OD (these units are an international standard for pipelines). The pipes are of the type “schedule 30”, which is sufficient to withstand the internal pressure, and the internal diameter was calculated from standard commercial pipeline tables [54]. It is observed in this Figure that (with an initial gas pressure of 12 MPa) the minimum pipeline size that would deliver high-density fluid at the injection location is 18” OD. It is also observed in the Figure that the delivery pressure drops dramatically at the lower pipe diameters. This happens because the velocity in the pipeline is higher since the pipeline carries a fixed mass flow rate, and the pressure drops significantly, as Equation (4) implies.
Similar calculations for the Welsh power plant reveal that because of the higher mass flow rate carried, the minimum standard diameter would be 24”. In both cases, the gas arrives at the injection location as a high-density fluid with sufficient pressure for injection as very small drops (0.5–2 mm diameters) that quickly dissolve in the seawater and do not rise to the surface.
Based on the minimum pipeline diameters for the transportation and injection of CO2, Table 1 provides a summary of the power, as well as the total annual electric energy needed for the entire CCS for the two units.
It is observed in Table 1 that the power needed for the capture and separation of CO2 from the other combustion gases is significant for the power plant. Actually, it is higher than the power required for transportation and injection. This fact drives up the annual energy needed for CCS and significantly reduces the net electric energy generated. Given that the annual energy generation of the power plant was 3579.3 GWh in 2023, spending 1169.9 GWh for CCS would reduce the thermal efficiency of this unit from 29.49% [55] to 19.85%—by all measures, a significant reduction. This thermal efficiency reduction agrees with the estimate in [47], which does not include the injection process. For the cement unit, which has a great deal of waste heat for the gas separation process, the power for the CO2 capture is lower but still significant. The power for the compression of the gas is substantial for this unit as well. While the energy needed per unit mass of sequestered CO2 is lower for the cement unit, it is still a substantial quantity of energy.
It must be noted that after the gas is injected, environmental regulations require the periodic monitoring of the injection sites. This is accomplished with the installation of sensors and monitoring at the injection site and periodic helicopter flights (weekly or biweekly) over the route of the pipeline. The monitoring activity entails additional cost and energy expenditure, which can only be approximately estimated. While the IPCC report [47] estimates that the cost of monitoring would be similar to that of transportation, monitoring optimization procedures, by using remote instrumentation facilities, would significantly reduce the required energy for the monitoring of the pipeline and the injection site [16].

6.4. A Note on the Cost of CCS

The principal cost categories of CCS are the following:
  • The CO2 separation and capture facility.
  • The gas compression system, which includes intercoolers.
  • The power needed for all the processes.
  • The entire pipeline, including the injection system at the end. This includes permitting, materials and labor, rights of way, surveying, and trench construction.
  • Any monitoring costs, which extend to the entire life of the systems.
Carbon capture and sequestration industrial processes are still in the research and development stages. There are a few pilot CCS plants for the collection of data, but still (2025), there is not a single commercial/industrial unit where CCS is practiced. Essentially, there is no accurate data from which the cost of CCS units can be derived. While reasonable estimates for items 1 and 2 can be made, the cost of the pipelines and the cost of long-term monitoring are still unknown and cannot be estimated with any degree of accuracy. Pipeline costs may vary by an order of magnitude depending on the terrain (flat or mountainous), and the cost of offshore pipelines is twice as much as that of onshore pipelines, with the cost of the former increasing at a fast rate [60]. The choice of corrosive-resistant pipelines adds to the uncertainty of the pipeline materials cost. Monitoring costs are entirely unknown. A cost analysis of the two theoretical CCS units in this paper would be laden with very high uncertainty and would be entirely premature. For this reason, this study is limited to the thermodynamic aspects of CCS, which are invariable, and a cost analysis is not attempted. The analysis for the power and energy needed is based on sound thermodynamic theory and data and provides an accurate determination of the required energy for the sequestration of the produced carbon dioxide.

7. Conclusions

Carbon dioxide capture, transportation, and sequestration are increasingly presented as a way to reduce atmospheric concentrations and mitigate global climate change. The vast quantities emitted and the properties of CO2 do not recommend inland or aquifer sequestration. However, because its dissolution in seawater produces a heavier liquid mixture, ocean sequestration of CO2 can be successful. Mechanical work and heat must be spent to capture (separate from other gases) this gas. Its transportation and injection in the ocean require additional mechanical work, which is achieved by compression. The compression of this gas to supercritical pressures (higher than 7.4 MPa) is necessary for its transportation in pipelines, and this requires significant power. The mechanical work for the separation of the gas from the other flue gases and its capture (including the equivalent work of any heat addition) is also significant and comparable to the transportation work. Two CCS cases are examined, and calculations are performed, one of a coal power plant and the second of a cement plant, both located in Texas. It was found that because a great deal of waste heat is readily available in the cement production unit, the power for the capture of CO2 is lower but still substantial. The power required for the transportation and injection of the gas is comparable in the two units. The total work required for the capture and sequestration of CO2 in the Gulf of Mexico is calculated to be 0.802 MJ/kg for the cement plant and 1.159 MJ/kg for the coal power plant. If the work in the latter case is provided by the power plant, its thermal efficiency would drop by approximately 10 percentage points.

Funding

This research received no external funding.

Data Availability Statement

The author will provide the data for this paper upon request.

Acknowledgments

The research of the author is partly supported by the W.A. (Tex) Moncrief chair in Engineering at TCU.

Conflicts of Interest

The author declares no conflicts of interest.

References

  1. CO2-Earth—Numbers for Living Earth. Available online: https://www.co2.earth/daily-co2 (accessed on 28 December 2024).
  2. IPCC. Climate Change 2007: Synthesis Report. Contribution of Working Groups I, II and III to the Fourth Assessment Report of the Intergovernmental Panel on Climate Change; IPCC: Geneva, Switzerland, 2007. [Google Scholar]
  3. IEA. Energy Efficiency Market Report—2013; IEA Publications: Paris, France, 2013. [Google Scholar]
  4. Michaelides, E.E. Energy, the Environment and Sustainability; CRC Press: Boca Raton, FL, USA, 2018. [Google Scholar]
  5. Michaelides, E.E.; Michaelides, D.N. Impact of nuclear energy on fossil fuel substitution. Nucl. Eng. Des. 2020, 366, 110742. [Google Scholar] [CrossRef]
  6. IEA. Net Zero Roadmap: A Global Pathway to Keep the 1.5 °C Goal in Reach—2023 Update; IEA Publications: Paris, France, 2023. [Google Scholar]
  7. US-EPA. Sources of Greenhouse Gas Emissions. 2020. Available online: https://www.epa.gov/ghgemissions/sources-greenhouse-gas-emissions (accessed on 1 December 2024).
  8. Carbon Capture Utilization and Storage—Special Report. Oil Gas Journal Ebook, March 2024.
  9. Available online: https://www.iea.org/energy-system/carbon-capture-utilisation-and-storage/co2-capture-and-utilisation (accessed on 1 December 2024).
  10. Kim, G.W.; Alam, M.A.; Lee, J.J.; Kim, G.Y.; Kim, P.J.; Khan, M.I. Assessment of direct carbon dioxide emission factor from urea fertilizer in temperate upland soil during warm and cold cropping season. Eur. J. Soil Biol. 2017, 83, 76–83. [Google Scholar] [CrossRef]
  11. Commercial Carbon Dioxide Uses: Carbon Dioxide Enhanced Oil Recovery, National Energy Technology Laboratory. Available online: https://netl.doe.gov/research/coal/energy-systems/gasification/gasifipedia/eor (accessed on 5 December 2024).
  12. Paltsev, S.; Morris, J.; Kheshgi, H.; Herzog, H. Hard-to-Abate Sectors: The role of industrial carbon capture and storage (CCS) in emission mitigation. Appl. Energy 2021, 300, 117322. [Google Scholar] [CrossRef]
  13. Lee, H.; Lee, J.; Koo, Y. Economic impacts of carbon capture and storage on the steel industry–A hybrid energy system model incorporating technological change. Appl. Energy 2022, 317, 119208. [Google Scholar] [CrossRef]
  14. Al Baroudi, H.; Awoyomi, A.; Patchigolla, K.; Jonnalagadda, K.; Anthony, E.J. A review of large-scale CO2 shipping and marine emissions management for carbon capture, utilisation and storage. Appl. Energy 2022, 287, 116510. [Google Scholar] [CrossRef]
  15. REFPROP, version 2.1. Reference Thermodynamic and Fluid Transport Properties, Nat. Institute of Standards and Technology: Boulder, CO, USA, 2013.
  16. Wallace, M.; Goudarzi, L.; Callahan, K.; Wallace, R. A Review of the CO2 Pipeline Infrastructure in the U.S.; National Energy Technology Laboratory (NETL): Pittsburgh, PA, USA, 2015; DOE/NETL Report-2014/1681. [Google Scholar]
  17. Philips, P. The viscosity of Carbon Dioxide. Proc. R. Soc. 1912, 87, 48–61. [Google Scholar]
  18. Available online: https://www.engineeringtoolbox.com/carbon-dioxide-dynamic-kinematic-viscosity-temperature-pressure-d_2074.html (accessed on 28 January 2025).
  19. Li, Y.-H.; Tsui, T.-F. The Solubility of CO2 in Water and Sea Water. J. Geoph. Res. 1971, 76, 4203–4207. [Google Scholar] [CrossRef]
  20. Song, Y.; Chen, B.; Nishio, B.; Akai, B. The study on density change of carbon dioxide seawater solution at high pressure and low temperature. Energy 2005, 30, 2298–2307. [Google Scholar] [CrossRef]
  21. Hamond, H.F.; Fechner-Levy, E.J. Chemical Fate and Transport in the Environment; Academic Press: San Diego, CA, USA, 2000. [Google Scholar]
  22. Valenti, G.; Bonalumi, D.; Macchi, E. Energy and exergy analyses for the carbon capture with the Chilled Ammonia Process (CAP). Energy Procedia 2009, 1, 1059–1066. [Google Scholar] [CrossRef]
  23. Bonalumi, D.; Lillia, S.; Valenti, G. Rate-based simulation and techno-economic analysis of coal-fired power plants with aqueous ammonia carbon capture. Energy Convers. Manag. 2019, 199, 111966. [Google Scholar] [CrossRef]
  24. Weiland, R.H.; Dingman, J.C.; Cronin, D.B. Heat Capacity of Aqueous Monoethanolamine, Diethanolamine, Nmethyldiethanolamine, and N-methyldiethanolamine-Based Blends with Carbon Dioxide. J. Chem. Eng. Data 1997, 42, 1004–1006. [Google Scholar] [CrossRef]
  25. Aliyon, K.; Hajinezhad, A.; Mehrpooya, M. Energy assessment of coal-fired steam power plant, carbon capture, and carbon liquefaction process chain as a whole. Energy Convers. Manag. 2019, 199, 111994. [Google Scholar] [CrossRef]
  26. Carapellucci, R.; Di Battista, D.; Cipollone, R. The retrofitting of a coal-fired subcritical steam power plant for carbon dioxide capture: A comparison between MCFC-based active systems and conventional MEA. Energy Convers. Manag. 2019, 194, 124–139. [Google Scholar] [CrossRef]
  27. Rao, A.; Rubin, E. Identifying cost-effective CO2 control levels for amine-based CO2 capture systems. Ind. Eng. Chem. Res. 2006, 45, 2421–2429. [Google Scholar] [CrossRef]
  28. Tong, Z.; Ho, W.S.W. Facilitated transport membranes for CO2 separation and capture. Sep. Sci. Technol. 2017, 52, 156–167. [Google Scholar] [CrossRef]
  29. Furcasa, F.E.; Wanawan, P.; Chacartegui, R.; Afzal, W. Sodium carbonate-based post combustion carbon capture utilising trona as main sorbent feed stock. Energy Convers. Manag. 2020, 208, 112484. [Google Scholar] [CrossRef]
  30. Strube, R.; Pellegrini, G.; Manfrida, G. The environmental impact of post-combustion CO2 capture with MEA, with aqueous ammonia, and with an aqueous ammonia—Ethanol mixture for a coal-fired power plant. Energy 2011, 36, 3763–3770. [Google Scholar] [CrossRef]
  31. Michaelides, E.E. Exergy and the Coversion of Energy; Cambidge University Press: Cambridge, UK, 2021. [Google Scholar]
  32. Lee, W.-S.; Lee, J.-C.; Oh, H.-T.; Baek, S.-W.; Oh, M.; Lee, C.-H. Performance, economic and exergy analyses of carbon capture processes for a 300 MW class integrated gasification combined cycle power plant. Energy 2017, 134, 731–742. [Google Scholar] [CrossRef]
  33. Kunze, C.; Riedl, K.; Spliethoff, H. Structured exergy analysis of an integrated gasification combined cycle (IGCC) plant with carbon capture. Energy 2011, 36, 1480–1487. [Google Scholar] [CrossRef]
  34. Rosner, F.; Qin, C.; Rao, A.; Samuelsen, S. Thermo-economic analyses of concepts for increasing carbon capture in high-methane syngas integrated gasification combined cycle power plants. Energy Convers. Manag. 2019, 199, 112020. [Google Scholar] [CrossRef]
  35. Petrakopoulou, F.; Boyano, A.; Cabrera, M.; Tsatsaronis, G. Exergoeconomic and exergoenvironmental analyses of a combined cycle power plant with chemical looping technology. Int. J. Greenh. Gas Control 2011, 5, 475–482. [Google Scholar] [CrossRef]
  36. Akinola, T.E.; Bonilla Prado, P.L.; Wang, M. Experimental studies, molecular simulation and process modelling\simulation of adsorption-based post-combustion carbon capture for power plants: A state-of-the-art review. Appl. Energy 2022, 317, 119156. [Google Scholar] [CrossRef]
  37. Zhang, X.; He, X.; Gundersen, T. Post-combustion Carbon Capture with a Gas Separation Membrane: Parametric Study, Capture Cost, and Exergy Analysis. Energy Fuels 2013, 27, 3021798. [Google Scholar] [CrossRef]
  38. Dai, Z.; Deng, L. Membranes for CO2 capture and separation: Progress in research and development for industrial applications. Sep. Purif. Technol. 2024, 335, 126022. [Google Scholar] [CrossRef]
  39. Raganati, F.; Miccio, F.; Ammendola, P. Adsorption of Carbon Dioxide for Post-combustion Capture: A Review. Energy Fuels 2021, 35, 12845–12868. [Google Scholar] [CrossRef]
  40. Li, C.; Guo, S.; Ye, X.; Fu, W. Performance and thermoeconomics of solar-aided double-reheat coal-fired power systems with carbon capture. Energy 2019, 177, 1–15. [Google Scholar] [CrossRef]
  41. Carapellucci, R.; Giordano, L.; Vaccarelli, M. Analysis of CO2 post-combustion capture in coal-fired power plants integrated with renewable energies. Energy Procedia 2015, 82, 350–357. [Google Scholar] [CrossRef]
  42. Saghafifar, M.; Gabra, S. A critical overview of solar assisted carbon capture systems: Is solar always the solution? Int. J. Greenh. Gas Control 2020, 92, 102852. [Google Scholar] [CrossRef]
  43. Michaelides, E.E. Alternative Energy Sources; Springer: Berlin/Heidelberg, Germany, 2021. [Google Scholar]
  44. Michaelides, E.E. Thermodynamic Analysis and Power Requirements of CO2 Capture, Transportation, and Storage in the Ocean. Energy 2021, 230, 120804. [Google Scholar] [CrossRef]
  45. Kestin, J. A Course in Thermodynamics; Hemispohere: Wastington, DC, USA, 1978; Volume I. [Google Scholar]
  46. Karmakar, S.; Kolar, A.K. Thermodynamic analysis of high-ash coal-fired power plant with carbon dioxide capture. Int. J. Energy Res. 2013, 37, 522–534. [Google Scholar] [CrossRef]
  47. Arabkhalaj, A.; Ghassemi, H.; Markadeh, R.S. Thermodynamic evaluation of integrated gasification combined cycle: Comparison between high-ash and low-ash coals. Int. J. Energy Res. 2016, 40, 1638–1651. [Google Scholar] [CrossRef]
  48. Metz, B.; Davidson, O.; De Coninck, H.C.; Loos, M.; Meyer, L. (Eds.) IPCC Special Report on Carbon Dioxide Capture and Storage; Cambridge University Press: Cambridge, UK, 2007. [Google Scholar]
  49. Davison, J.E. CO2 capture and storage and the IEA Greenhouse Gas R&D Programme. In Proceedings of the Workshop on CO2 issues, Middelfart, Denmark, 24 May 2005. [Google Scholar]
  50. Nessi, P.; Papadopoulos, A.; Kazepidis, P.; Polichroniadis, A.; Ntourou, G.; Voutetakis, S.; Seferlis, P. Pilot Scale Assessment of a Novel Phase-change Solvent for Energy Efficient Post -combustion CO2 Capture. J. Environ. Manag. 2022, 317, 115489. [Google Scholar] [CrossRef] [PubMed]
  51. Michaelides, E.E.; Crowe, C.T.; Schwarzkopf, J.D. (Eds.) Multiphase Flow Handbook, 2nd ed.; CRC Press: Boca Raton, FL, USA, 2017. [Google Scholar]
  52. Munson, B.R.; Young, D.F.; Okiishi, T.H.; Huwbsch, W.W. Fundamentals of Fluid Mechanics; Wiley: Hoboken, NJ, USA, 2009. [Google Scholar]
  53. Paul, S.; Shepherd, R.; Woollin, P. Selection of materials for high pressure CO2 transport. In Proceedings of the 3rd International Forum on the Transportation of CO2, Newcastle, UK, 18 June 2012. [Google Scholar]
  54. Available online: https://www.engineersedge.com/pipe_schedules.htm (accessed on 3 February 2025).
  55. Available online: https://www.eia.gov/electricity/data/browser/#/plant/6139 (accessed on 26 January 2025).
  56. Lindsay, R. Climate Change: Atmospheric Carbon Dioxide. 2024. Available online: https://www.climate.gov/news-features (accessed on 1 January 2025).
  57. Lindeberg, E.; Vuillaume, J.-F.; Ghaderi, A. Determination of the CO2 storage capacity of the Utsira formation. Energ Procedia 2009, 1, 2777–2784. [Google Scholar] [CrossRef]
  58. Available online: https://www.epa.gov/system/files/documents/2021-11/minerals_sector_profile_2020.pdf (accessed on 26 January 2025).
  59. U.S. Cement Industry Carbon Intensities; United States Environmental Protection Agency: Washington DC, USA, 2021; EPA report, EPA 430-F-21-004.
  60. Smith, C.E. Natural gas pipeline profits, construction both up. Oil Gas J. 2016, 114, 84–96. [Google Scholar]
Figure 1. T,s diagram of carbon dioxide with four isobars around the critical point.
Thermo 05 00008 g001
Figure 2. Pressure–density diagram with four isotherms for carbon dioxide.
Thermo 05 00008 g002
Figure 3. Pressure drop and power dissipation in two 500 km long pipelines.
Thermo 05 00008 g003
Figure 4. Pressure at the end of the pipeline as a function of the standard pipeline diameter.
Thermo 05 00008 g004
Table 1. Power and energy requirements for the capture, transportation, and ocean injection of CO2 for the cement unit and the electricity power plant.
CO2 Mass Rate, kg/sSeparation, MWCompression, MWTotal Power, MWAnnual Energy, GWhEnergy per Mass, MJ/kg
Cement Unit57.320.6325.3545.98402.70.802
Power Plant115.282.5950.96133.551169.91.159
Disclaimer/Publisher’s Note: The statements, opinions and data contained in all publications are solely those of the individual author(s) and contributor(s) and not of MDPI and/or the editor(s). MDPI and/or the editor(s) disclaim responsibility for any injury to people or property resulting from any ideas, methods, instructions or products referred to in the content.

