Article

Non-Invasive Survey Techniques to Study Nuragic Archaeological Sites: The Nanni Arrù Case Study (Sardinia, Italy)

1
CRS4 (Center for Advanced Studies, Research and Development in Sardinia), 09050 Pula, Italy
2
DICAAR (Dipartimento di Ingegneria Civile, Ambientale e Architettura), Università di Cagliari, 09124 Cagliari, Italy
*
Author to whom correspondence should be addressed.
Geomatics 2024, 4(1), 48-65; https://doi.org/10.3390/geomatics4010003
Submission received: 18 December 2023 / Revised: 27 January 2024 / Accepted: 2 February 2024 / Published: 7 February 2024

Abstract

:
The Italian territory of Sardinia Island has an enormous cultural and identity heritage from the Pre-Nuragic and Nuragic periods, with archaeological evidence of more than 7000 sites. However, many other undiscovered remnants of these ancient times are believed to be present. In this context, it can be helpful to analyze data from different types of sensors on a single information technology platform, to better identify and perimeter hidden archaeological structures. The main objective of the study is to define a methodology that through the processing, analysis, and comparison of data obtained using different non-invasive survey techniques could help to identify and document archaeological sites not yet or only partially investigated. The non-invasive techniques include satellite, unmanned aerial vehicle, and geophysical surveys that have been applied at the nuraghe Nanni Arrù, one of the most important finds in recent times. The complexity of this ancient megalithic edifice and its surroundings represents an ideal use case. The surveys showed some anomalies in the areas south–east and north–east of the excavated portion of the Nanni Arrù site. The comparison between data obtained with the different survey techniques used in the study suggests that in areas where anomalies have been confirmed by multiple data types, buried structures may be present. To confirm this hypothesis, further studies are believed necessary, for example, additional geophysical surveys in the excavated part of the site.

1. Introduction

Sardinia island has an enormous cultural and identity heritage from the Pre-Nuragic (3200–2700 BC) and Nuragic (up to the 2nd century AD) periods. Nuragic Civilization was a complex society characterized by a highly evolved political system, economic organization, and religious beliefs. Nuraghes, the best-known monuments of this era, are stone structures typified by truncated conical circular towers. It is estimated that there are about 5000 nuraghes, more than 550 domus de janas, 60 holy wells, 500 giants’ graves, 200 villages, and 110 menhirs [1,2] (Figure 1). However, many other pieces of evidence are believed to be present on the island.
The objective of this research is to propose a methodology to help outline hidden archaeological structures and explore underrepresented areas of Sardinia. This objective is not easy to solve by means of a standard methodology: in the same site there may be monuments relating to different periods, the geomorphological characteristics of many Nuragic areas represent, in several situations, an obstacle to the use of some survey methodologies, not always allowing on-site investigations, and a huge complexity of Nuragic artifacts of different types may require different study techniques.
This paper describes the study carried out within the ArchaeoSardinia Project, financed by the Sardinian Government and part of the NuraghEO Project, financed by a voucher from the EU-funded Open Clouds for Research Environments project (OCRE). The main objective is to define a methodology that supports the study of archaeological sites of the Nuragic period, through the pervasive use of remote sensing technologies such as satellites, Unmanned Aerial Vehicles (UAV), and geophysical surveys. The chosen method to achieve this goal at the Nanni Arrù site consists of processing, analysis, and the comparison of data obtained using various non-invasive survey techniques and the implementation of an IT Platform for data management, archaeological site documentation, and results publication. The proposed methodology is also expected to be systematically applied to other territories.
The approach arises out of the awareness that excavation activities can be difficult in terms of effort and costs; satellite and aerial images and geophysical surveys can be useful to assess in advance the need for excavation activity for a specific area. In addition, phenomena such as ground subsidence can prevent access to buried structures and even damage the emerging ones; satellite SAR (Synthetic Aperture Radar) images may be useful to highlight the structures that are affected by such phenomena. In addition to the capability of operating under any weather conditions, the advantageous properties offered by SAR include wide-swath to spotlight coverage, kilometer to sub-meter spatial resolution, historical and present-day temporal coverage, longer to shorter wavelength, and monthly to daily revisiting time if collecting time series [3]. These properties have made the use of SAR technology attractive for various archaeological applications, some examples in [4,5,6,7].
Remote sensing techniques are widely adopted for archaeological prospecting: discovering, monitoring, preservation, and documentation [8,9,10,11].
The presence of buried archaeological remains influences vegetation and soil, it may modify ground color in the presence of both vegetation and bare soil. The so-called ‘crop marks’ are useful anomalies that occur because of differential growth of vegetation; in fact, the presence of buried structures may negatively influence the growth of vegetation, while the presence of moats may positively influence it [12,13,14,15].
Satellite images have been widely used by archaeologists to detect crop and soil marks through the use of various algorithms or the calculation of specific vegetation indices. However, the detection and interpretation of these marks are difficult tasks due to the crops’ phenological variations [16,17,18]. Moreover, crop and soil marks may not be easily detected in satellite images when observed over different periods of time and at different spatial and spectral resolutions. It is therefore useful to integrate the analysis of satellite images with the analysis of UAV images and geophysical data.
The integration of data from satellite observation, drone-deployed sensors, and geophysical methods has been carried out in some archaeological studies [19,20,21,22,23,24].
Sardinia represents a particularly interesting case both for the extent and variety of the Nuragic and pre-Nuragic archaeological heritage, which has yet to be fully explored.
Moreover, the archaeology of the island of Sardinia provides an opportunity to explore interactions among local Nuragic people and colonizers who frequented the shores of Sardinia in the Iron Age. Those interactions were centered around earlier Bronze Age nuraghi, where communities experienced increasing connections with other populations as detailed by [25].
The complexity of this context led to the adoption and combination of the tools described below.

2. Materials and Methods

The site chosen to test the methodology is the Nuraghe Nanni Arrù, one of the most important finds in recent times. The site has been declared to be of special archaeological interest by the decree n. 83 of 2 July 2018 and, according to the Legislative decree n. 42 of 22 January 2004, it is submitted to all the prescribed protection measures.
The Nuraghe Nanni Arrù is located in the municipality of Quartucciu, roughly 4 km from the southern seacoast and 17 km east of Cagliari, the capital of the Sardinia region. It was constructed in the Bronze Age roughly between the 14th and the 10th BCE. Archeological evidence from other similar Nuraghe suggests likely long-term habitation outside the tower walls, at least through the early Roman period if not the late Roman period.
The site was discovered in the early 1990s; some brief and discontinuous excavations were carried out between the years 1994 and 2000. Excavations have identified a four-lobed fortified structure consisting of a central keep with four towers, three of which leaning against the keep and a larger one in the opposite direction, in order to leave room for a large courtyard. The excavations have also partially brought to light other towers, for a total of ten rooms, and traces of the surrounding village (Figure 2). It is estimated that the lower parts of the Nuraghe are still covered by ground and extend for more than two meters below the surface.
The intense anthropic activity that is practiced up to the present day makes it nearly impossible to identify with certainty the extent of the original settlement, which is assumed to be consistent with both the size of the basalt stone tower complex and its wide chronological range of occupation.
The complex history of the origins of the Nuraghe Nanni Arrù and its determinative influence on the surrounding landscape represents an ideal use case to apply a cloud-based multi-scalar investigation methodology that includes:
  • Multitemporal/multisensor processing and analysis of satellite images;
  • Multisensor processing and analysis of UAV data;
  • Processing and analysis of geophysical data;
  • Data management and publication through the ArchaeoSardinia Platform.
The choice of the different remote sensing techniques has been dictated by the particularities of the Nanni Arrù site. The surveys carried out and the reason for the choice are described below.
The first step comprises a visual analysis of aerial and Very High Resolution (VHR) satellite images from Google Earth covering a period of time between 1955 to 2019 (Figure 3). This preliminary analysis highlights three possible areas with interesting features [26].
The choice of the area’s delimitation was mainly dictated by the occurrence of differences in terrain color, evident in Google Earth images repeated in different years and seasons as explained in [26].

2.1. Multitemporal/Multisensor Processing and Analysis of Satellite Images

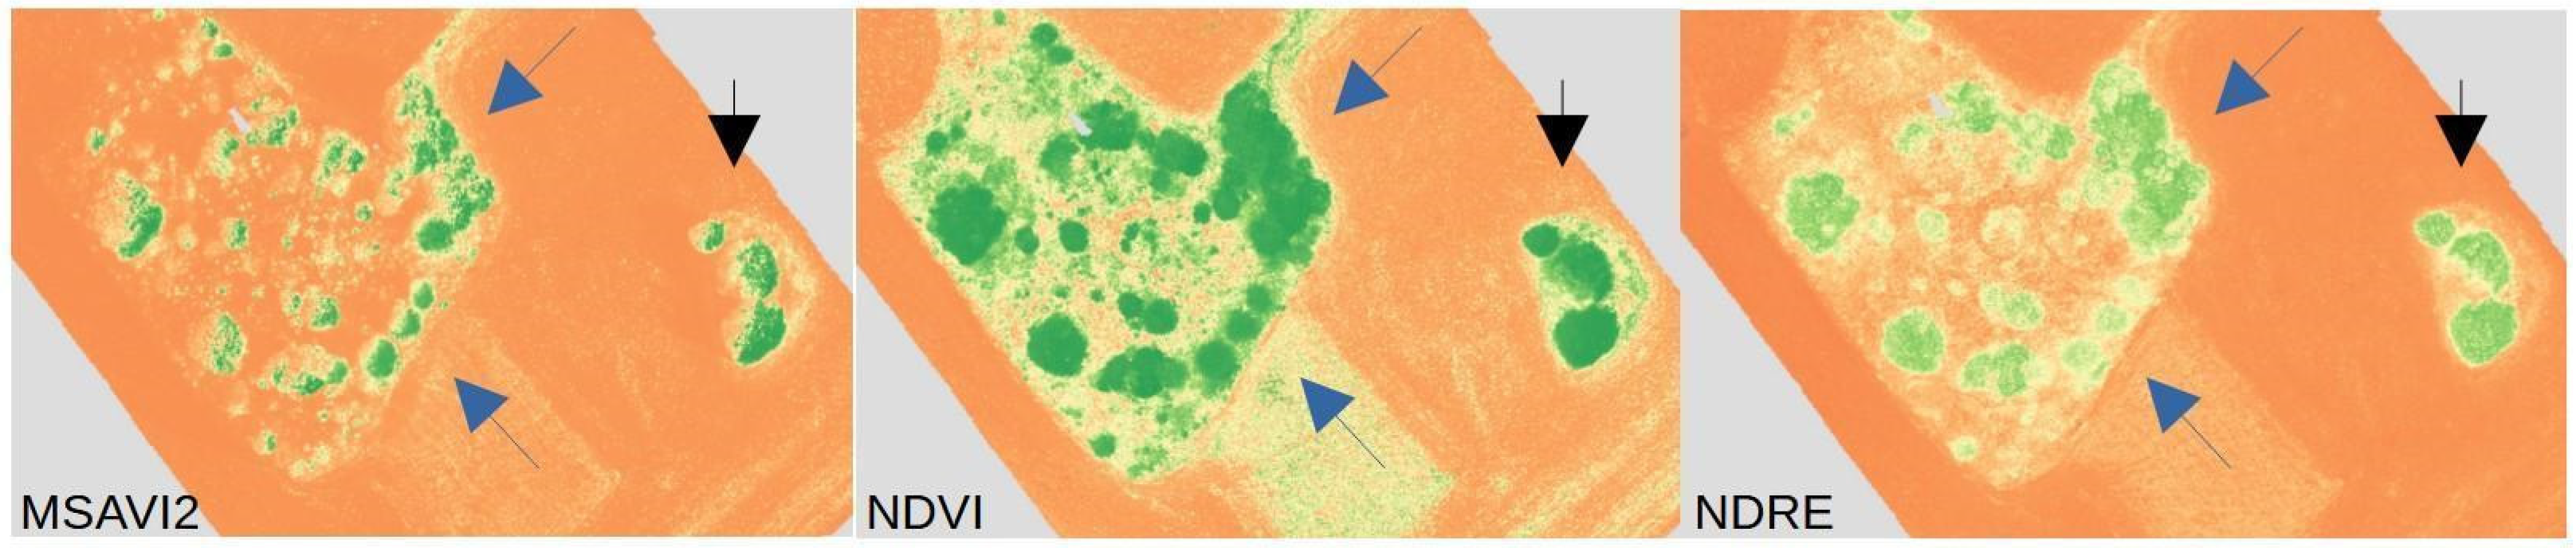
2.1.1. Calculation of Indices Related to the Environmental Condition

Seeking indicators of the presence of possible buried structures we calculate various indices related to the environmental conditions (vegetation state, temperature, and soil moisture) using a multi-sensor data fusion approach, mainly based on the Planet Fusion Monitoring product. The data fusion algorithm implements a methodology to enhance, harmonize, intercalibrate, and fuse cross-sensor data streams. Based on the CubeSat-Enabled Spatio-Temporal Enhancement Method (CESTEM) [27], it leverages publicly accessible multispectral satellites (i.e., Sentinel, Landsat, MODIS) to work with higher spatial and temporal resolution data provided by Planet’s Dove CubeSats. Planet Fusion Monitoring ingests data from multiple sensors with differing radiometry, quality, and resolution characteristics in order to produce an entirely new dataset that inherits the best traits from each sensor, i.e., temporal and spatial resolution of PlanetScope and spectral resolution of Sentinel2/Landsat8/9.
In this study, the data fusion algorithm is applied using CubeSat and Sentinel 2 images. The CubeSat data have a high spatial resolution of 3.7 m with daily frequency and a small number of bands, 4 RGB and NIR bands. Sentinel2 data have a spatial resolution of 10/20 m with weekly frequency and 12 spectral bands.
The indices related to the environmental conditions are carried out over a period of 48 months (from April 2018 to June 2022).
The following Table 1 lists formulas, brief descriptions, and calculation tools for each chosen index.
The spatial resolution of the Sentinel 2 images makes crop marks difficult to determine, the indices obtained using the Planet Fusion algorithm are more appropriate. For this reason, only these indices are taken into account.

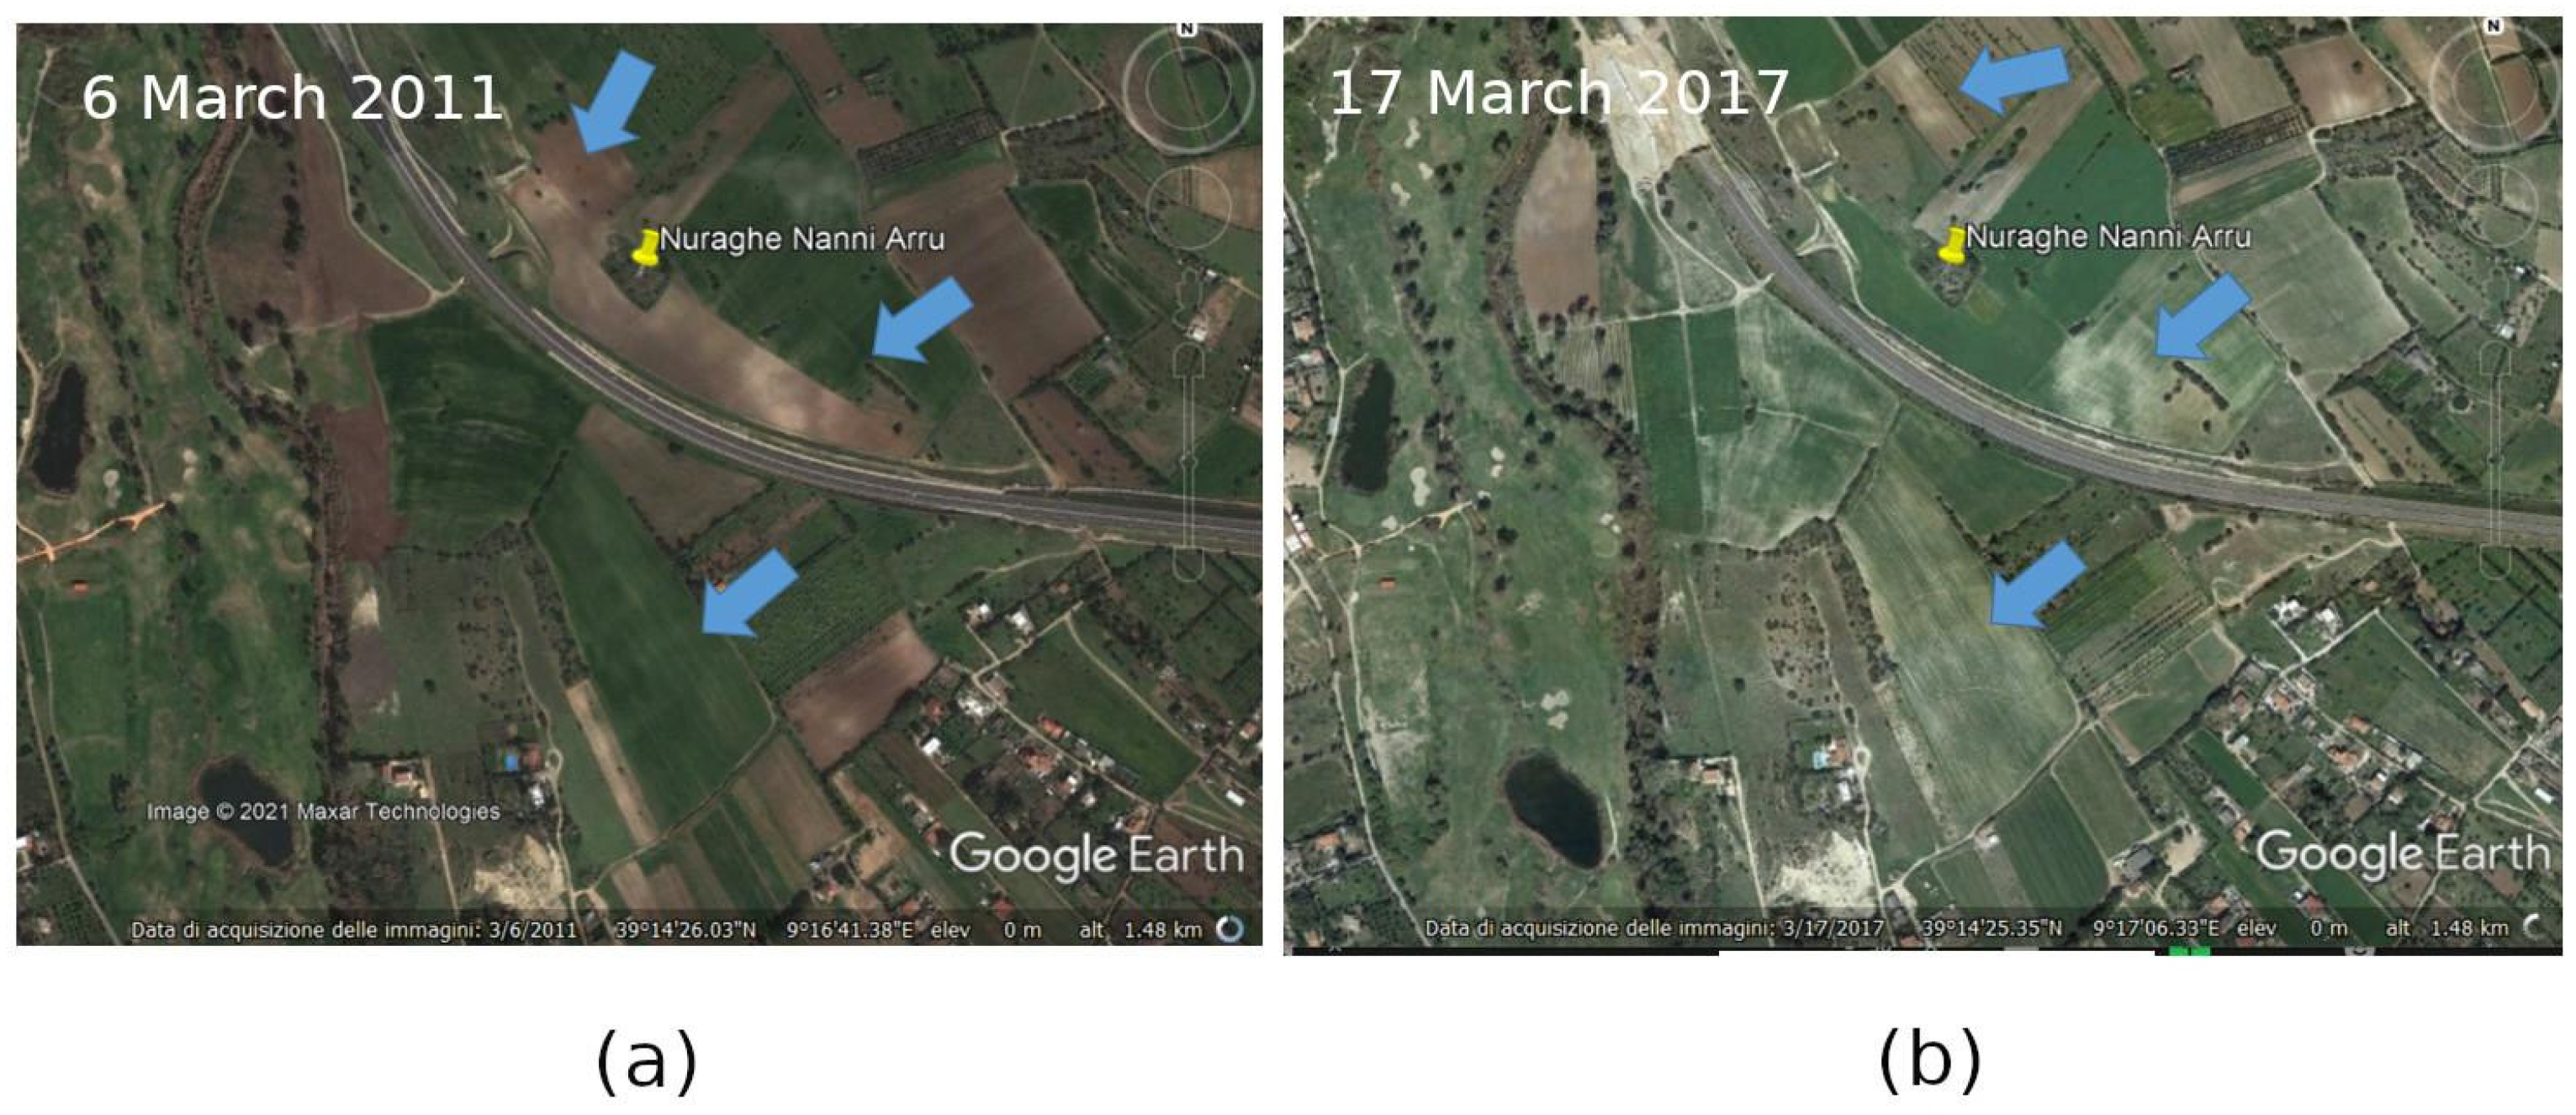
2.1.2. Multi-Temporal Interferometry (MTI) Processing of Synthetic Aperture Radar (SAR) Images to Detect and Monitor Changes in the Earth’s Surface around the Site

Differential Interferometric Synthetic Aperture Radar (DInSAR) is a remote sensing technique able to measure and monitor displacement of the Earth’s surface over time using radar images. An evolution of the DInSAR technique is the use of multiple images of the same area to derive a time series of displacement. These techniques are known as Multitemporal Interferometry. On the other hand, SAR Multitemporal Interferometry data processing aims to obtain Persistent Scatterers (PS) and Distributed Scatterers (DS) for a given area of interest. PS represents points and DS areas with a high phase of stability.
In this study, the Multitemporal Interferometry technique is implemented within the Rheticus Displacement platform, an automatic cloud-based geoinformation service platform for land and infrastructure monitoring, implemented by Planetek Italia.
SAR data acquired by the Italian Space Agency’s COSMO-SkyMed constellation, consisting of the first (CSK) and second-generation (CSG) satellites, have been processed (Table 2).
The algorithm SPINUA [28] was used to identify PS and DS.
The Multitemporal Interferometry technique was used to assess land movements that could prevent access to buried structures and even damage the emerged ones.
The choice to use Cosmo–Skymed data was dictated by the high spatial (3 m) and temporal (4 days) resolution.

2.2. Multisensor Processing and Analysis of UAV Data

The employed UAV is a quadcopter manufactured in 2022 whose sensors (multispectral, thermic, and optical) have been mounted according to the survey to be carried out to appropriately investigate the site.
By means of the multispectral sensor Micasense RedEdge-M, which captures images through five bands, three indices were calculated: NDRE (Normalized Difference Red Edge) used to calculate the chlorophyll content in the plant canopy, NDVI, and MSAVI2 whose descriptions are specified in Table 1. The latter two have been compared with the same indices obtained through satellite data.

2.3. Acquisition, Processing, and Analysis of Geophysical Data

The initial idea was to carry out an integrated geophysical survey with frequency domain electromagnetics (FDEM) and employing ground penetrating radar (GPR) methods, with the aim to assess any changes in the electrical and electromagnetic characteristics attributable to the presence of archaeological structures. Nevertheless, after an initial site inspection, it was decided to abstain from it due to the roughness of the measurement surface which degrades GPR performance. The GPR survey has been replaced with the Electric Resistivity Tomography (ERT). This method, widely used in archeology, identifies geometries that could be attributable to buried archaeological structures.
The aim of the geophysical surveys was to measure lateral changes in the electrical and electromagnetic characteristics of the shallow subsurface which could hint at the presence of archaeological structures, walls in particular, or buried archaeological objects. The following Figure 4 shows the two lines along which initial electric resistivity tomography was conducted (pink and light blue circles), three follow-up ERT lines (black, blue, and red circles), and the surface areas in which FDEM measurements were carried out.

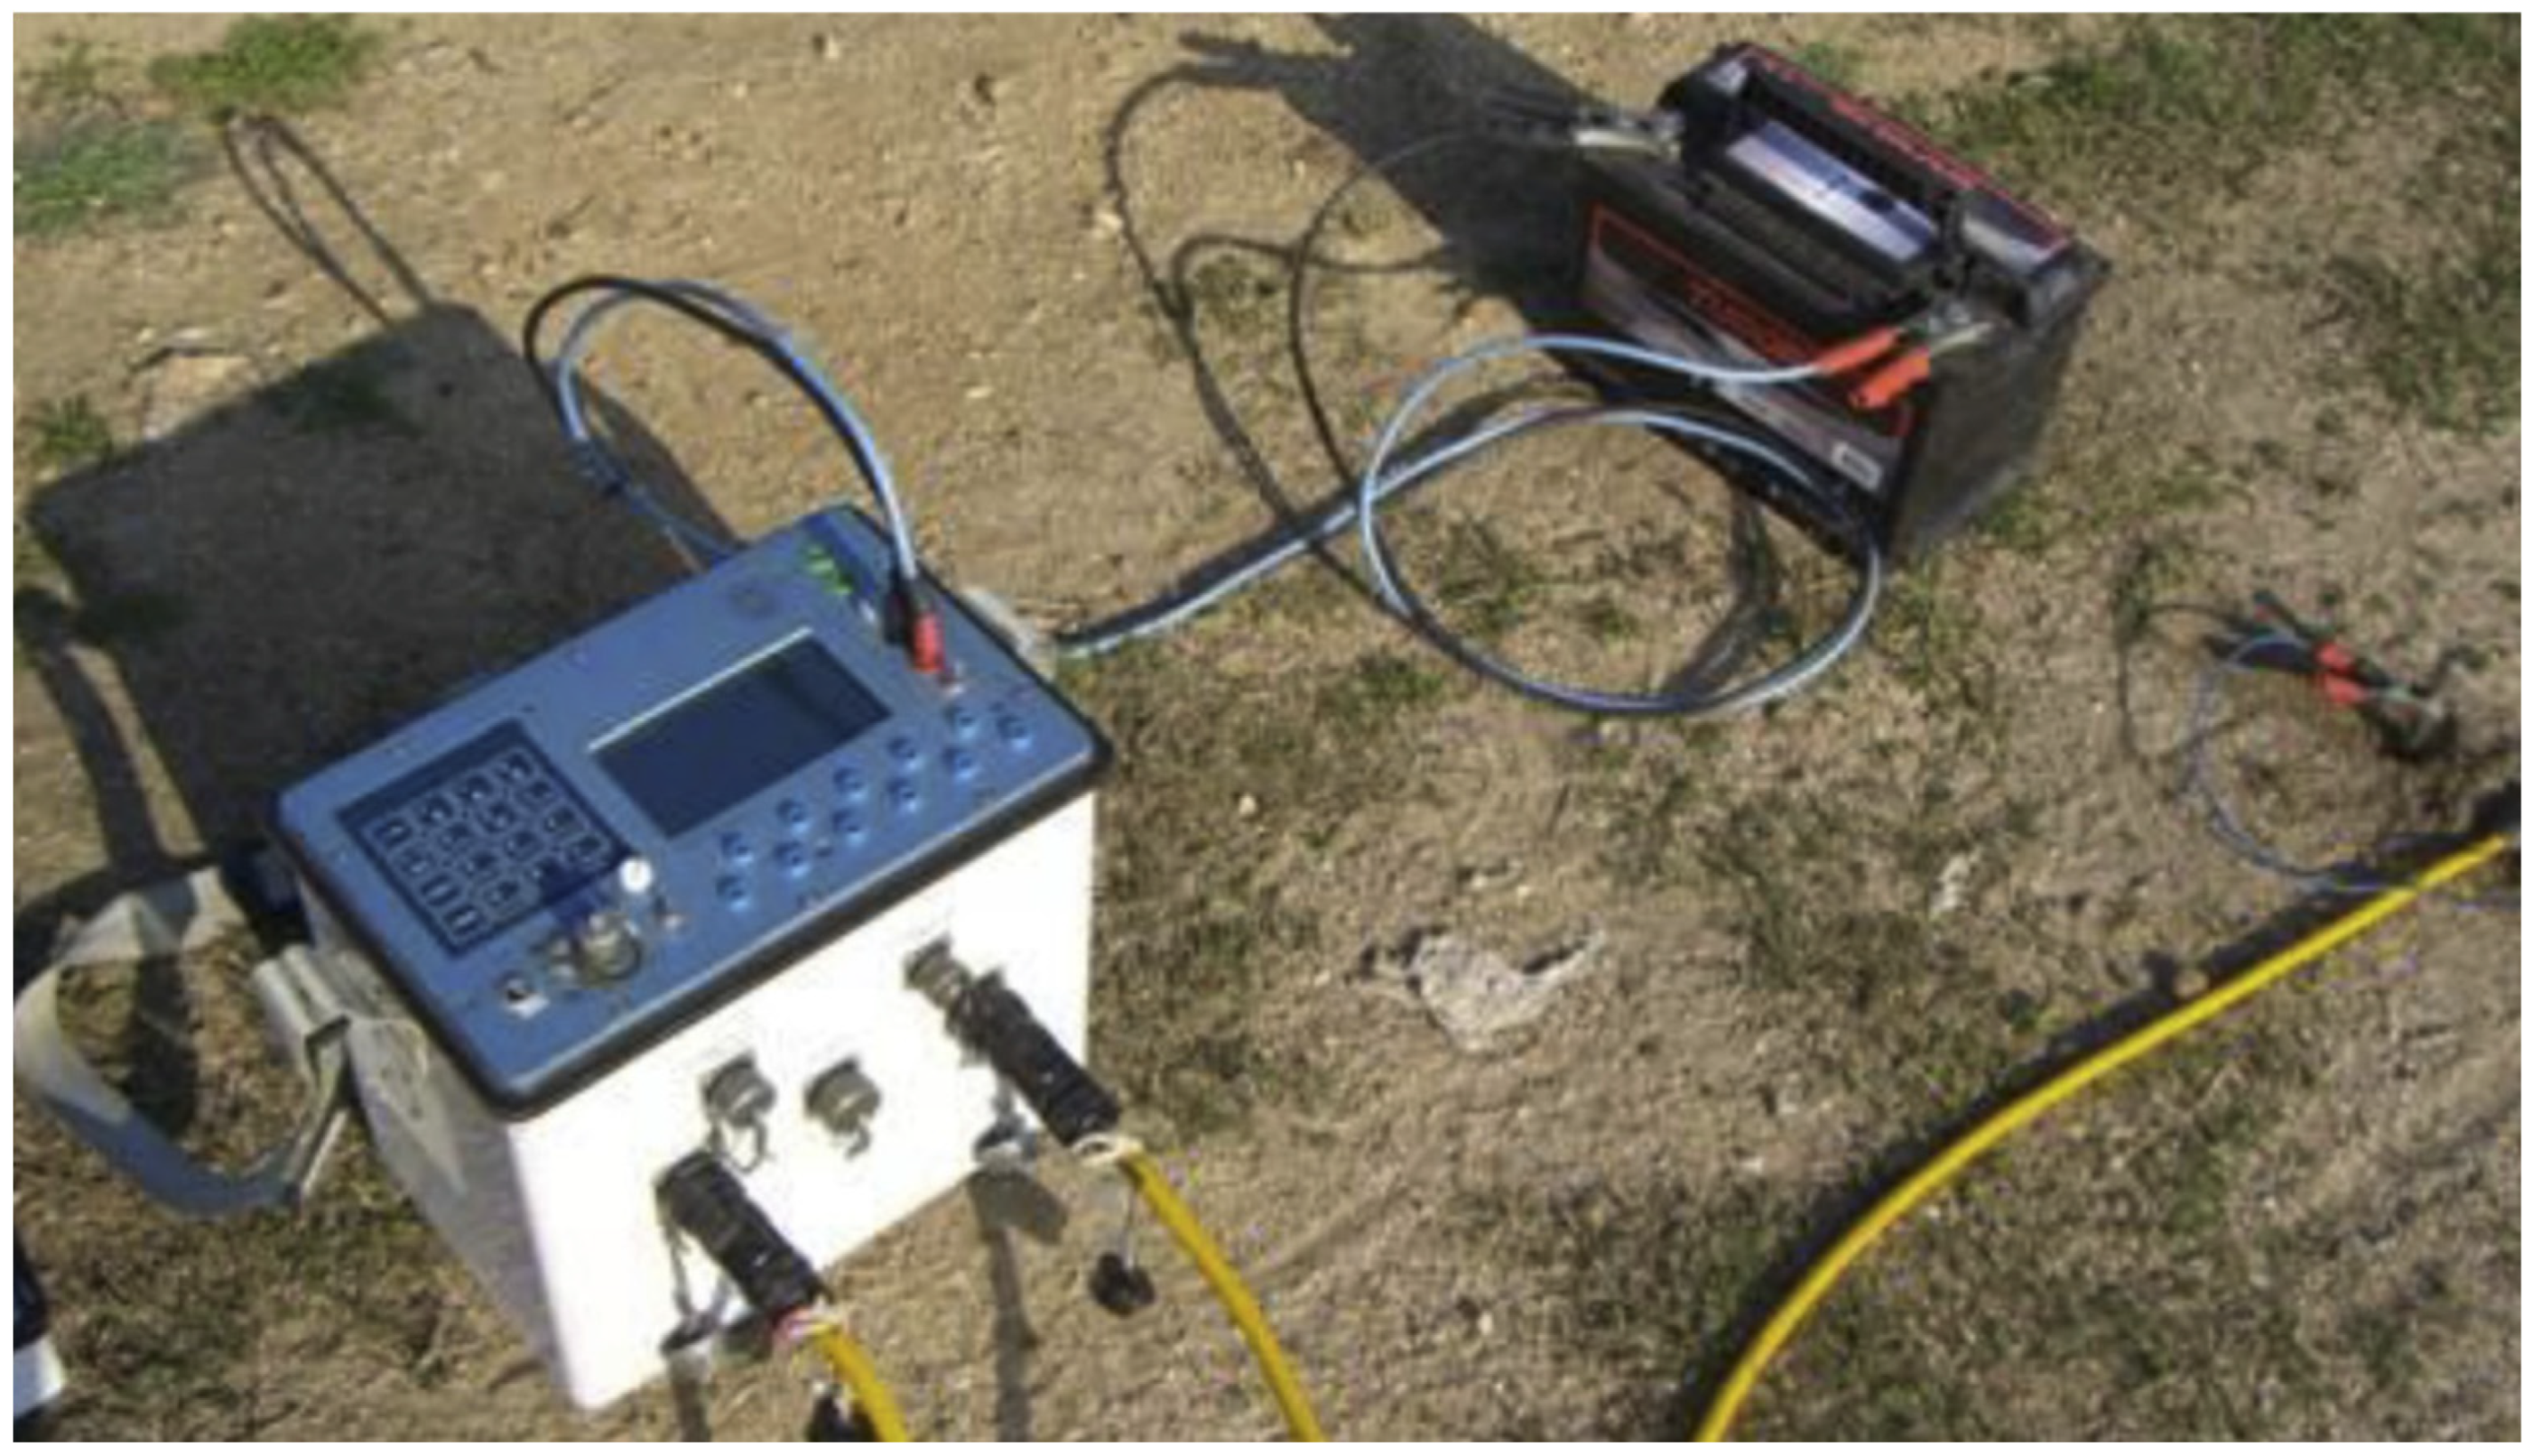
2.3.1. Geoelectric Data Acquisition

The direct current geoelectric method is a geophysical remote sensing technique starting from intensity measurements of electric current, potential differences, and relative distances between electrodes placed at the ground surface. A classical geophysical inverse problem arises on attempts to estimate the local electrical resistivity for a depth range of underlying subsurface points, from the measured properties. The standard way to tackle this problem is with ERT.
The tomography software, applied in Section 3.2 to create two-dimensional resistivity cross sections, so-called profiles (see Section 3.3.1 and Section 3.3.3), simplifies the three-dimensional physical phenomena to two dimensions.
Five geoelectrical surveys have been conducted in two successive steps. In the first step, two profiles (ERT_48_A and profile ERT_48_B) have been acquired, with the aim of determining average resistivity values, necessary for the design of the FDEM survey described in the following section; one design parameter for instance, the ideal measurement time for a single data point, increases with increasing ground resistivity. Both geoelectric resistivity profiles were carried out with 48 electrodes, at a distance of 2 m, using a quadrupole configuration of Dipole–Dipole type.
The configuration was chosen to maximize the sensitivity for horizontal variations of the electrical resistivity along the direction of the acquisition profile. The following Table 3 shows the geometrical details, namely spacing between electrodes, UTM coordinates, elevation at the beginning and end of the profile, and the quadrupole type of each profile.
In the second step, which took place after the first of two electromagnetic survey campaigns was carried out and its results were analyzed, three profiles (ERT_72_A, ERT_72_B, and ERT_72_C) were acquired in order to verify electromagnetic anomalies. The profiles consisted of 72 electrodes, with a distance of 0.5 m, using the quadrupole configuration of the Dipole–Dipole type. The following Table 4 shows the geometrical details and quadrupole type of each profile.
Apparent resistivity data have been obtained with the IRIS SyscalPro® instrument shown in Figure 5, with ten physical channels programmed with Dipole–Dipole and Wenner–Schlumberger sequences. Moreover, for each quadripole, the recorded data, i.e., apparent resistivity was obtained by averaging multiple measurement cycles, consisting of alternating injections of positive and negative current, from a minimum of three to a maximum of six, setting a maximum threshold of the standard deviation (or quality factor Q) equal to five percent.
The duration of each cycle was set to 500 ms, with a constant voltage at the current electrodes (A and B) equal to 200 V. Finally, before taking the measurement, the insertion of the electrodes into the ground was completed with particular care in order to obtain the most homogeneous electrode–ground contact resistance, generally less than 2 kΩ.
To georeference and process the electrical resistivity tomography lines, the (planimetric and altimetric) position of each electrode was determined using a Trimble 5800 GPS receiver with differential correction to ensure decimetric precision positioning of the points.

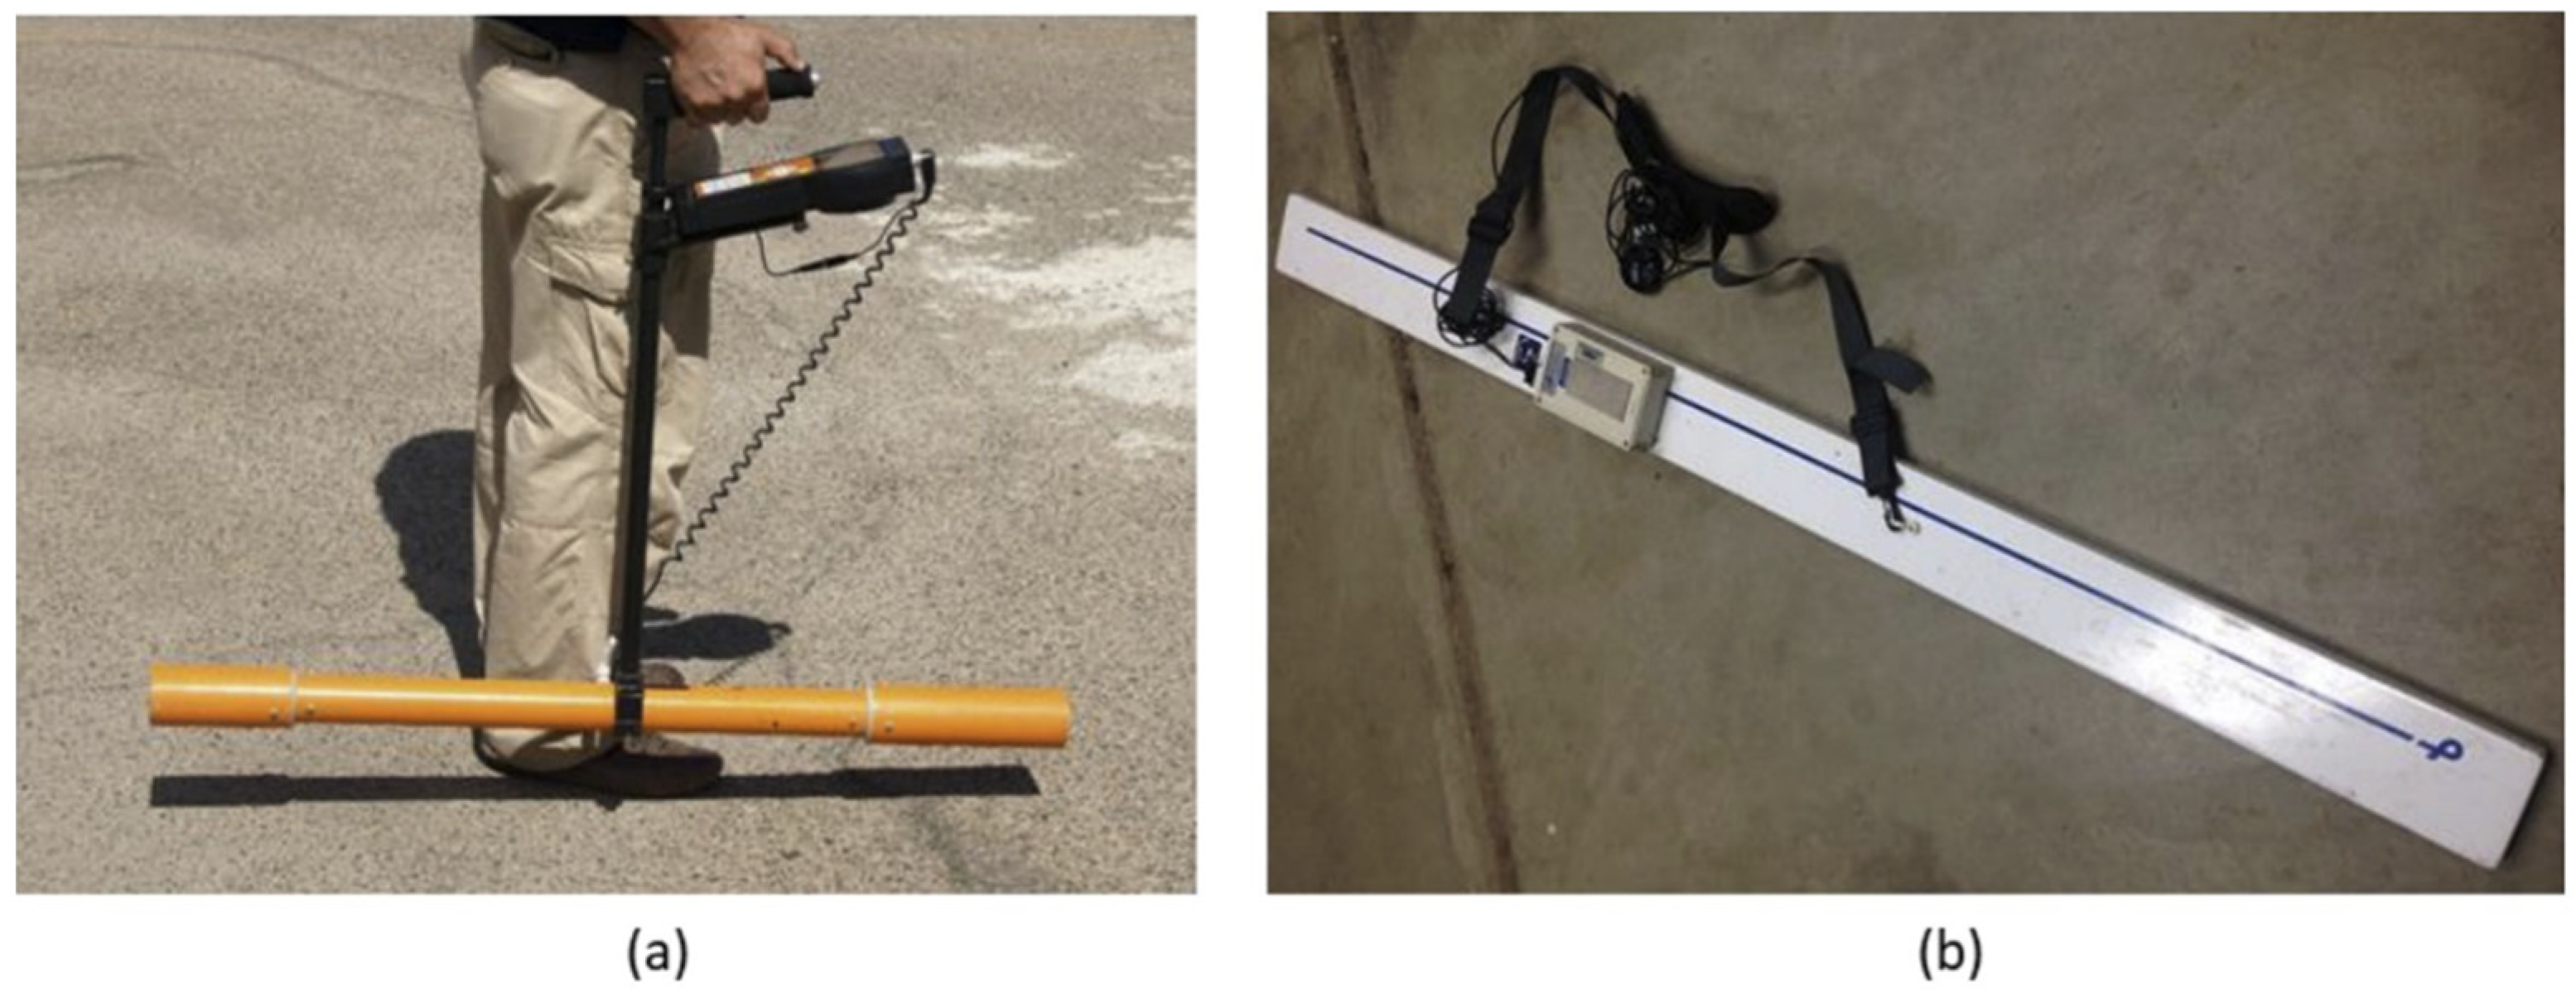
2.3.2. Frequency Domain Electromagnetic Data Acquisition

Inductive electromagnetic methods are geophysical means that allow the electrical resistivity of soils to be estimated based on an electromagnetic effect, i.e., the induction of a secondary magnetic field, measurable on the surface of the soil, produced by a primary electromagnetic field generated at the surface of the soil.
Electromagnetic conductivity meters, or electromagnetic meters, are designed to work under low induction number conditions, measuring the electromagnetic response of the soil directly as an apparent electrical conductivity in mS/m.
The phase component of the ratio between the primary and secondary fields, also known as in-phase, provides information on the type of conductive material (metallic or non-metallic) and working conditions (validity of the low induction number approximation). It is generally expressed in ppt (parts per thousand) and assumes non-zero values when the inductive characteristics of the subsurface are not negligible and the induction number becomes high due to a high conductivity (usually greater than a few tens of mS/m).
Electromagnetic data have been obtained with two instruments: the Mini-Explorer electro-magnetometer by GF Instruments and the GEM2 electro-magnetometer by Geophex (Figure 6).
The Mini-Explorer instrument has three receiving coils distant from the transmitting coil 0.32, 0.71, and 1.18 m; the working frequency is 30 kHz. As a result, each measurement provides medium conductivity and phase values for three different investigation depths. By rotating the instrument by 90° along the horizontal axis, the orientation of the coils can be set to vertical (high depth range) or horizontal (low depth range). The latter is only recommended if no other instrument with smaller coil spacings is available. We used the vertical coil configuration which corresponds roughly to investigation depths of about 0.5, 1, and 1.8 m.
The GEM2 instrument is a multi-frequency instrument (usable in the range between 30 Hz and 93 kHz) that works with coils distant 1.66 m from each other. For this work, five frequencies were used whose values, 5825 Hz, 15,325 Hz, 32,025 Hz, 57,025 Hz, and 80,225 Hz, were determined based on the electrical resistivity values obtained with the electrical tomographies acquired along the lines ERT_48_A and ERT_48_B.
With both instruments, data were acquired in two successive campaigns covering three areas surrounding the nuraghe, namely area A in the south–west, area B in the south–east, and area C in the north–east.
The second campaign targeted the extension of area B towards the south–east in order to cover potential structures that had been identified during the analysis of the data of the first campaign together with the satellite data. The acquisition was conducted along variable length profiles spaced one meter apart in continuous measurement mode with a frequency of four measurements per second, corresponding to an approximately in-line spacing of four measurements per meter.
Both instruments were transported at a height of 30 cm from the ground surface. With the Mini-explorer, 42,000 apparent conductivity data and as many phase data (ratio between the in-phase component of the secondary field and the primary field) were acquired, for a total profile length of approximately 10.5 km; with the GEM2, instead, for each of the five frequencies, 45,000 data of the quadrature ratio of the electromagnetic fields and as many of the in-phase ratios of the fields were acquired, for a total length of 10.5 km. Using instruments with a differential GPS (GPS Trimble 5800), for all measurement points the UTM geographical coordinates were also measured, which made it possible to georeference both the data and the results.
Data processing involved mainly two steps, namely the corrections for the non-linearity of the response of the instrument and for the working height [29] and the data calibration [30]. The data were first corrected according to the procedures described in [29] and then calibrated according to the procedure described in [30].

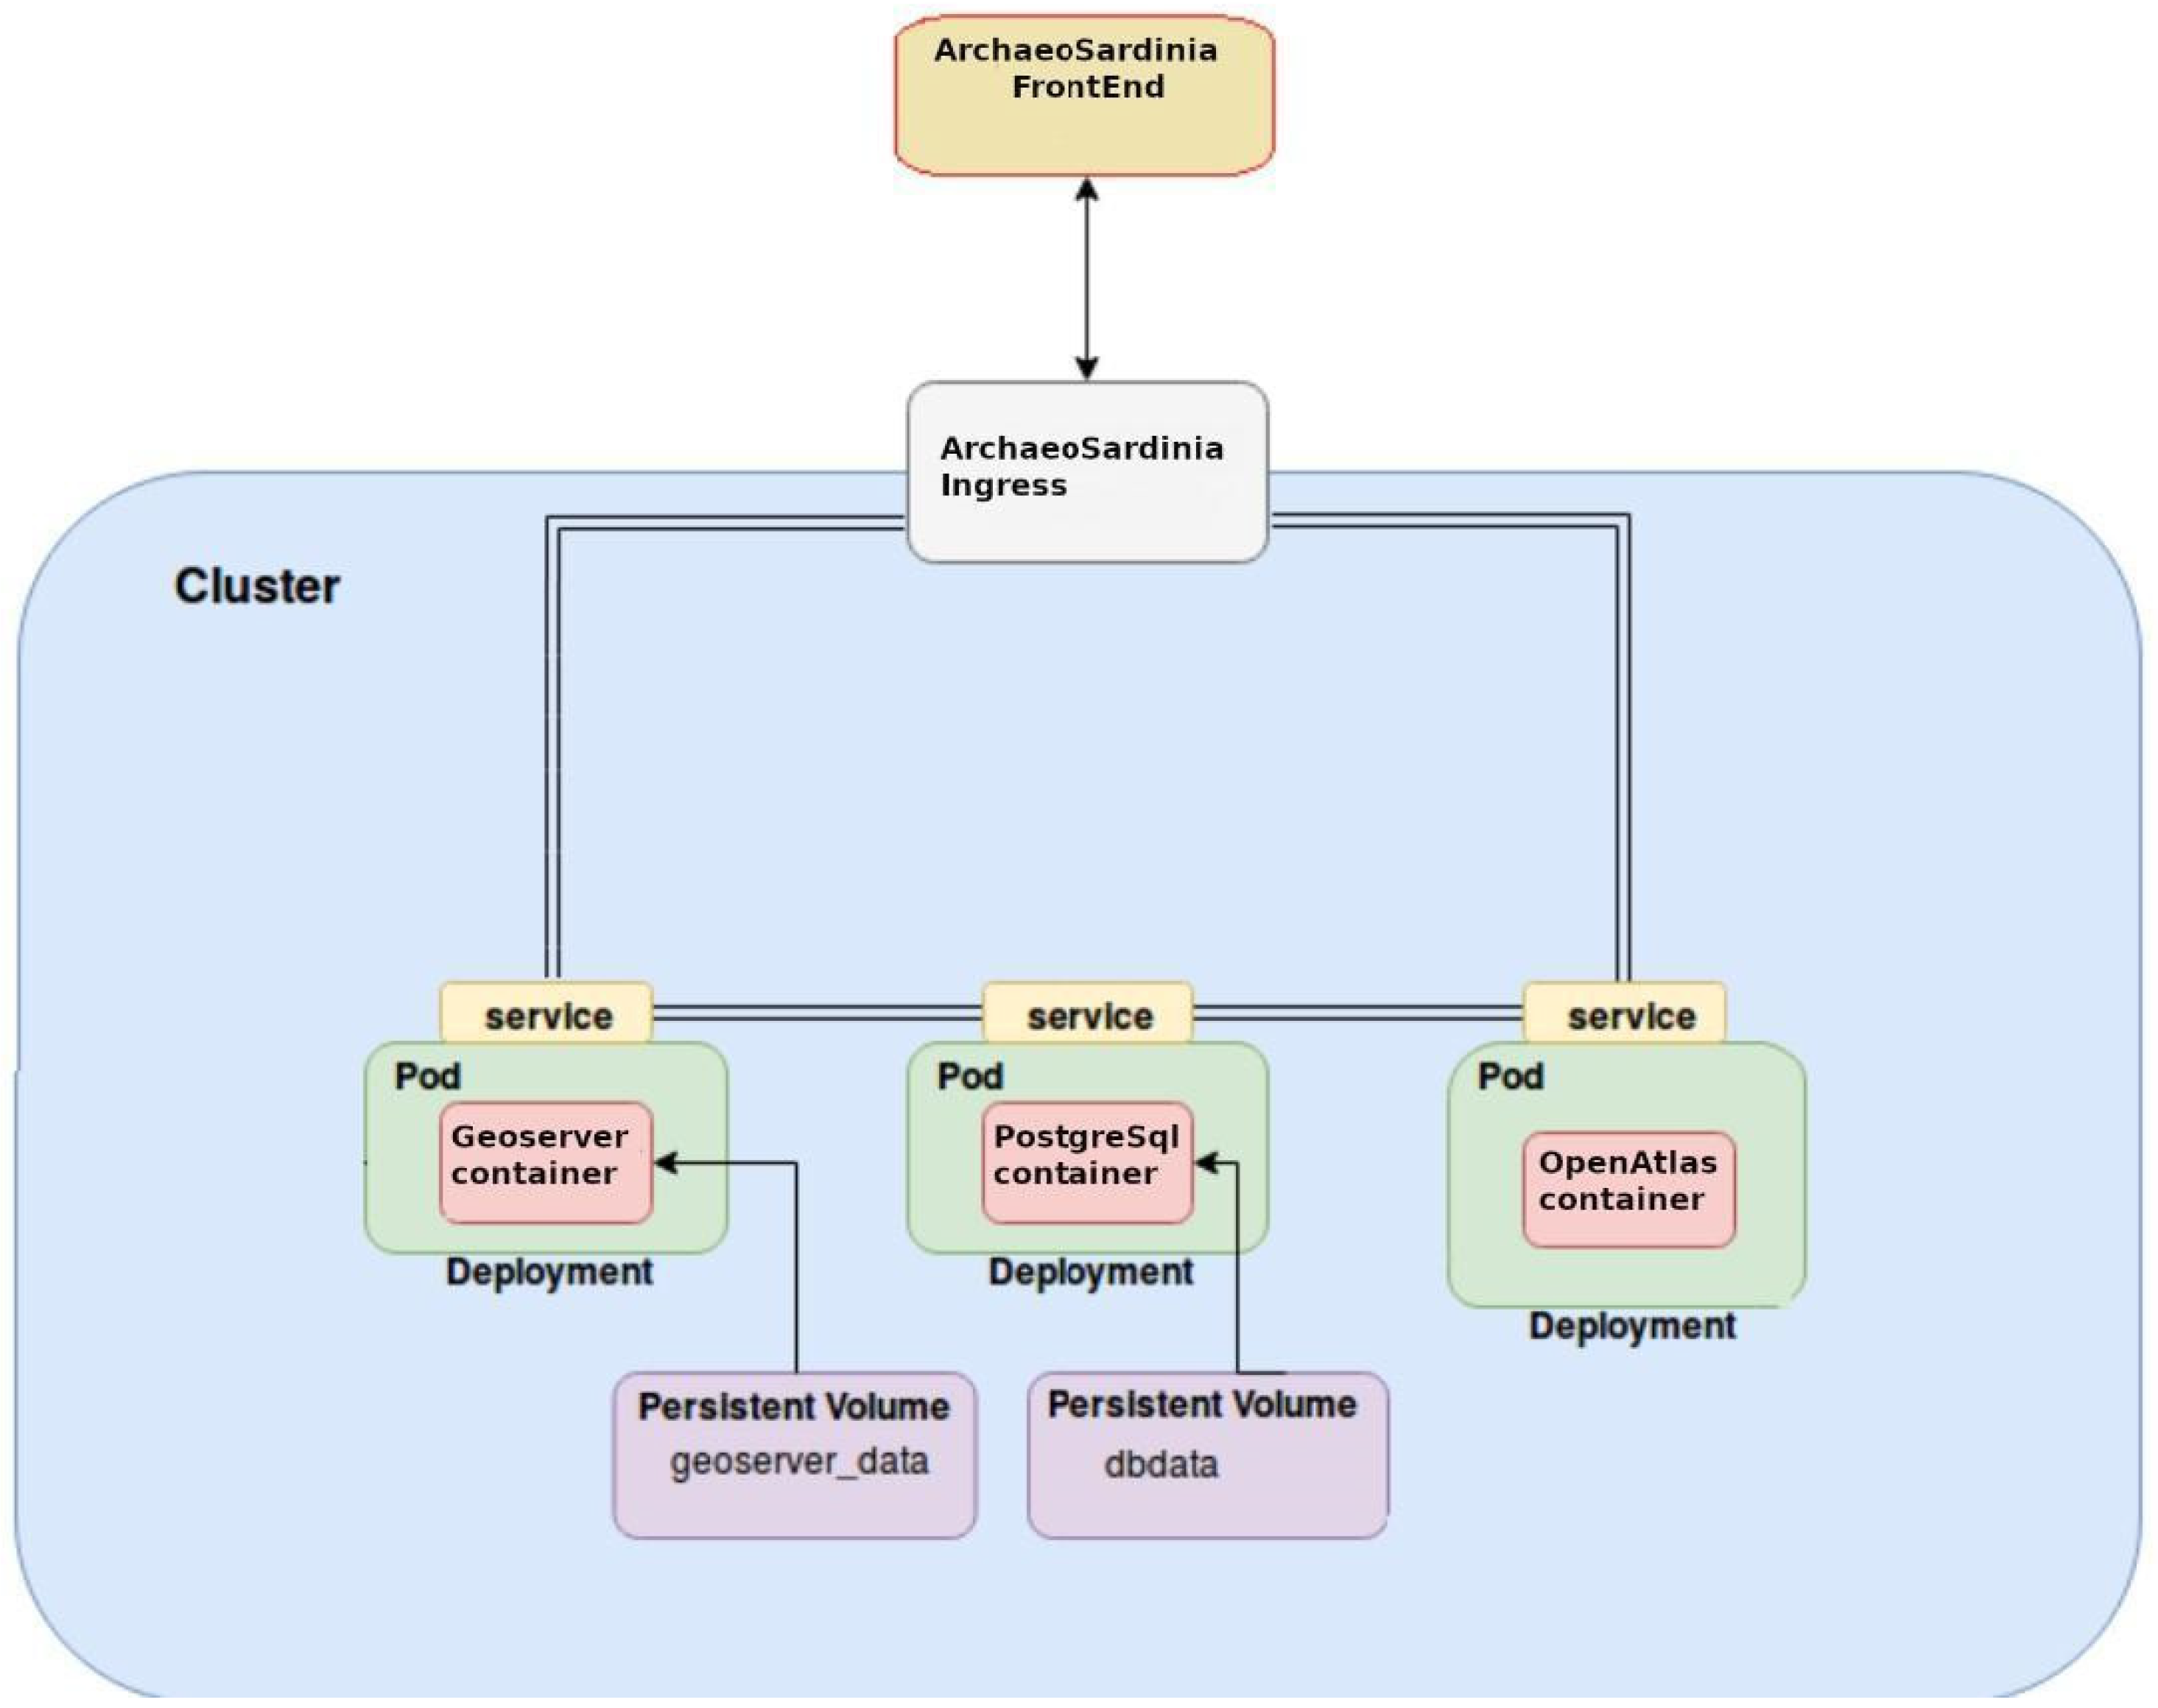
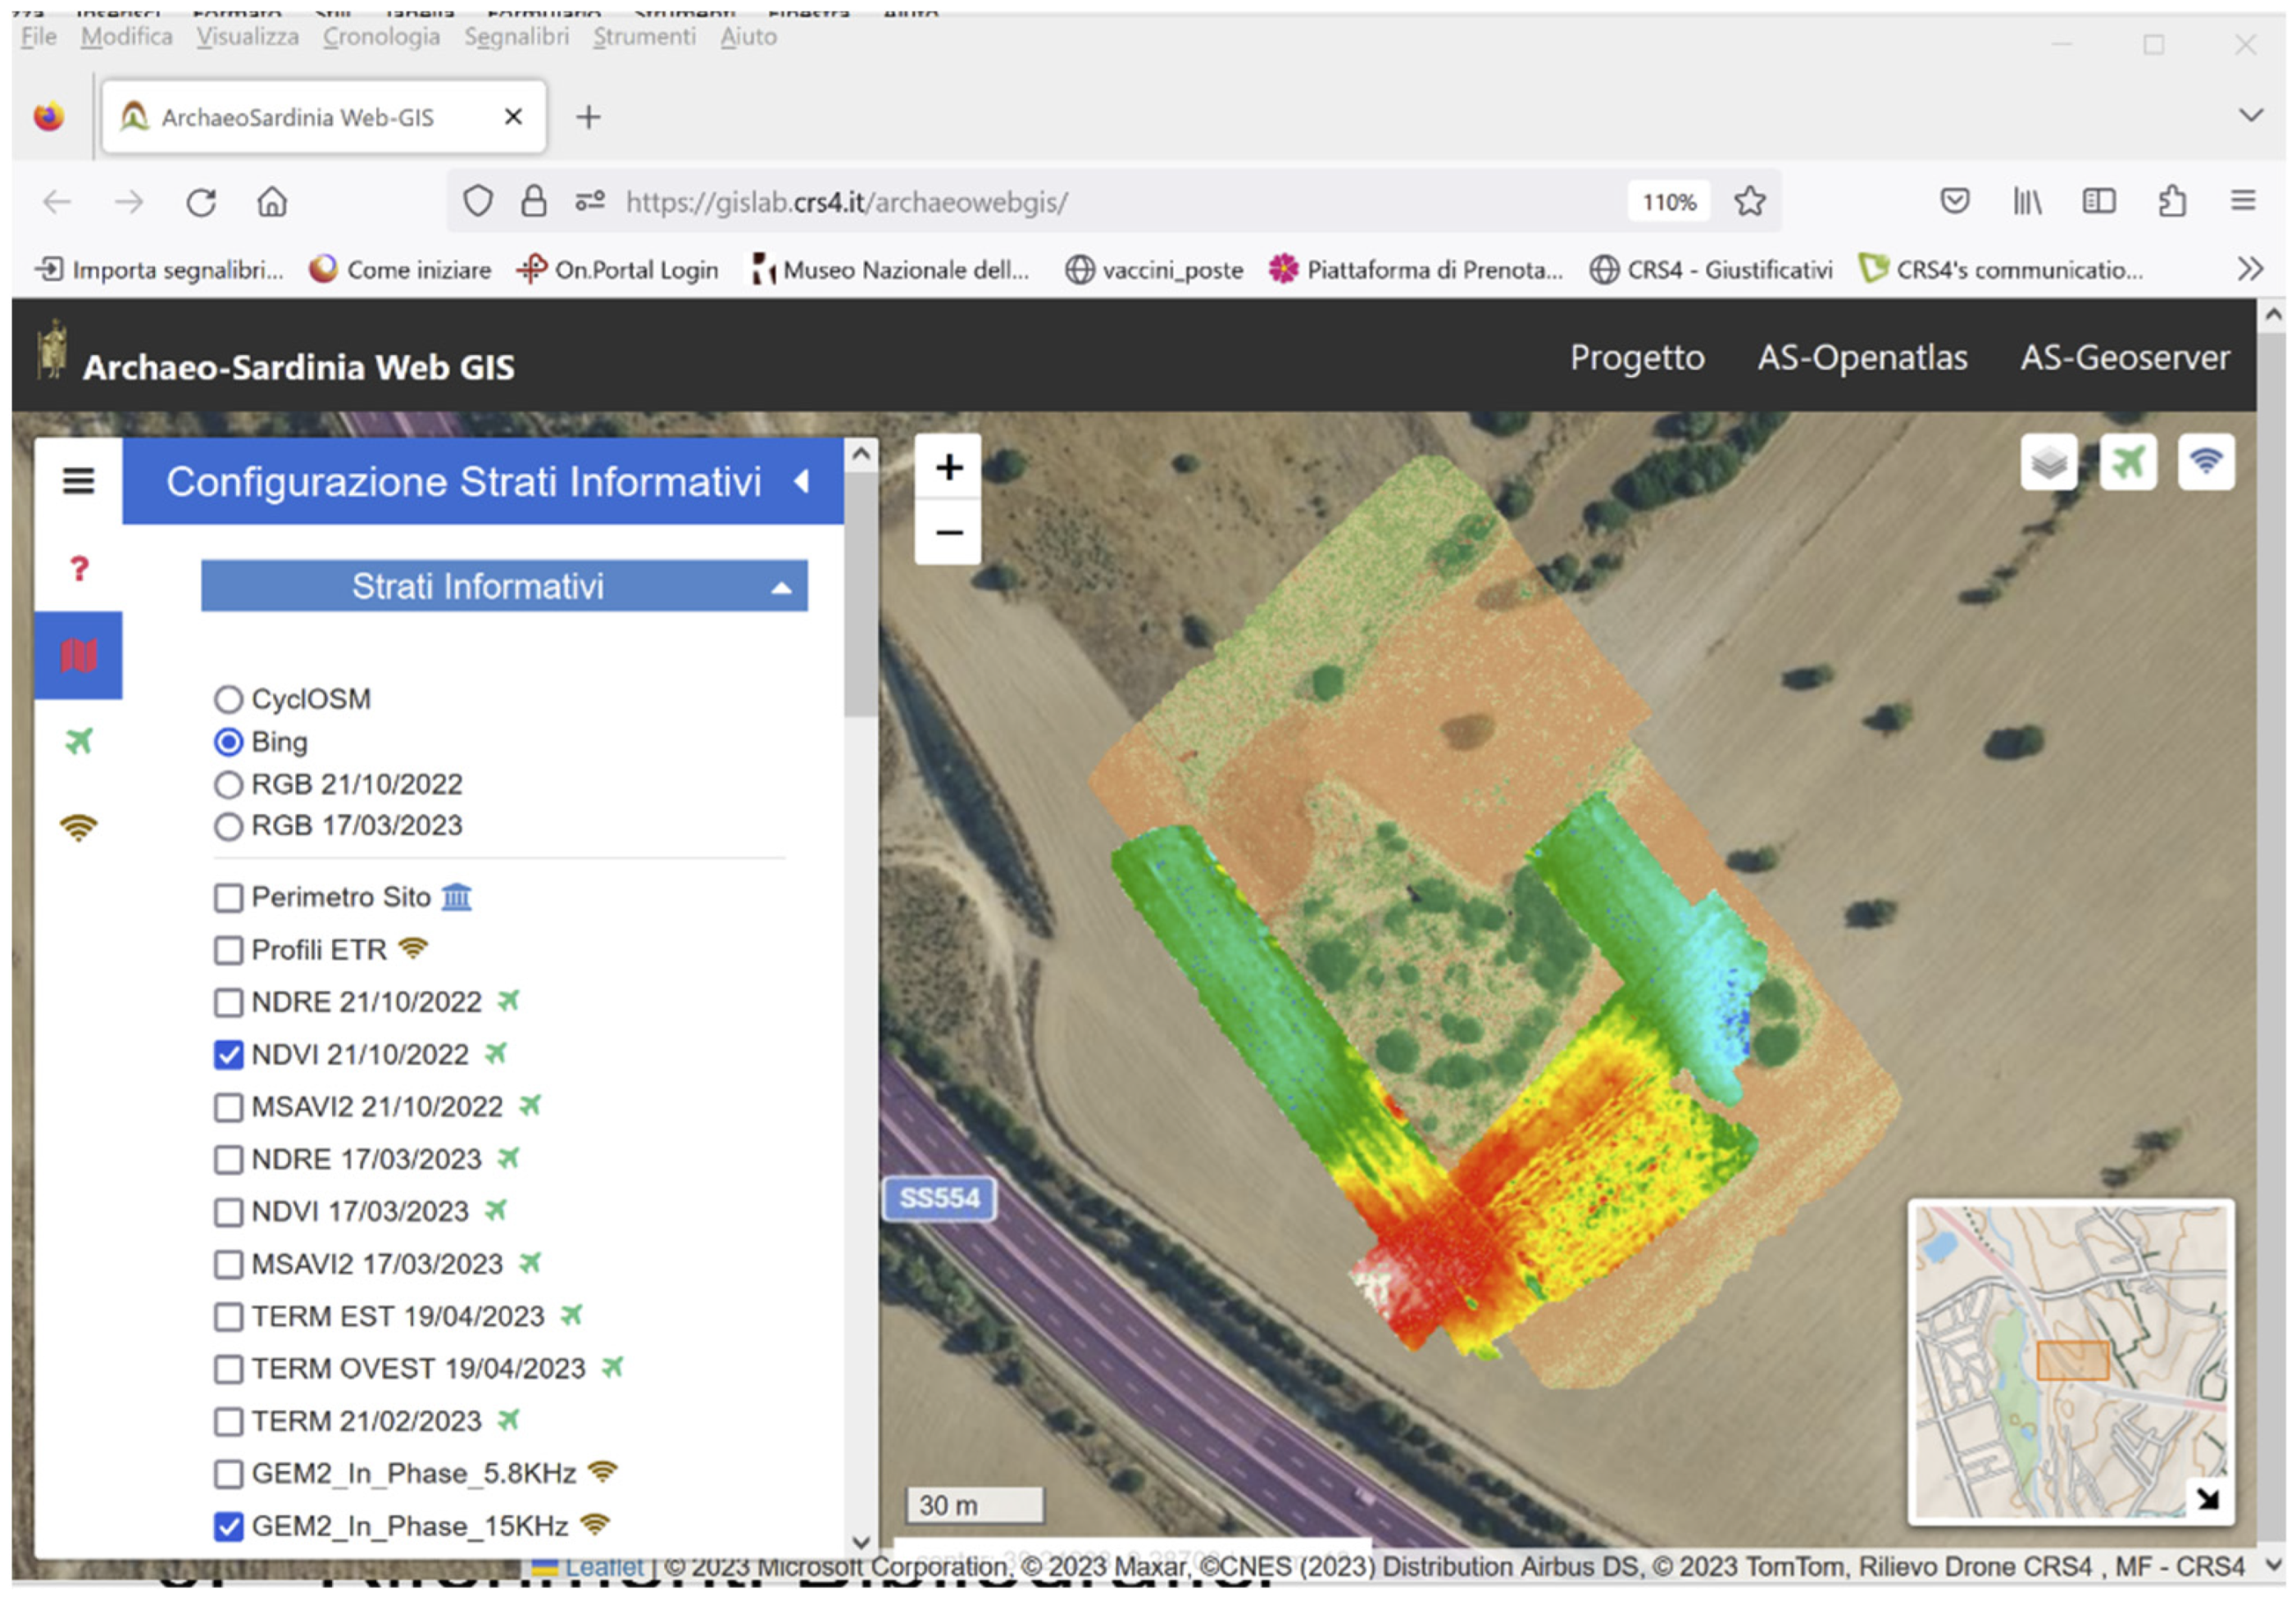
2.4. Data Management and Publication

Data management is carried out by an IT platform consisting of a Back–End and a Front–End.
The Back–End (Figure 7) is a set of microservices managed through the open-source Kubernetes framework http://kubernetes.io/ (accessed on 15 December 2023).
The microservices are:
  • ArchaeoSardinia PosgreSQL which handles vector-type GIS data via the PostGIS extension;
  • ArchaeoSardinia Geoserver which enables the publication of GIS data. It provides user interfaces to manage the vector and raster data publication;
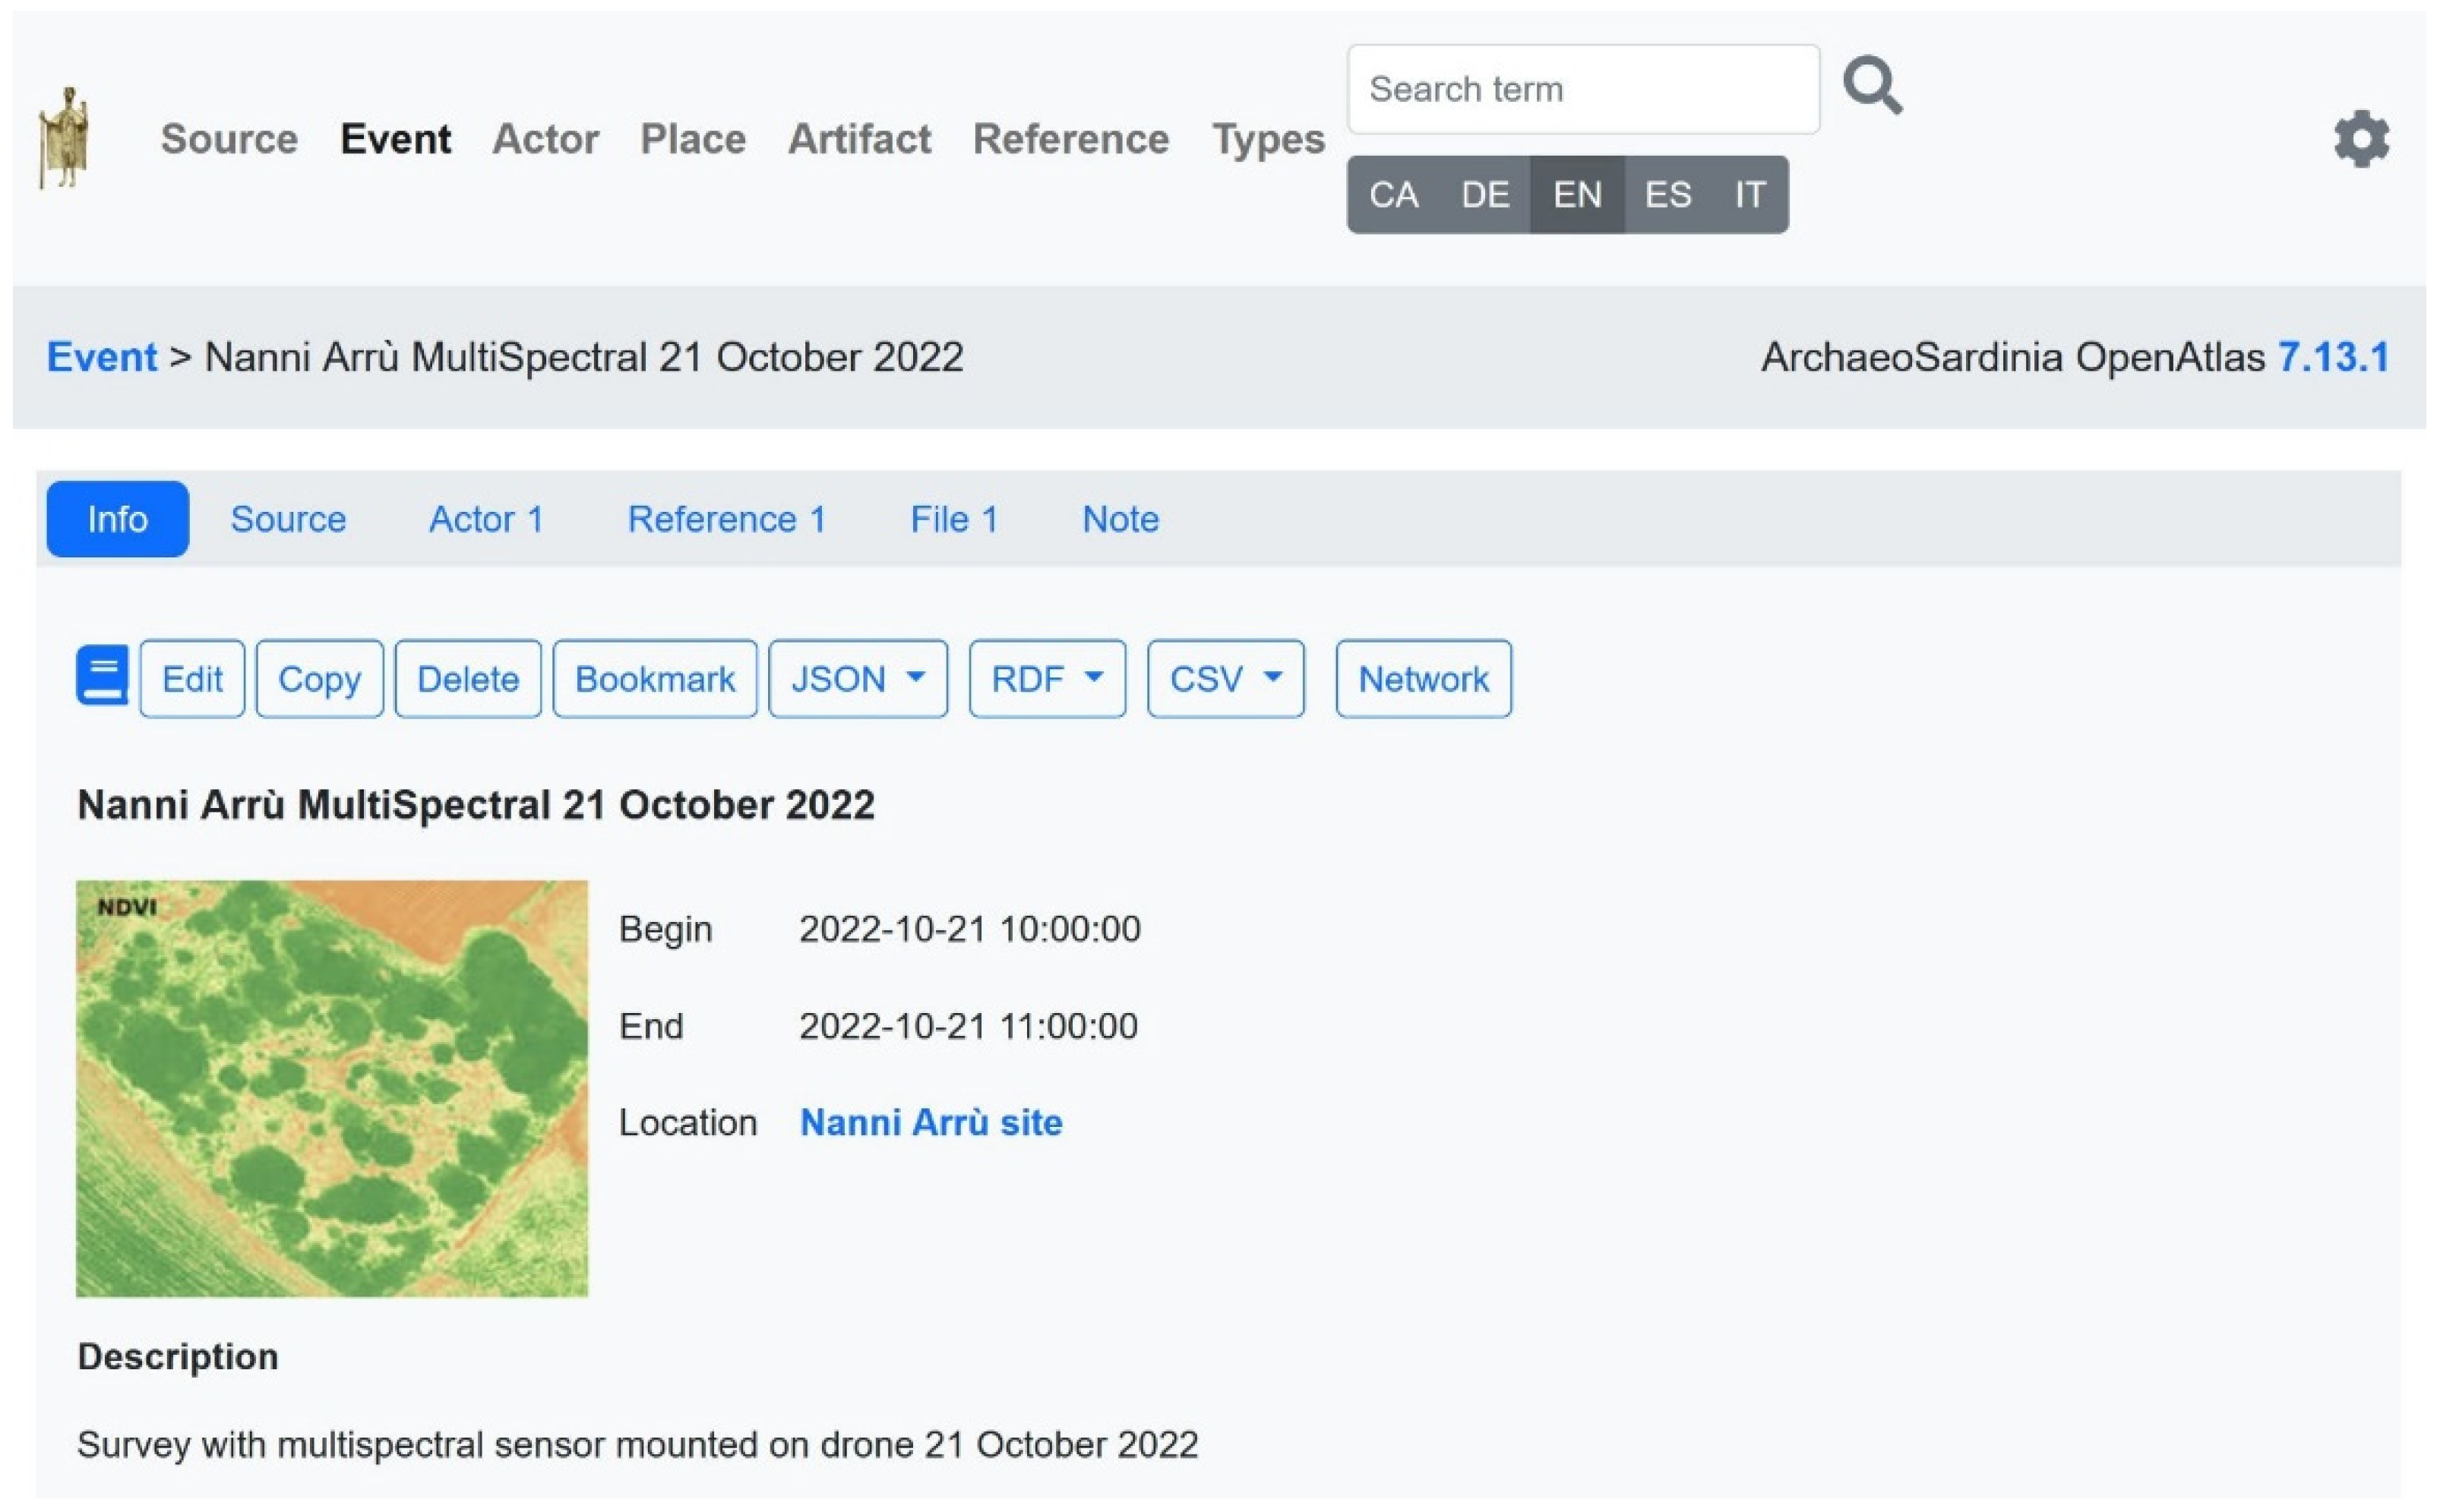
  • ArchaeoSardinia OpenAtlas which enables archaeological metadata management and publication (e.g., documentation of UAV survey and data post-processing methods).
The Front–End implements the WebGIS application, accessed by users, that publishes maps using OGC (Open Geospatial Consortium) Compliant services provided by the Back–End.
The Platform includes a module for archaeological data documentation based on the CIDOC CRM standard https://www.cidoc-crm.org/ (accessed on 15 December 2023) and, in particular, a simplified version of it used in the open source software OpenAtlas https://openatlas.eu/ (accessed on 15 December 2023). Through this form, it is also possible to document any phases of excavation or archaeological surveys of the site under study.
OpenAtlas is used to document the various information layers produced during archaeological surveys and to assist a WebGIS viewer in configuring the related maps.
A raster layer representing a vegetation index managed in the platform and then linked to the investigated site via an Event/Activity (CIDOC-CRM class E5/E7) may be considered as an example. Another example is the classification of entities using Types (class E55) that have been created on the basis of Sardegna Cultura and Nurnet information. The Types characterize all the features present in the site (for instance, “Nuraghe”, “Complex Nuraghe”, “Complex Nuraghe Bastion”, and so on).
A screenshot of the ArchaeoSardinia–OpenAtlas archaeological data documentation module is shown in the following Figure 8.
Data publication is completed via WebGIS https://gislab.crs4.it/archaeowebgis/ (accessed on 15 December 2023). The viewer enables the consultation of the information layers obtained from the surveys at the Nanni Arrù site and is available for use on a wide variety of devices including smartphones and tablets. It is possible to compare data from drone surveys and geophysical methods by managing the opacity of the same even at high zoom levels.
In the following Figure 9, there is a screenshot of the ArchaeoSardinia WebGIS.

3. Results

This section considers the results of interpreting the data obtained from the different instruments used for the surveys.

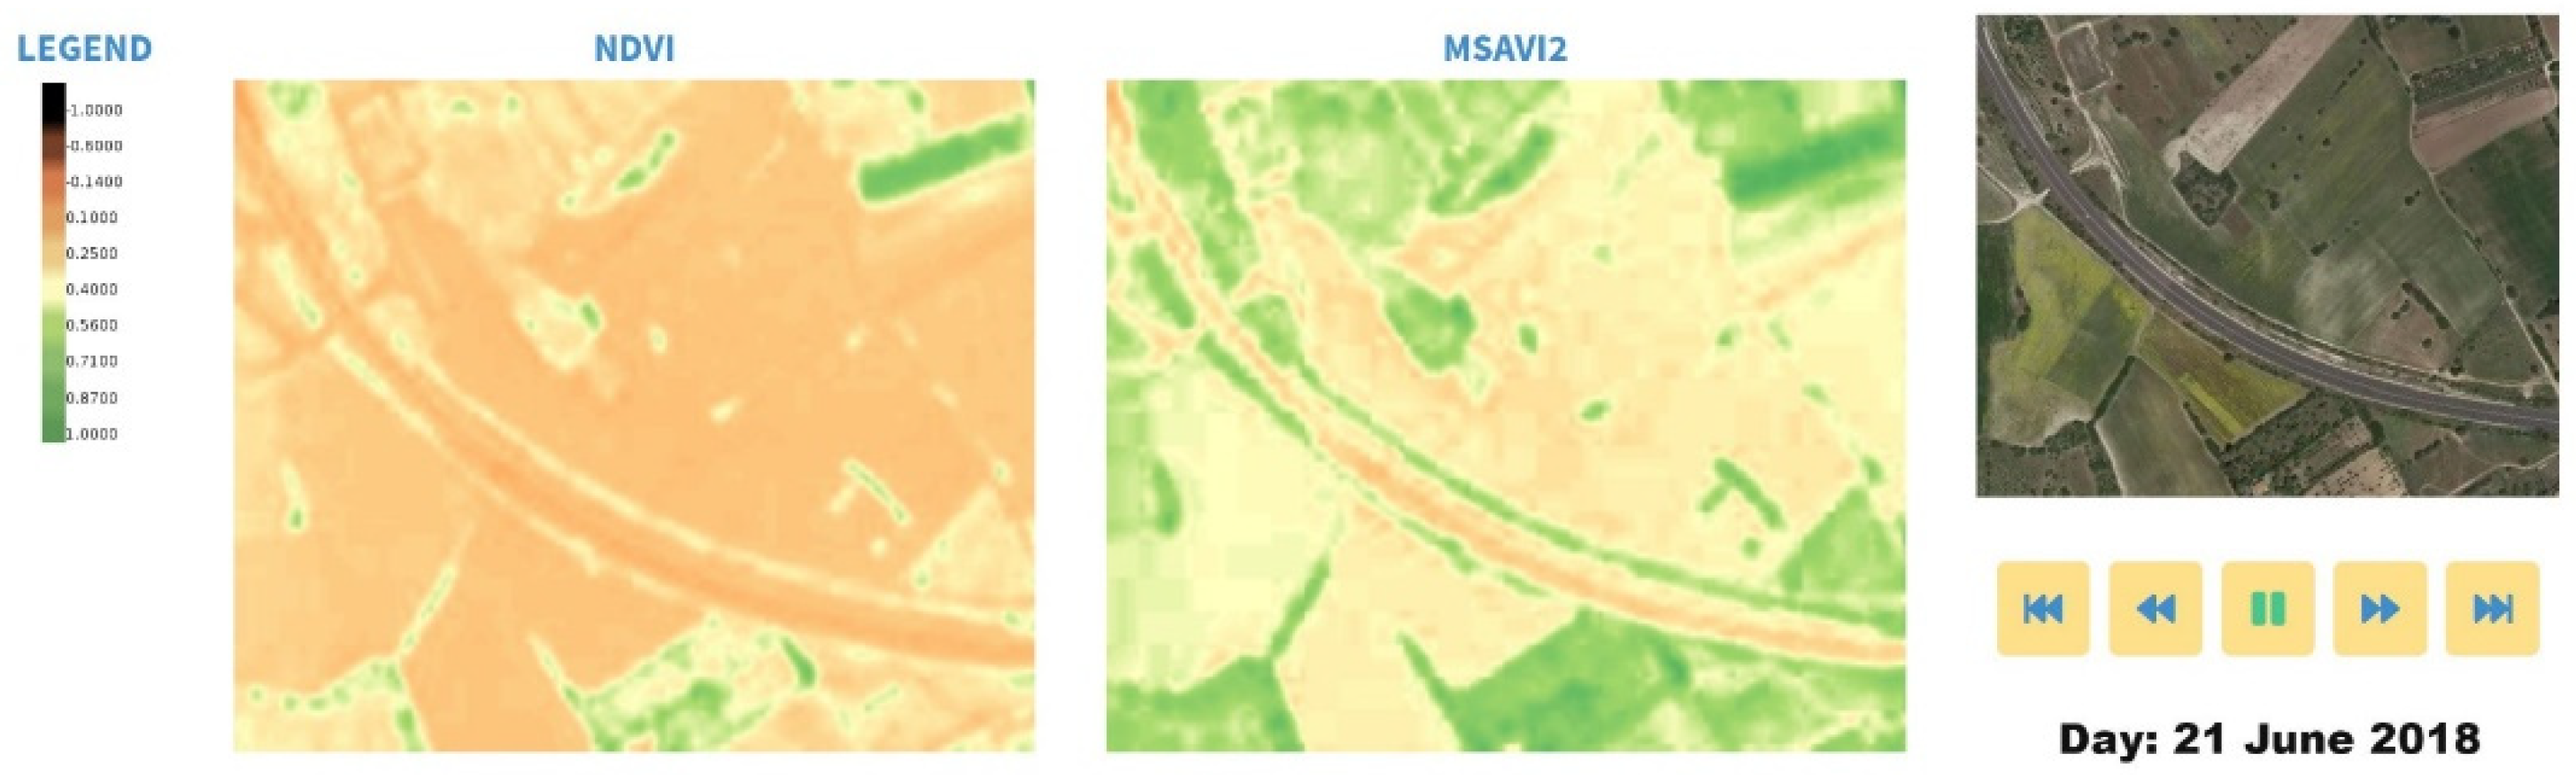
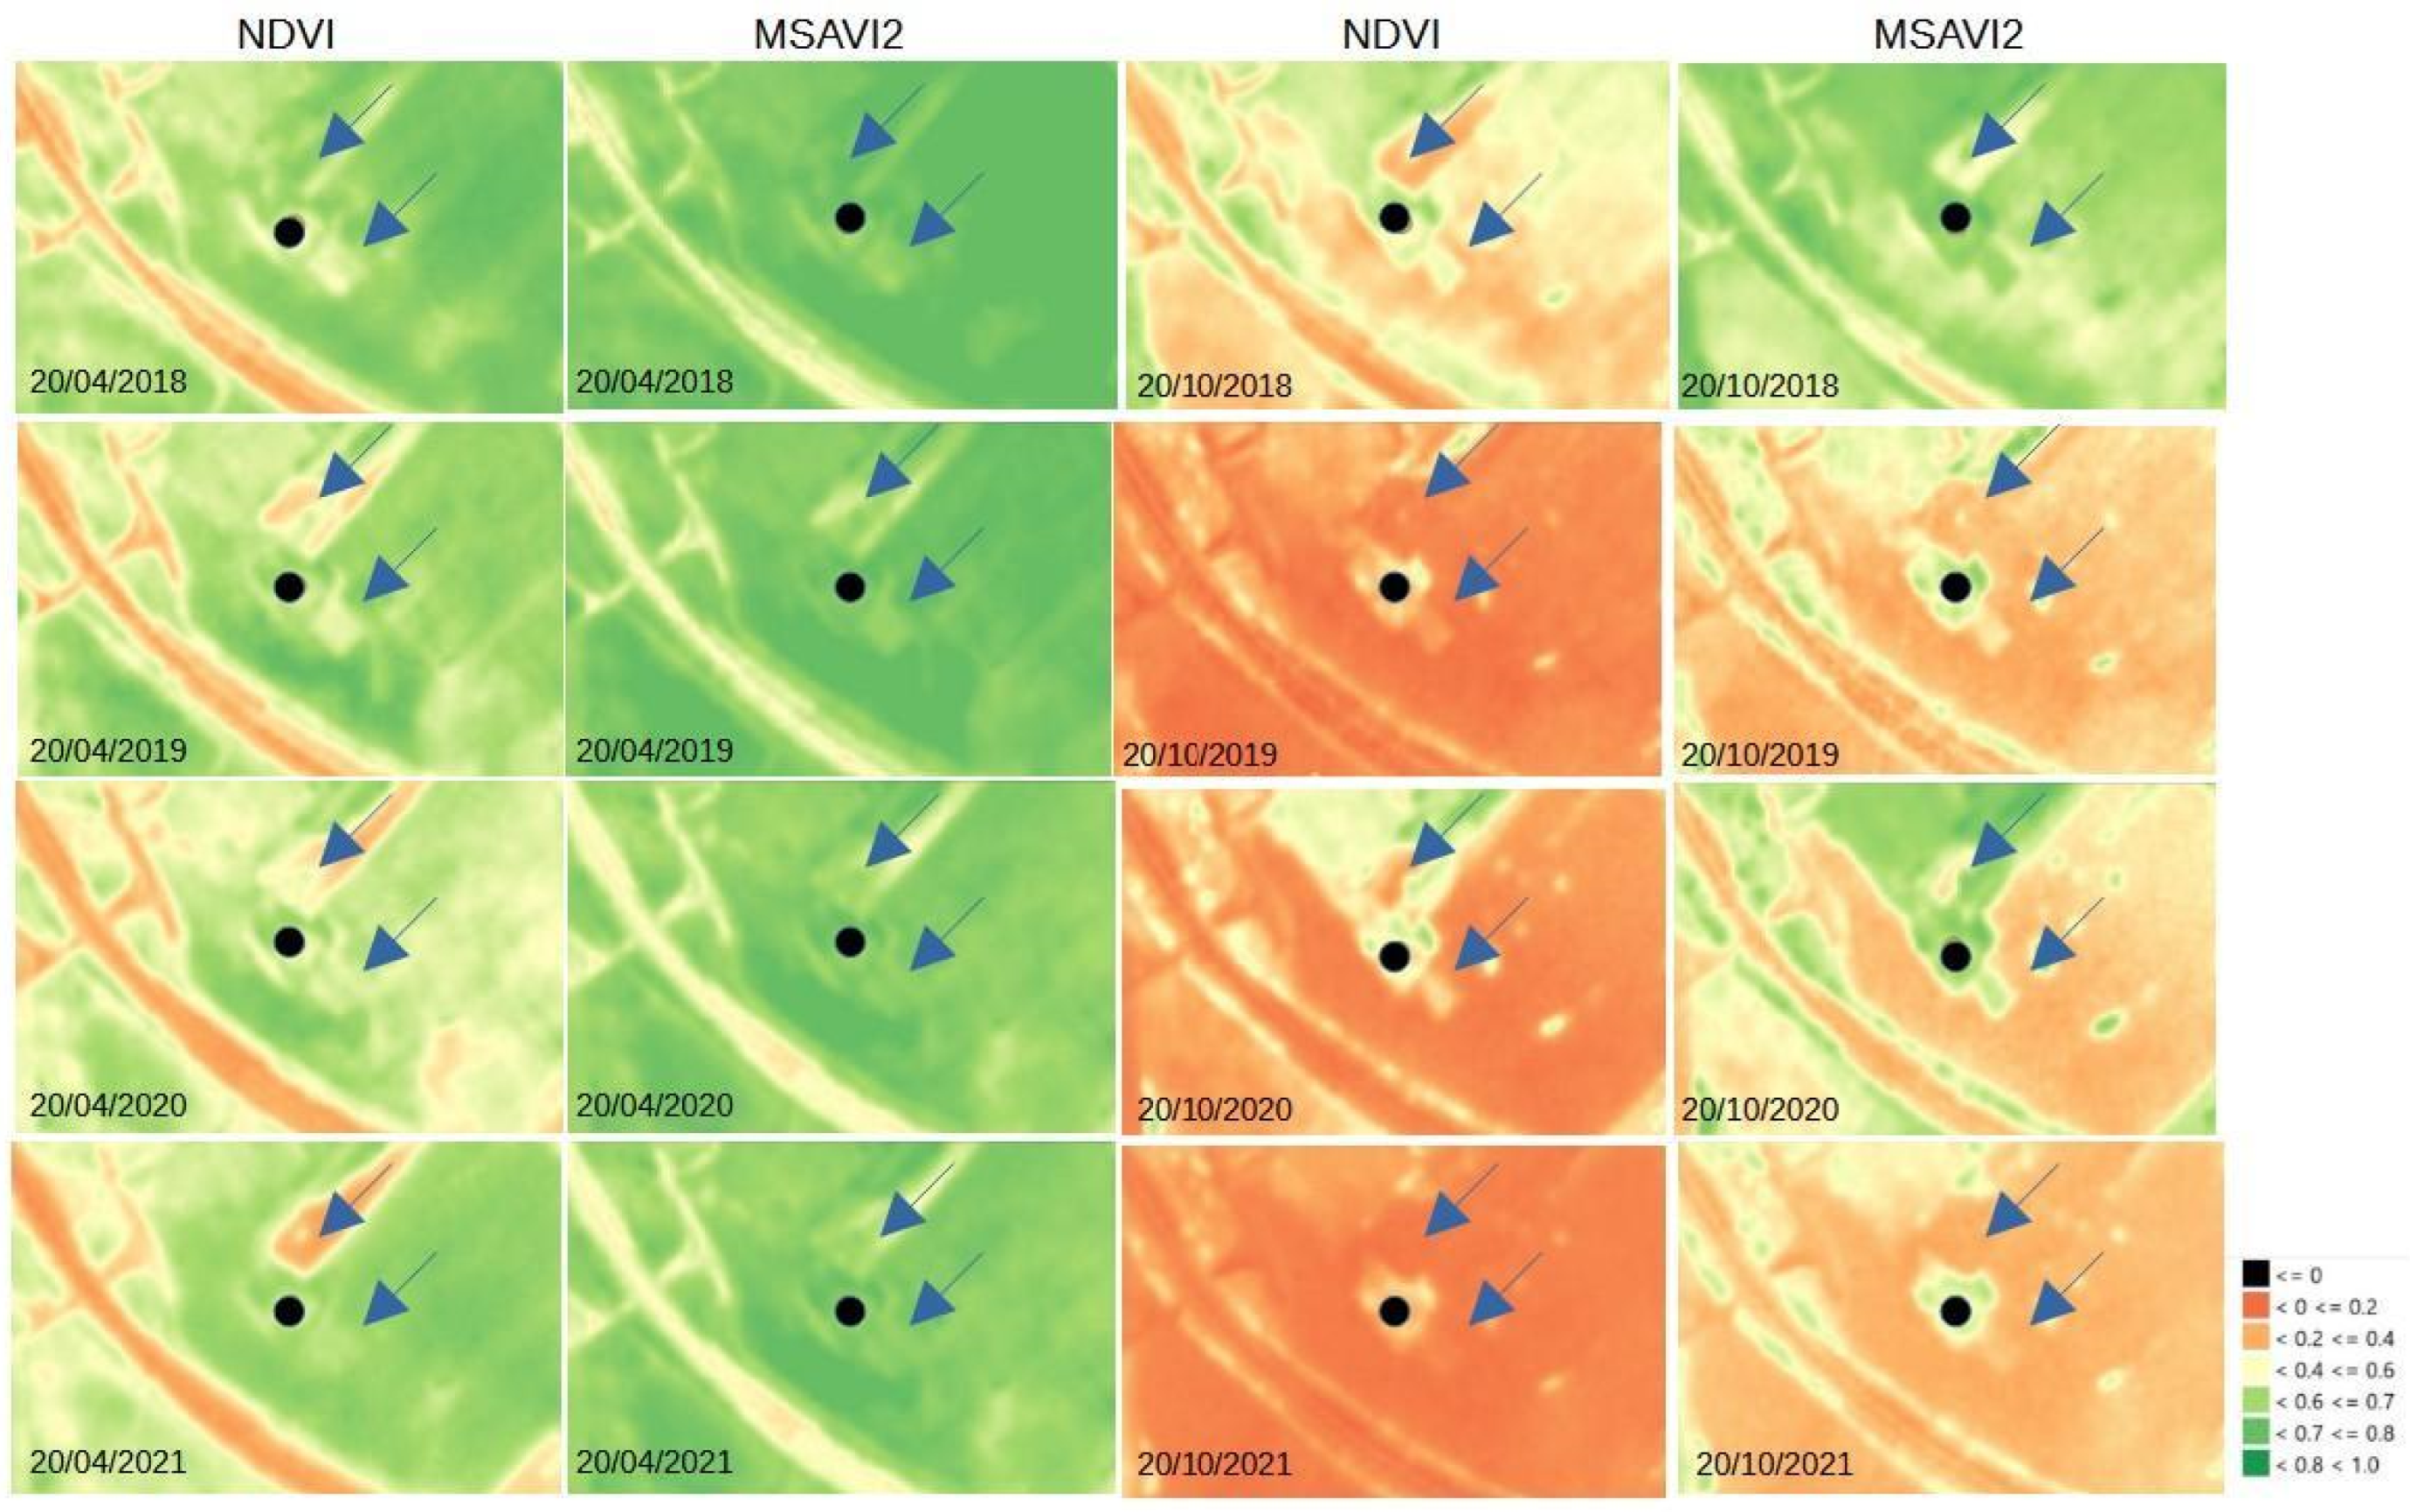
3.1. Analysis of Satellite Images

As mentioned in Section 2.1.1, only indices obtained using the Planet Fusion algorithm have been taken into account. In particular, the trend of NDVI and MSAVI2 indices over the period April 2018–June 2022 was examined. The MSAVI2 index is used as a variant to extend the application limits of NDVI to areas with a high presence of bare soil. A tool to visually analyze the two indices’ trends has been implemented. It shows the daily trend over the period April 2018–June 2022.
The following Figure 10 shows a screenshot of the tool that can be accessed at https://gislab.crs4.it/archaeosardinia/sat.html (accessed on 15 December 2023).
The analysis of these indices appears to show anomalies that are repeated over the years and suggest the possible presence of buried structures in areas north–east and south-east of the Nanni Arrù excavated part. As an example, some of the NDVI and MSAVI2 indices are shown in Figure 11, with an indication of the areas showing anomalies.
As described in Section 2.1.2, in this study both distributed and persistent radar targets were analyzed and made available for consultation through the Rheticus Displacement service. The distribution of PS and DS in the surrounding area of the Nanni Arrù site is shown in Figure 12. The PS/DS ground motion map shows that the Nuraghe Nanni Arrù is stable in the monitored time interval (January 2018–May 2023).

3.2. Analysis from Drone Surveys

Multispectral Sensor

It can be observed that there is a clear lush and circular cistus vegetation inside some towers and similar cistus are present in an eastern area of the excavated site (Figure 13); in fact, there is no tower visible, but there could be one buried under the ground.
As emerged from the historical series of satellite data, these plants appear to have higher vigor than the others nearby.

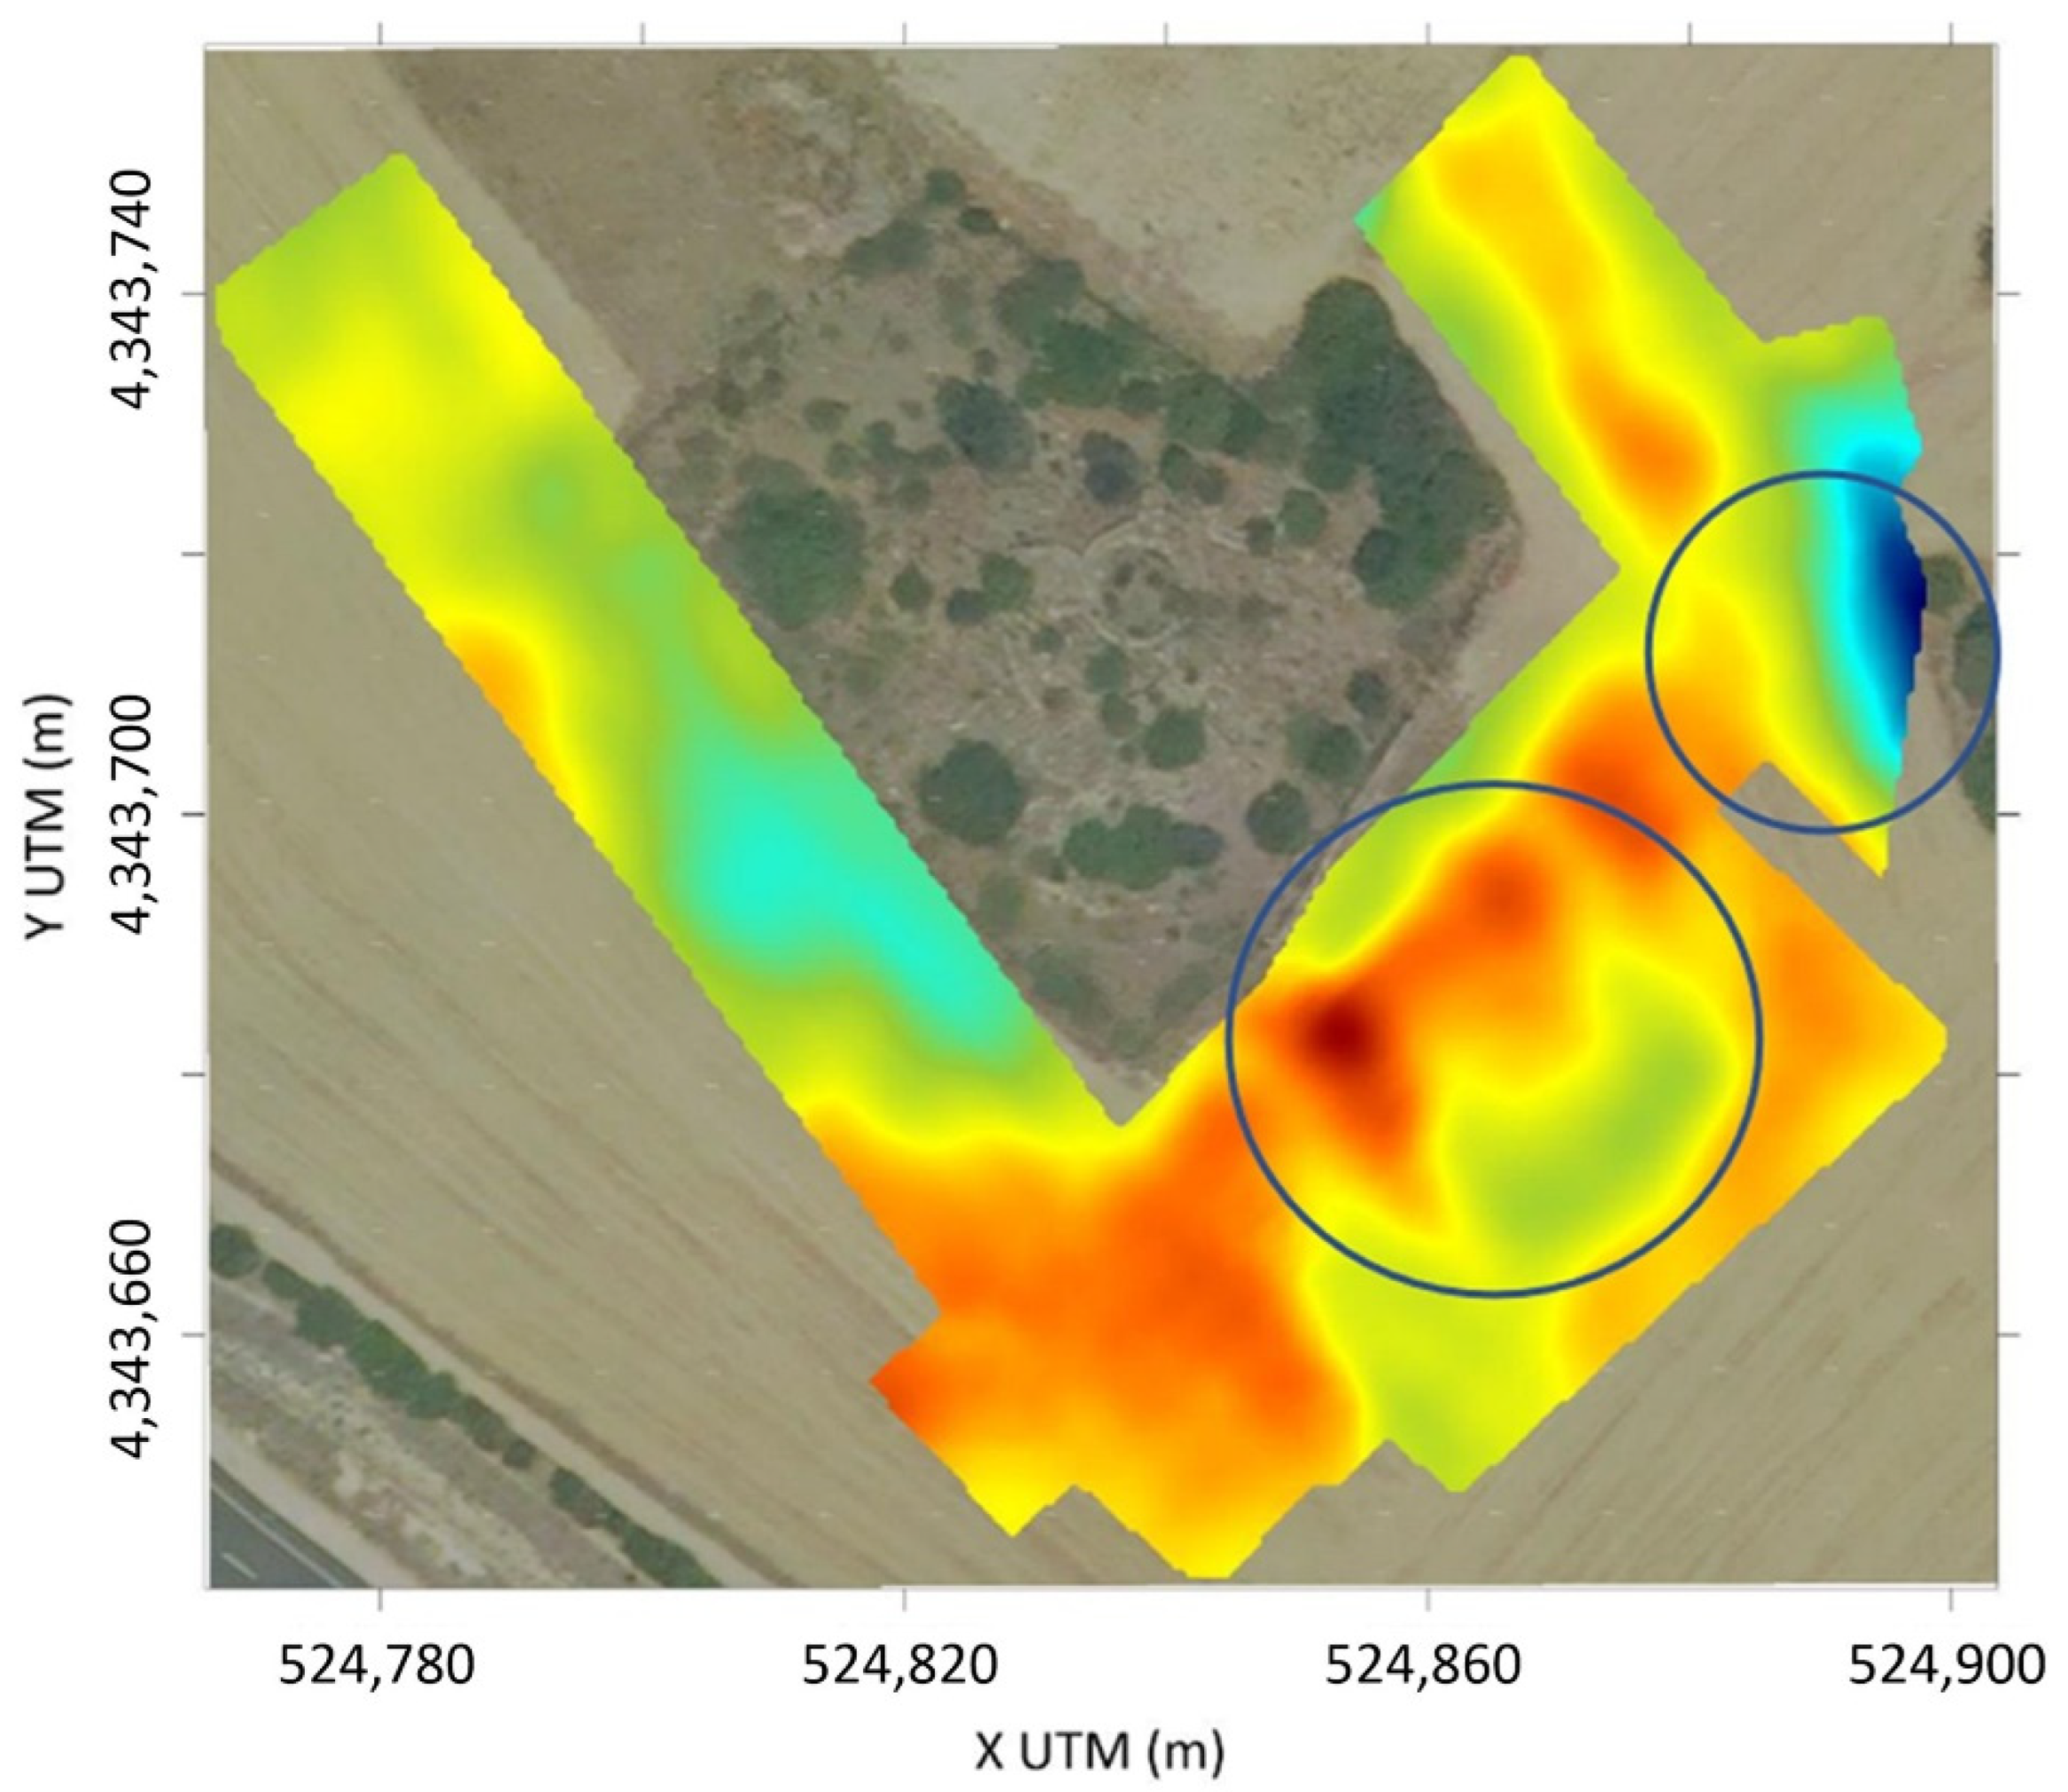
3.3. Analysis of Geophysical Surveys

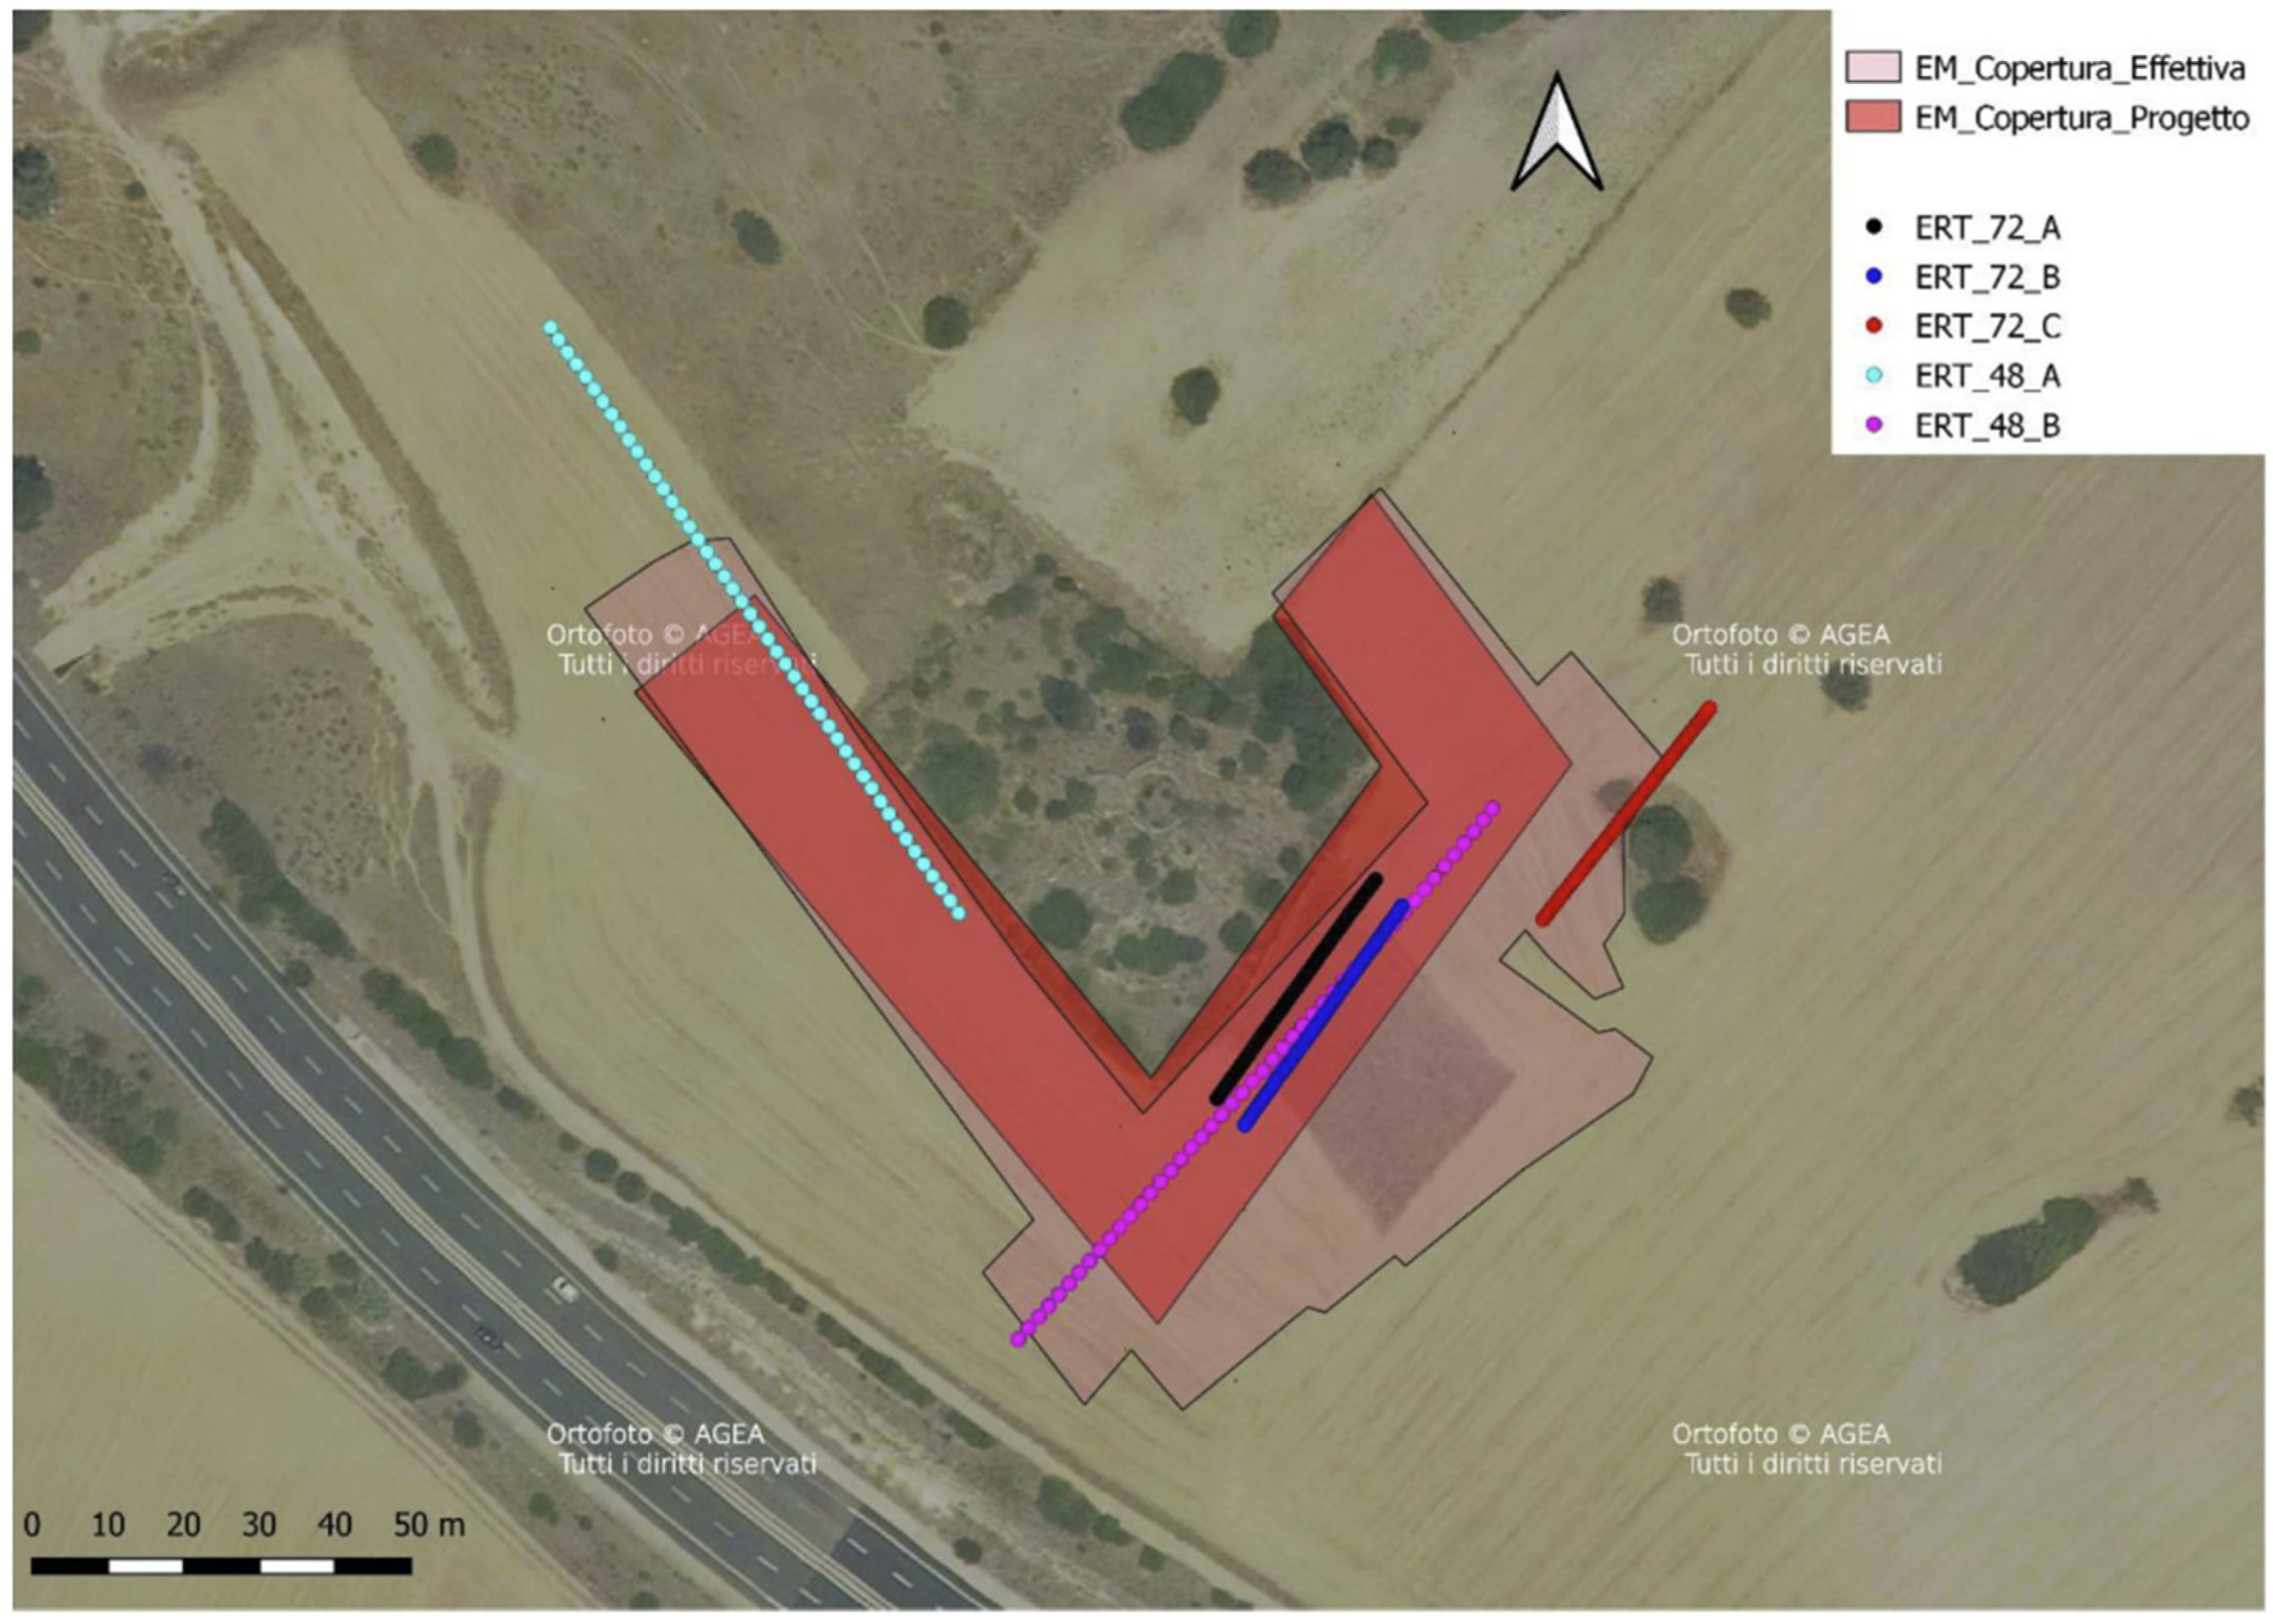
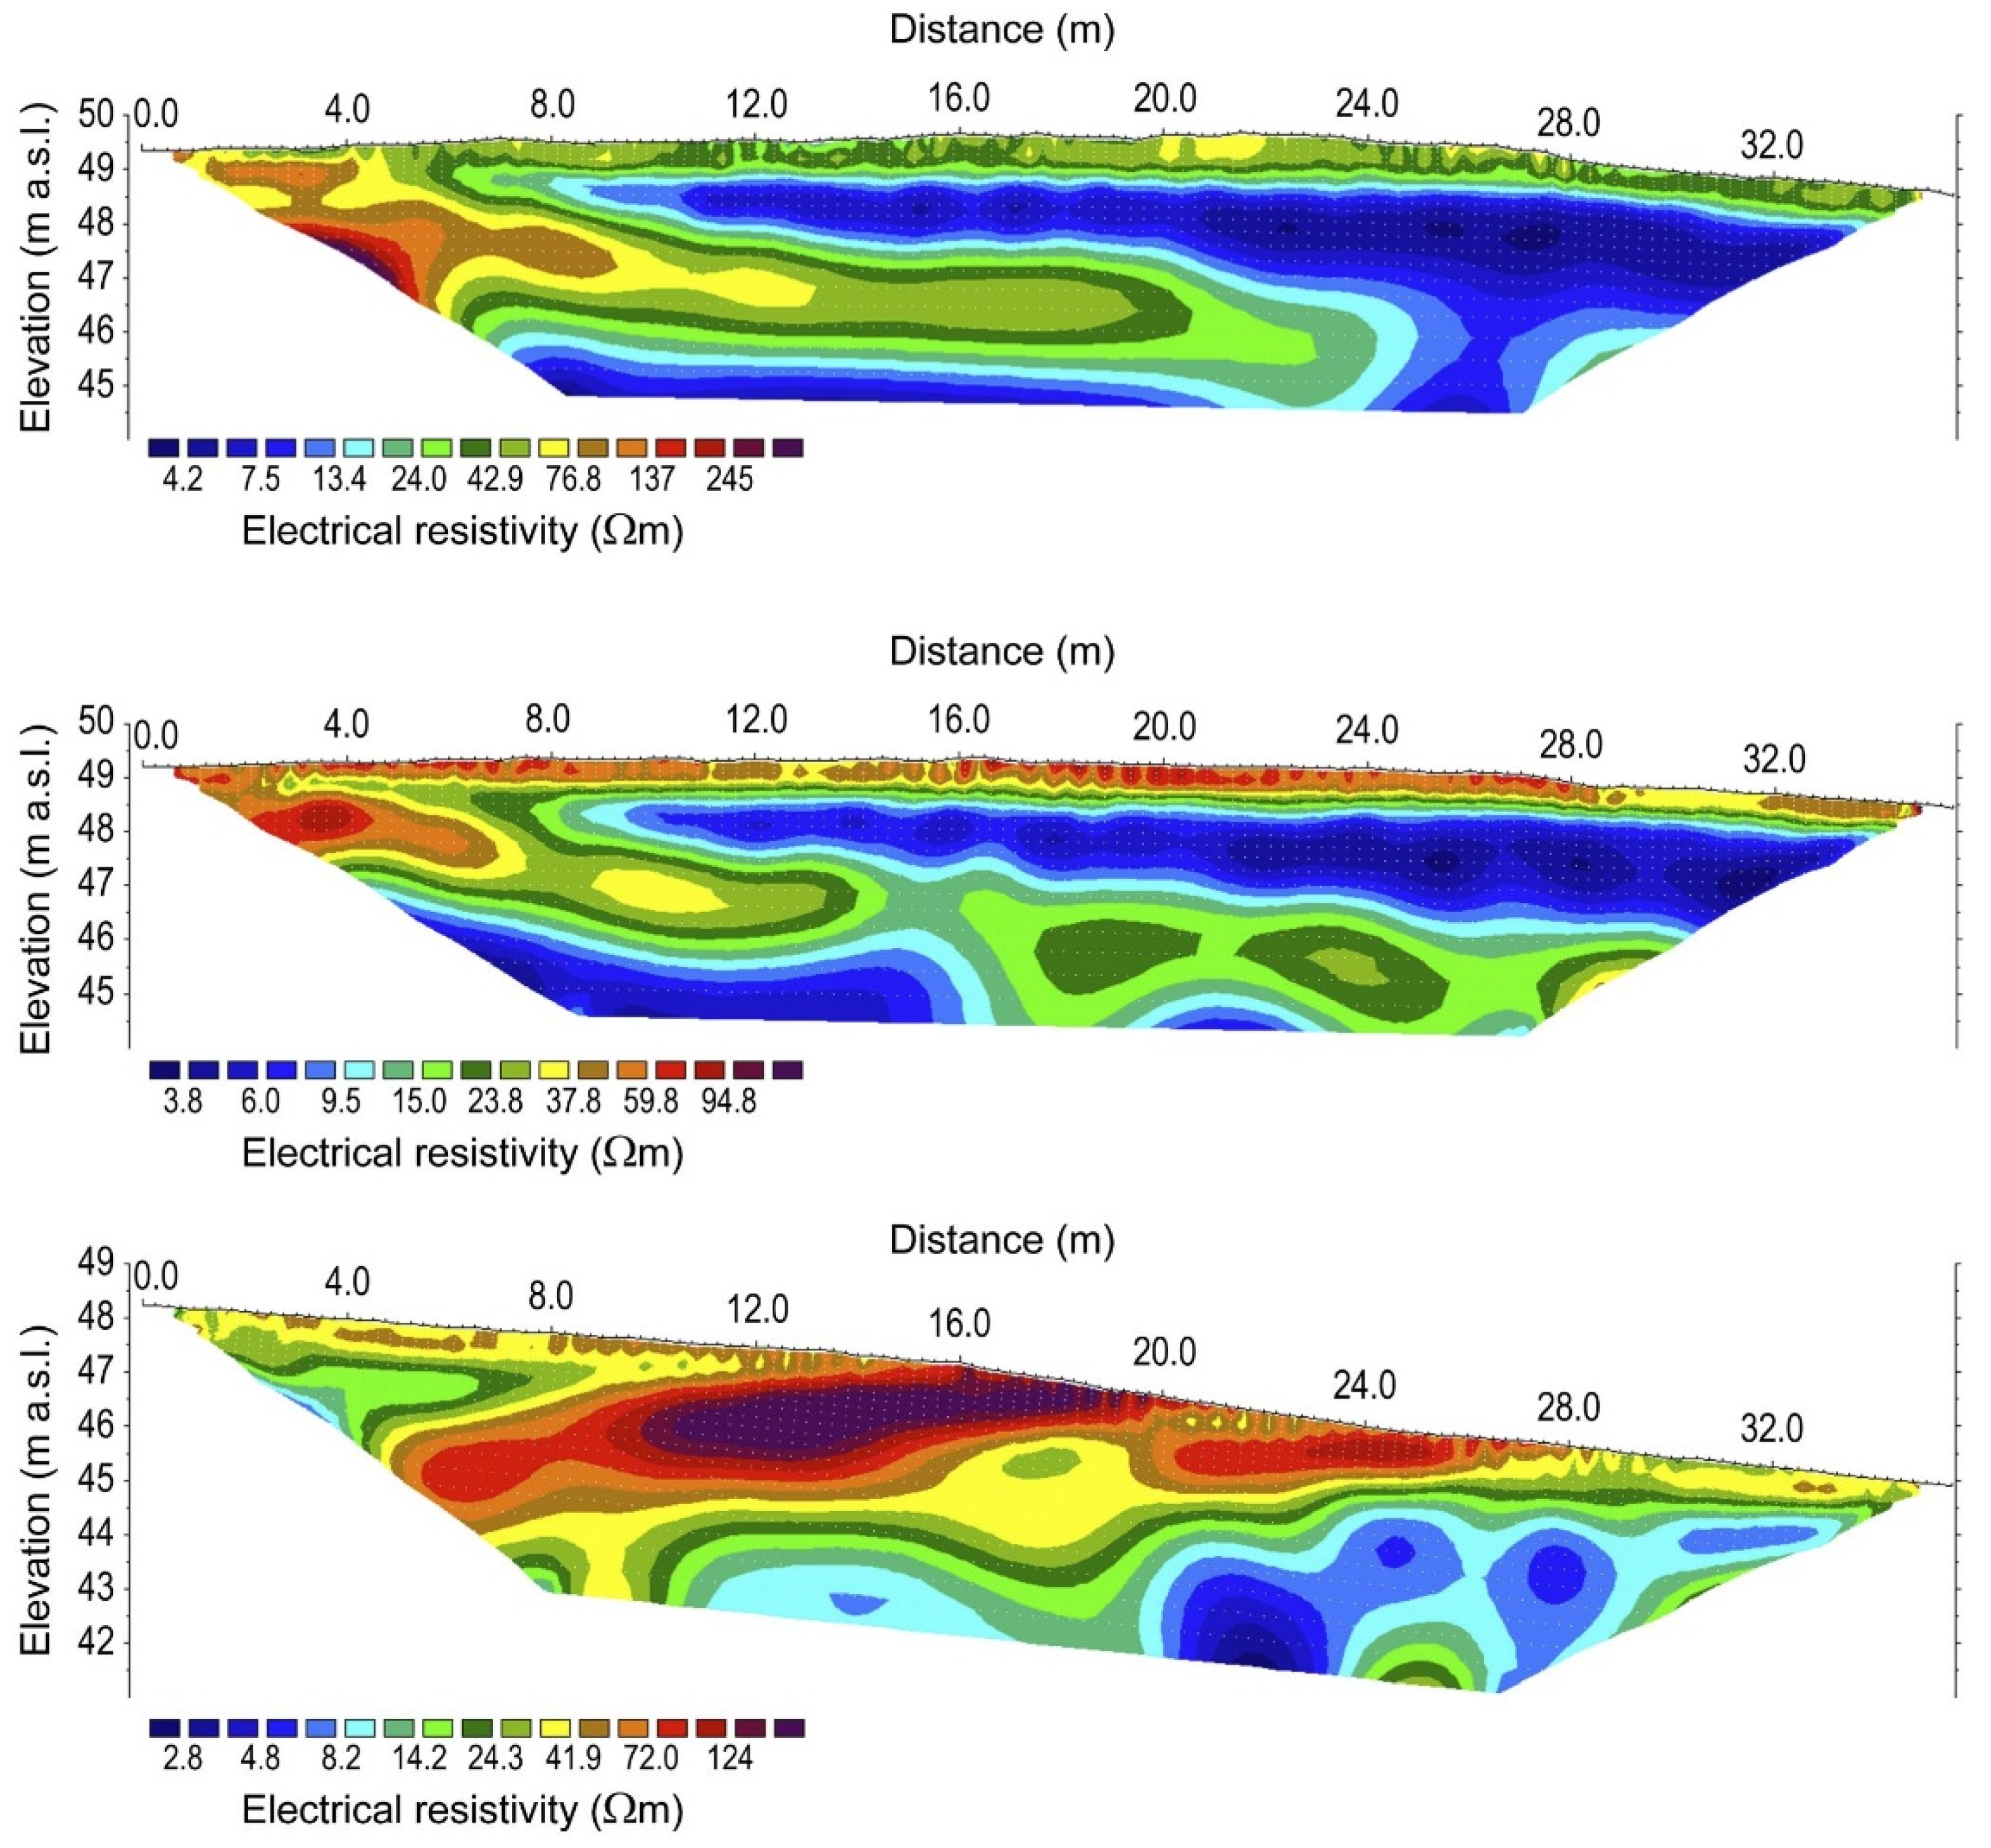
3.3.1. Initial Electrical Resistivity Tomography

As described in Section 2.3.1, the direct current geoelectric method was used to acquire resistivity data along the profile lines ERT_48_A and ERT_48_B, shown in Figure 4. For the 2D inversion of the experimental data, the ResIPy codes [31] and the commercial software Res2Dinv® (https://landviser.com/software/res2dinv/, accessed on 14 December 2023) [32] were used. Before proceeding with the data inversion, each pseudo section was carefully edited using filtering to eliminate particularly noisy data. This operation was carried out using ProSys® (https://www.altech-ads.com/products/Prosys-OPC/, accessed on 14 December 2023), the software for operating the SyscalPro® instrument.
The resulting resistivity profiles are depicted in Figure 14 and were utilized for the design of the FDEM investigations; namely, for the selection of the instrument and the determination of the acquisition parameters, such as height of the instrument above ground surface and operating frequencies.
Both tomography results show electrical resistivity values between approximately 4 Ωm and 50 Ωm. Based on these values, electromagnetic data have been simulated for a wide range of potential acquisition parameters using the FDEMtools 3.0 software [32]. From these simulations, it was found that the site’s electrical characteristics were optimal for both FDEM instruments, MiniExplorer, and GEM2. Furthermore, based on the simulation, the optimal working height was determined to be 30 cm, and the operating frequencies of GEM2 were 5825 Hz, 15,325 Hz, 32,025 Hz, 57,025 Hz, and 80,225 Hz.

3.3.2. Electromagnetic Resistivity and In-Phase Maps

The apparent resistivity maps obtained from the data collected using the MiniExplorer and GEM2 instruments are depicted in Figure 15 and Figure 16. Both maps show two significant anomalies (see blue circles) in an estimated depth range of 0 to 1.8 m, which deserve closer attention.
The tomographies discussed in the next section were conducted with the aim of further investigating these anomalies.

3.3.3. Follow-Up Electrical Resistivity Tomography

Three additional ERT surveys were conducted along the lines indicated in Figure 16, starting from the north–east and continuing toward the south–west. Tomographies ERT_72_A and ERT_72_B, conducted to investigate electromagnetic anomalies in the south–east of the nuraghe, are shown in the top and middle sections of Figure 17. Both tomographies reveal: (1) a relatively resistive superficial layer (ranging from 25 to 90 Ωm) with a thickness of about 1 m; and (2) a second conductive layer with resistivities less than 5 Ωm, which contains a “tongue” of more resistive material in the intermediate part (in depth). Although the electrical tomography sections do not point to subsurface structures of archaeological relevance, the general trend along the lines, i.e., increasing conductivity in the electromagnetic resistivity and in-phase maps and decreasing resistivity in the electrical tomography sections, is consistent. Also, electrical resistivity tomography ERT_72_C, displayed at the bottom of Figure 17, targeting the low conductivity anomaly in the east of the nuraghe, does confirm the trend seen in the electromagnetic resistivity and in-phase maps.

4. Discussion

The comparison of data obtained from the various survey techniques used in this study highlighted anomalies that could suggest the presence of buried structures. In particular, both the data obtained by electromagnetic geophysical survey and those obtained by satellite and drone showed anomalies in the southern area close to the excavated part. However, the evidence was not strong enough to come to a final conclusion. Therefore, it would be useful to conduct further electromagnetic tests also in the excavated area; this has not been possible with the geophysical instruments at hand, given the asperity of the site. Future developments of this study include the possibility of mounting the Mini-Explorer electro-magnetometer on the drone, as described in [33].
Electromagnetic surveys have also highlighted anomalies in an eastern area of the excavated part of the Nanni Arrù site characterized by the presence of cistus similar to those present inside some towers in the excavated area, which could suggest possible buried structures.
Further developments of this study also include the application of the proposed methodology to nuragic sites with different characteristics such as the type (simple and complex nuraghi, for instance), the presence of surrounding villages, and the involvement in excavation activities.

Author Contributions

The author’s contribution is as follows: conception of the research L.M. and R.D.; acquisition and processing of satellite data L.M. and R.D.; acquisition and processing of UAV data R.D. and E.B.L.; acquisition and processing of geophysical data G.P.D., Z.H., G.S. and A.T.; interpretation of satellite, UAV and geophysical data all authors; discussion of results all authors; contribution to draft writing of the paper all authors; writing and review of final version L.M. All authors have read and agreed to the published version of the manuscript.

Funding

This research was funded by the Autonomous Region of Sardinia (LR7/2007 and ex Art. 9 L.R. 20/2015) and in part thanks to voucher OCRE (Open Clouds for Research Environments).

Institutional Review Board Statement

Not applicable.

Informed Consent Statement

Not applicable.

Data Availability Statement

The raw data supporting the results of this article will be made available by the authors on request.

Acknowledgments

The authors like to express their sincere gratitude to Archaeologist Patrizia Zuncheddu for her extensive description of the Nanni Arrù area, Gavin Brelstaff for his English language review, and Planetek Italia for the Multitemporal Interferometry technique that was implemented within its Rheticus Displacement platform.

Conflicts of Interest

The authors declare no conflict of interest.

References

  1. Spanu, V.; Lorrai, E.; Muscas, L.; Demontis, R. Nurnet-Geoportal. Archeomatica Int. 2017, 8, 26–29. [Google Scholar]
  2. Demontis, R.; Lorrai, E.; Muscas, L. The Nurnet Geoportal an Example of Participatory GIS: A Review after Six Years. Open Access J. Archaeol. Anthropol. OAJAA 2020, 2, 1–4. [Google Scholar] [CrossRef]
  3. Cigna, F.; Balz, T.; Tapete, D.; Caspari, G.; Fu, B.; Abballe, M.; Jiang, H. Exploiting satellite SAR for archaeological prospection and heritage site protection. Geo-Spat. Inf. Sci. 2023, 2023, 2223603. [Google Scholar] [CrossRef]
  4. Fiz, I.; Cuesta, R.; Subias, E.; Martin, P.M. Tests with SAR Images of the PAZ Platform Applied to the Archaeological Site of Clunia (Burgos, Spain). Remote Sens. 2021, 13, 2344. [Google Scholar] [CrossRef]
  5. Chen, F.; Masini, N.; Yang, R.; Milillo, P.; Feng, D.; Lasaponara, R. A Space View of Radar Archaeological Marks: First Applications of COSMO-SkyMed X-Band Data. Remote Sens. 2015, 7, 24–50. [Google Scholar] [CrossRef]
  6. Tzouvaras, M.; Kouhartsiouk, D.; Agapiu, A.; Danezis, C.; Hadjimitsis, D.G. The Use of Sentinel-1 Synthetic Aperture Radar (SAR) Images and Open-Source Software for Cultural Heritage: An Example from Paphos Area in Cyprus for Mapping Landscape Changes after a 5.6 Magnitude Earthquake. Remote Sens. 2019, 11, 1766. [Google Scholar] [CrossRef]
  7. Masini, N.; Romano, G.; Sieczkowska, D.; Capozzoli, L.; Spizzichino, D.; Gabellone, F.; Bastante, J.; Scavone, M.; Sileo, M.; Abate, N.; et al. Non invasive subsurface imaging to investigate the site evolution of Machu Picchu. Nat. Sci. Rep. 2023, 13, 16035. [Google Scholar] [CrossRef] [PubMed]
  8. Soula, F.; Fallavollita, P.; Zappino, L.; Balsi, M.; Esposito, S.; Melis, M.G. Remote Sensing in Archaeology. The State of the Art and Presentation of METAdAtA Research Project’s Preliminary Results. Rev. Fr. Photogramm. Télédétect. 2018, 216, 61–79. [Google Scholar] [CrossRef]
  9. Luo, L.; Wang, X.; Guo, H.; Lasaponara, R.; Zong, X.; Masini, N.; Wang, G.; Shi, P.; Khatteli, H.; Chen, F.; et al. Airborne and spaceborne remote sensing for archaeological and cultural heritage applications: A review of the century (1907–2017). Remote Sens. Environ. 2019, 232, 111280. [Google Scholar] [CrossRef]
  10. Chen, F.; Lasaponara, R.; Masini, N. An overview of synthetic aperture radar remote sensing in archaeology: From site detection to monitoring. J. Cult. Herit. 2017, 23, 5–11. [Google Scholar] [CrossRef]
  11. Lasaponara, R.; Masini, N. Remote Sensing in archaeology: From visual data interpretation to digital data manipulation. In Satellite Remote Sensing. A New Tool for Archaeology; Springer: Dordrecht, The Netherlands, 2012; pp. 3–16. [Google Scholar]
  12. Gojda, M.; Hejcman, M. Cropmarks in main field crops enable the identification of a wide spectrum of buried features on archaeological sites in Central Europe. J. Archaeol. Sci. 2012, 39, 1655–1664. [Google Scholar] [CrossRef]
  13. Alexakis, D.; Sarris, A.; Astaras, T.; Albanakis, K. Detection of Neolithic Settlements in Thessaly (Greece) Through Multispectral and Hyperspectral Satellite Imagery. Sensors 2009, 9, 1167–1187. [Google Scholar] [CrossRef] [PubMed]
  14. Cavalli, R.M.; Colosi, F.; Palombo, A.; Pignatti, S.; Poscolieri, M. Remote hyperspectral imagery as a support to archaeological prospection. J. Cult. Herit. 2007, 8, 272–283. [Google Scholar] [CrossRef]
  15. Agapiou, A.; Lysandrou, V.; Lasaponara, R.; Masini, N.; Hadjimitsis, D.G. Study of the Variations of Archaeological Marks at Neolithic Site of Lucera, Italy Using High-Resolution Multispectral Datasets. Remote Sens. 2016, 8, 723. [Google Scholar] [CrossRef]
  16. Agapiou, A.; Hadijmitsis, D.G.; Alexakis, D.; Papadavid, G. Examining the Phenological Cycle of Barley (Hordeum vulgare) Using Satellite and in situ Spectroradiometer Measurements for the Detection of Buried Archaeological Remains. GISci. Remote Sens. 2012, 49, 854–872. [Google Scholar] [CrossRef]
  17. Lasaponara, R.; Masini, N. Detection of archaeological crop marks by using satellite QuickBird multispectral imagery. J. Archaeol. Sci. 2007, 34, 214–221. [Google Scholar] [CrossRef]
  18. Themistocleous, K.; Agapiou, A.; Cusa, B.; Hadjimitsis, D.G. Unmanned aerial systems and spectroscopy for remote sensing applications in archaeology. Int. Arch. Photogramm. Remote Sens. Spat. Inf. Sci. 2015, XL-7/W3, 1419–1423. [Google Scholar] [CrossRef]
  19. Laugier, E.J.; Casana, J. Integrating Satellite, UAV, and Ground-Based Remote Sensing in Archaeology: An Exploration of Pre-Modern Land Use in Northeastern Iraq. Remote Sens. 2021, 13, 5119. [Google Scholar] [CrossRef]
  20. Sarris, A.; Papadopolous, N.; Agapiou, A.; Salvi, M.C.; Hadjimitsis, D.G.; Parkinson, W.A.; Yerkes, R.W.; Gyucha, A.; Duffy, P.R. Integration of geophysical surveys, ground hyperspectral measurements, aerial and satellite imagery for archaeological prospection of prehistoric sites: The case study of Vészto-Mágor Tell, Hungary. J. Archaeol. Sci. 2013, 40, 1454–1470. [Google Scholar] [CrossRef]
  21. Roslan, S.A.; Yakub, F.; Rambat, S.; Noor, N.M.; Saidin, M. The Integration of Aerial Sensing and Geophysical Techniques to Identify Buried Archaeological Properties in Sungai Batu, Bujang Valley. IOP Conf. Ser. Earth Environ. Sci. 2020, 540, 012013. [Google Scholar] [CrossRef]
  22. Deiana, R.; Vicenzutto, D.; Deidda, G.P.; Boaga, J.; Cupitò, M. Remote Sensing, Archaeological, and Geophysical Data to Study the Terramare Settlements: The Case Study of Fondo Paviani (Northern Italy). Remote Sens. 2020, 12, 2617. [Google Scholar] [CrossRef]
  23. Deiana, R.; Deidda, G.P.; Dìes Cusì, E.; van Dommelen, P.; Stiglitz, A. FDEM and ERT measurements for archaeological prospections at Nuraghe S’Urachi (West-Central Sardinia). Archaeol. Prospect. 2021, 29, 69–86. [Google Scholar] [CrossRef]
  24. Gosner, L.R.; Nowlin, J. Approaching Interaction in Iron Age Sardinia: Multi-Scalar Survey Evidence from the Sinis Archaeological Project and the Progetto S’Urachi. Open Archaeol. 2023, 9, 20220320. [Google Scholar] [CrossRef]
  25. Casari, C.; Demontis, R.; Lorrai, E.; Muscas, L.; Amici, S.; Cannas, V. Investigating spaceborne remote sensing techniques for buried nuraghi structures identification: The Nuraghe Nanni Arrù case study. In Proceedings of the X AIT International Conference, Virtual Event. Cagliari, Italy, 13–15 September 2021. [Google Scholar]
  26. Houborg, R.; Mc Cabe, M.F. A Cubesat enabled Spatio-Temporal Enhancement Method (CESTEM) utilizing Planet, Landsat and MODIS data. Remote Sens. Environ. 2018, 209, 211–226. [Google Scholar] [CrossRef]
  27. Bovenga, F.; Refice, A.; Guerriero, R.; Nutricato, R. SPINUA: A flexible processing chain for ERS/ENVISAT long term interferometry. In Proceedings of the 2004 Envisat & ERS Symposium, Salzburg, Austria, 6–10 September 2004. [Google Scholar]
  28. Deidda, G.P.; Himi, M.; Barone, I.; Cassiani, G.; Casas Ponsati, A. Frequency-Domain Electromagnetic Mapping of an Abandoned Waste Disposal Site: A Case in Sardinia (Italy). Remote Sens. 2022, 14, 878. [Google Scholar] [CrossRef]
  29. Lavoué, F.; Van Der Kruk, J.; Rings, J.; André, F.; Moghadas, D.; Huisman, J.A.; Lambot, S.; Weihermüller, L.; Vanderborght, J.; Vereecken, H. Electromagnetic induction calibration using apparent electrical conductivity modelling based on electrical resistivity tomography. Near Surf. Geophys. 2010, 8, 553–561. [Google Scholar] [CrossRef]
  30. Deidda, G.P.; Díaz de Alba, P.; Pes, F.; Rodriguez, G. Forward Electromagnetic Induction Modelling in a Multilayered Half-Space: An Open-Source Software Tool. Remote Sens. 2023, 15, 1772. [Google Scholar] [CrossRef]
  31. Blanchy, G.; Saneiyan, S.; Boid, J.; McLachlan, P.; Binley, A. ResIPy, an intuitive open-source software for complex geoelectrical inversion/modelling. Comput. Geosci. 2020, 137, 104423. [Google Scholar] [CrossRef]
  32. Loke, M.H. Tutorial: 2-D and 3-D Electrical Imaging Surveys. 2001. Available online: www.geoelectrical.com (accessed on 15 December 2023).
  33. Karaoulis, M.; Ritsema, I.; Bremmer, C.; De Kleine, M.; Essink, G.O.; Ahlrichs, E. Drone-Borne Electromagnetic (DR-EM) Surveying in The Netherlands: Lab and Field Validation Results. Remote Sens. 2022, 14, 5335. [Google Scholar] [CrossRef]
Figure 1. Nuragic sites in Sardinia https://nurnet.crs4.it/nurnetgeo/ (accessed on 15 December 2023), with nuraghes indicated in red, domus de janas in green, holy wells in light blue, giants’ graves in pink, villages in blue, and menhir in maroon.
Geomatics 04 00003 g001
Figure 2. Planimetry of the Nanni Arrù site (a), RGB image taken from drone (2 July 2021) (b).
Geomatics 04 00003 g002
Figure 3. Google Earth images. Examples of possible soil marks (a) and crop marks (b), pointed out by the arrows.
Geomatics 04 00003 g003
Figure 4. The dotted lines represent the locations of five 2D ERTs and the light red surface, the total area in which 3D FDEM measurements were carried out.
Geomatics 04 00003 g004
Figure 5. IRIS SyscalPro® Instrument.
Geomatics 04 00003 g005
Figure 6. Mini-Explorer electro-magnetometer (a) and GEM2 electro-magnetometer (b).
Geomatics 04 00003 g006
Figure 7. IT platform architecture.
Geomatics 04 00003 g007
Figure 8. ArchaeoSardinia–OpenAtlas archaeological data documentation module https://gislab.crs4.it/openatlas/ (accessed on 15 December 2023).
Geomatics 04 00003 g008
Figure 9. Screenshot of the ArchaeoSardinia WebGIS.
Geomatics 04 00003 g009
Figure 10. Screenshot of the tool that shows the NDVI and MSAVI2 trend over the period April 2018–June 2022.
Geomatics 04 00003 g010
Figure 11. NDVI and MSAVI2 indices calculated on the same days in the years 2018–2021. Black dots indicate Nanni Arrù site, the arrows indicate anomalous areas.
Geomatics 04 00003 g011
Figure 12. PS/DS ground motion map. Purple pointer indicates the Nanni Arrù site. In the color scale: green indicates stability, red indicates lowering and blue indicates uplift. The displacement time series graph shows the displacement trend of selected PS (blue pointer) in descending orbit over the monitored time interval (January 2018–May 2023).
Geomatics 04 00003 g012
Figure 13. MSAVI2, NDVI, and NDRE indices obtained by the survey conducted on 21 October 2022. Blue arrows indicate the areas where cistus are inside towers, black arrow indicates similar cistus that are present where there are no towers.
Geomatics 04 00003 g013
Figure 14. Depth profiles obtained from electrical resistivity tomography ERT_48_A (top) and electrical resistivity tomography ERT_48_B (bottom).
Geomatics 04 00003 g014
Figure 15. Electromagnetic map from MiniExplorer: Electrical conductivity obtained with coils spaced 1.18 m in a vertical configuration corresponding to an investigation depth range of up to 1.8 m. The circles indicate two areas with anomalies to be verified.
Geomatics 04 00003 g015
Figure 16. Electromagnetic map from GEM2: component in quadrature of the ratio between secondary magnetic field and primary magnetic field. The circles indicate two areas with anomalies to be further investigated by additional ERT surveys, namely ERT_72_A and ERT_72_B indicated by blue crosses, ERT_72_C indicated by red crosses).
Geomatics 04 00003 g016
Figure 17. Depth profiles obtained from electrical resistivity tomography ERT_72_A (top), electrical resistivity tomography ERT_72_B (middle) and electrical resistivity tomography ERT_72_C (bottom).
Geomatics 04 00003 g017
Table 1. List of indices, in the formulas: NIR indicates the light reflected in the near-infrared spectrum, RED indicates the light reflected in the red range of the spectrum, GREEN indicates the light reflected in the green range of the spectrum, and SWIR indicates the light reflected in the short wave of infrared.
NameAcronymFormulaDescriptionCalculation Method
Chlorophyll Vegetation IndexCVI N I R G R E E N   R E D G R E E N It indicates the amount of chlorophyll in plants.Planet Fusion algorithm
Normalized Difference Vegetation IndexNDVI N I R R E D N I R + R E D It indicates the density and health of vegetation.Planet Fusion algorithm
Modified Soil Adjusted Vegetation Index 2MSAVI2 2     N I R + 1 ( 2 N I R + 1 ) 2 8   ( N I R R E D ) 2 It is used as a variant to extend the application limits of NDVI to areas with a high presence of bare soil.Planet Fusion algorithm
Normalized Difference Water IndexNDWI G R E E N N I R G R E E N + N I R It identifies vegetation water status, moisture deficit and saturation.Sentinel2 data
Normalized Difference Moisture IndexNDMI N I R S W I R N I R + S W I R It indicates vegetation water content.Sentinel2 data
Moisture Stress IndexMSI S W I R N I R They are used for canopy stress analysis.Sentinel2 data
Moisture Stress Index 2MSI 2 S W I R 2 N I R
Table 2. SAR data processed.
Interferometric DatasetConstellationOrbitFirst Data AcquisitionLast Data AcquisitionN. Images
CSK/CSGCosmoAsc5 January 20185 January 202399
CSK/CSGCosmoDesc16 January 201822 April 202374
Table 3. Geometrical details of the first two geoelectrical surveys.
LineQuadripoleElectrode Spacing (m)UTM Coordinates
Start (m)
UTM Coordinates
End (m)
Quota s.l.m
Start–End (m)
ERT_48_ADipole–Dipole2524,757.9 E
4,343,779.0 N
524,811.6 E
4,343,702.0 N
49.4–50.3
ERT_48_BDipole–Dipole2524,819.6 E
4,343,646.0 N
524,882.2 E
4,343,716.0 N
46.0–48.2
Table 4. Geometrical details of the last three geoelectrical surveys.
LineQuadripoleElectrode Spacing (m)UTM Coordinates
Start (m)
UTM Coordinates
End (m)
Quota s.l.m
Start–End (m)
ERT_72_ADipole–Dipole0.5524,845.7 E
4,343,678.0 N
524,866.7 E
4,343,707.0 N
49.4–48.5
ERT_72_BDipole–Dipole0.5524,849.5 E
4,343,675.0 N
524,870.2 E
4,343,703.0 N
49.2–48.5
ERT_72_CDipole–Dipole0.5524,888.9 E
4,343,701.0 N
524,910.9 E
4,343,729.0 N
48.2–44.9
Disclaimer/Publisher’s Note: The statements, opinions and data contained in all publications are solely those of the individual author(s) and contributor(s) and not of MDPI and/or the editor(s). MDPI and/or the editor(s) disclaim responsibility for any injury to people or property resulting from any ideas, methods, instructions or products referred to in the content.

