Abstract
The Cerrado is Brazil’s second largest biome, covering continuous areas in several states. Covering approximately 23% of Brazil’s territory, the Cerrado biome connects with all the main biomes in South America, thus forming a major biological corridor. This biome is one of those that has suffered the most from the incidence of wildfires, leading to a progressive depletion of the region’s natural resources. The aim of this study was to evaluate the use of an Unmanned Aerial Vehicle (UAV) embedded with an RGB sensor to obtain high-resolution digital products that can be used to identify areas of the Brazilian Cerrado affected by wildfires. The study was carried out in a savannah biome area selecting a vegetation corridor with native vegetation free from anthropogenic influence. The following UAV surveys were carried out before and after a burning event. Once the orthomosaics of the area were available, the GLI, VARI, ExG and NGRDI vegetation indices were used to analyze the vegetation. The data indicate that the B band and the GLI and ExG indices are more suitable for environmental impact analysis in Cerrado areas affected by fires, providing a solid basis for environmental monitoring and management in scenarios of fire disturbance.
1. Introduction
The Cerrado is Brazil’s second-largest biome, spanning continuous areas in the states of Goiás, Tocantins, and the Federal District, as well as parts of Bahia, Ceará, Maranhão, Mato Grosso do Sul, Mato Grosso, Minas Gerais, Rondônia, Piauí, and São Paulo, and isolated areas in Amapá, Amazonas, Pará, Roraima, and Paraná. Spanning approximately 23% of Brazil’s territory, mostly on the Central Plateau, the Cerrado biome connects with all the main biomes of South America (Amazon, Atlantic Forest, Caatinga, Chaco, and Pantanal), forming an extensive biological corridor [1].
Internationally classified as a savanna, the Cerrado is one of the most diverse biomes in Brazil, hosting approximately 11,627 plant species, 4400 of which are endemic. Its vegetation mainly consists of grasses, shrubs, and scattered trees with twisted trunks and deep roots that allow water absorption from depths of more than two meters, even during dry periods. This immense biodiversity qualifies the Cerrado as the richest savanna in the world [2].
This biome has suffered extensive anthropogenic impacts, surpassed only by the Atlantic Forest. Currently, the Cerrado faces intense deforestation, primarily driven by agricultural expansion, which progressively depletes the region’s natural resources [2]. According to MapBiomas, between 2018 and 2022, wildfires affected approximately 29 million hectares of the Cerrado. In 2024 alone, around 9.7 million hectares burned—85% (8.2 million hectares) in native vegetation areas—marking a 47% increase compared to the average of the past six years [1].
In response to the ongoing loss of native vegetation, innovative technologies for environmental monitoring in the Cerrado are urgently needed. These technologies must aim to mitigate the challenges of conducting field monitoring, a highly labor-intensive activity due to the biome’s vast area and the generally insufficient number of qualified professionals for such coverage.
In this context, the use of Unmanned Aerial Vehicles (UAVs), widely known as drones, has gained prominence in monitoring vegetated areas due to their practicality and wide range of applications [3,4,5]. The term UAV refers to any equipment capable of flying and being controlled without the need for an onboard operator [6]. The use of these devices in environmental work has been increasingly explored to optimize fieldwork and expand the possibilities for evaluations in environmental monitoring activities.
These devices are equipped with high-resolution imaging sensors capable of capturing high-quality digital images with representativity across various bands of the electromagnetic spectrum. With the increasing use of UAVs equipped with RGB sensors in recent years, there has been a growing demand for studies validating the results obtained in various scientific fields. Using the principles of photogrammetry, the collected images can be processed to produce digital products for various environmental applications [7], including vegetation indices derived from the combination of spectral bands. Although they have been widely used for mapping burned areas, identifying the most suitable index remains challenging. An effective spectral index is one that clearly distinguishes burned areas from other land cover types [8]. This distinction can be evaluated using statistical parameters such as the separability index (M). This index estimates the signal-to-noise ratio, where the signal is the absolute difference between class means (linked to intra-class variation) and the noise is the sum of standard deviations (linked to inter-class variation) [9,10,11].
Given their versatility and ease of deployment, UAVs have been widely adopted for monitoring wildfire-affected areas, as reported in several studies. The authors of [12] stated that UAVs can rapidly capture high-resolution images of fire sites, providing an objective perspective on forest health and damage levels. This method has significant application potential in forest regions with poor transportation infrastructure, complex mountainous environments, and high risks during fieldwork.
For instance, ref. [13] utilized UAV-derived imagery to assess wildfire damage in pine plantation areas, demonstrating that vegetation indices can not only identify burned regions but also quantify fire severity. The authors of [14] conducted a study in a native savanna region to assess vegetation after a fire event using vegetation indices. They concluded that this application is essential for better understanding vegetation dynamics in burned landscapes, highlighting the effectiveness of vegetation indices in mapping fire severity at local scales in arid savannas.
Therefore, this study assesses the feasibility of employing UAVs equipped with RGB sensors to generate high-resolution digital products for identifying and monitoring wildfire-affected areas in the Brazilian Cerrado.
2. Materials and Methods
2.1. Characterization of the Experimental Study Area
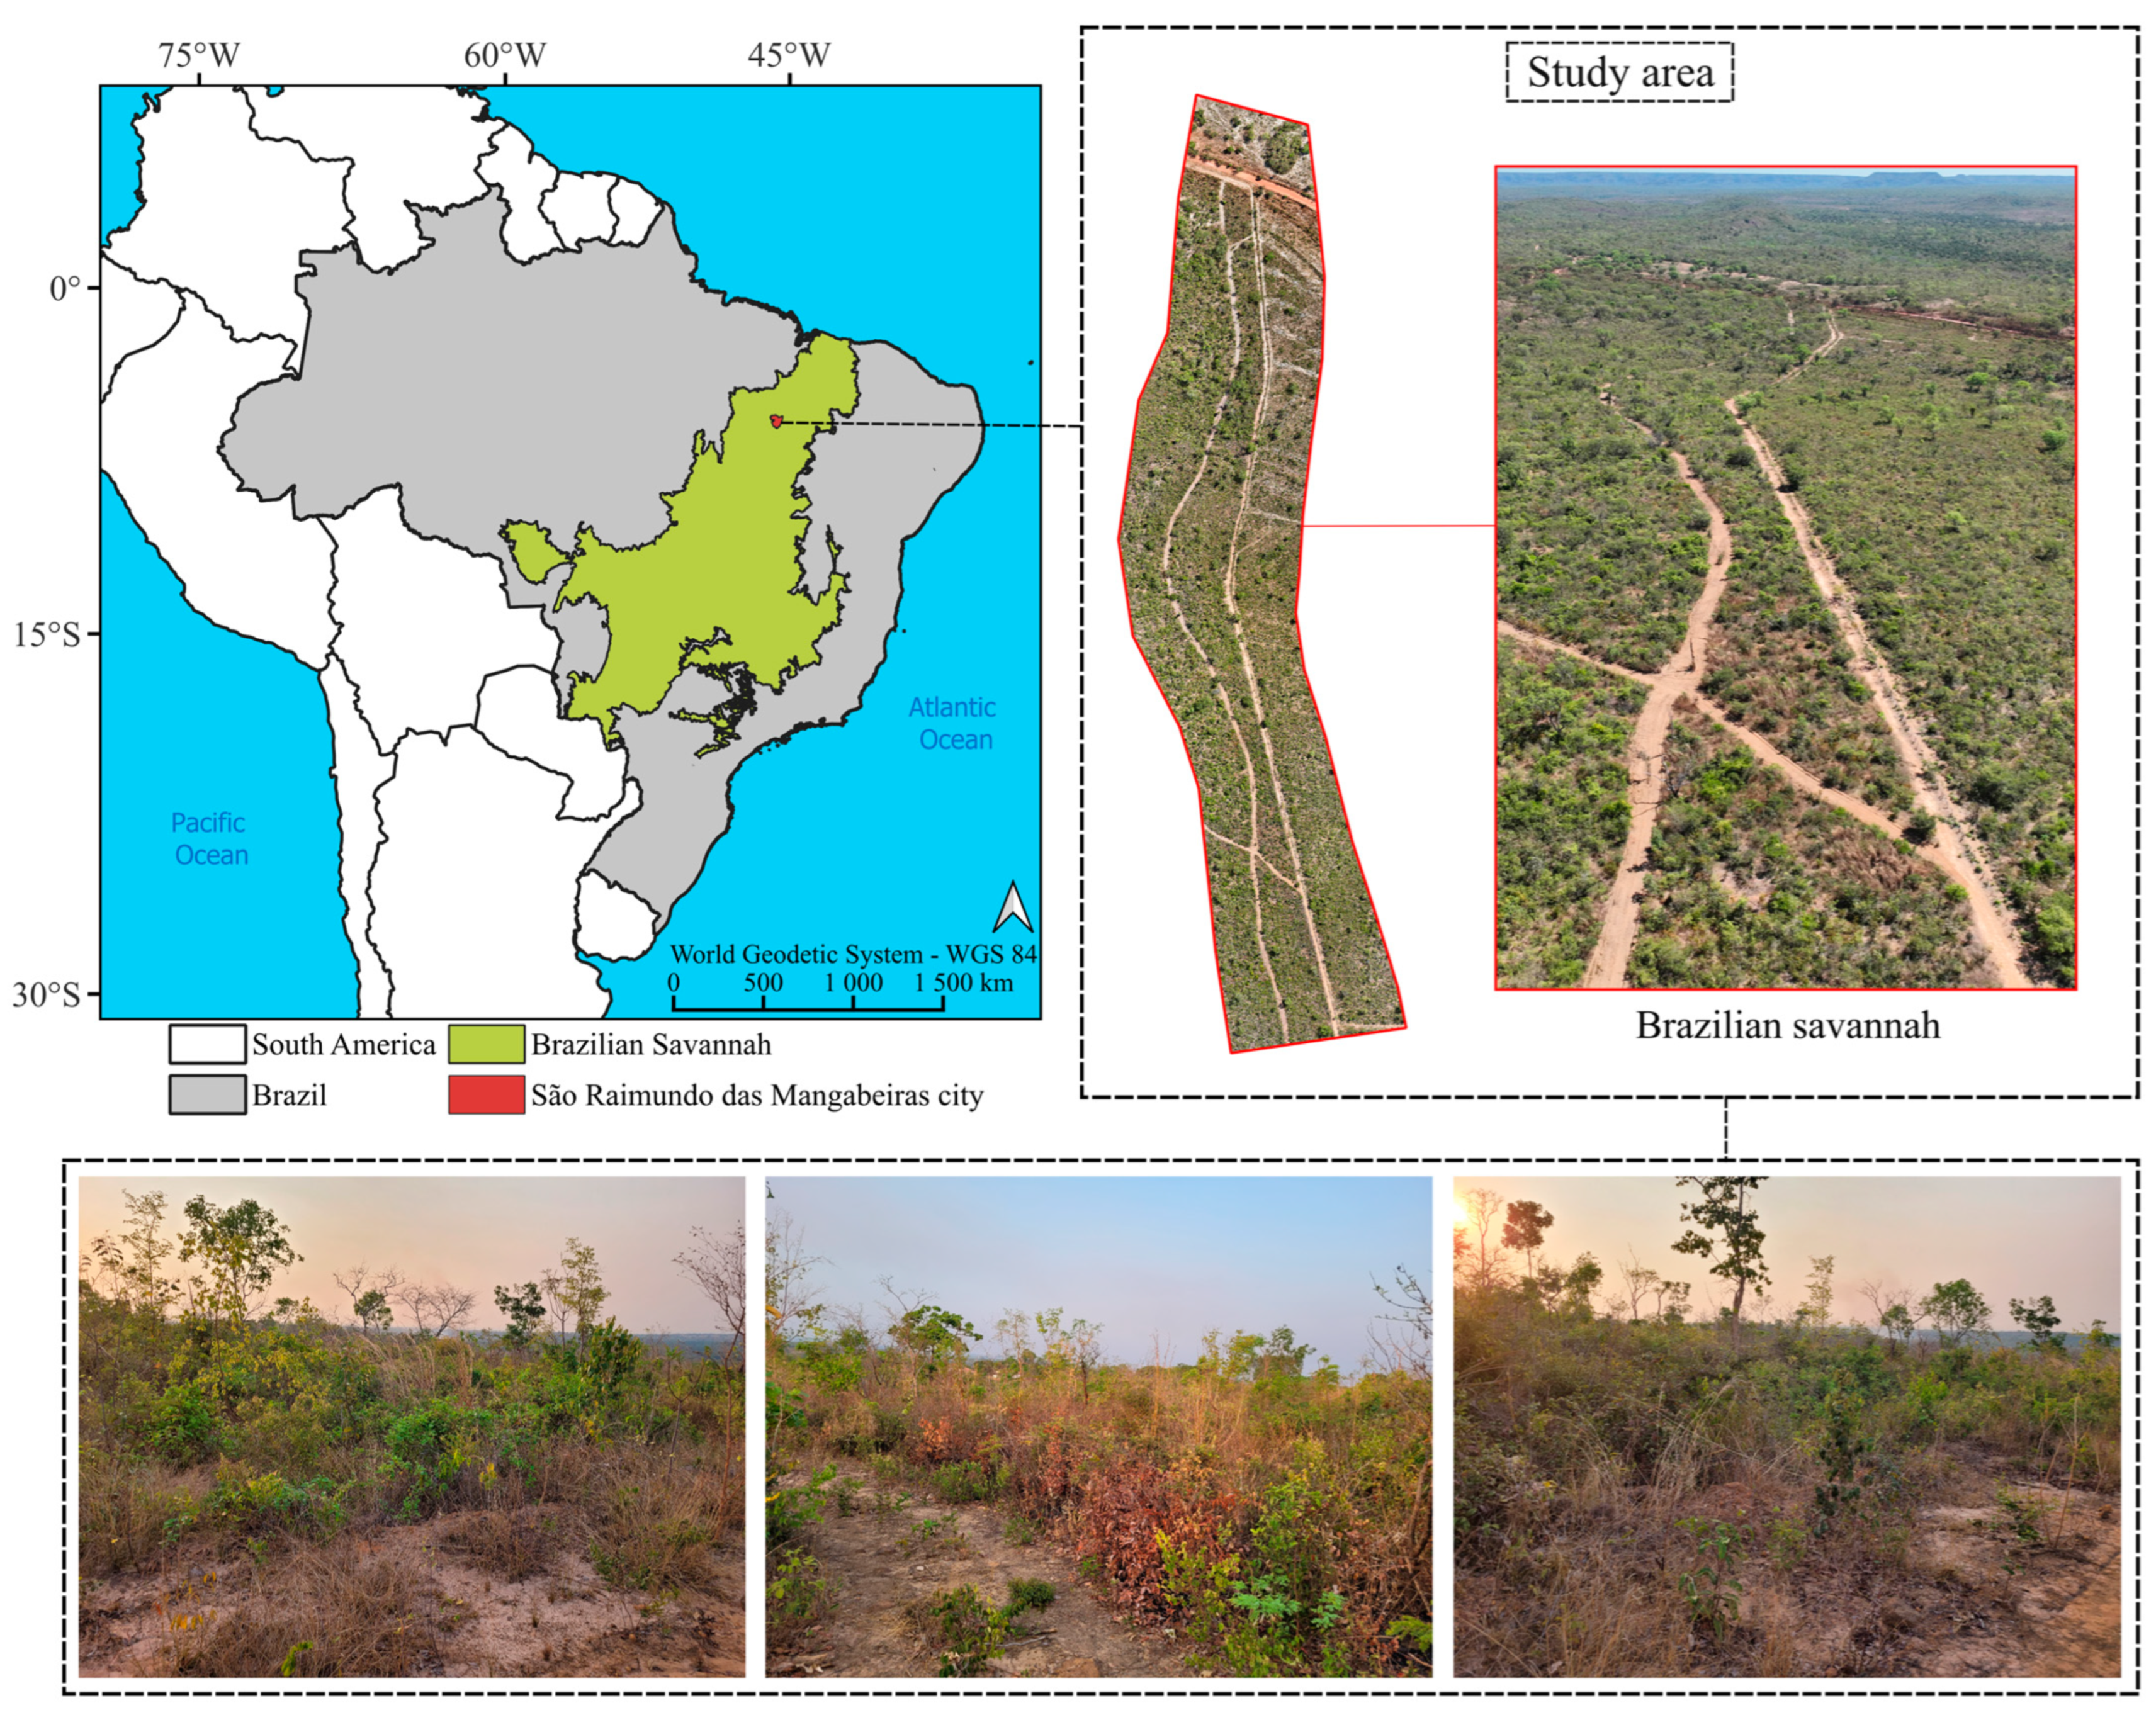
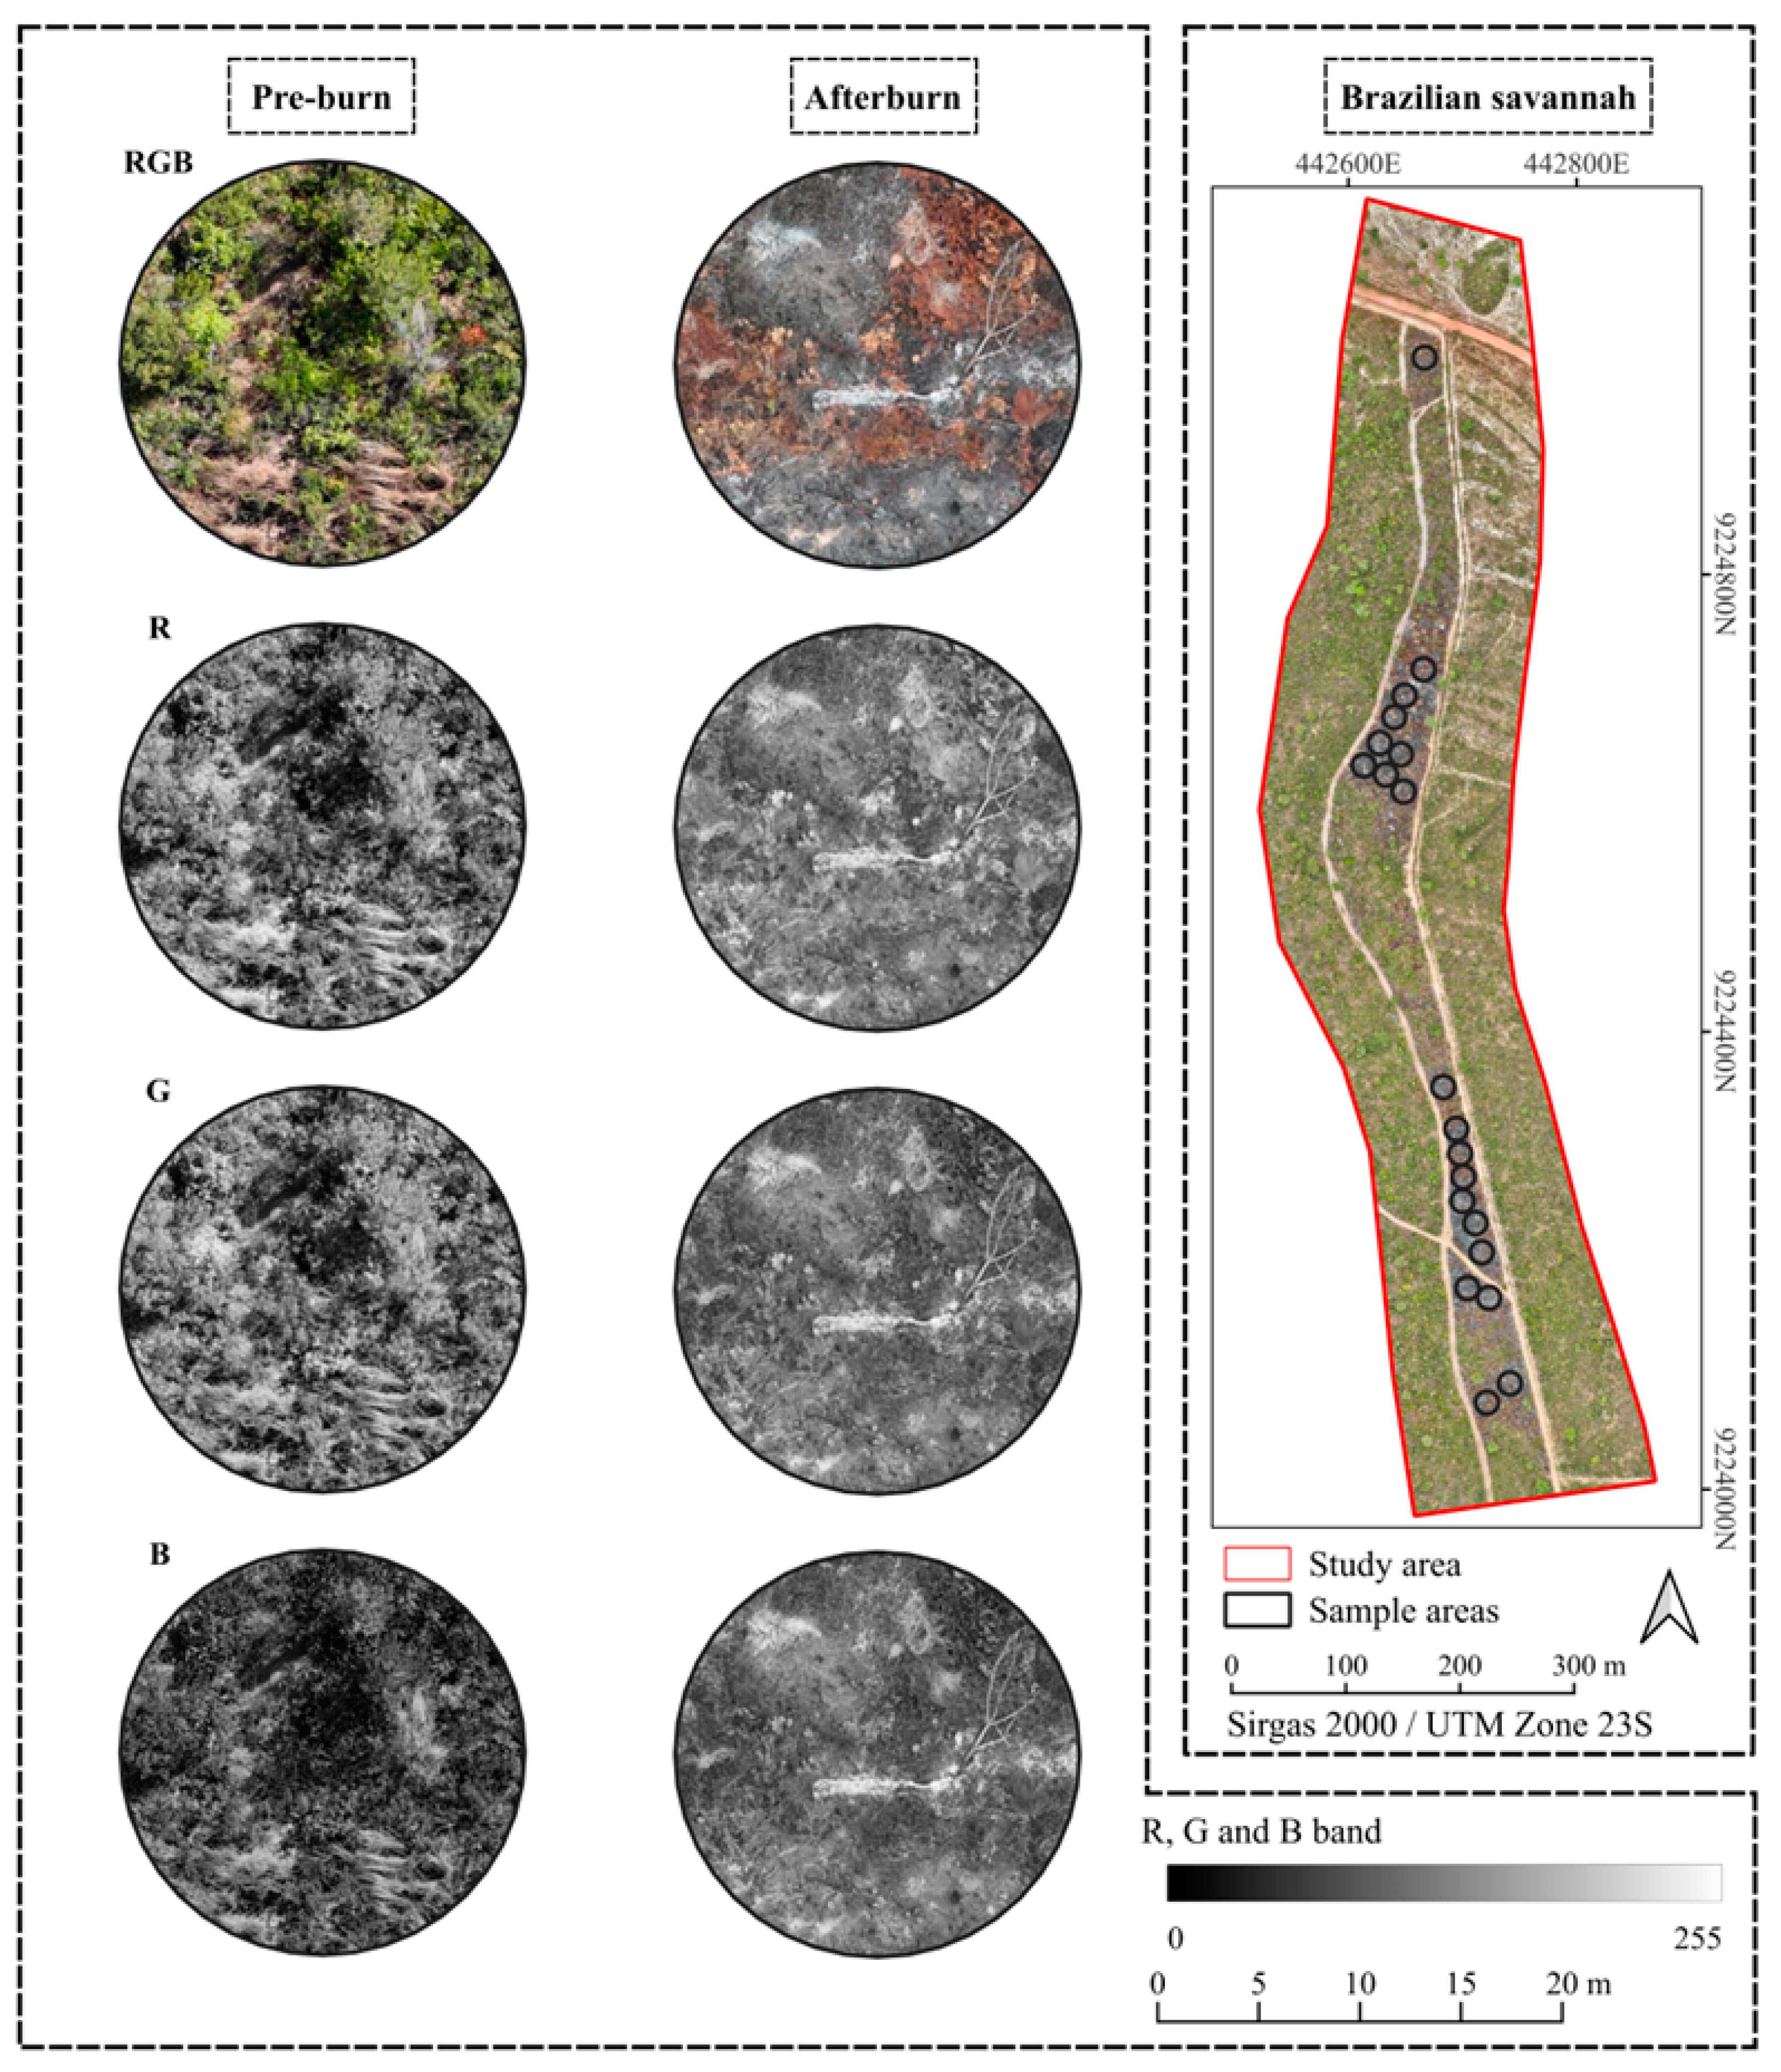
The study was conducted in the municipality of São Raimundo das Mangabeiras, located in the southern region of the state of Maranhão, northeastern Brazil (Figure 1). The study area is located at 45°31′06″ W and 07°00′54″ S, at an altitude of 236 meters above sea level. It belongs to the Cerrado biome, which is characterized by a savanna-like phytophysiognomy, featuring low, twisted trees with irregular branches, often displaying burn marks, with tree cover ranging from 20% to 50% and an average height of 3 to 6 meters. Shrubs and subshrubs are dispersed throughout the area, with some species possessing perennial underground structures that enable regrowth after fire or cutting. During the rainy season, the subshrub and herbaceous strata become lush due to rapid growth [15].

Figure 1.
Study area.
The region’s climate is classified as Aw, hot with a dry season in winter and a wet season in summer. The annual average temperature is approximately 26.4 °C, and the average annual precipitation is 1157 mm. The soils in the area are mixed, with sections classified as Ultisols and Oxisols [15].
The study area was selected based on the municipality’s history of wildfires and prior assessments of regions with potential burn occurrences in 2024. A vegetation corridor measuring 1000 meters in length and an average width of 60 meters was chosen (Figure 1). This corridor consisted of native Cerrado vegetation that had not been previously subjected to anthropogenic activities. Two aerial photogrammetric surveys were conducted in the area, one before and one after the fire event.
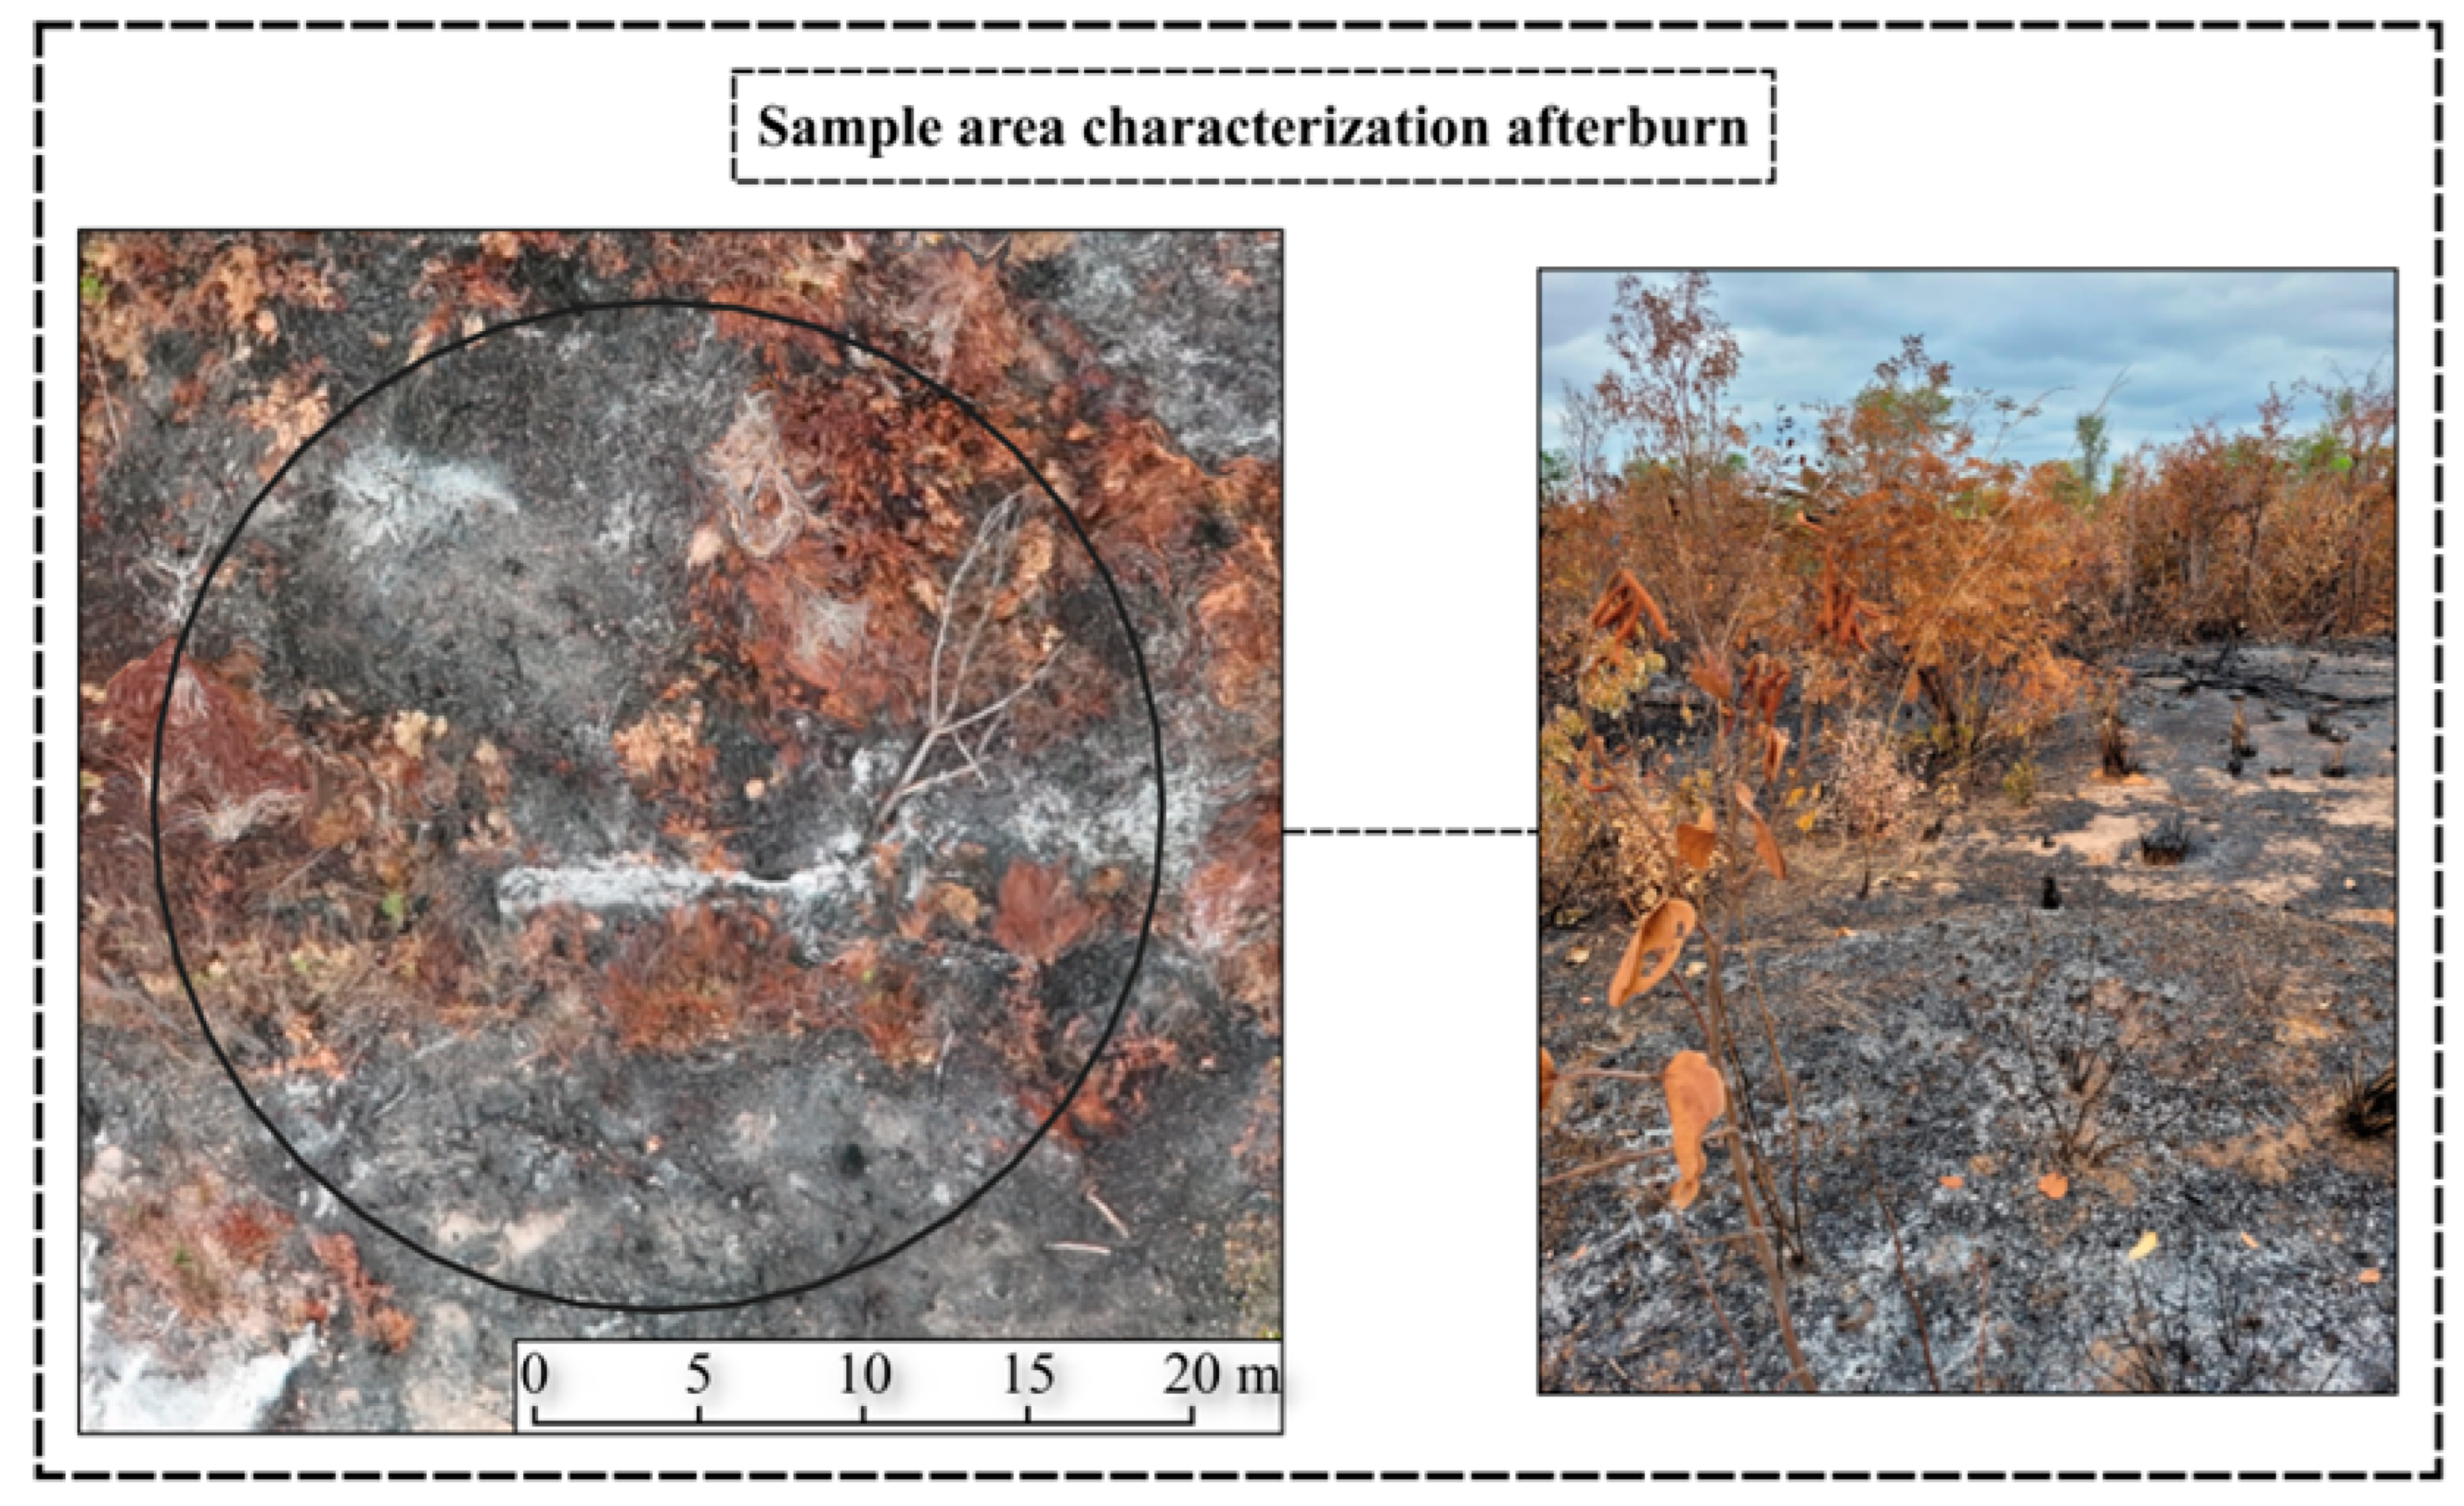
The time interval between the pre- and post-fire surveys was 22 days. After the fire, a ground inspection was carried out to verify in situ the locations where the vegetation was completely burned. Twenty circular plots with a diameter of 20 meters were previously marked for this purpose (Figure 2).
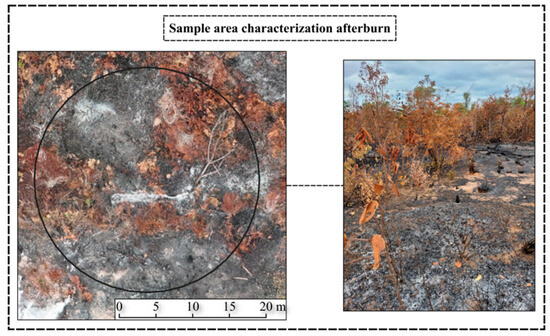
Figure 2.
Characterization of the sampling area after the fire: aerial view and ground view.
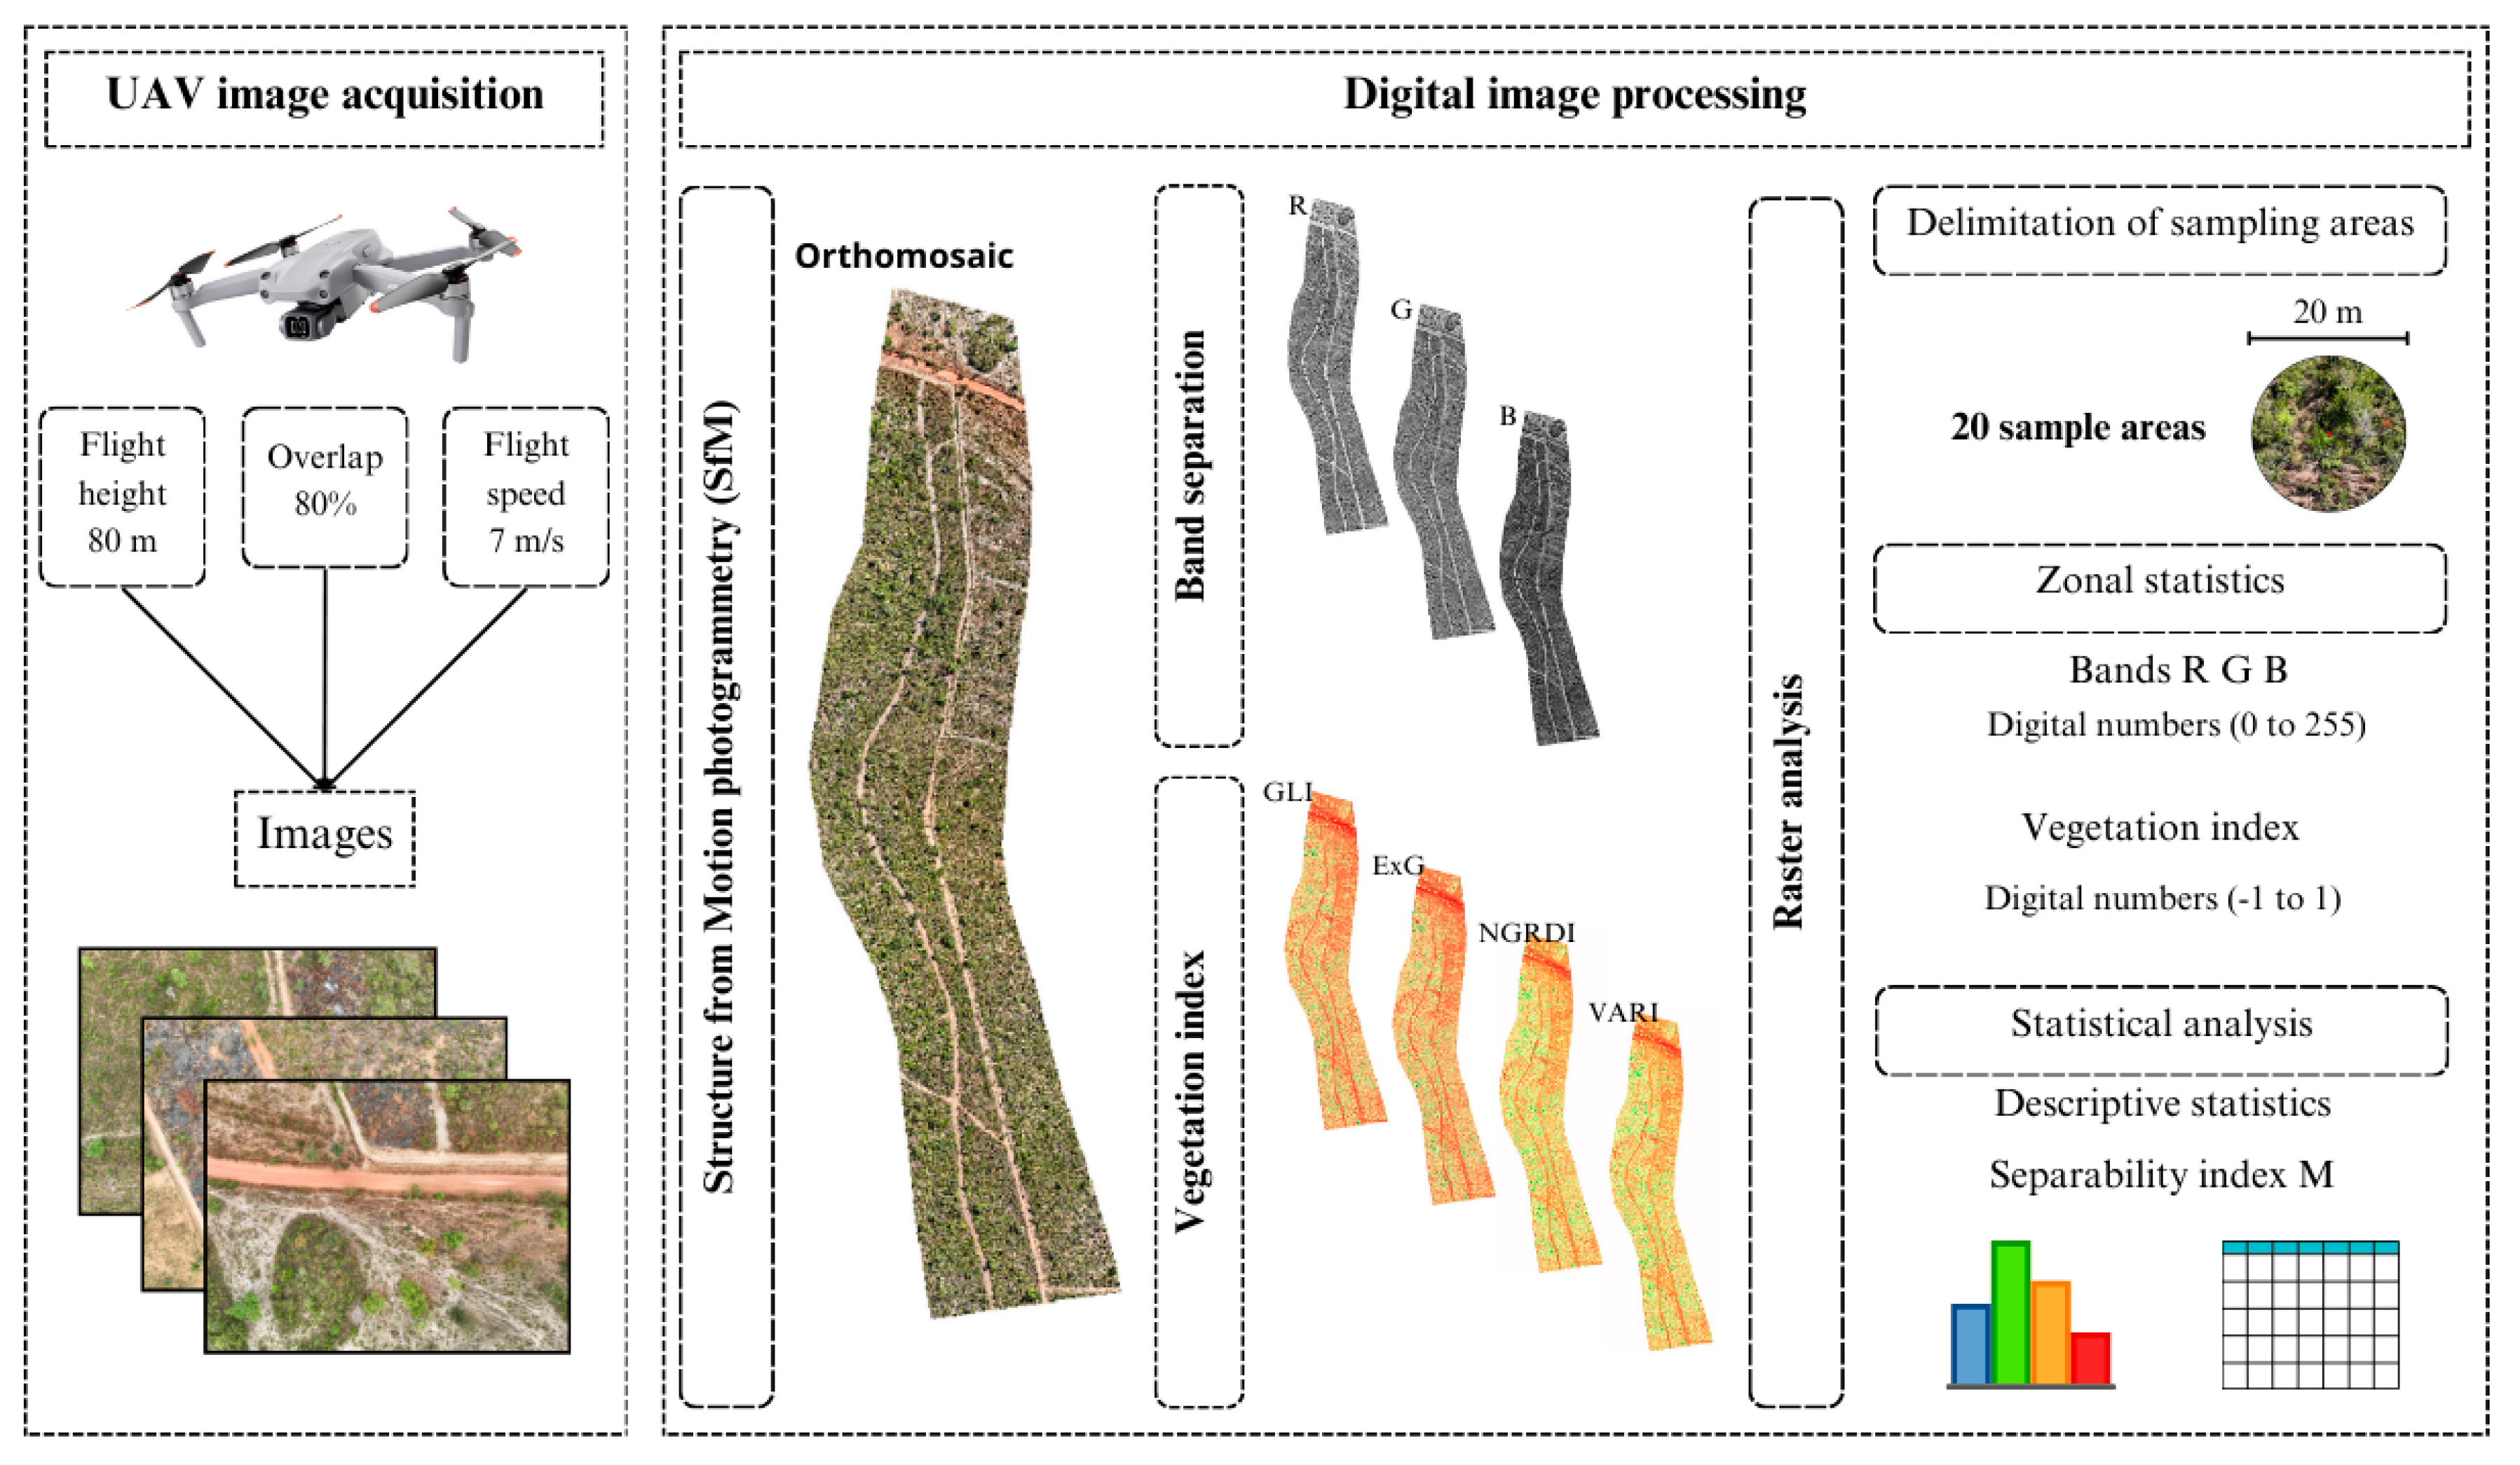
2.2. UAV Image Acquisition
Aerial photogrammetric surveys were performed using a DJI Mavic Air 2S UAV (Da-Jiang Innovations, Shenzhen, China) (Figure 2) over the study area. This multirotor UAV features a 1-inch RGB sensor with 20 effective megapixels and monochromatic filters for the following spectral bands: blue (450 nm ± 16 nm), green (560 nm ± 16 nm), and red (650 nm ± 16 nm) (Figure 3).

Figure 3.
Workflow of the study.
Flight planning was executed using Drone Harmony Mobile software (version 2.3.0), with operations conducted between 11:00 AM and 2:00 PM to minimize shading. The flight altitude was set at 80 meters, with a cruising speed of 7 m/s and a camera angle of 90° relative to the ground. Front and lateral overlap rates were set at 80%. Image acquisition settings were adjusted according to the weather conditions on the day of data collection. A total of 457 photos were captured during each aerial photogrammetric survey.
2.3. Digital Image Processing
Digital pre-processing was conducted using the Structure from Motion (SfM) technique in Agisoft Metashape 1.8. This method reconstructs three-dimensional structures from sequences of two-dimensional images captured by moving sensors [7]. At the end of this stage, the orthomosaics were exported for further analysis. Image processing was performed on a computer with the following hardware configuration: Intel Core i5-8265U (1.6 GHz, four cores, eight threads), 240 GB SSD, 1 TB HDD, NVIDIA GeForce RTX 3050 (4 GB), and 8 GB RAM.
With the orthomosaics from the pre- and post-fire surveys, the information processing and data analysis were performed using QGIS® open-source software (Prizren—3.34.10). Initially, a shapefile vector layer was created to delineate the twenty sample plots that were evaluated. To ensure uniform plot sizes, points were inserted in the areas of interest, and the buffer function was applied with a distance parameter of 10 meters.
Subsequently, the RGB spectral bands of the orthomosaics (pre- and post-fire) were separated using the raster calculator. Each band was processed into an independent orthomosaic for subsequent analysis.
The following RGB vegetation indices were selected for spectral vegetation assessment: Normalized Green Red Difference Index (NGRDI), Excess Green Index (ExG), Visible Atmospherically Resistant Index (VARI), and Ground Level Image Analysis (GLI). These indices, described in Table 1, were chosen because they use only data from the visible region of the electromagnetic spectrum and have shown significant potential for assessing areas with vegetation degradation, including fire-affected areas, due to their high correlation with leaf chlorophyll content [16,17].

Table 1.
Vegetation indices used in the assessment of burned areas in the Brazilian savanna (Cerrado).
Where G, R, and B represent the digital values, ranging from 0 to 255, corresponding to the intensities of the green, red, and blue bands, respectively. These values define the chromatic composition of the image or pixel, indicating the brightness or saturation level of each primary color in the combination that produces the final tone.
Using separate band layers, the Zonal Statistics function in QGIS was applied to calculate the mean digital values for the R, G, and B bands and the vegetation indices. This function computes statistical parameters for raster cell values within zones defined by a vector layer. In this study, the evaluated zones corresponded to the twenty sample plots. The resulting statistical values were exported to spreadsheets for further analysis.
2.4. Statistical Analysis
Descriptive statistics, including maximum, minimum, mean, and median values, were calculated from the average digital numbers of the R, G, and B bands and vegetation indices. The results were presented in boxplots.
To assess the ability of each spectral index to discriminate between burned and unburned surfaces, the separability index M (Equation (1)) was used [22].
where and are the mean values of the spectral band for the post- and pre-burned plots, respectively, and and are the corresponding standard deviations.
In the evaluation of index M, results greater than 1.0 are considered to indicate good separability. Thus, this test represents the overlap of the frequency histograms of the analyzed classes. Values of M greater than 1 indicate high separability between the classes, while values of M less than 1 indicate low separability [9,10,11].
The steps followed, from image acquisition and digital image processing to statistical analysis, are summarized in the flowchart in Figure 3.
3. Results
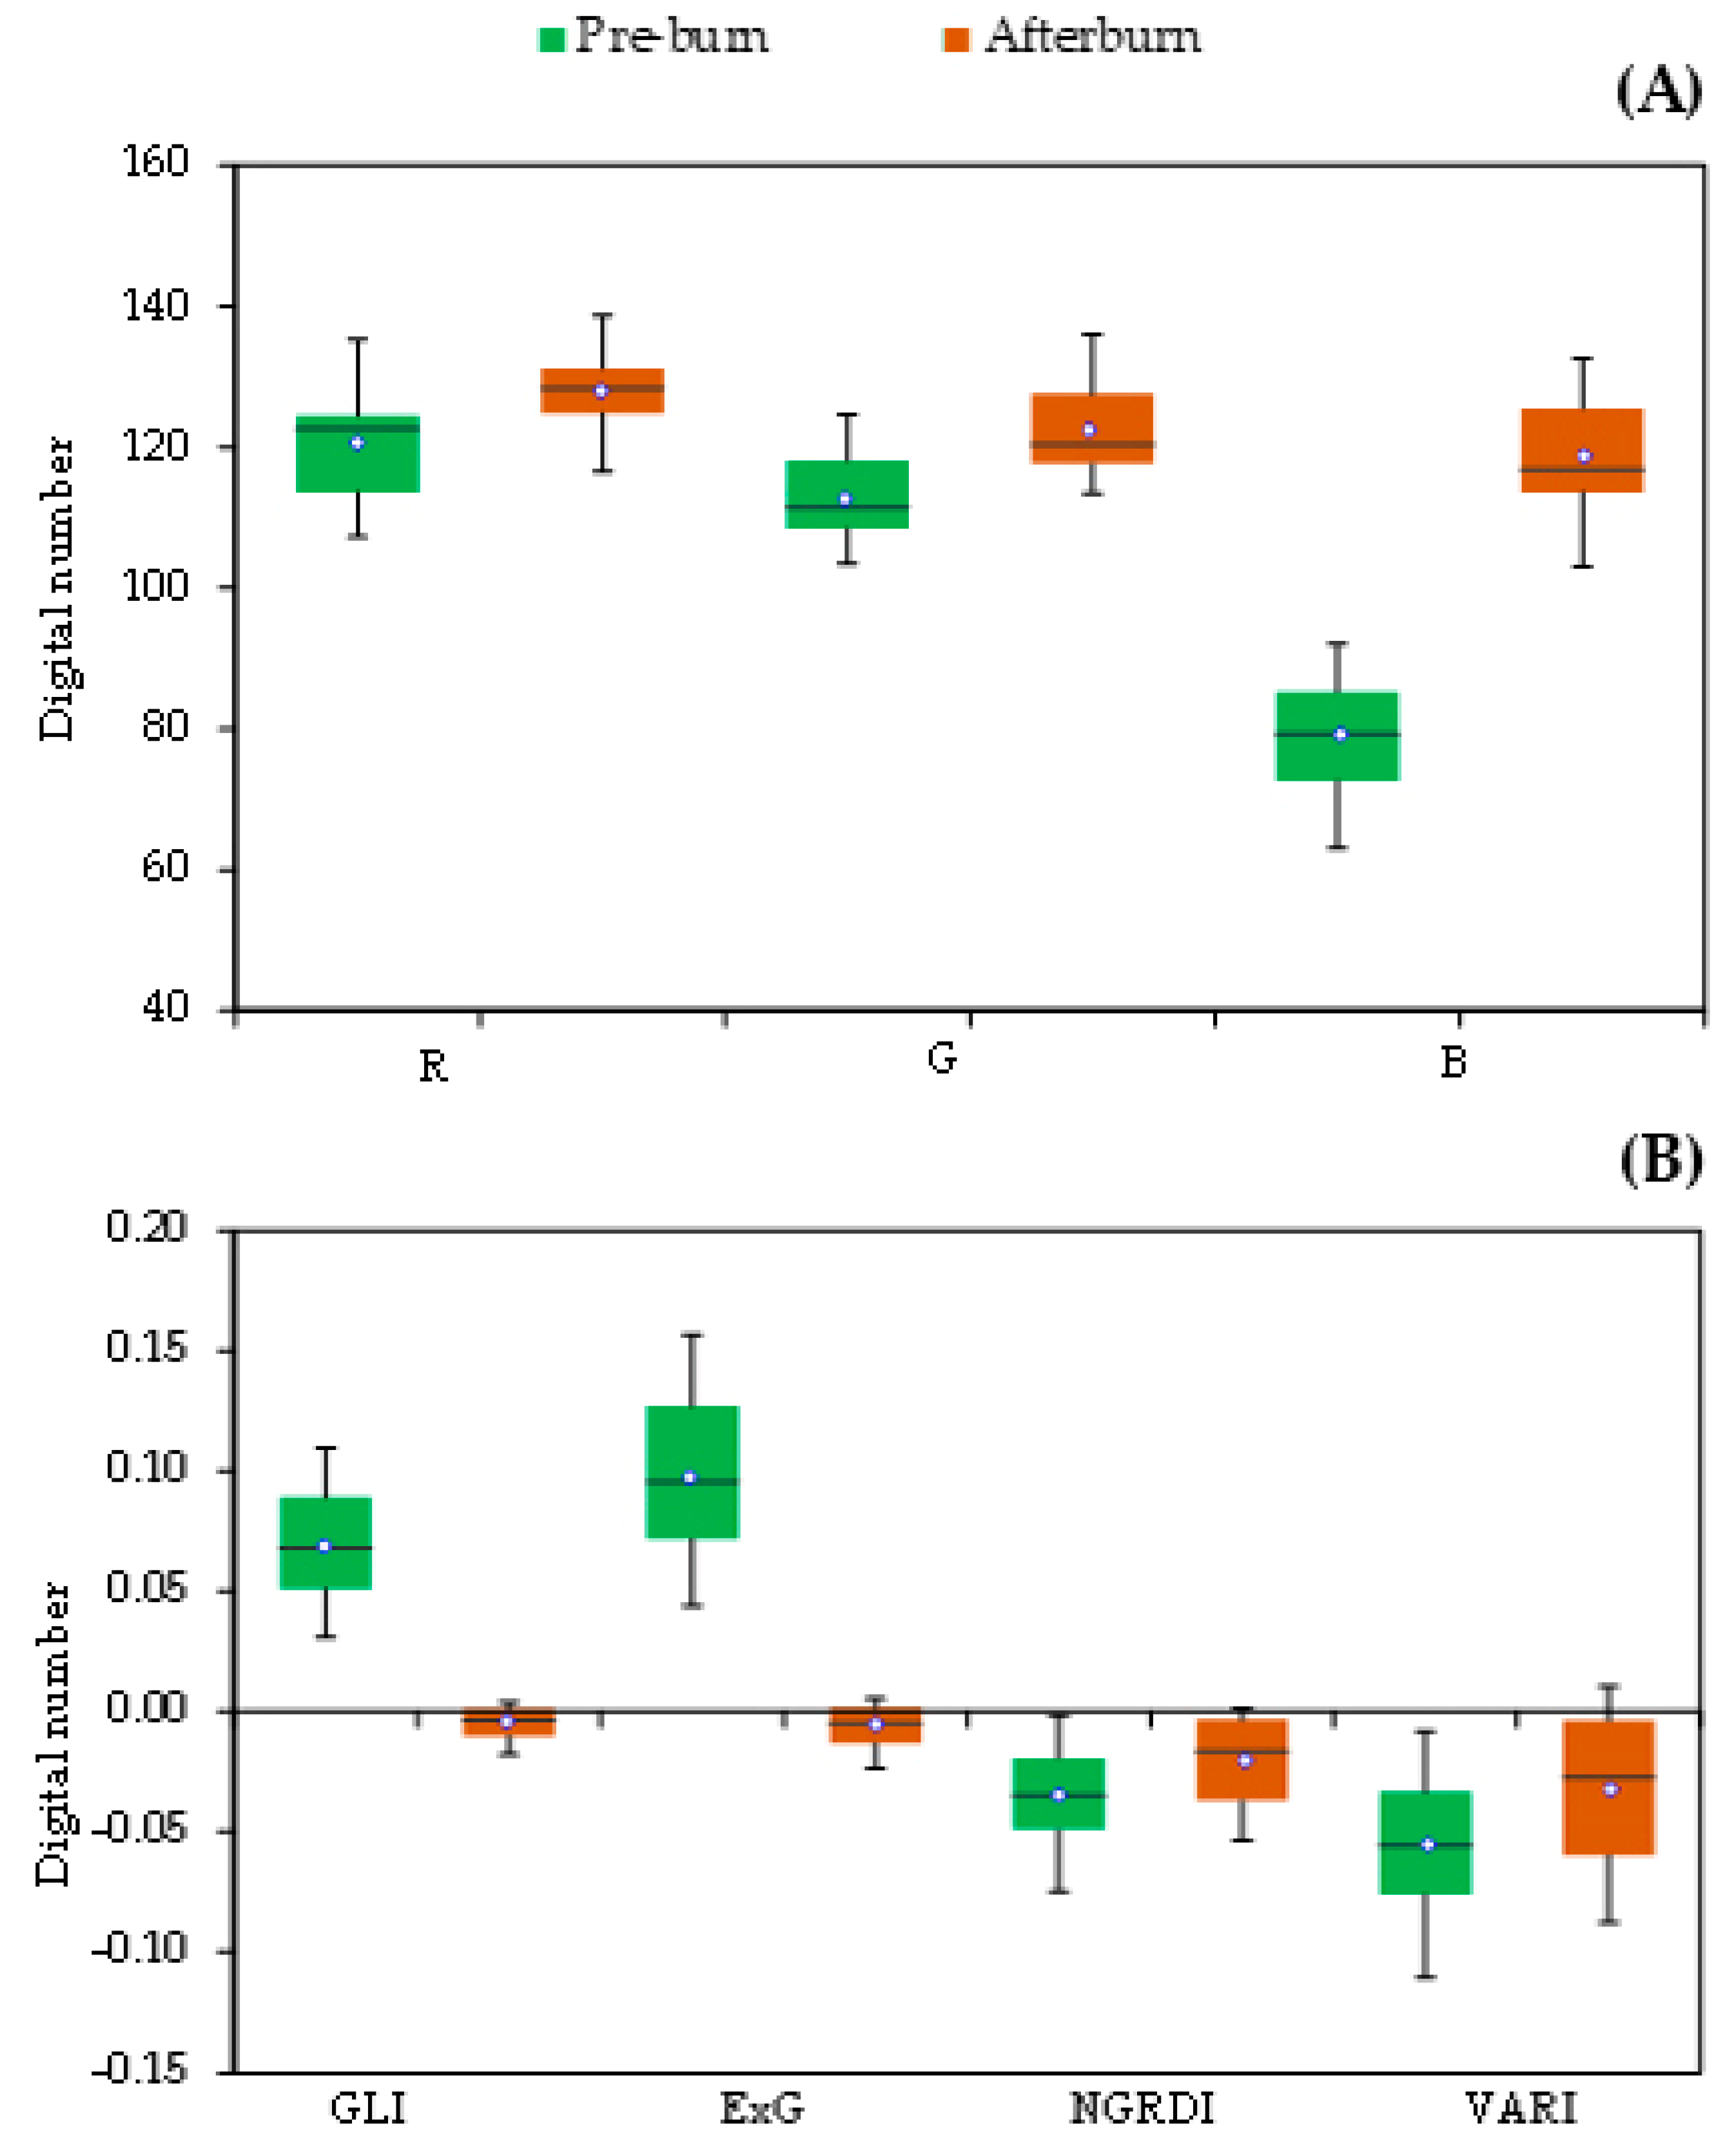
Figure 4 presents the boxplots showing the spectral behavior of the R, G, and B bands (A) and the evaluated vegetation indices (B) in burned Cerrado vegetation. The R, G, and B bands were represented in grayscale, with digital numbers ranging from 0 to 255, where 0 indicates the absence of color and 255 indicates the maximum intensity of the color.
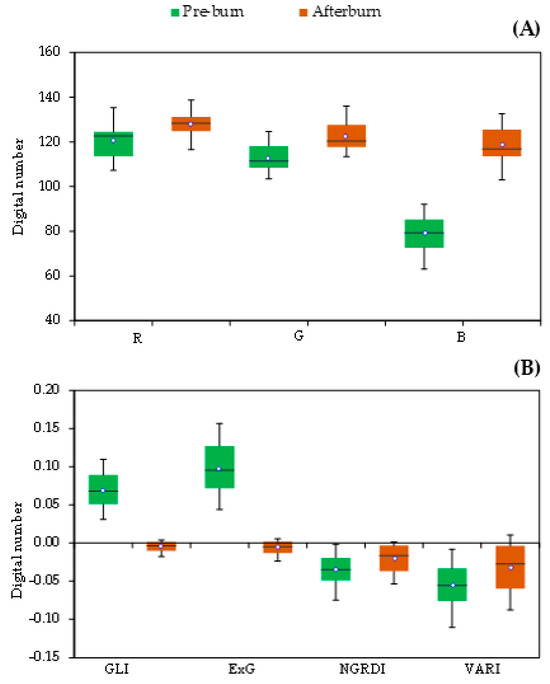
Figure 4.
Variation of the R, G, and B band values (A) and the GLI, ExG, NGRDI, and VARI indices (B) in Brazilian Cerrado areas before and after the fire event.
Upon analyzing the data, it is evident that all the bands (Figure 4A) showed higher digital values in the images obtained after the burning event. The R and G bands exhibited a slight overlap between the pre- and post-fire values. In contrast, the B band showed a significant differentiation between the pre- and post-fire digital values, with a notable increase in digital numbers after the fire event.
The vegetation indices GLI, ExG, NGRDI, and VARI have values ranging from −1 to 1, where values close to or below zero indicate the absence of vegetation. These indices were selected for evaluation in this study due to their high contrast between exposed soil and vegetation. The GLI and ExG vegetation indices showed a significant reduction in their digital values in the images obtained after the fire event. On the other hand, the NGRDI and VARI indices showed slightly higher values after the fire event, with a large overlap in the boxplots.
Figure 5 presents a visual detail of the RGB image and the separate bands in one of the plots evaluated before and after the fire event. Upon visual inspection, it is evident that the highlighted plot had dense, predominantly green vegetation before the fire, which was completely burned. When evaluating the highlights of the R, G, and B bands (represented in grayscale from 0 to 255), it can be observed that the post-fire images appear in lighter shades of gray, corroborating the data presented in Figure 4.

Figure 5.
Image mosaic showing the visualization of a plot from the study area in RGB format, with the R, G, and B bands separated, before and after the fire event.
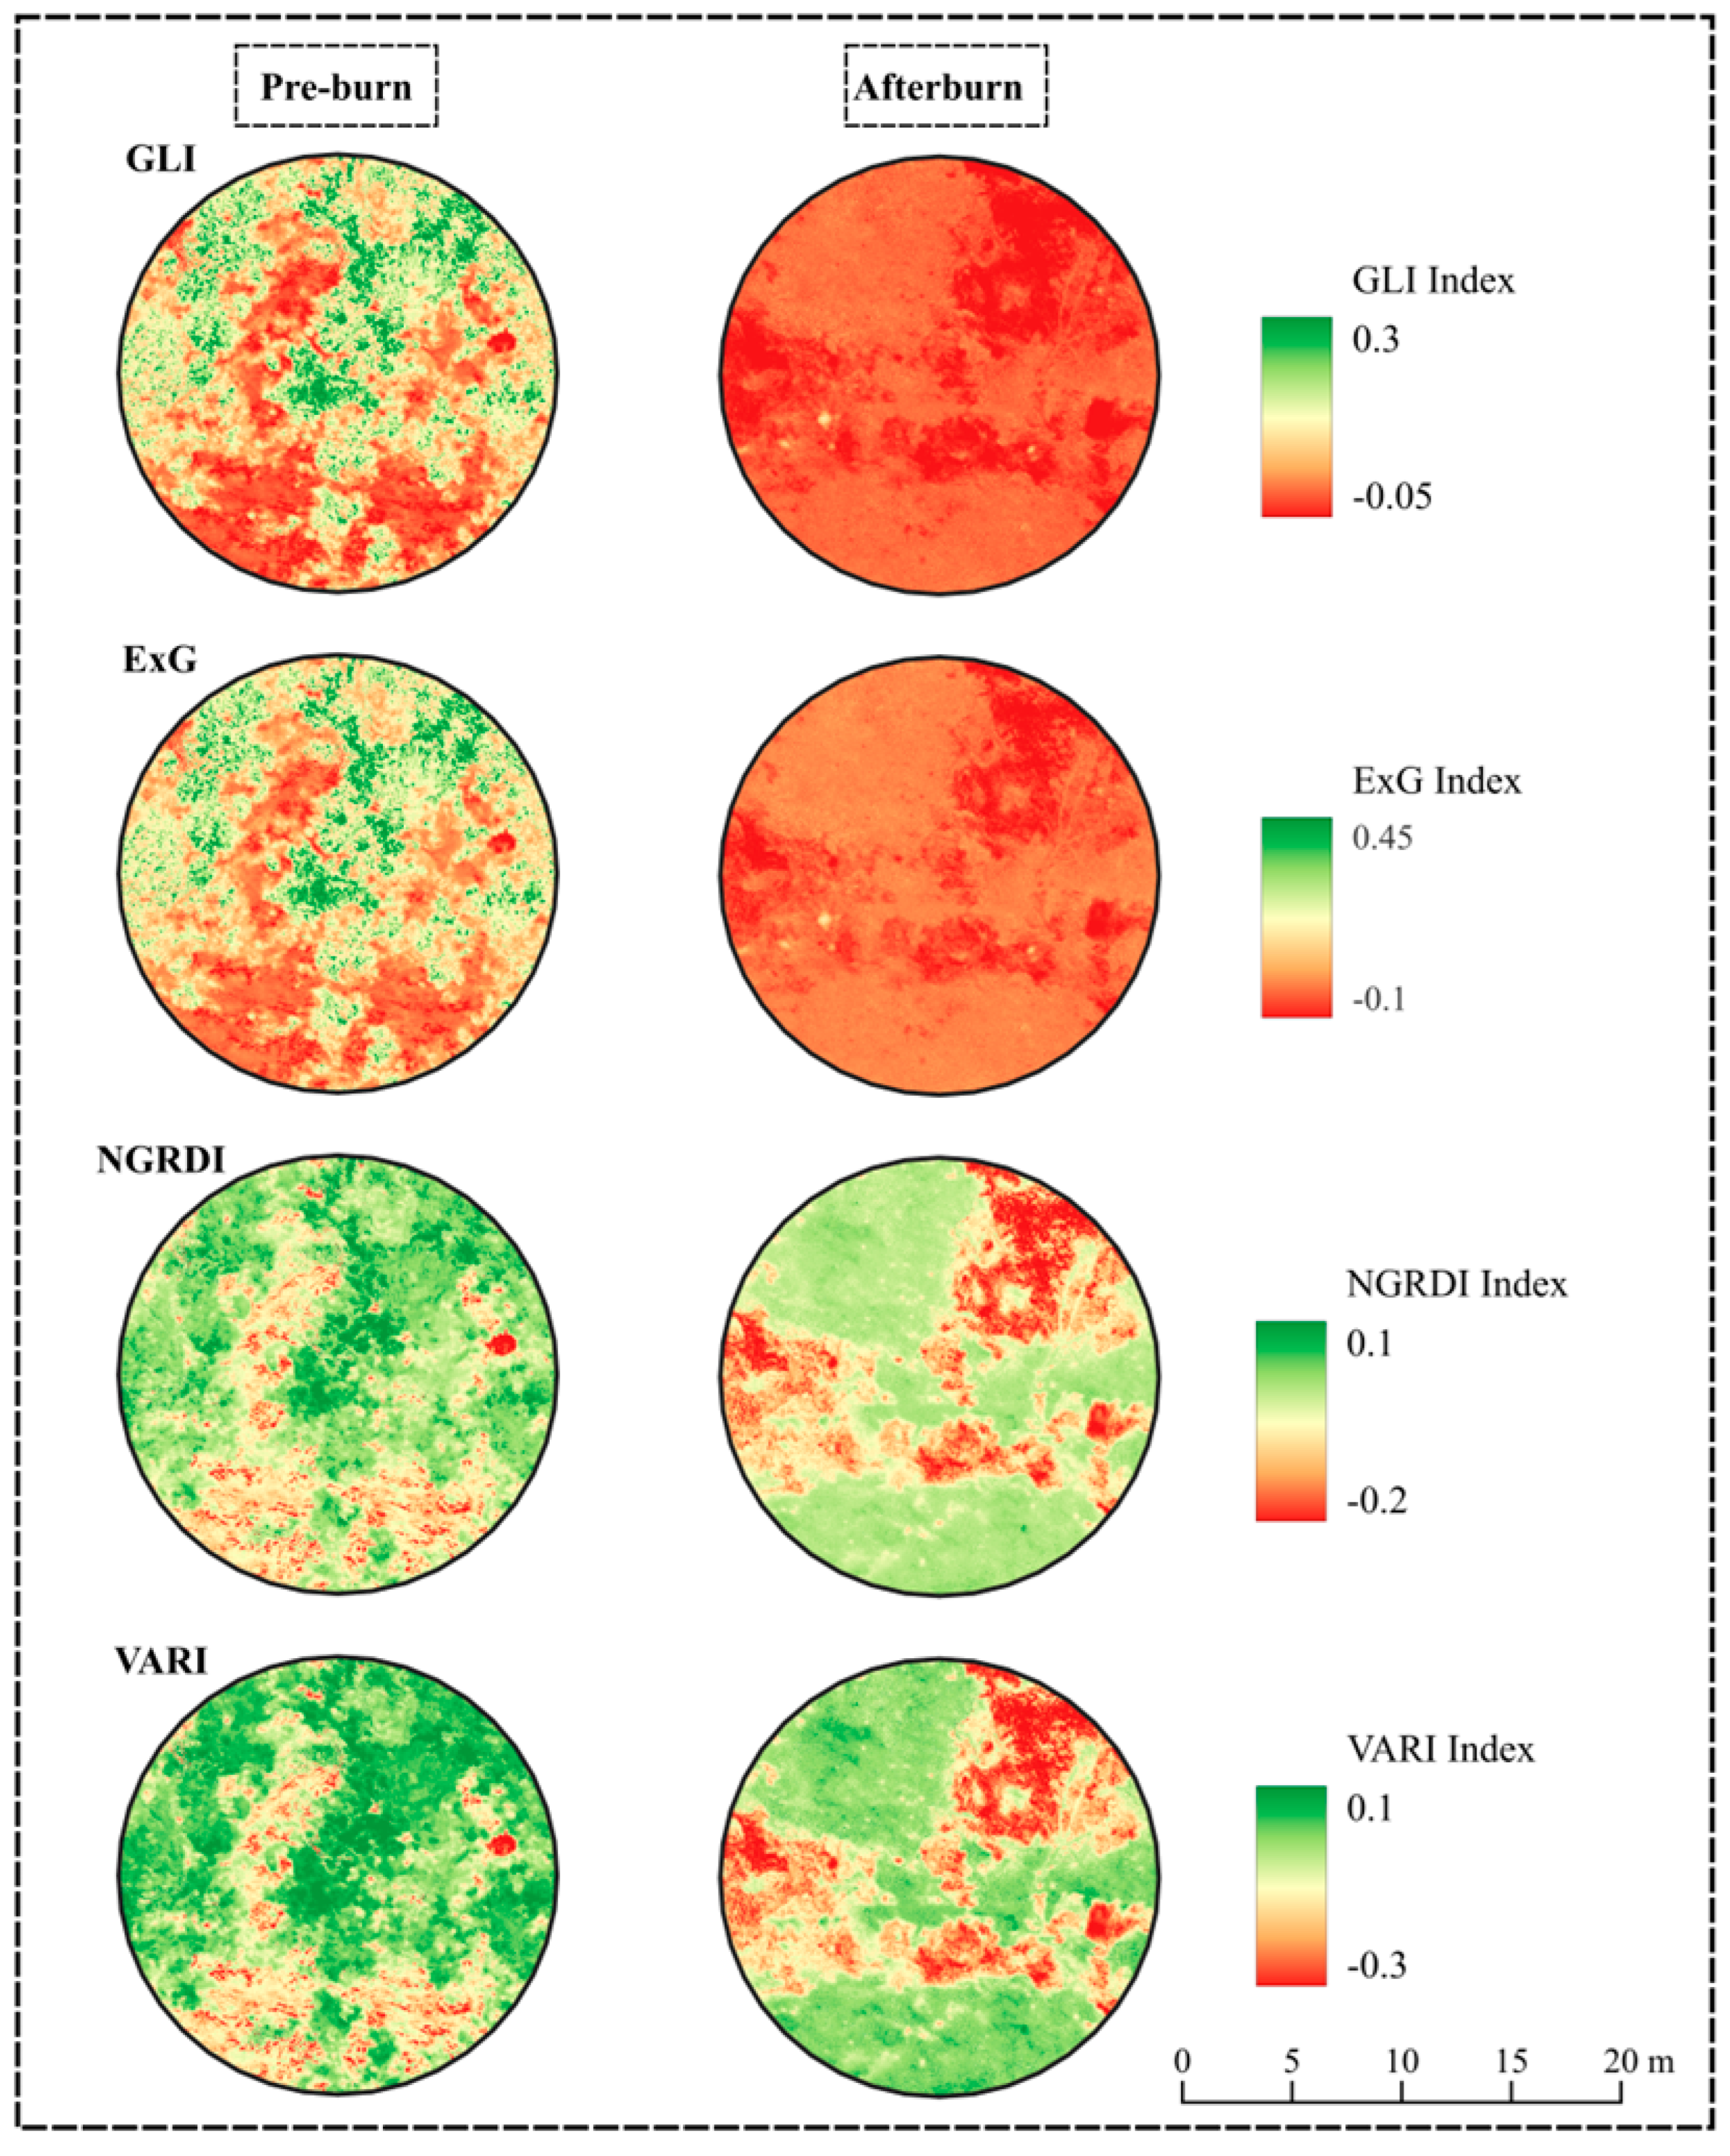
The vegetation index maps are presented in Figure 6, represented by false color, with a linear gradient divided into three basic colors: red, yellow, and green. Green represents the presence of vegetation, yellow represents intermediate values, and red represents the absence of vegetation or vegetation without green pigmentation. It can be observed that the GLI and ExG indices provided a good contrast in identifying vegetation through green coloration, effectively highlighting even areas with non-green vegetation within the plot before the fire event. In contrast, the NGRDI and VARI indices showed lower contrast between green and non-green vegetation. For these indices, yellow coloration effectively represented areas with vegetation lacking green pigmentation (compare the pre-fire sections with the RGB image in Figure 4).

Figure 6.
Image mosaic showing the visualization of a plot from the study area with the vegetation indices GLI, ExG, NGRDI, and VARI before and after the fire event.
When used to assess vegetation before and after the fire, it is evident that for the GLI and ExG indices, the highlighted plot shows red/orange coloration, with no presence of green/yellow tones (Figure 6), indicating that all vegetation in the evaluated areas was burned after the fire event (see post-fire RGB in Figure 5). This result clearly demonstrates the potential of these indices in identifying burned areas in vegetated regions. On the other hand, the NGRDI and VARI indices showed no significant differences before and after the fire, as they presented index values similar to those of areas with green vegetation, even though the area was completely burned and covered with ashes (see RGB in Figure 4).
The overlaps of the boxplots presented in Figure 4 can be quantified by the Separability Index (M), which measures the overlap of the frequency histogram values of the object of interest with different targets. In the evaluation of the M index, results greater than 1.0 are considered to indicate good separability. Table 2 contains the M index values for the spectral bands R, G, and B, as well as for the GLI, ExG, NGRDI, and VARI indices of the Cerrado plots evaluated before and after the fire. The spectral separability of the burned areas is influenced by the surface conditions, which result from the complex interactions between the fire dynamics and the characteristics and conditions of the vegetation that existed in each plot prior to the fire event.
Table 2.
M separability index of the spectral bands R, G, B and the vegetation indices GLI, ExG, NGRDI, and VARI in Cerrado areas before and after the fire event.
It can be observed that the R and G bands, as well as the NGRDI and VARI indices, showed low M index values, indicating the presence of overlap in the digital values of these bands before and after the fire. This result suggests that these bands do not effectively represent burned areas in the Cerrado biome. In contrast, the B band and the GLI and ExG indices showed high M index values, corroborating the data presented in Figure 4, Figure 5 and Figure 6, which demonstrate no overlap of values in the images assessed before and after the fire, highlighting their effectiveness for environmental evaluation purposes.
4. Discussion
Observing changes in ecology and vegetation structure after wildfires is crucial for gaining a deeper understanding of how forests respond to wildfire events and their long-term impacts on the ecosystem. An accurate assessment of fire-affected areas is essential for effective planning, management, and post-fire rehabilitation efforts. In this context, high-resolution UAV-based imagery has been used by several authors [23] for detecting burned areas.
The results obtained from this study highlight the potential of RGB images captured by UAVs for monitoring Cerrado areas affected by wildfires. These results align with previous studies [24,25], confirming the applicability of the methodology proposed in this study. In addition to identifying burned areas, it is also possible to determine the fire’s severity, as seen in the work of [25,26].
In accordance with the methodology proposed here, the use of the separability index M has been employed by various authors in studies aimed at identifying vegetation areas affected by wildfires [8,27,28,29]. [29] reported that a separability analysis of spectral indices and individual bands provides significant insights into which products are suitable for burned area mapping, as identical values may mislead automated classifiers, leading to mapping errors.
Separability analysis in digital images is a statistical method used to assess the ability to distinguish between different classes in spectral data. This metric quantifies the degree of separation between the value distributions of a spectral index or specific bands and is widely applied in burned area detection, land use and land cover classification, and image segmentation [8,9,29]. Higher M values indicate a greater distinction between burned and unburned areas, suggesting better discriminative capability of the analyzed band or spectral index [8]. Thus, the application of the separability index M, as in this study, is essential for selecting appropriate spectral variables, contributing to improved accuracy in burned area mapping.
However, it is important to note that the quality of the data may vary depending on the characteristics of the vegetation being monitored, so it is advisable to conduct specific studies across different vegetation biomes. Another consideration is the processing power required to work with these images. The high spatial resolution of the generated orthomosaics, combined with assessments of extensive areas, results in long processing times [30].
The Cerrado canopy consists of various plant species, each exhibiting different spectral behaviors when impacted by fire. The spectral behavior of ashes in fire-impacted vegetation areas can be related to fire intensity and the type of available fuels [31,32,33,34]. White ashes indicate high combustion severity, characterized by a strong spectral signature across the electromagnetic spectrum, while black ashes indicate low combustion severity, with correspondingly lower spectral values [33,34]. Regarding fuel material, [32] found a significant correlation between the color and the amount of total organic carbon in the ashes, with darker ashes showing higher organic carbon content.
Upon reviewing the images in Figure 5, it is evident that lighter tones are observed after the fire event. These results are corroborated by the data presented in Figure 4, showing an increase in the digital numbers of the RGB bands, indicating that the study area was affected by a high-severity fire and that the fuel material contained low levels of organic carbon [32,33,34].
The analysis of the dataset obtained in this study reveals that the R and G bands show a slight overlap between pre- and post-fire values. These results suggest that using these bands in image classification tasks to identify burned areas could reduce the accuracy of burned area detection models. Supporting these results, [24], in their work evaluating the use of multispectral bands for identifying and classifying burned areas in Sierra de Uría (Asturias, Spain), found low separability in these bands for distinguishing burned from non-burned areas. However, the red band yielded good results when used to classify fire severity levels.
Vegetation indices in the visible spectrum provide an alternative solution for addressing the low separability issue of spectral bands in burned area detection. These indices have a high capacity for identifying green coloration in images, which is essential for detecting live vegetation. Studies such as those by [26,33] and [25] demonstrate the positive potential of vegetation indices for both identifying areas and classifying fire severity levels across different types of vegetation.
However, it is important to note that while they exhibit similar behaviors in vegetation monitoring, not all indices are effective for identifying burned areas. The data obtained in this study revealed that the VARI and NGRDI indices do not show high values of M separability values. These results corroborate the study of [35], who used these indices in vegetation identification models for pine forests recovering from a wildfire event and found that models using these indices were outperformed by models using the ExG and GCC indices.
The results obtained with the application of the ExG and GLI indices were satisfactory, showing great potential for burned area identification, with high contrast between pre- and post-fire areas, as well as high separability index values. These results align with the works of [25,26,33,35,36,37], indicating that the ExG and GLI vegetation indices can be effectively used to identify, classify, and model burned areas in the Cerrado biome.
5. Conclusions
The Brazilian Cerrado is one of the biomes most affected by degradation due to wildfires in recent years. Identifying data obtained by UAVs with RGB sensors, which can be used in environmental monitoring in this biome, is crucial for conserving local biodiversity.
Based on the results presented, it can be concluded that the spectral bands and vegetation indices exhibit varying capabilities in discriminating Cerrado areas before and after wildfire events. The R and G bands, as well as the NGRDI and VARI indices, showed low effectiveness in distinguishing burned areas, as evidenced by high digital value overlap and low separability indices (M). On the other hand, the B band and the GLI and ExG indices stood out as more effective tools, presenting high contrast and separability, with M values greater than 1.0, demonstrating their utility in identifying fire-affected areas.
The GLI and ExG indices, in addition to being more sensitive to changes in vegetation, showed a greater capacity to represent the absence of green vegetation after the fire. Meanwhile, the NGRDI and VARI indices displayed lower contrast between green and non-green vegetation, making it more challenging to distinguish burned areas.
The data confirm that the B band, along with the GLI and ExG indices, are better suited for environmental impact analysis in Cerrado areas affected by wildfires, providing a solid foundation for future research aimed at classifying and quantifying burned areas, as well as monitoring and managing the environment in fire-disturbed scenarios in the Brazilian Cerrado.
Author Contributions
Conceptualization, M.J.M.G. and M.G.d.C.; data curation, M.J.M.G., D.P.R., G.C.C. and A.S.d.S.; formal analysis, M.J.M.G., J.R.A.B., I.L. and C.V.O.A.; funding acquisition, M.J.M.G.; investigation, M.J.M.G., M.G.d.C. and A.S.d.S.; methodology, M.J.M.G., I.D.d.R., J.R.A.B., M.G.d.C. and D.P.R.; project administration, M.J.M.G.; resources, M.J.M.G. and I.D.d.R.; software, I.D.d.R. and A.S.d.S.; supervision, M.J.M.G.; validation, M.J.M.G., I.L. and A.S.d.S.; visualization, M.J.M.G., D.P.R. and C.V.O.A.; writing—original draft, M.J.M.G., J.R.A.B., I.L., D.P.R., G.C.C. and C.V.O.A.; writing—review and editing, J.R.A.B., I.L., D.P.R., G.C.C. and C.V.O.A. All authors have read and agreed to the published version of the manuscript.
Funding
This research received no external funding.
Institutional Review Board Statement
Not applicable.
Informed Consent Statement
Not applicable.
Data Availability Statement
All data used within this research are publicly available and cited accordingly.
Acknowledgments
The Federal Institute of Education, Science and Technology Baiano, Santa Inês Campus and the Federal Institute of Education, Science and Technology of Maranhão, São Raimundo das Mangabeiras Campus, for the institutional support.
Conflicts of Interest
The authors declare no conflicts of interest.
References
- MAPBIOMAS MAPBIOMAS Coleção 8. Available online: https://brasil.mapbiomas.org/ (accessed on 15 April 2024).
- Medeiros, J.d.D. GUIA DE CAMPO: Vegetação Do Cerrado 500 Espécies; Ministério do Meio Ambiente: Brasília, Brazil, 2011. [Google Scholar]
- Queiroz, R.F.P.; d’Oliveira, M.V.N.; Rezende, A.V.; de Alencar, P.A.L. Estimation of Aboveground Biomass Stock in Tropical Savannas Using Photogrammetric Imaging. Drones 2023, 7, 493. [Google Scholar] [CrossRef]
- dos Santos, C.V.B.; de Moura, M.S.B.; Galvíncio, J.D.; Carvalho, H.F.d.S.; Miranda, R.d.Q.; Montenegro, S.M.G.L. Comparação de Imagens Multiespectrais Utilizando Satélites e VANT Para a Análise de Mudanças Estruturais Em Área de Floresta Seca. Rev. Bras. De Geogr. Física 2021, 14, 2510–2522. [Google Scholar] [CrossRef]
- dos Santos, C.V.B.; de Moura, M.S.B.; Carvalho, H.F.d.S.; Galvíncio, J.D.; Miranda, R.d.Q.; Nishiwaki, A.A.M.; Montenegro, S.M.G.L. Avaliação Do Índice de Área Foliar e Índice de Área Da Planta Em Floresta Seca Utilizando Modelos Simplificados Em Imagens de Alta Resolução Com o Uso de VANT. J. Hyperspectral Remote Sens. 2022, 12, 109–123. [Google Scholar] [CrossRef]
- ANAC. Orientações Para Usuários de Drones; ANAC: Assessoria de Comunicação Social—ASCOM: Brasília, Brazil, 2017. [Google Scholar]
- Jiang, S.; Jiang, C.; Jiang, W. Efficient Structure from Motion for Large-Scale UAV Images: A Review and a Comparison of SfM Tools. ISPRS J. Photogramm. Remote Sens. 2020, 167, 230–251. [Google Scholar] [CrossRef]
- Pacheco, A.d.P.; da Silva Junior, J.A.; Ruiz-Armenteros, A.M.; Henriques, R.F.F.; de Oliveira Santos, I. Analysis of Spectral Separability for Detecting Burned Areas Using Landsat-8 OLI/TIRS Images under Different Biomes in Brazil and Portugal. Forests 2023, 14, 663. [Google Scholar] [CrossRef]
- Libonati, R.; DaCamara, C.C.; Setzer, A.W.; Morelli, F.; Melchiori, A.E. An Algorithm for Burned Area Detection in the Brazilian Cerrado Using 4 Μm MODIS Imagery. Remote Sens. 2015, 7, 15782–15803. [Google Scholar] [CrossRef]
- Pereira, J.M.C. A Comparative Evaluation of NOAA/AVHRR Vegetation Indexes for Burned Surface Detection and Mapping. IEEE Trans. Geosci. Remote Sens. 1999, 37, 217. [Google Scholar] [CrossRef]
- Júnior, S.; Pachêco, S.; Júnior, J.A.S.; Pacheco, A.P.; Antônio, J.; Da Penha Pachêco, A. Avaliação de Índices Espectrais e Classificação Normal Bayes Usando Imagens OLI e TIRS Para o Mapeamento de Áreas Queimadas No Cerrado. Rev. Bras. Meio Ambiente 2022, 132–147. [Google Scholar]
- Ye, J.; Cui, Z.; Zhao, F.; Liu, Q. Automated Extraction of Forest Burn Severity Based on Light and Small UAV Visible Remote Sensing Images. Forests 2022, 13, 1665. [Google Scholar] [CrossRef]
- Beltrán-Marcos, D.; Suárez-Seoane, S.; Fernández-Guisuraga, J.M.; Fernández-García, V.; Pinto, R.; García-Llamas, P.; Calvo, L. Mapping Soil Burn Severity at Very High Spatial Resolution from Unmanned Aerial Vehicles. Forests 2021, 12, 179. [Google Scholar] [CrossRef]
- Gillespie, M.; Okin, G.S.; Meyer, T.; Ochoa, F. Evaluating Burn Severity and Post-Fire Woody Vegetation Regrowth in the Kalahari Using UAV Imagery and Random Forest Algorithms. Remote Sens. 2024, 16, 3943. [Google Scholar] [CrossRef]
- Matiko, S.S.; de Almeida, S.P.; Felipe, R.J. Cerrado: Ecologia e Flora; Embrapa Informação Tecnológica: Brasília, Brazil, 2008; Volume 1, ISBN 9788573833973. [Google Scholar]
- Ballesteros, R.; Ortega, J.F.; Hernandez, D.; del Campo, A.; Moreno, M.A. Combined Use of Agro-Climatic and Very High-Resolution Remote Sensing Information for Crop Monitoring. Int. J. Appl. Earth Obs. Geoinf. 2018, 72, 66–75. [Google Scholar] [CrossRef]
- Raymond, H.E., Jr.; Daughtry, C.S.T.; Eitel, J.U.H.; Long, D.S. Remote Sensing Leaf Chlorophyll Content Using a Visible Band Index. Agron. J. 2011, 103, 1090–1099. [Google Scholar] [CrossRef]
- Tucker, C.J. Red and Photographic Infrared Linear Combinations for Monitoring Vegetation. Remote Sens. Environ. 1979, 8, 127–150. [Google Scholar] [CrossRef]
- Woebbecke, D.M.; Meyer, G.E.; Von Bargen, K.; Mortensen, D.A. Color Indices for Weed Identification under Various Soil, Residue and Lighting Conditions. Trans. ASAE 1995, 38, 259–269. [Google Scholar] [CrossRef]
- Gitelson, A.A.; Kaufman, Y.J.; Stark, R.; Rundquist, D. Novel Algorithms for Remote Estimation of Vegetation Fraction. Remote Sens. Environ. 2002, 80, 76–87. [Google Scholar] [CrossRef]
- Louhaichi, M.; Borman, M.M.; Johnson, D.E. Spatially Located Platform and Aerial Photography for Documentation of Grazing Impacts on Wheat. Geocarto Int. 2001, 16, 65–70. [Google Scholar] [CrossRef]
- Kaufman, Y.J.; Remer, L.A. Detection of Forests Using Mid-IR Reflectance: An Application for Aerosol Studies. IEEE Trans. Geosci. Remote Sens. 1994, 32, 672–683. [Google Scholar] [CrossRef]
- Keerthinathan, P.; Amarasingam, N.; Hamilton, G.; Gonzalez, F. Exploring Unmanned Aerial Systems Operations in Wildfire Management: Data Types, Processing Algorithms and Navigation. Int. J. Remote Sens. 2023, 44, 5628–5685. [Google Scholar] [CrossRef]
- Pérez-Rodríguez, L.A.; Quintano, C.; Marcos, E.; Suarez-Seoane, S.; Calvo, L.; Fernández-Manso, A. Evaluation of Prescribed Fires from Unmanned Aerial Vehicles (UAVs) Imagery and Machine Learning Algorithms. Remote Sens. 2020, 12, 1295. [Google Scholar] [CrossRef]
- Simes, T.; Pádua, L.; Moutinho, A. Wildfire Burnt Area Severity Classification from UAV-Based RGB and Multispectral Imagery. Remote Sens. 2024, 16, 30. [Google Scholar] [CrossRef]
- McKenna, P.; Erskine, P.D.; Lechner, A.M.; Phinn, S. Measuring Fire Severity Using UAV Imagery in Semi-Arid Central Queensland, Australia. Int. J. Remote Sens. 2017, 38, 4244–4264. [Google Scholar] [CrossRef]
- Llorens, R.; Sobrino, J.A.; Fernández, C.; Fernández-Alonso, J.M.; Vega, J.A. Soil Burn Severity Assessment Using Sentinel-2 and Radiometric Measurements. Fire 2024, 7, 487. [Google Scholar] [CrossRef]
- Tran, B.N.; Tanase, M.A.; Bennett, L.T.; Aponte, C. Evaluation of Spectral Indices for Assessing Fire Severity in Australian Temperate Forests. Remote Sens. 2018, 10, 1680. [Google Scholar] [CrossRef]
- Huang, H.; Roy, D.P.; Boschetti, L.; Zhang, H.K.; Yan, L.; Kumar, S.S.; Gomez-Dans, J.; Li, J. Separability Analysis of Sentinel-2A Multi-Spectral Instrument (MSI) Data for Burned Area Discrimination. Remote Sens. 2016, 8, 873. [Google Scholar] [CrossRef]
- Fernández-Guisuraga, J.M.; Sanz-Ablanedo, E.; Suárez-Seoane, S.; Calvo, L. Using Unmanned Aerial Vehicles in Postfire Vegetation Survey Campaigns through Large and Heterogeneous Areas: Opportunities and Challenges. Sensors 2018, 18, 586. [Google Scholar] [CrossRef]
- Bodí, M.B.; Mataix-Solera, J.; Doerr, S.H.; Cerdà, A. The Wettability of Ash from Burned Vegetation and Its Relationship to Mediterranean Plant Species Type, Burn Severity and Total Organic Carbon Content. Geoderma 2011, 160, 599–607. [Google Scholar] [CrossRef]
- Goforth, B.R.; Graham, R.C.; Hubbert, K.R.; Zanner, C.W.; Minnich, R.A. Spatial Distribution and Properties of Ash and Thermally Altered Soils after High-Severity Forest Fire, Southern California. Int. J. Wildland Fire 2005, 14, 343–354. [Google Scholar] [CrossRef]
- McKenna, P.; Phinn, S.; Erskine, P.D. Fire Severity and Vegetation Recovery on Mine Site Rehabilitation Using Worldview-3 Imagery. Fire 2018, 1, 22. [Google Scholar] [CrossRef]
- Smith, A.M.S.; Wooster, M.J.; Drake, N.A.; Dipotso, F.M.; Falkowski, M.J.; Hudak, A.T. Testing the Potential of Multi-Spectral Remote Sensing for Retrospectively Estimating Fire Severity in African Savannahs. Remote Sens. Environ. 2005, 97, 92–115. [Google Scholar] [CrossRef]
- Larrinaga, A.R.; Brotons, L. Greenness Indices from a Low-Cost UAV Imagery as Tools for Monitoring Post-Fire Forest Recovery. Drones 2019, 3, 6. [Google Scholar] [CrossRef]
- Carvajal-Ramírez, F.; da Silva, J.R.M.; Agüera-Vega, F.; Martínez-Carricondo, P.; Serrano, J.; Moral, F.J. Evaluation of Fire Severity Indices Based on Pre- and Post-Fire Multispectral Imagery Sensed from UAV. Remote Sens. 2019, 11, 993. [Google Scholar] [CrossRef]
- Cruz, H.; Eckert, M.; Meneses, J.; Martínez, J.F. Efficient Forest Fire Detection Index for Application in Unmanned Aerial Systems (UASs). Sensors 2016, 16, 893. [Google Scholar] [CrossRef] [PubMed]
Disclaimer/Publisher’s Note: The statements, opinions and data contained in all publications are solely those of the individual author(s) and contributor(s) and not of MDPI and/or the editor(s). MDPI and/or the editor(s) disclaim responsibility for any injury to people or property resulting from any ideas, methods, instructions or products referred to in the content. |
© 2025 by the authors. Licensee MDPI, Basel, Switzerland. This article is an open access article distributed under the terms and conditions of the Creative Commons Attribution (CC BY) license (https://creativecommons.org/licenses/by/4.0/).