Abstract
This article presents the application of novel cartographic methods of vegetation mapping with a case study of the Rif Mountains, northern Morocco. The study area is notable for varied geomorphology and diverse landscapes. The methodology includes ML modules of GRASS GIS ‘r.learn.train’, ‘r.learn.predict’, and ‘r.random’ with algorithms of supervised classification implemented from the Scikit-Learn libraries of Python. This approach provides a platform for processing spatiotemporal data and satellite image analysis. The objective is to determine the robustness of the “DecisionTreeClassifier” and “ExtraTreesClassifier” classification algorithms. The time series of satellite images covering northern Morocco consists of six Landsat scenes for 2023 with a bimonthly time interval. Land cover maps are produced based on the processed, classified, and analyzed images. The results demonstrated seasonal changes in vegetation and land cover types. The validation was performed using a land cover dataset from the Food and Agriculture Organization (FAO). This study contributes to environmental monitoring in North Africa using ML algorithms of satellite image processing. Using RS data combined with the powerful functionality of the GRASS GIS and FAO-derived datasets, the topographic variability, moderate-scale habitat heterogeneity, and bimonthly distribution of land cover types of northern Morocco in 2023 have been assessed for the first time.
1. Introduction
The study of the relationship between geomorphology and vegetation has become a major issue for monitoring territories using Earth observation (EO) data [1,2,3,4]. The time series of such geospatial data are valuable for the evaluation of environmental changes based on their classification [5,6,7]. Nevertheless, the issue of environmental monitoring using Remote Sensing (RS) data consists of receiving new data faster than we are able to describe, interpret, and process them. This is especially true in the satellite time series, where there is the need to classify, evaluate, and map habitats in operative regimes [8,9,10]. In particular, geospatial data are used in the areas of agricultural land management and climate change [11,12,13]. The operative mapping of areas with diversified geomorphology is based on the time series of the satellite data that allow regular visualization for environmental monitoring [14,15].
In Morocco, the benefits from the use of satellite images for landscape analysis are made evident by its very diverse landscape structure [16,17,18]. Since the geography of Morocco extends from the Atlantic Ocean to mountainous areas and the Sahara desert, this country is notable for its diversified geomorphological framework and varied topography. Moreover, the geological and tectonic development of the Atlas Mountains and their surroundings presents a complex pattern of geological units [19,20,21]. This also determines the distribution of major vegetation types, and controls land use patterns in the mountainous regions of the country [22].
In this context, land cover maps that visualize regional environmental settings play a vital role in mapping Morocco. Because RS data can be interpreted in terms of landscape structural units, comparing several images in a time series is useful for detecting changes. In turn, the change detection of land cover types enables major steps of landscape dynamics to be revealed [23,24,25]. However, a question arises regarding the choice of classification algorithms and the efficiency of software for data processing. The integration of RS data with a Geographic Information System (GIS) for environmental mapping has been the subject of research for decades and continues to be a challenging topic. Many approaches to the problem of satellite image analysis have been proposed since the development of satellite missions [26,27,28,29,30]. A new line of research arises at the intersection between programming methods of Machine Learning (ML) and spatial analysis using satellite images. The application of such tools and methods enables us to process images more effectively and accurately, as reported in previous studies [31,32,33].
Hence, the performance of image classification methods is linked to the quality of RS data. In the field of cartography, Landsat 8-9 Operational Land Imager and Thermal Infrared Sensor (OLI/TIRS) image data open new opportunities, since the spatial resolution of these data is an advantage for determining land use classes. In this context, the launch of new satellite constellations of Landsat 8-9 OLI/TIRS as EO systems allows the acquisition of time series. The acquisition of these data opens new perspectives in cartography [34,35,36,37].
2. Objective and Motivation
This paper focuses specifically on the application of ML methods to satellite image processing incorporated into the GRASS GIS software through the embedded Python Scikit-Learning libraries. Using ML in the traditional Geographic Information System (GIS) for mapping land cover types is a challenge that has been researched for many years and has many proposed solutions. Machine learning is an artificial approach to geospatial data processing that relies on mathematical and statistical algorithms to give computers the ability to “learn” from data. In this context, ML can be applied to satellite images such as Landsat 8-9 OLI/TIRS since pixels are discrete quantitative variables [38,39,40].
Due to the specific advantages of ML, the functions of the programs improve their performance in solving geospatial analysis tasks [27,41,42]. In the field of satellite image processing, this concerns the usual image processing tasks such as pixel recognition [43,44], spectral reflectance analysis [45], classification optimization [46,47], the development of more advanced methods of image analysis and interpretation, as well as the implementation of these methods to cartographic visualization, as discussed earlier [48,49,50]. Compared to traditional approaches, the improvements brought by the ML algorithms concern the modeling of data with an average statistical error value being as low as possible.
The Geographic Resources Analysis Support System (GRASS) GIS software was chosen as the satellite image processing tool for its combination of efficiency and cross-platform compatibility. This paper uses the GRASS GIS ML modules (‘r.learn.train’, ‘r.random’, ‘r.learn.predict’, and ‘r.category’) with the ‘ExtraTreesClassifier’ and ‘DecisionTreeClassifier’ models for the supervised application, training, and classification of six satellite images. The results of the ML approach to image processing are compared with the results of unsupervised classification performed using the GRASS GIS modules ‘i.cluster’ and ‘i.maxlik’. The scripts of this software are similar to libraries in programming languages.
In programming libraries, image processing algorithms are implemented as a set of functions used to process raster files, perform geospatial analysis, and create maps in the form of visualized images [51,52,53]. This is the fundamental approach that differentiates the method of using script libraries from traditional GIS. The use of programming approaches to processing and analyzing satellite images allows the handling of complex representations of landscape features and detected objects recognized as land cover types that have various properties (extent and heterogeneity of landscapes, its texture, size of plots, fragmentation and topology, etc.).
As well as serving as the first descriptive study of habitat heterogeneity in the Rif Mountains, this study also provides guidance for future cartographic mapping using ML modules of GRASS GIS, taking into account the geographic isolation of diverse landscape patches and the heterogeneity and contrast of north African landscapes, ranging from arid areas of the Sahara to humid coastal zones. In particular, in this research, an exploration of GRASS GIS ML modules is presented and exploited, with the aim of demonstrating the applicability of spatiotemporal data processing to environmental studies in north Africa.
3. Study Area
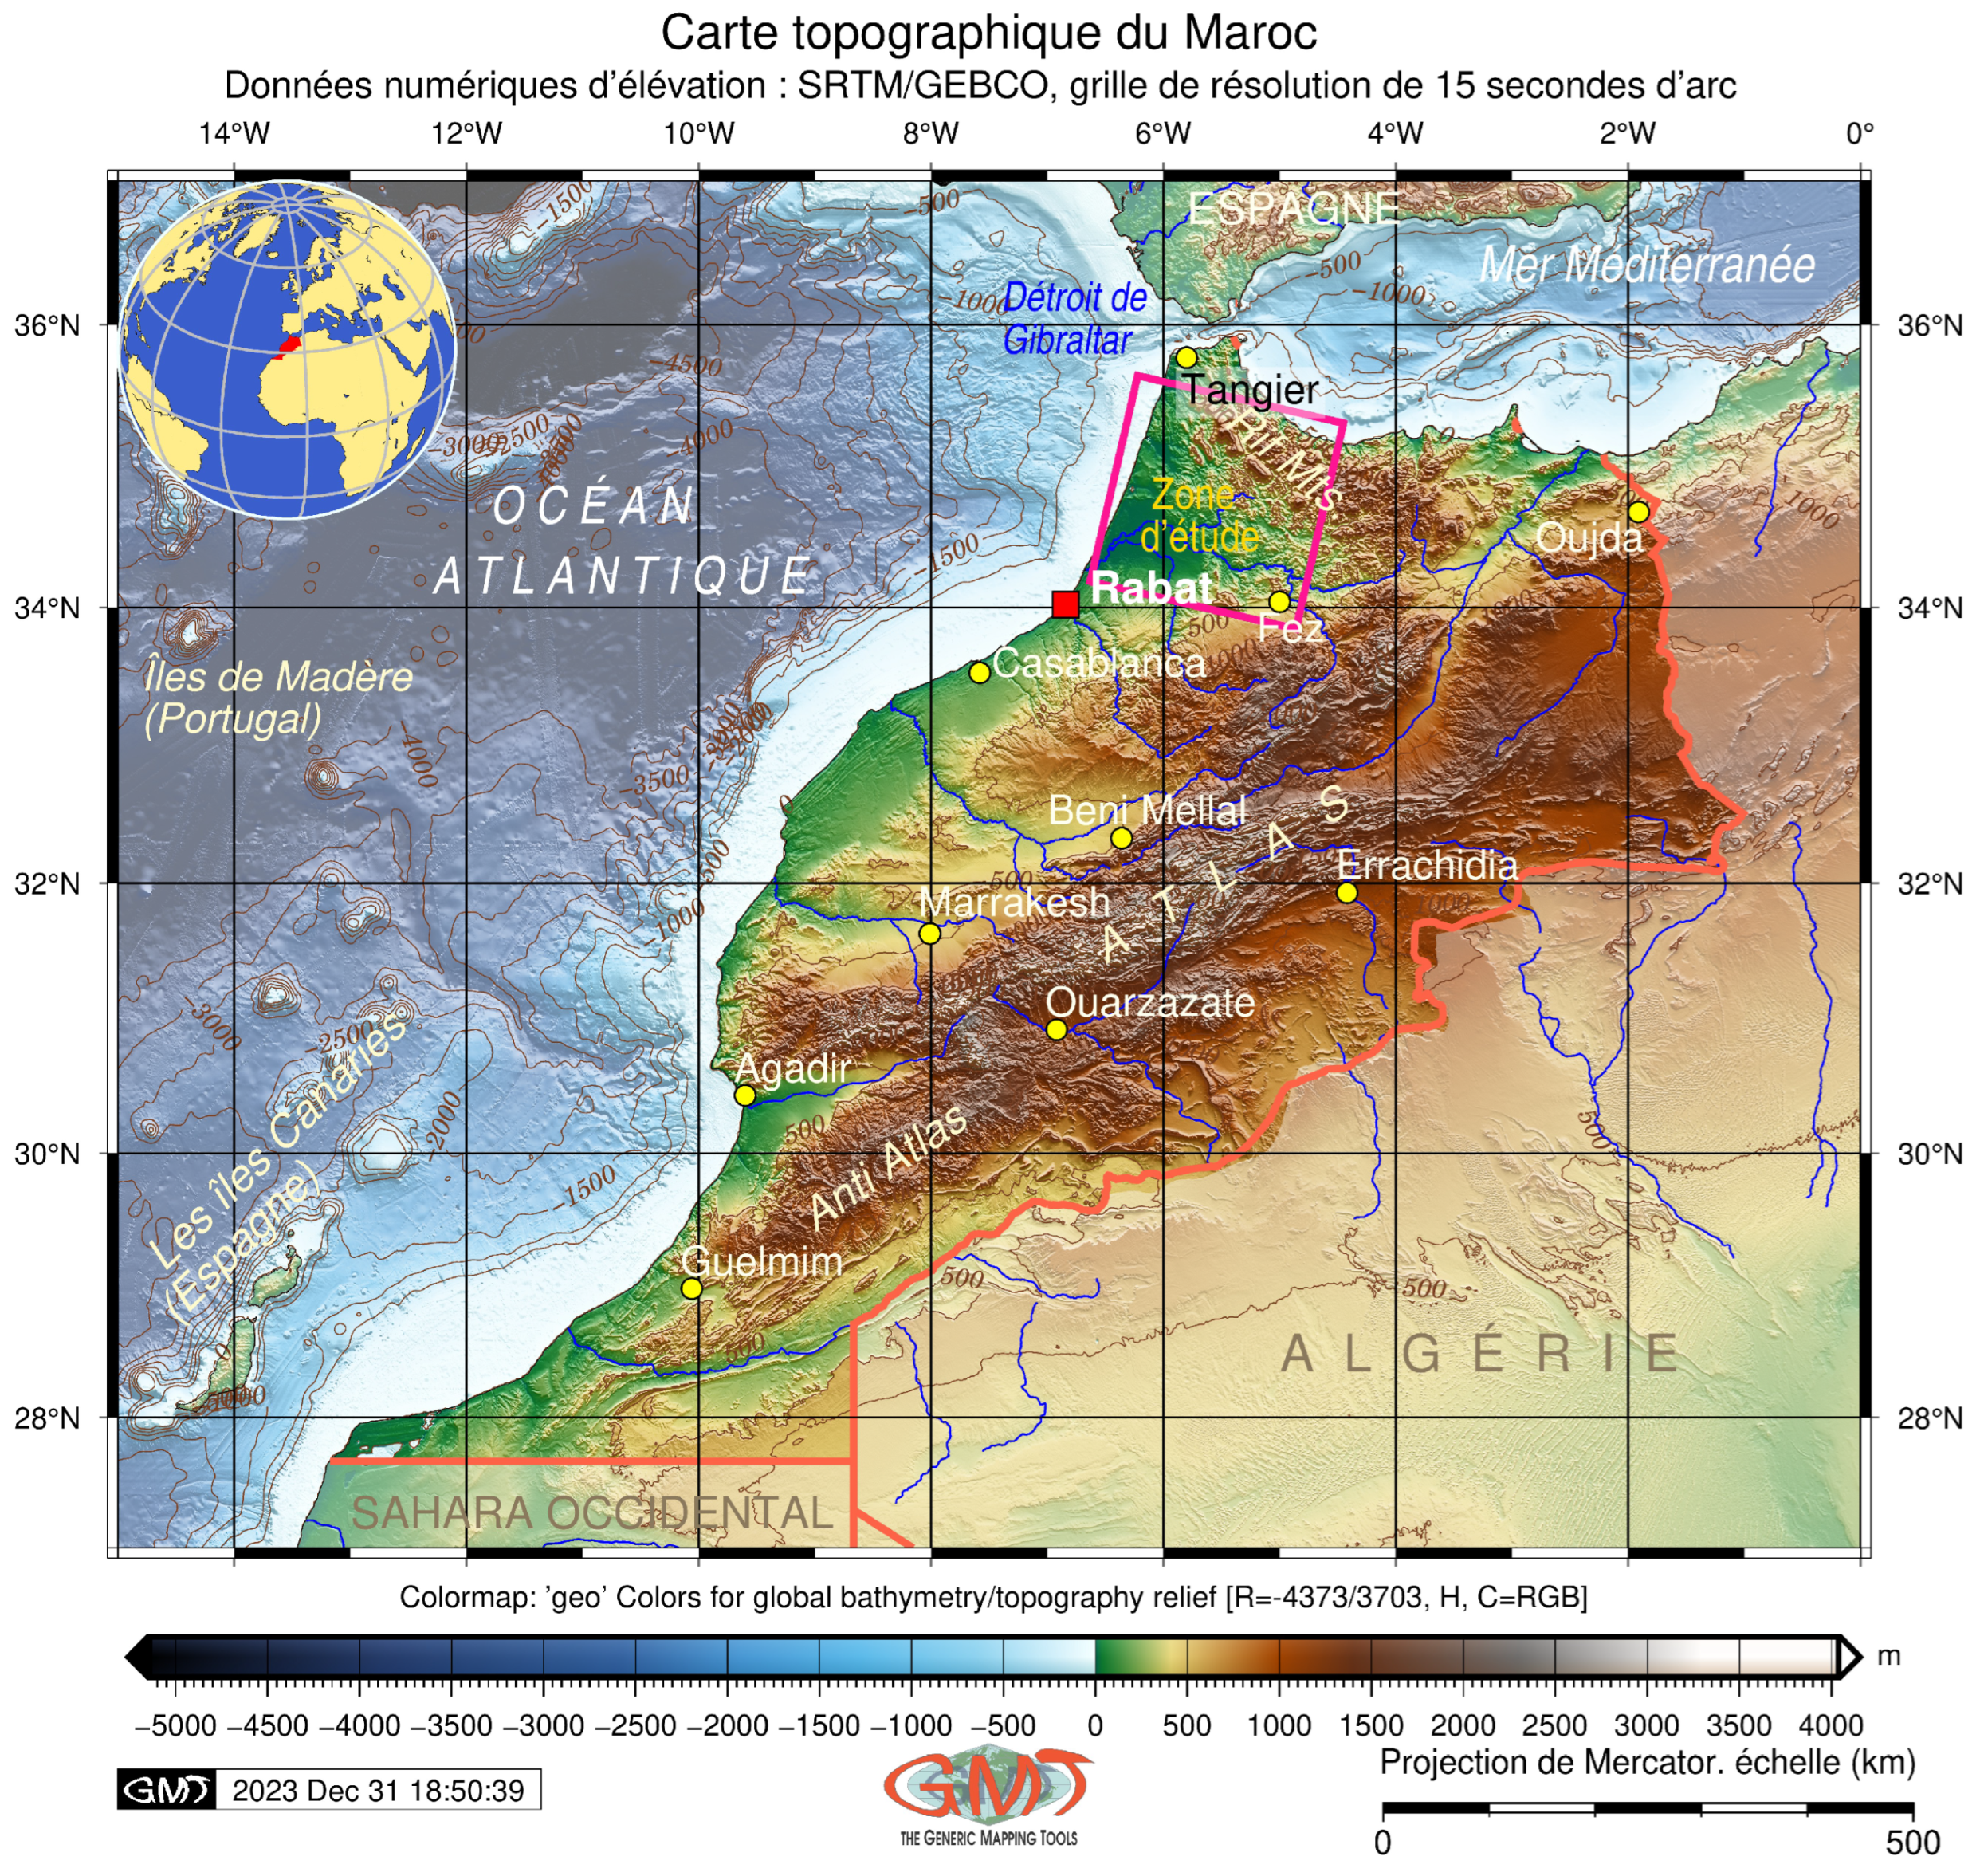
The study focuses on northern Morocco, specifically the Rif Mountains; see Figure 1. The Rif Mountains region is located between latitudes 34°30′–35°15′ N and longitudes 4°30′–5°30′ W, with an extension of about 30,000 m and an occupied area of 4000 km² [54]. The geographical position of the country and its vast extent result in a great variety of ecosystems. Landscapes vary from humid in the Rif and Atlas to the arid Saharan in the south, including sub-humid transition zones and a semi-arid climate in the plains and foothills areas [55].
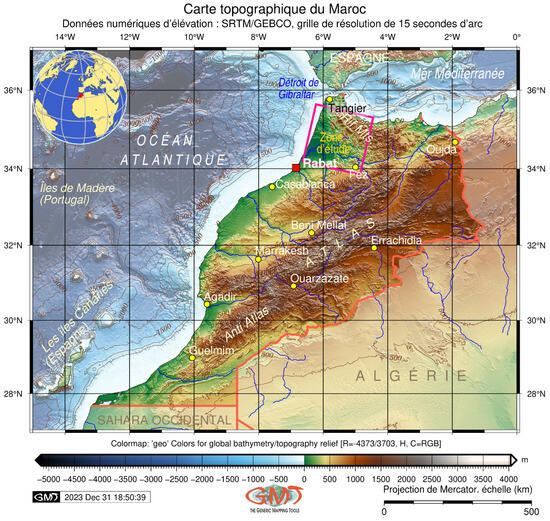
Figure 1.
General topographic map of Morocco with outlined location of the study area. Mapping software: Generic Mapping Tools (GMT) version 6.4.0. Data source: General Bathymetric Chart of the Oceans (GEBCO). Map source: author.
The Rif Mountains were formed as a result of complex tectonic interactions between the African and Eurasian plates. The complex geological setting of northern Morocco in the Rif region has resulted in moderate tectonic activities [56,57].
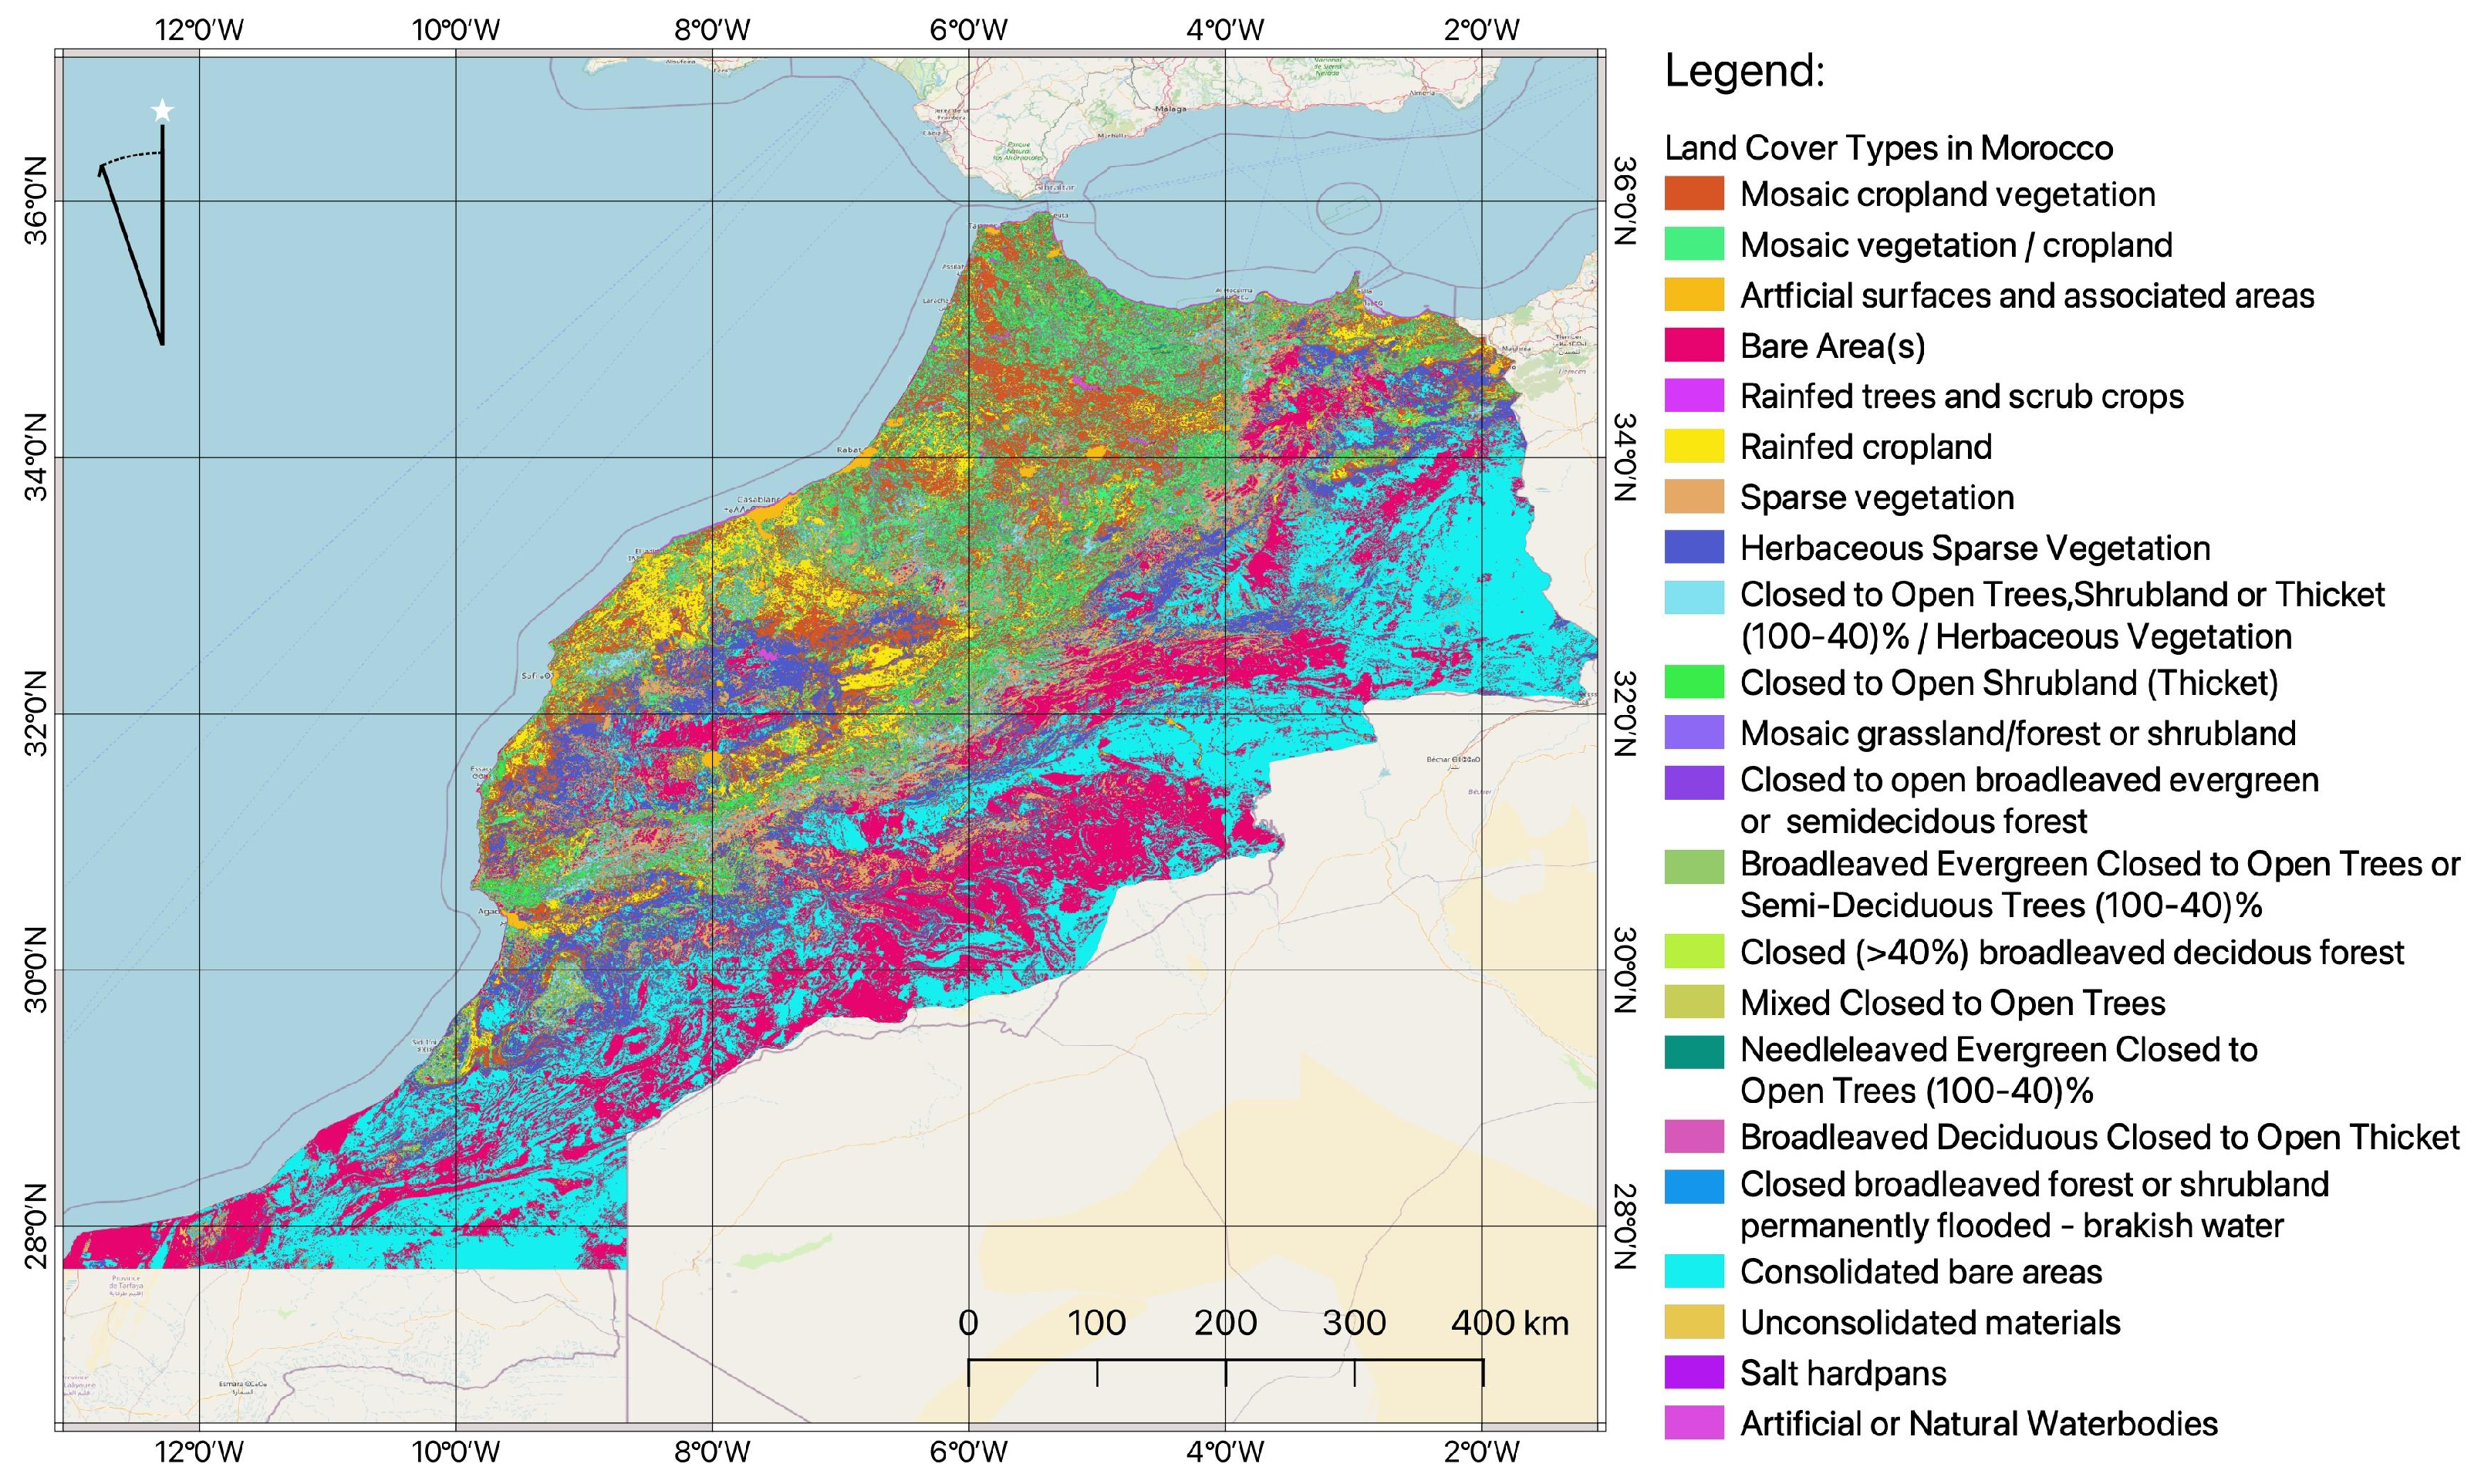
The geomorphological structures of the region are composed of three main units from north to south: the internal zone, the flysch nappes, and the external zone [58,59]. The crustal thickness beneath the Rif Mountains varies between 36 and 30 km towards the border with the western Mediterranean [60]. The Rif presents a mountain range that extends across northern Morocco, skirting the Mediterranean Sea and in particular the Alboran Sea on its southern shore. The Rif constitutes a segment of the Alpine ranges. More specifically, it belongs to the Betico–Rifo–Tellian arc in the southwestern Mediterranean [61]. The Rif–Tell belt located in northern Morocco is a young Alpine orogenic system that presents metamorphic complexes formed by geodynamic and tectonic activity [62,63,64]. This region is characterized by deep sediments related to Tethyan rifting [65,66,67], which strongly affects soil properties and vegetation types [68,69]. As a result of such complex geologic and geomorphic settings in northern Morocco, there are very diverse ecosystem types that occupy the landscapes from the foothills, slopes, and valleys, from limestone mountains to the Saharan sebkhas. The main types of land cover are presented in Figure 2.
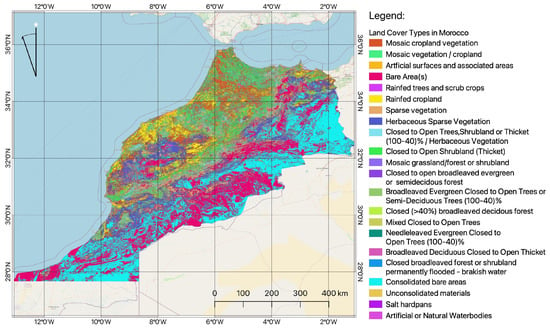
Figure 2.
Land cover types in Morocco. Data source: Food and Agriculture Organization (FAO). The map is created using QGIS software. Map source: author.
The geomorphological structure of the Rif can be divided into three segments. The Western Rif is covered with large mountains; its climate is mild, with heavy rains and showers in winter. The Central Rif has diverse reliefs and heterogeneous landscapes. The Eastern Rif is the flattest part of the range [70]. The primary type is presented by the vegetation of the cultivated lands in mosaic, distributed along the basement of the Rif Mountains. The vegetation types in the Atlas Mountains region are presented by a closed to open evergreen or semi-deciduous broadleaf forest, with a forest cover of 100 to 40% for closed to open trees or semi-deciduous trees [71]. This geomorphological and climatic heterogeneity corresponds to bio-ecological and environmental diversity. Thus, the spatial richness of the conditions of climate and geology accentuates this biodiversity and the types of land use in Morocco.
The main structure of the Rif is represented by the limestone massifs. The underground water reserves of the Rif maintain the distribution of vegetation and the rivers that originate in the Rif [72]. Due to these hydrogeological features, short coastal rivers and streams flow from the Rif to the Mediterranean, which are characterized by a torrential and erosional regime [73]. The sources of these rivers supply water to both diverse and very heterogeneous types of vegetation around the Rif. These processes briefly illustrate the close link between the geomorphological features, hydrogeology, and vegetation of the Rif region [74].
Seismic, magnetic, and thermal activities in the Rif caused by local crustal earthquakes are related to the geological instability of this region [75]. Specifically, this region presents a southern branch of the Betic–Rif arc that is part of the Alpine ranges. This region has experienced deformations between northwest Africa and southern Spain (Iberia) since the Tertiary [76], followed by the convergence between Africa and the Iberian Peninsula [77,78]. This tectonic block has moved towards the west-southwest and the region still experiences tectonic activity [79]. At the same time, seismic-tectonic activities shape the regional geomorphology [80]. In turn, this controls the distribution of land cover types and is expressed in the landscapes. Such links between geology, geomorphology, and the environmental context have been discussed in previous works [78,81,82].
The Mediterranean coasts of Morocco are a habitat for numerous wetland ecosystems, including peatlands with boreal floristic affinities and a high conservation value [83,84]. Occasional patches of rain-fed trees and scrub crops are distributed in the western regions of the country and depend on water availability [85]. Rain-fed croplands, including olive trees and orchards in monoculture systems, interspersed with areas of sparse vegetation, are visible along the Atlantic Ocean coasts [86,87]. Sparse herbaceous vegetation comprise complex patterns mixed with shrubs and thickets. Other land cover types are generally presented by urban areas around cities with artificial surfaces and associated areas and bare soil areas in desert and unoccupied lands; see Figure 2.
4. Materials and Methods
4.1. Data
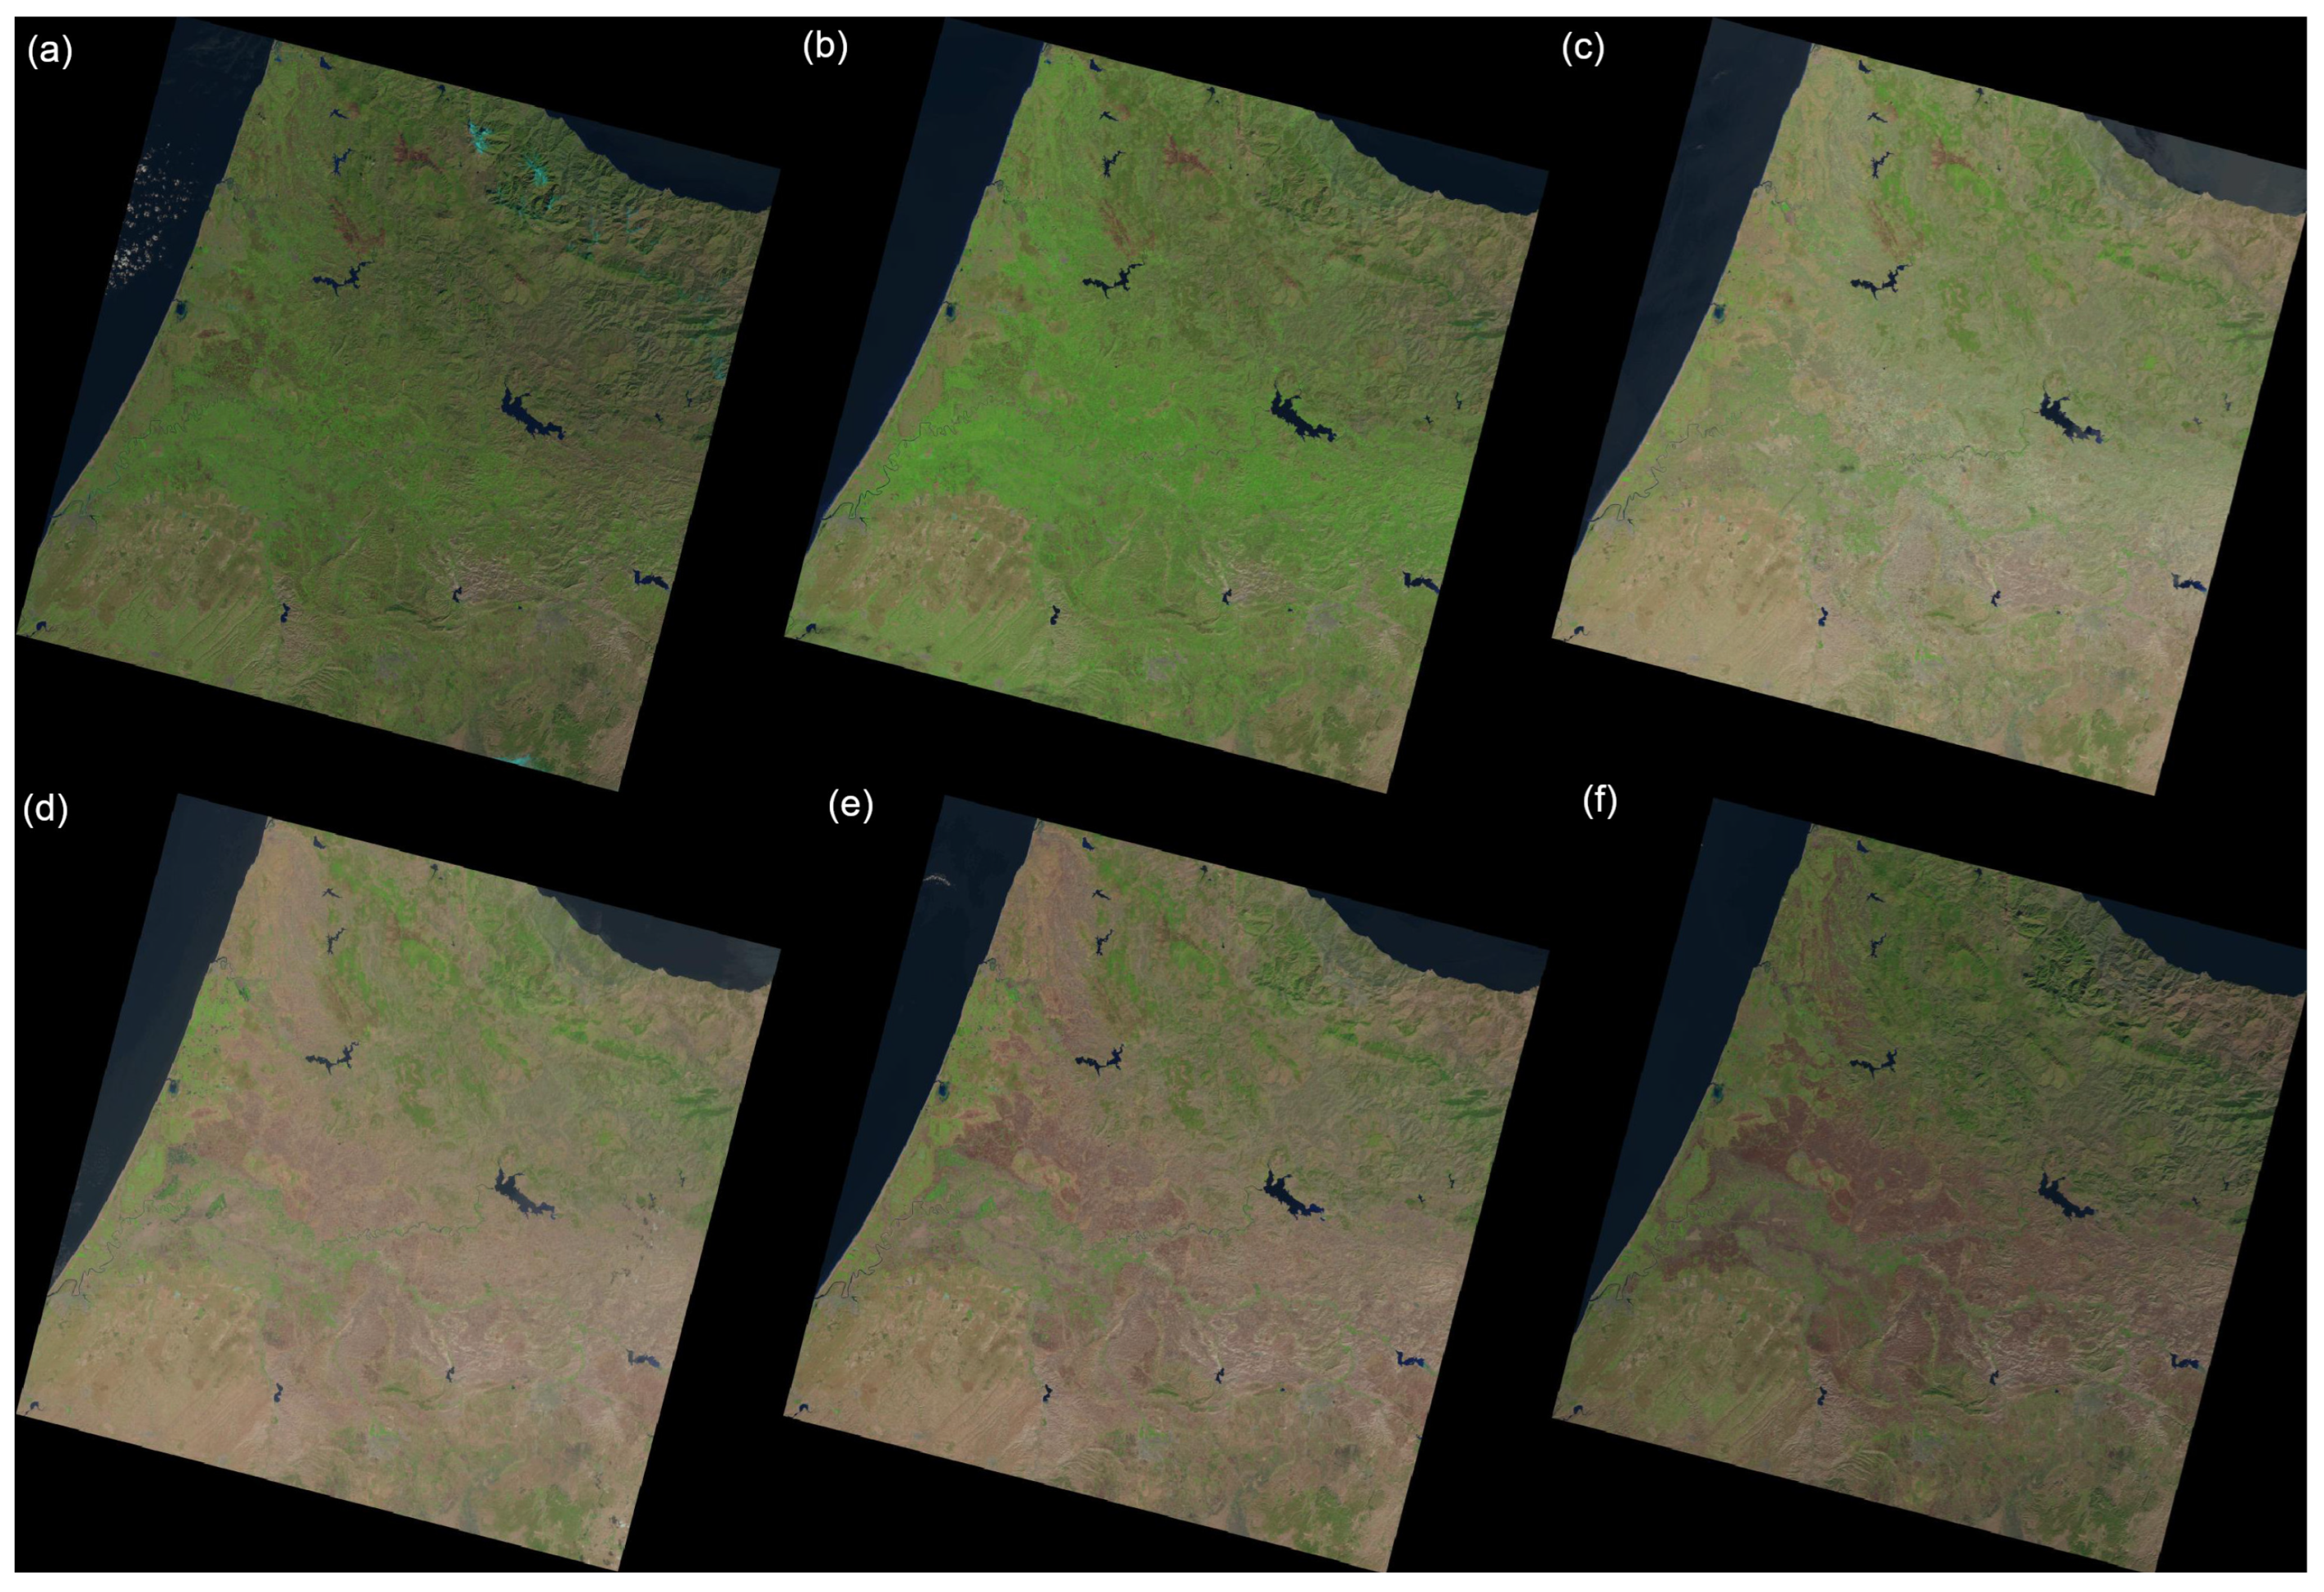
The Landsat 8-9 OLI/TIRS satellite image data covering the bimonthly period 2023: January, March, May, July, September, and November, Figure 3.
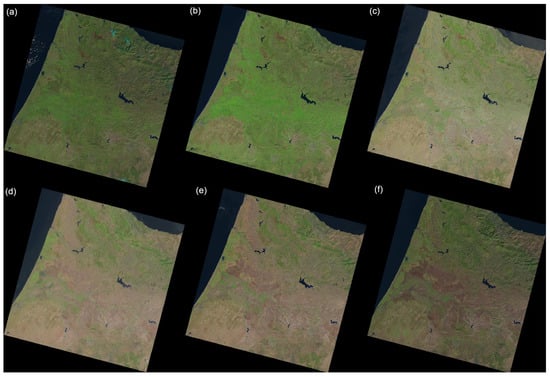
Figure 3.
Landsat images on 2023: (a)—26 January; (b)—15 March; (c)—10 May; (d)—29 July; (e)—23 September; (f)—26 November.
Although both Landsat 8 and Landsat 9 carry the Operational Land Imager (OLI) and the Thermal Infrared Sensor (TIRS), Landsat 9 is equipped with the second-generation versions of these instruments, known as the Operational Land Imager 2 (OLI-2) and the Thermal Infrared Sensor 2 (TIRS-2). In this study, images from Landsat 8 and 9 are employed. The L2 data type is OLI_TIRS_L2SP with the ground control points of version 5. The processing software version is LPGS_15.3.1c for Landsat-8 scenes and LPGS_16.3.1 for Landsat-9 (2023) scene. The satellite roll angle is zero for Landsat 8 scenes and −0.001 for Landsat 9. The images were taken during the day at Nadir, with cloud cover less than 10%. Here, only multispectral bands with an acquisition resolution of 30 m were used, except for panchromatic bands with a resolution of 15 m. The combination of multispectral bands is mainly used for the creation of false/true color composites for classification, especially for image visualization. The available data were listed using the search template in “g.list rast”.
4.2. Workflow
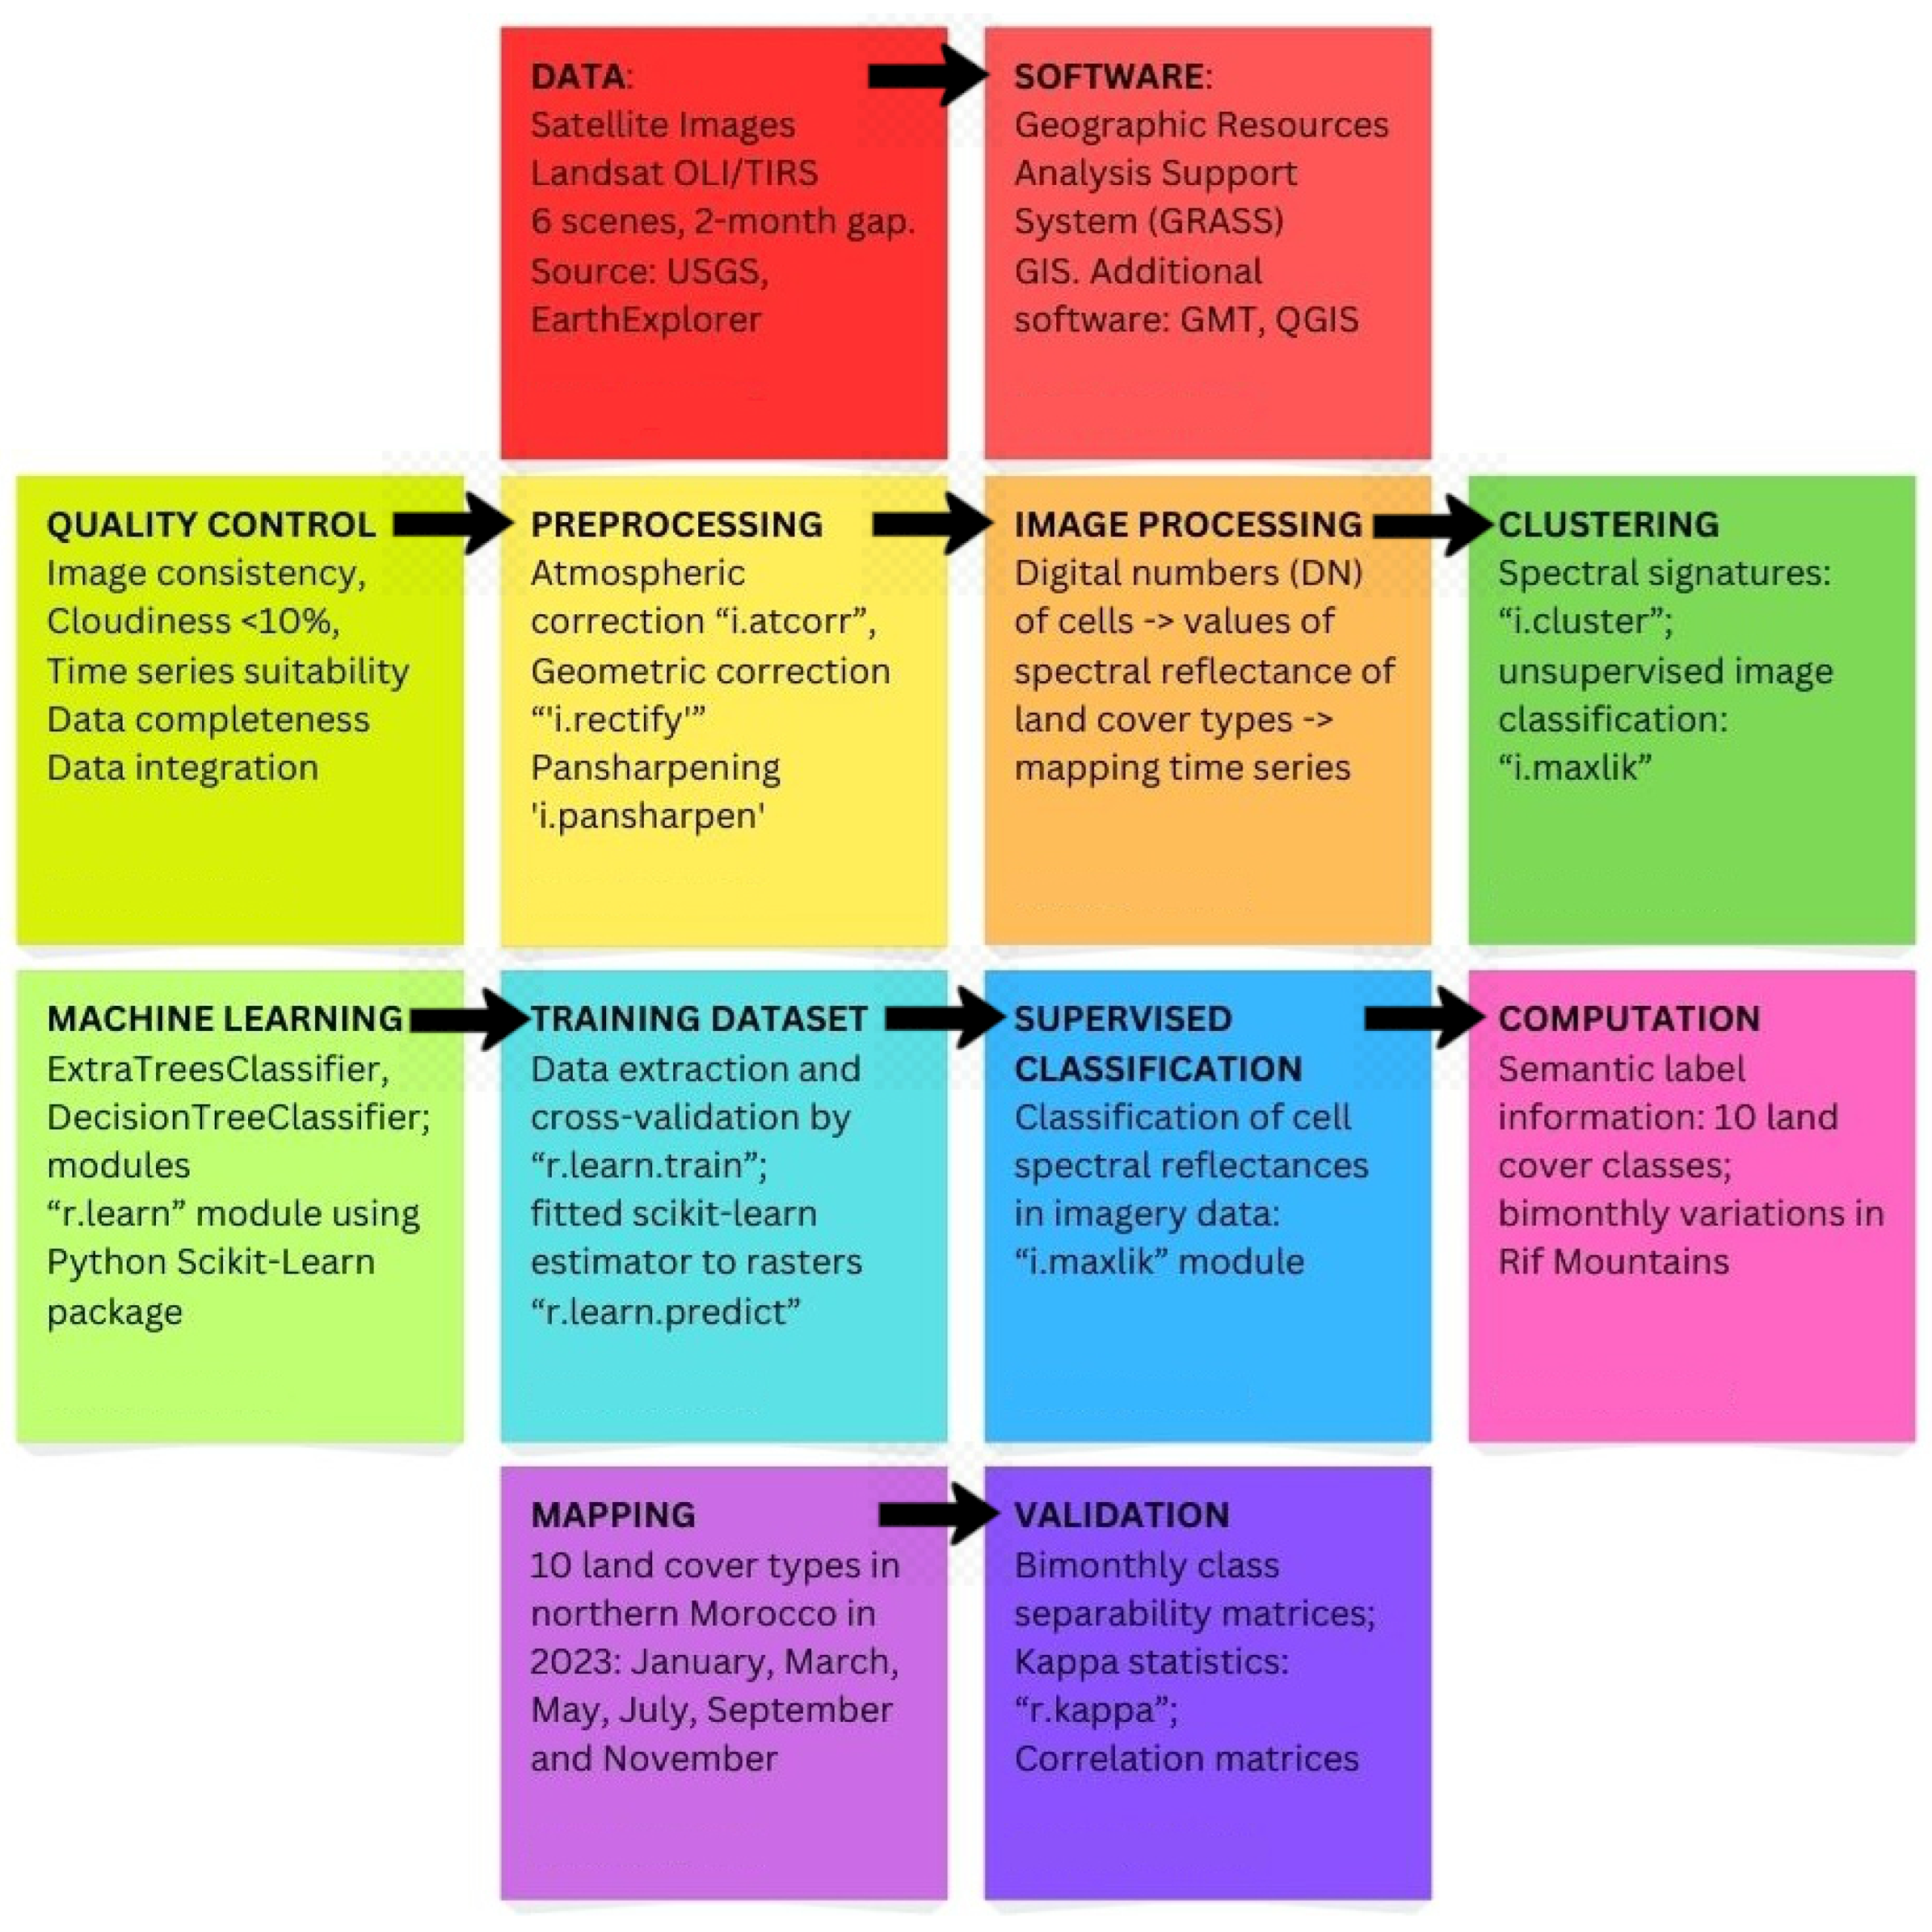
We first plot the workflow obtained from each methodological step to provide a general picture of the approach used in this study; see Figure 4.
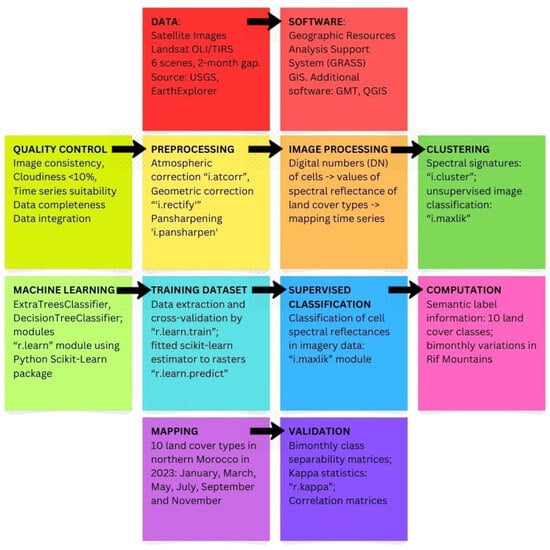
Figure 4.
Workflow diagram illustrating major steps of research design used for the organization of data processing tasks. Software: GIMP, version 2.10. Diagram source: author.
Since various GISs include different steps of data processing, we next summarize the scheme into 12 well-recognized research steps, based on modules of GRASS GIS for geospatial data processing. Major research steps include the following points: (1) data collection; (2) software selection; (3) quality control; (4) data preprocessing; (5) image processing; (6) clustering (unsupervised classification); (7) machine learning; (8) training dataset; (9) supervised classification; (10) numerical computation; (11) cartographic mapping; (12) validation. The entire process of spatial RS data handling processing using GRASS GIS processes raw satellite images, extracts information from the original data, creates attributes obtained from the raster matrices, and enables use new information to digital maps. This links the original raw data to the final output of thematic environmental maps through the complex process of cartographic data management.
4.3. Software
The distinct feature of GRASS GIS, the advanced software for RS data processing and cartographic mapping, is that it enables the performance of various tasks involved in cartographic tasks using a console-based menu. It also enables the integration of geospatial data, the extraction and interpretation of information from raw satellite images, the performance of mapping and visualization, the processing of numerical and statistical analysis and computation, and the evaluation of the results for quality control. Geospatial data that can be processed in GRASS GIS can originate from many different sources and it recognizes both raster and vector formats of diverse geospatial extensions. The software is freely and openly available through its developer portal (URL: https://grass.osgeo.org/ (accessed on 8 December 2024)) which makes it a valuable tool for learning and research. The image processing process is composed of the following steps, implemented in the form of free and open source modules on GRASS GIS. The code for organizing the project and importing data is presented below.
The GRASS GIS was created as the cartographic data program, and contains independent modules from diverse provider developers, for example, ‘r.import’, ‘i.maxlik’, etc. Moreover, GRASS GIS has a built-in framework and Python Application Programming Interface (API), which supports the advanced processing of the satellite time series analysis and spatial data. The mapping of topographic data was carried out with GMT using existing methods [88,89,90,91,92], while the mapping of land use data was carried out using QGIS [93]. The mapping of land cover maps from RS data is based on satellite image classification methods.
4.4. Data Preprocessing
The data preprocessing procedures included several steps which include geometric and atmospheric correction for optical remote sensing images. First, the import and preprocessing of six Landsat images was implemented using the module ‘r.import’ that reads the data. Then, the geometric correction was performed using the ‘i.rectify’ module of GRASS GIS which corrected each image by performing a coordinate transformation for the pixels in the images using control points. Hence, the x, y cell coordinates on the images were re-calculated to a transformation matrix and then converted to standard map coordinates for each pixel in the image. Following that, the atmospheric correction was performed using the 6S algorithm embedded in the ‘i.atcorr’ module of GRASS GIS.
The atmospheric correction is essential to numerically evaluating the amount of wavelengths reflected in the diverse land cover types of the surface in various seasonal periods [94,95]. The ‘i.landsat.toar’ was used to convert Landsat 8–9 OLI/TIRS images and to transform the calibrated digital numbers for the reflectance at the top of the atmosphere. In this way, the quality of the images has been improved. The pansharpening has been performed using the ‘i.pansharpen’ module of GRSAS GIS which uses image fusion algorithms to sharpen multispectral channels with high-resolution panchromatic channels. In this way, the resolution of the multispectral image is improved. The effectiveness of the pansharpening is described in earlier studies on RS data processing [96,97].
4.5. Creating Color Composites
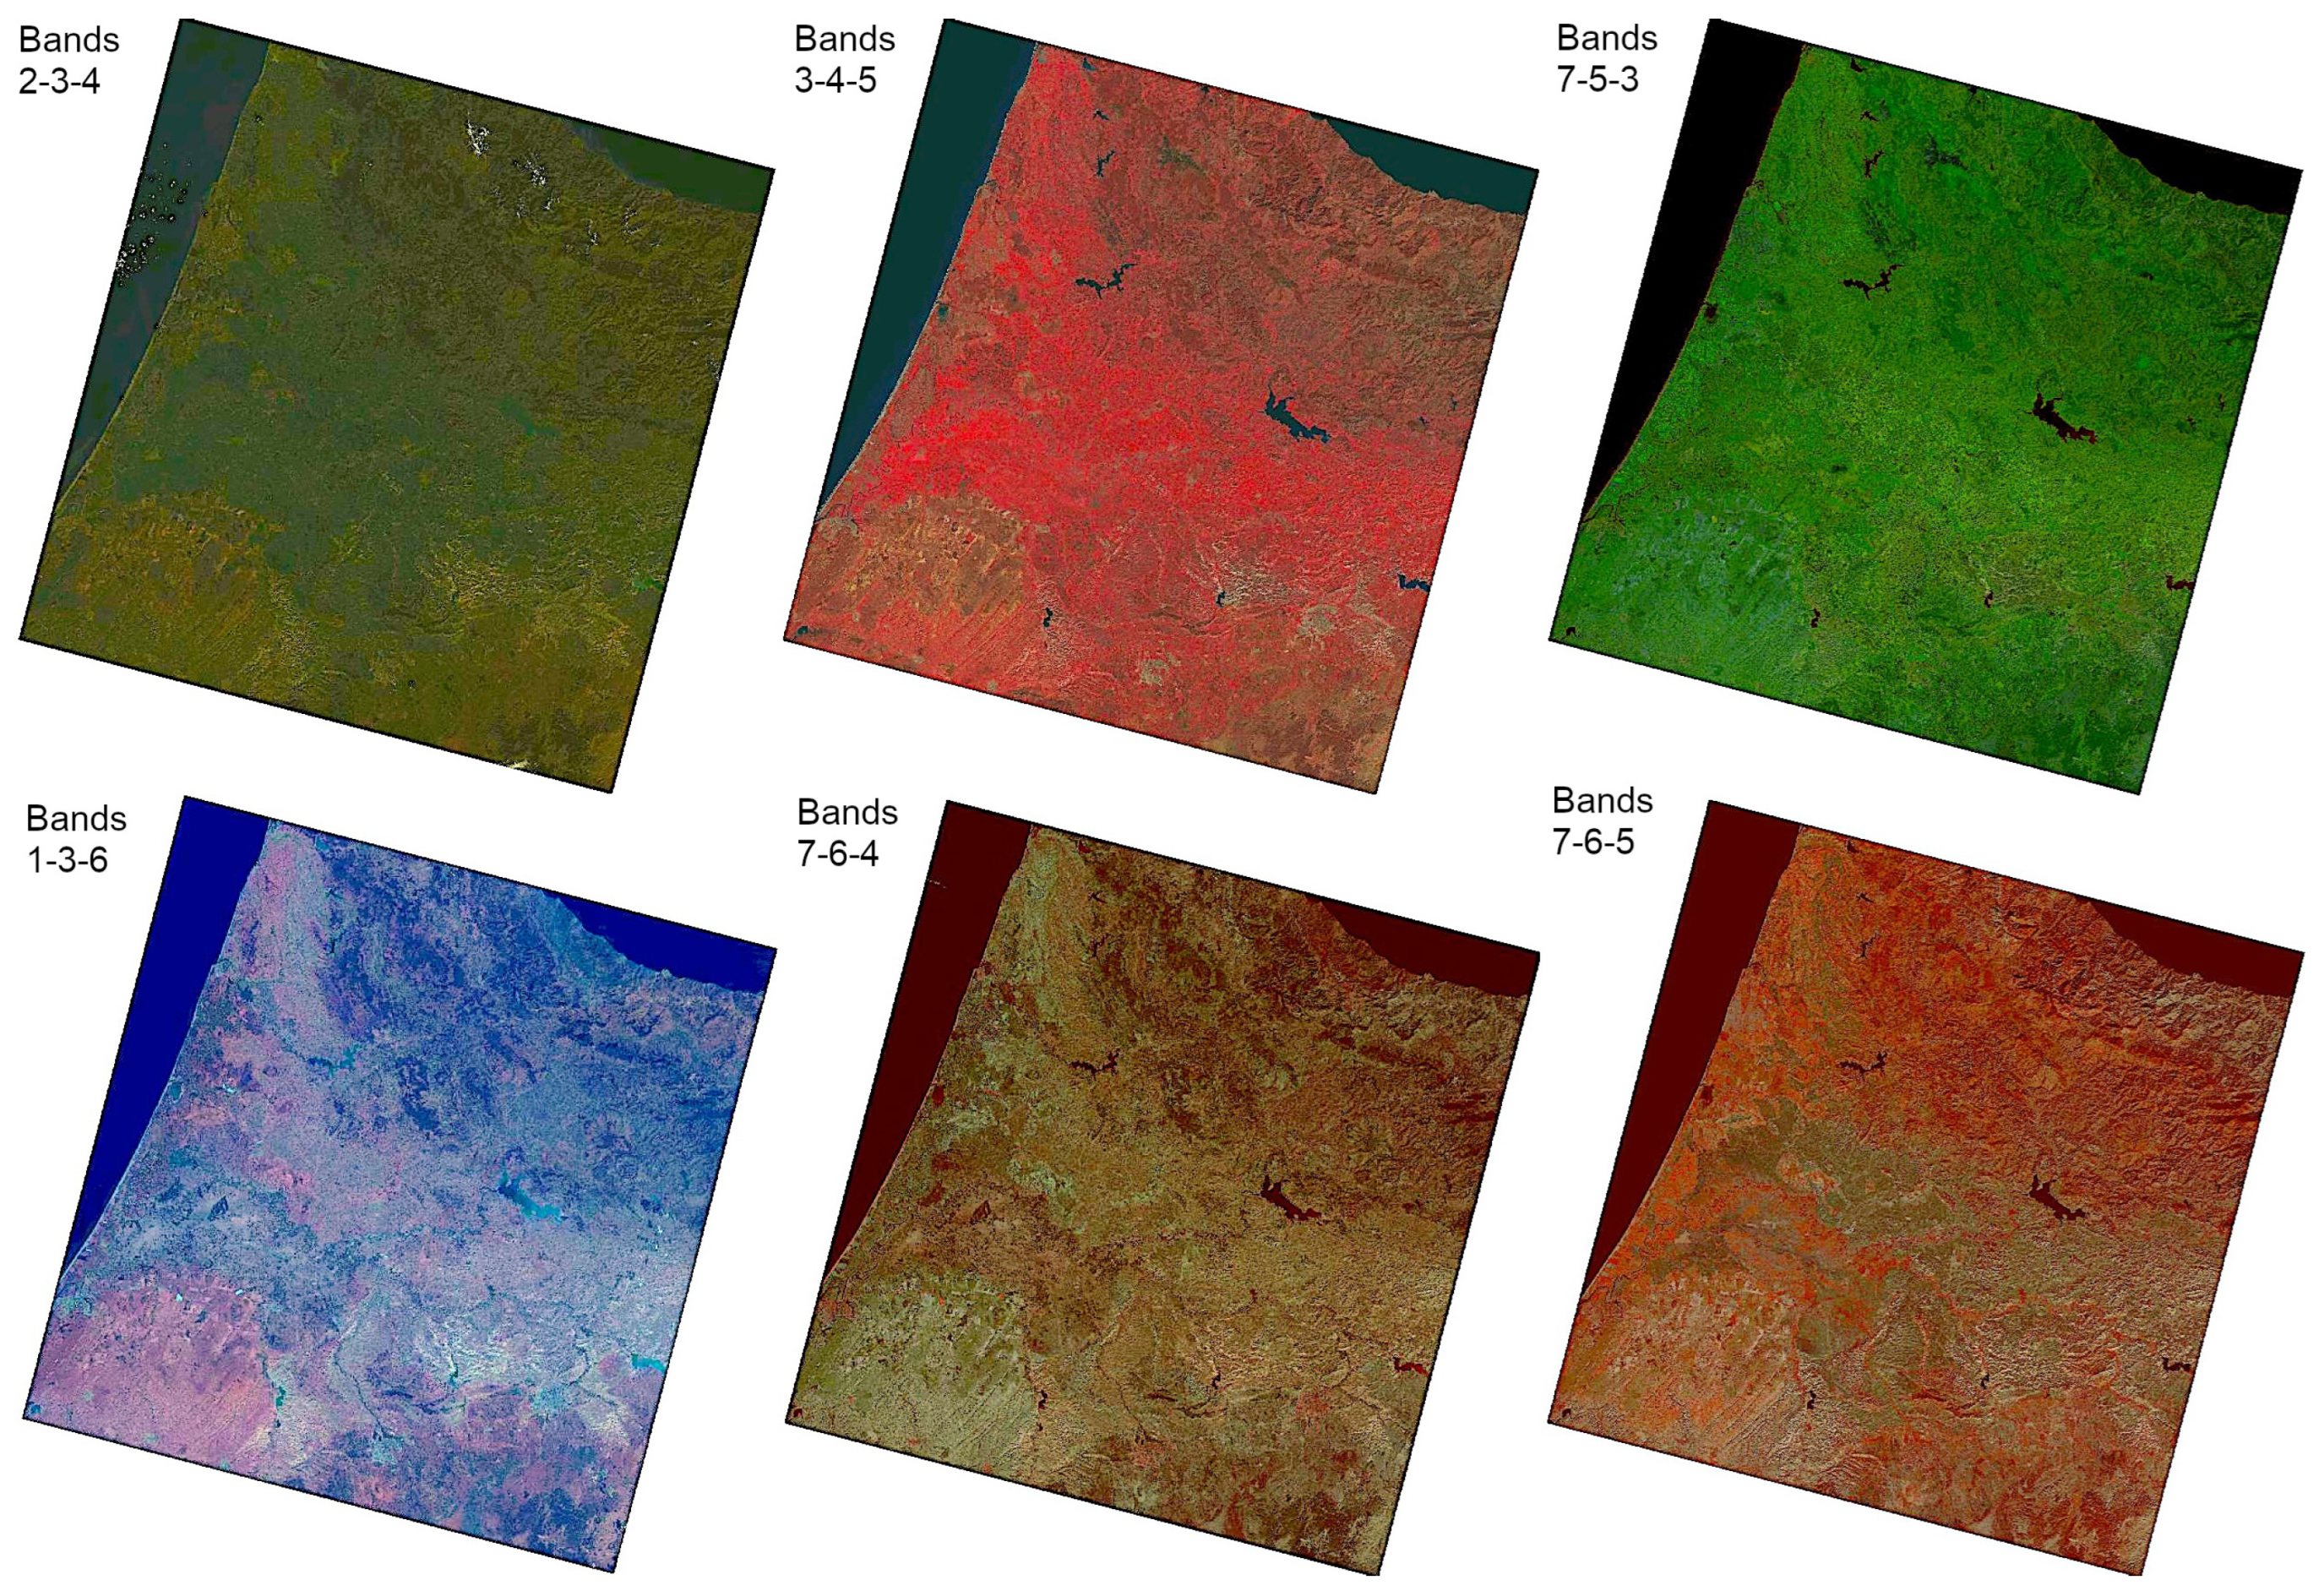
The creation of color composites (Figure 5) was performed based on the Landsat multispectral bands using the ‘r.composite’ module and the visualization of the images using the ‘d.rast’ module. The spectral combination calculation integrates different spectral bands of Landsat based on the physical properties of the land covers reflected in the images. Therefore, the spectral bands are useful to improve the discrimination between landscape classes. The estimation of the color composition model aims to better recognize the ten land cover classes, representing landscape patches in the Rif Mountains and its surroundings in the images. The vegetation observed on the Atlantic Ocean side appears in darker reds than the surrounding vegetation around the Rif Mountains. The water that absorbs almost all wavelengths is very dark, up to black, while the empty ground surface appears very light, in tones ranging from beige to ochre; see Figure 5. On the colored composition in “false colors”, the vegetation appears in different shades depending on the species, but also on the environmental conditions: the geomorphology of the mountain slope, the curvature, and the inclination of the slope affect the shadows on the images; Figure 5.
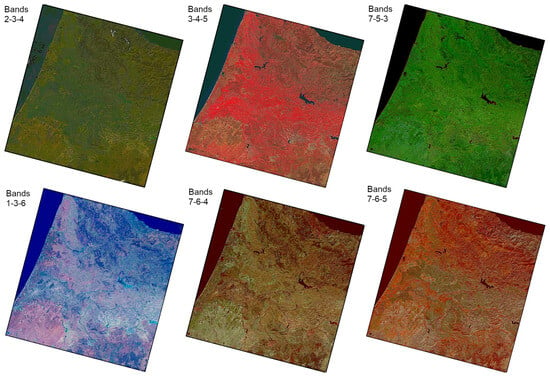
Figure 5.
Landsat 8-9 multispectral images: false and true color composites.
# Create the project with new location from raster map
(file must contain projection metadata):
# grass -c myraster.tif /home/user/grassdata/mynewlocation
grass
#cd /Users/polinalemenkova/grassdata
#grass -c LC09_L2SP_179073_20220419_20230421_02_T1_SR_B1.tif
/Users/polinalemenkova/grassdata/Morocco
# ----IMPORT AND PREPROCESSING-------------------------->
# g.mapset location=Morocco mapset=PERMANENT
g.list rast
# importing the image subset with 7 Landsat bands and display the raster map
r.import input=/Users/polinalemenkova/grassdata/Morocco/
LC09_L2SP_201036_20230126_20230313_02_T1_SR_B1.TIF
output=L9_2023_J_01 extent=region resolution=region --overwrite
r.import input=/Users/polinalemenkova/grassdata/Morocco/
LC09_L2SP_201036_20230126_20230313_02_T1_SR_B2.TIF
output=L9_2023_J_02 extent=region resolution=region
r.import input=/Users/polinalemenkova/grassdata/Morocco/
LC09_L2SP_201036_20230126_20230313_02_T1_SR_B3.TIF
output=L9_2023_J_03 extent=region resolution=region
r.import input=/Users/polinalemenkova/grassdata/Morocco/
LC09_L2SP_201036_20230126_20230313_02_T1_SR_B4.TIF
 output=L9_2023_J_04 extent=region resolution=region
r.import input=/Users/polinalemenkova/grassdata/Morocco/
LC09_L2SP_201036_20230126_20230313_02_T1_SR_B5.TIF
 output=L9_2023_J_05 extent=region resolution=region
r.import input=/Users/polinalemenkova/grassdata/Morocco/
LC09_L2SP_201036_20230126_20230313_02_T1_SR_B6.TIF
output=L9_2023_J_06 extent=region resolution=region
r.import input=/Users/polinalemenkova/grassdata/Morocco/
LC09_L2SP_201036_20230126_20230313_02_T1_SR_B7.TIF
 output=L9_2023_J_07 extent=region resolution=region
g.list rast
The modeling and simulation of the images using the principle of color compositions includes ‘true color’ and ‘false color’ images; see Figure 5. Here, the spectral bands of the images are visualized in several color combinations that are widely used in RS because they are very suitable for studying vegetation and landscape. For example, the combination with band number 5 (infrared, IR) is based on the properties of vegetation that reflect very strongly near-IR radiation.
# ----CREATING COLOR COMPOSITES----->
# false color
r.composite blue=L9_2023_J_07 green=L9_2023_J_05 red=L9_2023_J_03
 output=L9_2023_J_753 --overwrite
d.mon wx0
d.rast L9_2023_J_753
d.out.file output=Morocco_753 format=jpg --overwrite
# false color: NIR band B05 in the red channel, red band B04 in the green
channel and green band B03 in the blue channel
r.composite blue=L9_2023_J_03 green=L9_2023_J_04 red=L9_2023_J_05
 output=L9_2023_J_345 --overwrite
d.mon wx0
d.rast L9_2023_J_345
d.out.file output=Morocco_345 format=jpg --overwrite
# true color
r.composite blue=L9_2023_J_02 green=L9_2023_J_03 red=L9_2023_J_04
output=L9_2023_J_234 --overwrite
d.mon wx0
d.rast L9_2023_J_234
d.out.file output=Morocco_J_234 format=jpg --overwrite
4.6. Image Classification
The aim of image classification is to model the raster data and predict for each pixel a label, i.e. a Land Cover Class. In this work, image classification was performed using two principally distinct approaches: supervised classification and unsupervised classification. The use of an ML approach for satellite image processing by GRASS GIS consists of two phases. The first includes estimating a model from data by automatic clustering. The unsupervised clustering approach groups comparable samples within the same class using the k-means algorithm. The image clustering and classification groups samples according to the maximum likelihood algorithm (unsupervised learning) using the ‘i.cluster’ and ‘i.maxlik’ modules. The groups, i.e., the clusters, are made up of pixels with similar spectral values.
The unsupervised classification employs a clustering approach performed using the “i.cluster” module. The “i.cluster” generates a signature file and reports the cluster maps, or regions, that were automatically generated using the “k-means” data partitioning algorithm. The GRASS SIG code used for this is the following (example for the 2013 image, repeated for images from all other years using the same technique): “i.cluster group=L8_2013 subgroup=res_30m signaturefile=cluster_L8_2013 classes=8 reportfile=rep_clust_L8_2013.txt”. Therefore, samples within a class are dissimilar from the samples in others.
# ---Clustering and Classification ---->
# grouping data by i.group
# Set computational region to match the scene
g.region raster=L9_2023_J_01 -p
i.group group=L9_2023_J subgroup=res_30m \
input=L9_2023_J_01,L9_2023_J_02,L9_2023_J_03,L9_2023_J_04,
L9_2023_J_05,L9_2023_J_06,L9_2023_J_07 --overwrite
# Clustering: generating signature file and report using
k-means clustering algorithm
i.cluster group=L9_2023_J subgroup=res_30m \
  signaturefile=cluster_L9_2023_J \
  classes=10 reportfile=rep_clust_L9_2023_J.txt --overwrite
# Classification by i.maxlik module
i.maxlik group=L9_2023_J subgroup=res_30m \
  signaturefile=cluster_L9_2023_J \
  output=L9_2023_J_cluster_classes reject=L9_2023_J_cluster_reject
# Mapping
d.mon wx0
g.region raster=L9_2023_J_cluster_classes -p
r.colors L9_2023_J_cluster_classes color=bcyr
d.rast L9_2023_J_cluster_classes
d.legend raster=L9_2023_J_cluster_classes title="26 January 2023"
title_fontsize=14 font="Helvetica" fontsize=12 bgcolor=white
 border_color=white
d.out.file output=Morocco_2023_Jan format=jpg --overwrite
# Mapping rejection probability
d.mon wx1
g.region raster=L9_2023_J_cluster_classes -p
r.colors L9_2023_J_cluster_reject color=wave -e
d.rast L9_2023_J_cluster_reject
d.legend raster=L9_2023_J_cluster_reject title="26 January 2023"
title_fontsize=14 font="Helvetica" fontsize=12 bgcolor=white
border_color=white
d.out.file output=Morocco_2023_reject format=jpg --overwrite
In this way, each land cover class is associated with each cluster, correspondently. Calculating the pixel rejection probability was performed using accuracy assessment for quality control. After the unsupervised modeling is finished, the new data obtained are submitted as the training dataset for ML to obtain better image classification results. The clustering results are used as observation data available for supervised learning. The results of this step are used for ML as the training dataset. Subsequently, the ML processing of images was performed using supervised classification that uses a sequence of modules. The ability of ML to model geospatial data relies heavily on the acquisition of training data as the algorithm feeds on the input dataset, so this is an important step. ML classifies the images using the “r.learn.train” and “r.learn.predict” models.
This algorithm is based on the use of the ‘decision tree’ and ‘extra trees’ classifiers that are integrated into the GRASS GIS module ‘r.learn.train’. Here, the data are labeled, i.e., this is supervised learning with the technical specificities mentioned in the code below. First, the ‘r.random’ module was used to generate training pixels from a previous classification of the land cover of Morocco. All these algorithms were implemented using the GRASS GIS module ‘r.learn.train’ using the programming code presented below.
# MACHINE LEARNING ------>
# g.list rast
g.region raster=L9_2023_J_01 -p
# First, we are going to generate some training pixels from an older (1996)
land cover classification:
r.random input=L9_2023_cluster_classes seed=100 npoints=1000
raster=training_pixels --overwrite
# Next, we create the imagery group with all
Landsat-8 OLI/TIRS 7 (2000) bands:
i.group group=L9_2023_J
input=L9_2023_J_01,L9_2023_J_02,L9_2023_J_03,L9_2023_J_04,
L9_2023_J_05,L9_2023_J_06,L9_2023_J_07 --overwrite
# Then use these training pixels to perform a classification on
recent Landsat - 2022 image:
#
# train a decision tree classification model using r.learn.train
r.learn.train group=L9_2023_J training_map=training_pixels \
    model_name=DecisionTreeClassifier n_estimators=500
    save_model=rf_model.gz --overwrite
# perform prediction using r.learn.predict
r.learn.predict group=L9_2023_J load_model=rf_model.gz
 output=rf_classification --overwrite
# check raster categories - they are automatically applied
to the classification output
r.category rf_classification
# copy color scheme from landclass training map to result
r.colors rf_classification raster=training_pixels
# display
d.mon wx0
d.rast rf_classification
r.colors rf_classification color=roygbiv -e
d.legend raster=rf_classification title="Decision Tree: 01/2023"
title_fontsize=14 font="Helvetica" fontsize=12 bgcolor=white
border_color=white
d.out.file output=DT_2023_01 format=jpg --overwrite
In the next step, the prediction was performed using the module “r.learn.predict” which was performed in the code: “r.learn.predict group=L8_2013 load_model=rf_model.gz output=rf_classification”. The raster categories were examined using the module “r.category” of GRASS SIG, based on the data automatically applied to the classification output. For this, the following code was used: “r.category rf_classification”. The maps were visualized using the following combination of two main modules: “d.rast” which visualizes the map itself and “d.legend" which adds the legend to this map. The images were converted to bitmap format using the module “d.out.file", e.g., “d.out.file output=Maroc_2013 format=jpg”.
# train a extra trees classification model using r.learn.train
r.learn.train group=L9_2023_J training_map=training_pixels \
   model_name=ExtraTreesClassifier n_estimators=500
   save_model=rf_model.gz --overwrite
# perform prediction using r.learn.predict
r.learn.predict group=L9_2023_J load_model=rf_model.gz  output=rf_classification --overwrite
# check raster categories applied to the classification output
r.category rf_classification
# copy color scheme from landclass training map to result
r.colors rf_classification raster=training_pixels
# display
d.mon wx0
d.rast rf_classification
r.colors rf_classification color=bgyr -e
d.legend raster=rf_classification title="Extra Tree: 01/2023"
title_fontsize=14 font="Helvetica" fontsize=12 bgcolor=white
border_color=white
d.out.file output=ET_2023_01 format=jpg --overwrite
This was used as a basis for ML using the following code: “r.random input=L8_2013_cl uster_classes seed=100 npoints=1000 raster=training_pixels”. After that, the “r.learn.train” module was used to train a module using the training map that was created in the previous step by applying the built-in algorithm. The code used is as follows: “r.learn.train group=L8_2013 training_map=t_pixels model_name=DecisionTreeClassifier n_estimators=500 save_model=rf_model.gz”. For all approaches, the model name was changed using the “model_name” function and the name of the model in question, e.g., “modelage=RandomForestRegressor”.
Since the pixel labels are discrete (and not continuous which requires the use of regression), the classification methods ‘decision trees’ and ‘supplementary trees’ were chosen. These ML algorithms predict the probability of pixel values suitable for the target class on the image. Therefore, the machine performs a classification of the image pixels into 10 land cover classes on the Rif Mountains. The categorization of the classes was carried out using the ‘r.category’ module of GRASS GIS.
Finally, the visualization of images was achieved using the auxiliary graphic modules of GRASS GIS for cartographic processing: ‘d.mon’, ‘d.rast’, ‘r.colors’ and ‘d.legend’. The images were saved as bitmap files using the module ‘d.out.file’. The calculation and estimation of classification accuracy are carried out by the function ‘reject’ for the evaluation of the probability of the percentage of correctly classified pixels on the image. The evaluation of image processing quality and algorithm performance is conducted by GRASS GIS.
5. Results and Discussion
5.1. Analysis of Findings
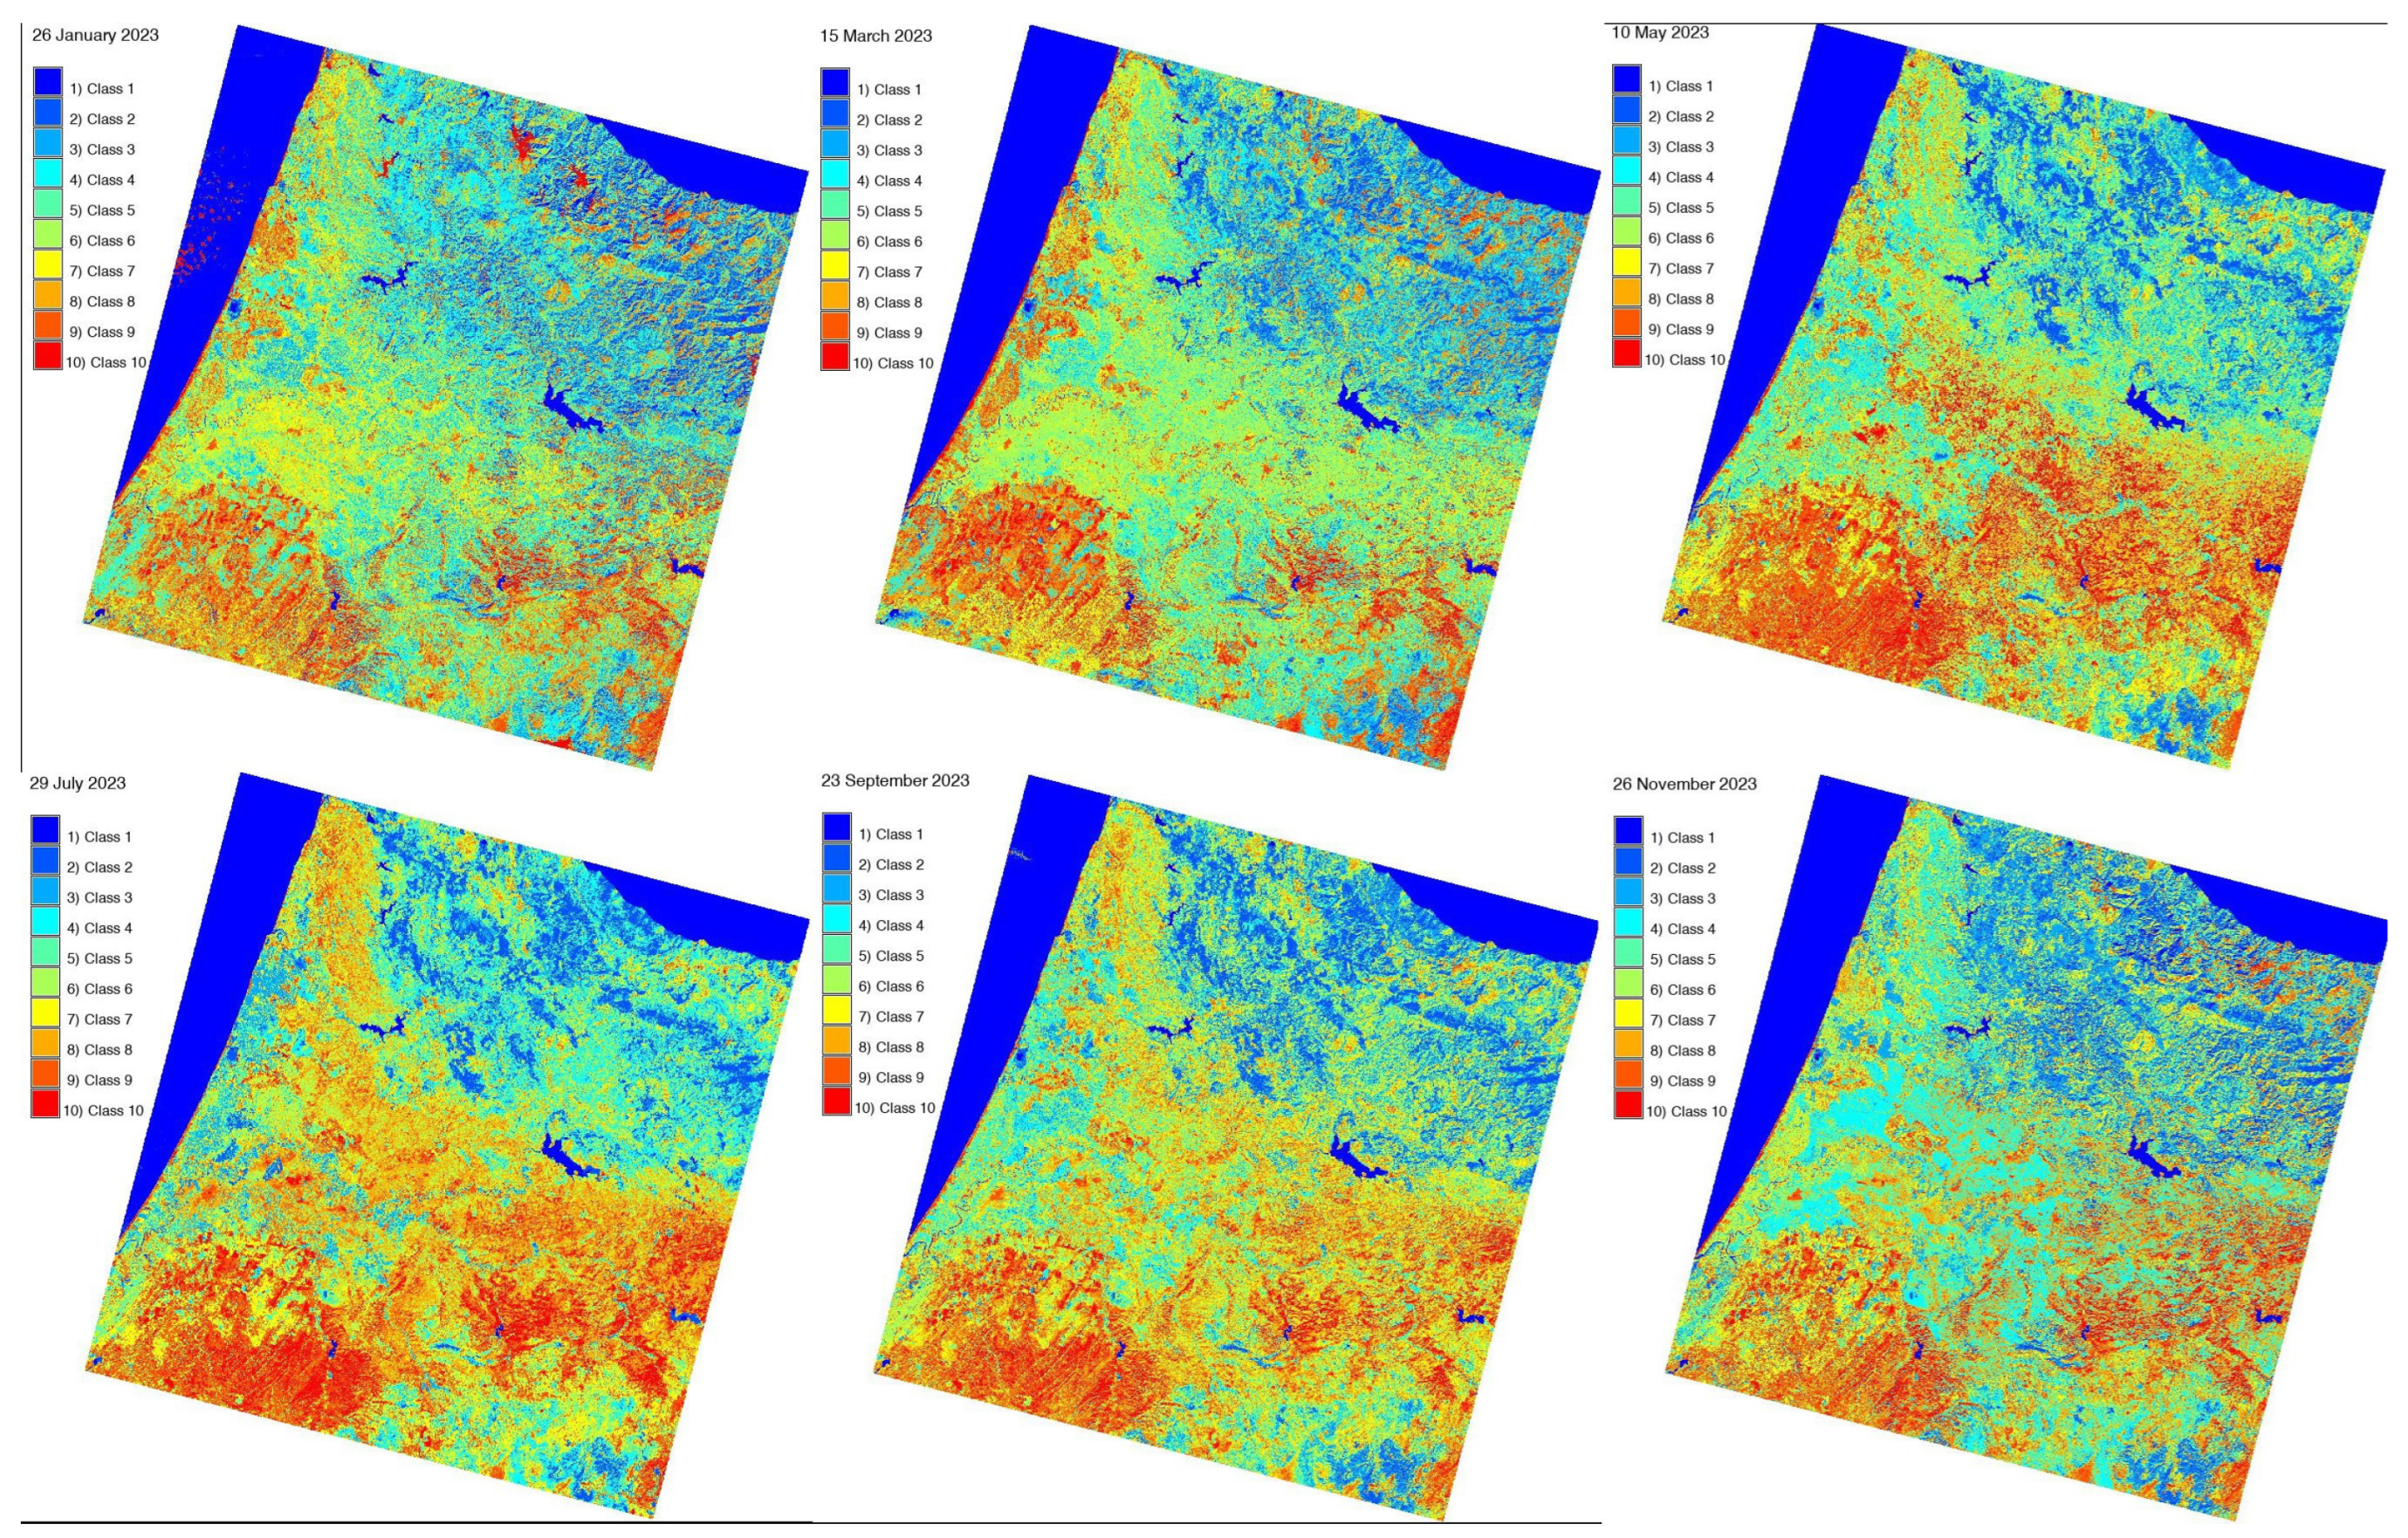
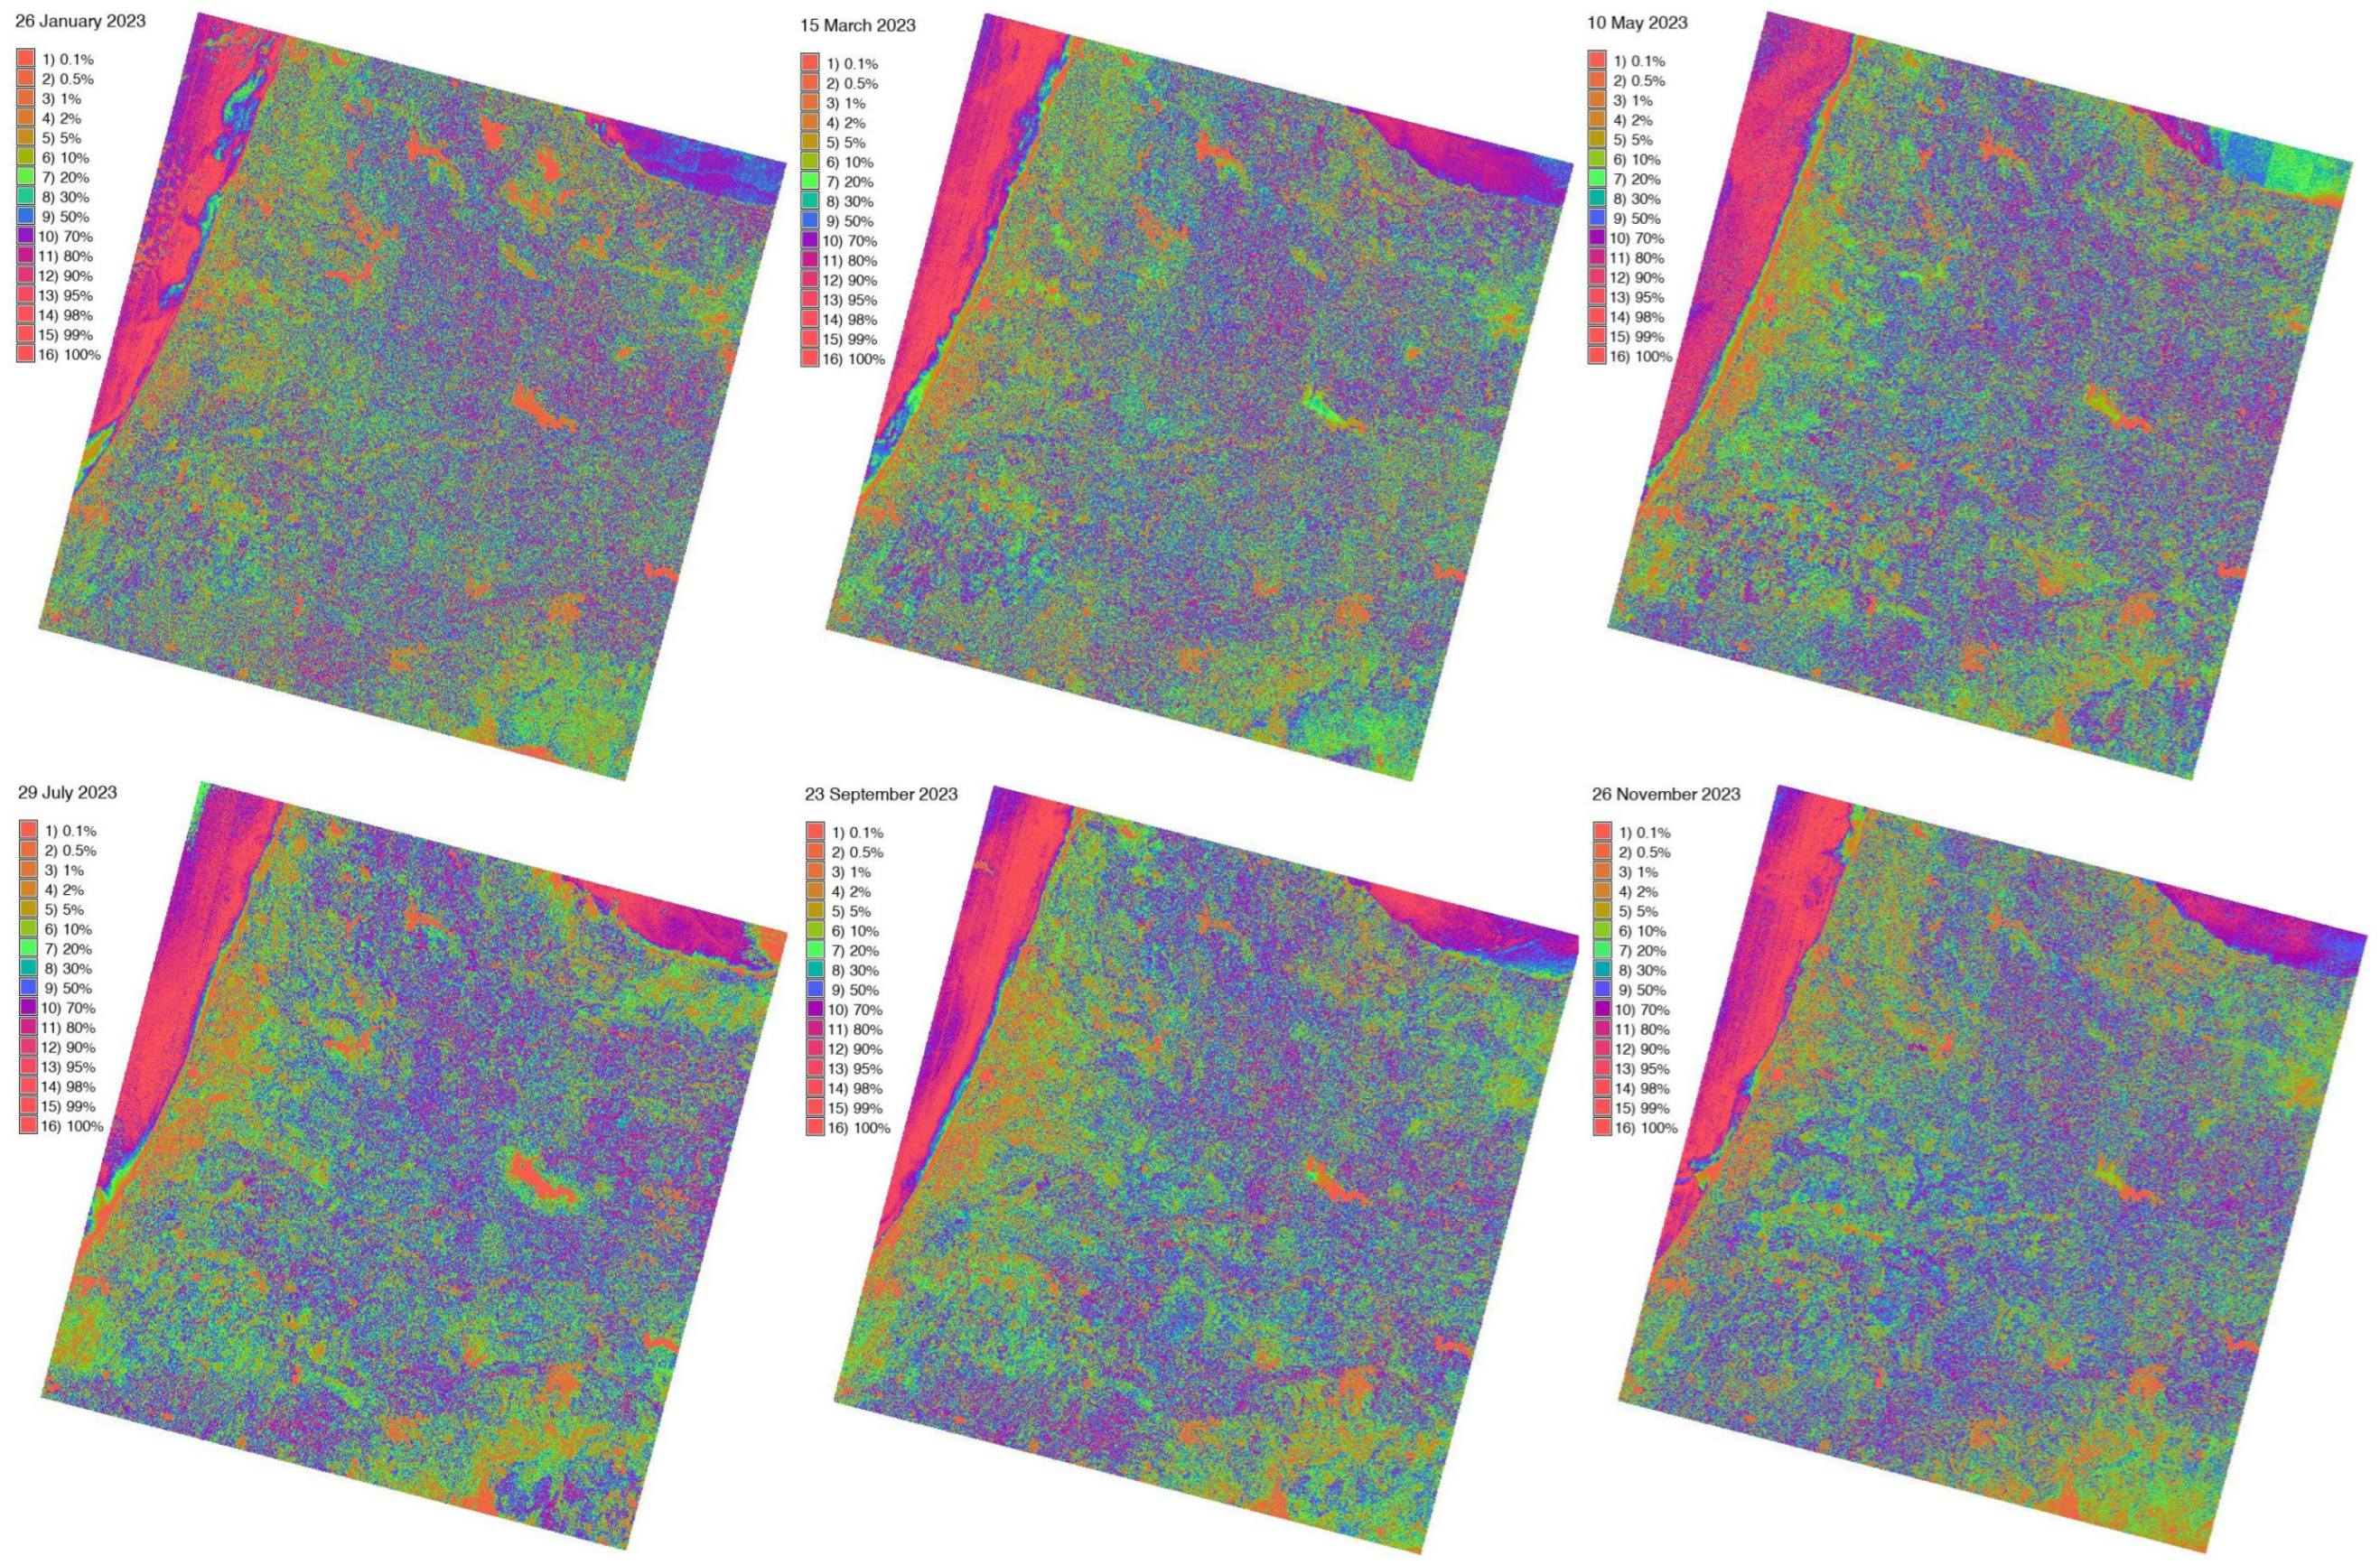
Mountain areas in northern Morocco are particularly sensitive to climate change and pastoral activities. Seasonal variations in climate and effects from human activities strongly influence agro-ecosystems and cause changes in land cover types. Although there are currently some efforts to map the landscape dynamics in such areas, any seasonal response of the land cover types will be better evaluated using a quantitative assessment of the RS data and ML methods. Using examples from the Rif Atlas in Morocco, this paper explored the seasonal variations in land cover types in northern Morocco in 2023 caused by the effects from livestock management, arboriculture, and climate change. The selected period was assessed for the year 2023 using the available time series from Landsat dataset collection. The results of satellite image classification were obtained using three approaches: unsupervised classification and supervised classification by ML methods which employs two distinct algorithms: “Decision tree classifier” and “Extra tree classifier”. Figure 6 shows the images generated using the clustering classification method, which illustrate the land cover changes with a bi-monthly time interval; see Table 1.
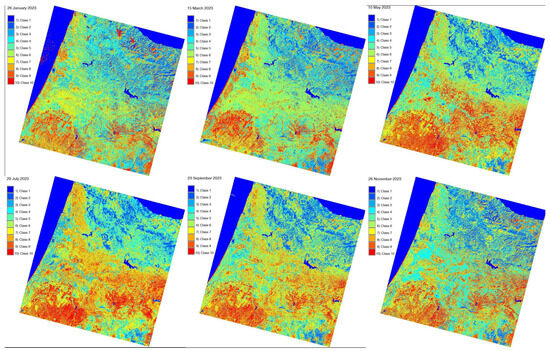
Figure 6.
Satellite image classification using unsupervised classification clustering methods and the GRASS GIS ‘MaxLike’ approach.

Table 1.
Bimonthly variations in Rif Mountains by pixels over 10 land cover classes in 2023 in two (cold/hot) different seasons: (1) January, March, and May; (2) July, September, and November.
5.2. Interpretation of Land Cover Types
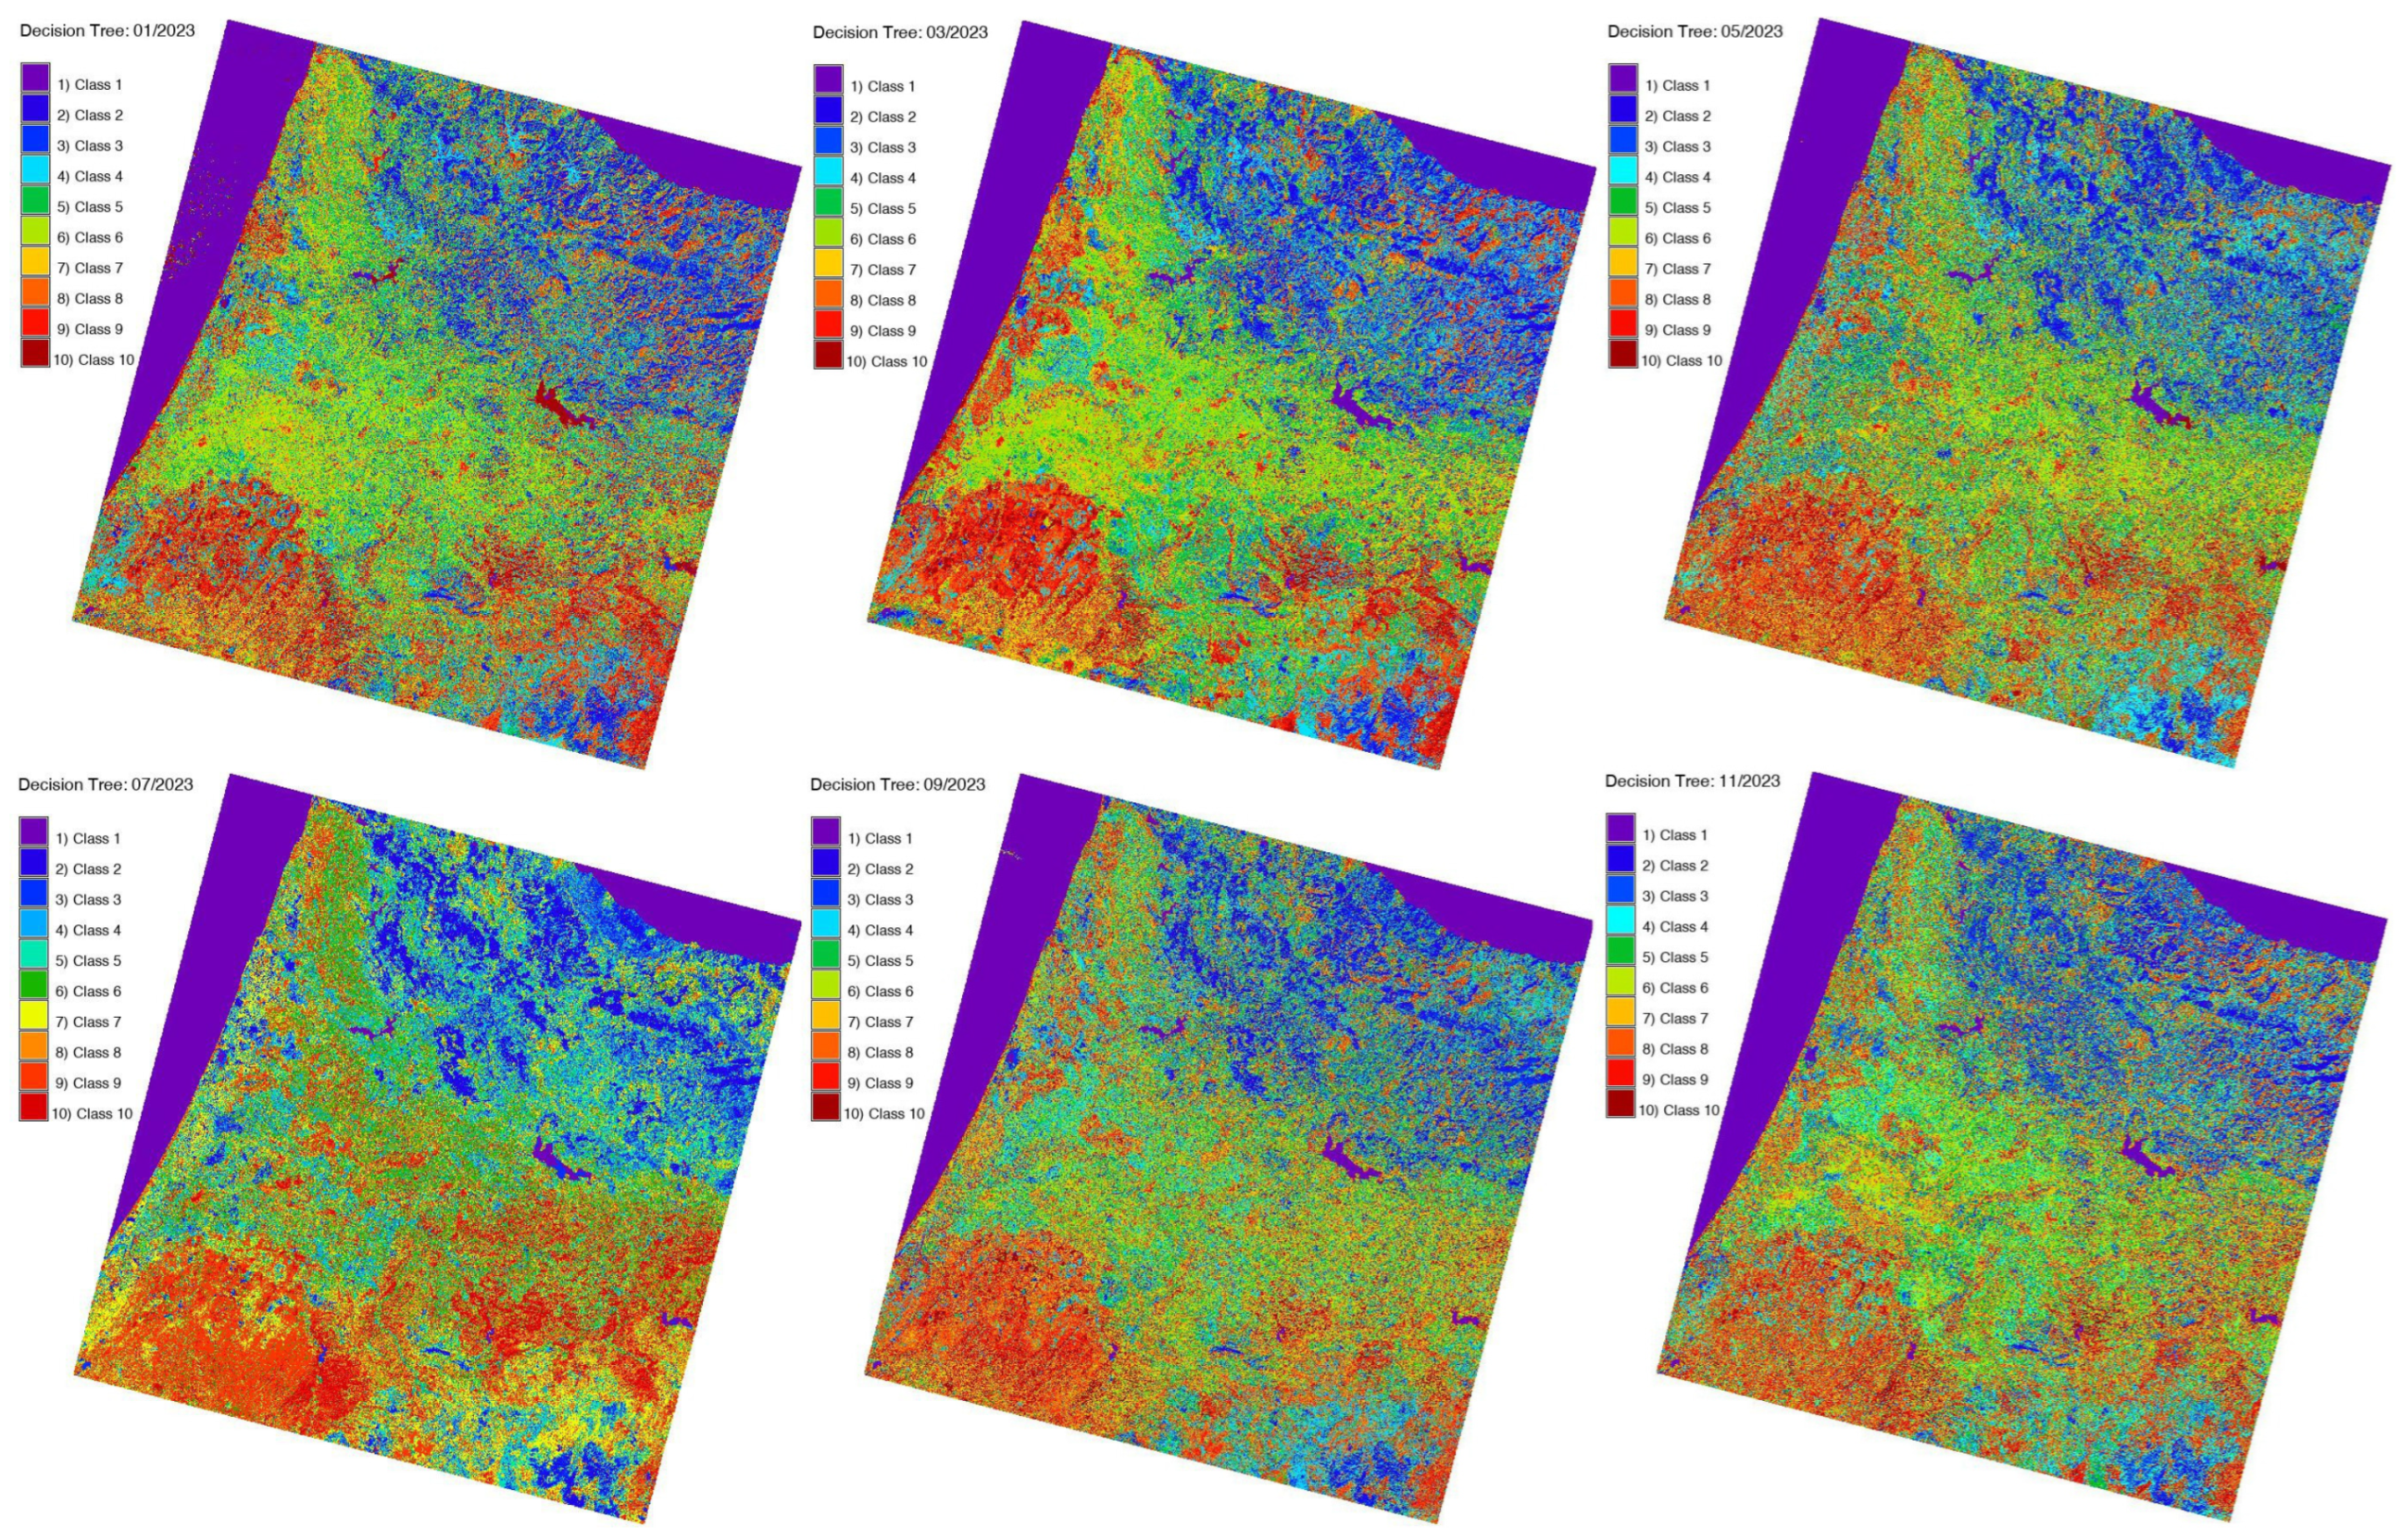
Figure 7 shows that the classification using the “decision tree classifier” method improved the results since the ML results are more robust and stable compared to the unsupervised classification. The January scene shows the least plant activity which gradually increases from March to May and decreases, respectively, after the hot summer period until November. Vegetation varied seasonally in the Rif region according to the natural dynamics of the phenological cycle during different calendar months. The maps show seasonal changes in 10 categories of land cover classes that reflect landscape variations: (1) water; (2) broadleaved forest; (3) grassland; (4) wetlands; (5) urban areas; (6) coniferous forest; (7) shrubland (thicket); (8) sparse vegetation in semi-deserts; (9) bare areas; (10) cropland. The comparison of the obtained results was performed using the existing classification schemes in studies on land cover types in Morocco [98,99,100,101,102].
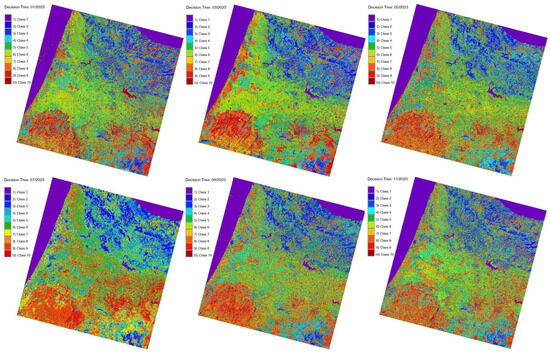
Figure 7.
Results of satellite image classification using supervised ML method with GRASS GIS ‘Decision Tree’ algorithm.
The identified 10 land cover classes were generalized from the FAO-based land cover classes in Morocco; see Figure 2. The most important type of land cover categories in northern Morocco is pastures, which include steppes, high meadows, and semi-desert lands with occasional vegetation inclusions. Pastures provide nourishment for livestock and resources for population. Nevertheless, as a result of overgrazing without land management, millions of hectares of pastures are being degraded in northern Morocco which causes environmental degradation. On the satellite images, the decrease in land cover types ‘Grassland’ and ‘sparse vegetation in semi-deserts’ is notable through the comparison of the classified images.
Another environmental issue in Morocco is presented by the degradation of forests, which is mostly caused by human activities such as resource exploration (quarries and other geologic activities), urbanization with the associated extension of built-up areas and constructed roads, the effects from agricultural activities which include the replacement of areas formerly occupied by forest to croplands and agricultural lands, and finally, the overgrazing and conversion of natural lands to rangeland. Deforestation is visible by comparing classified satellite images (class “Forests”).
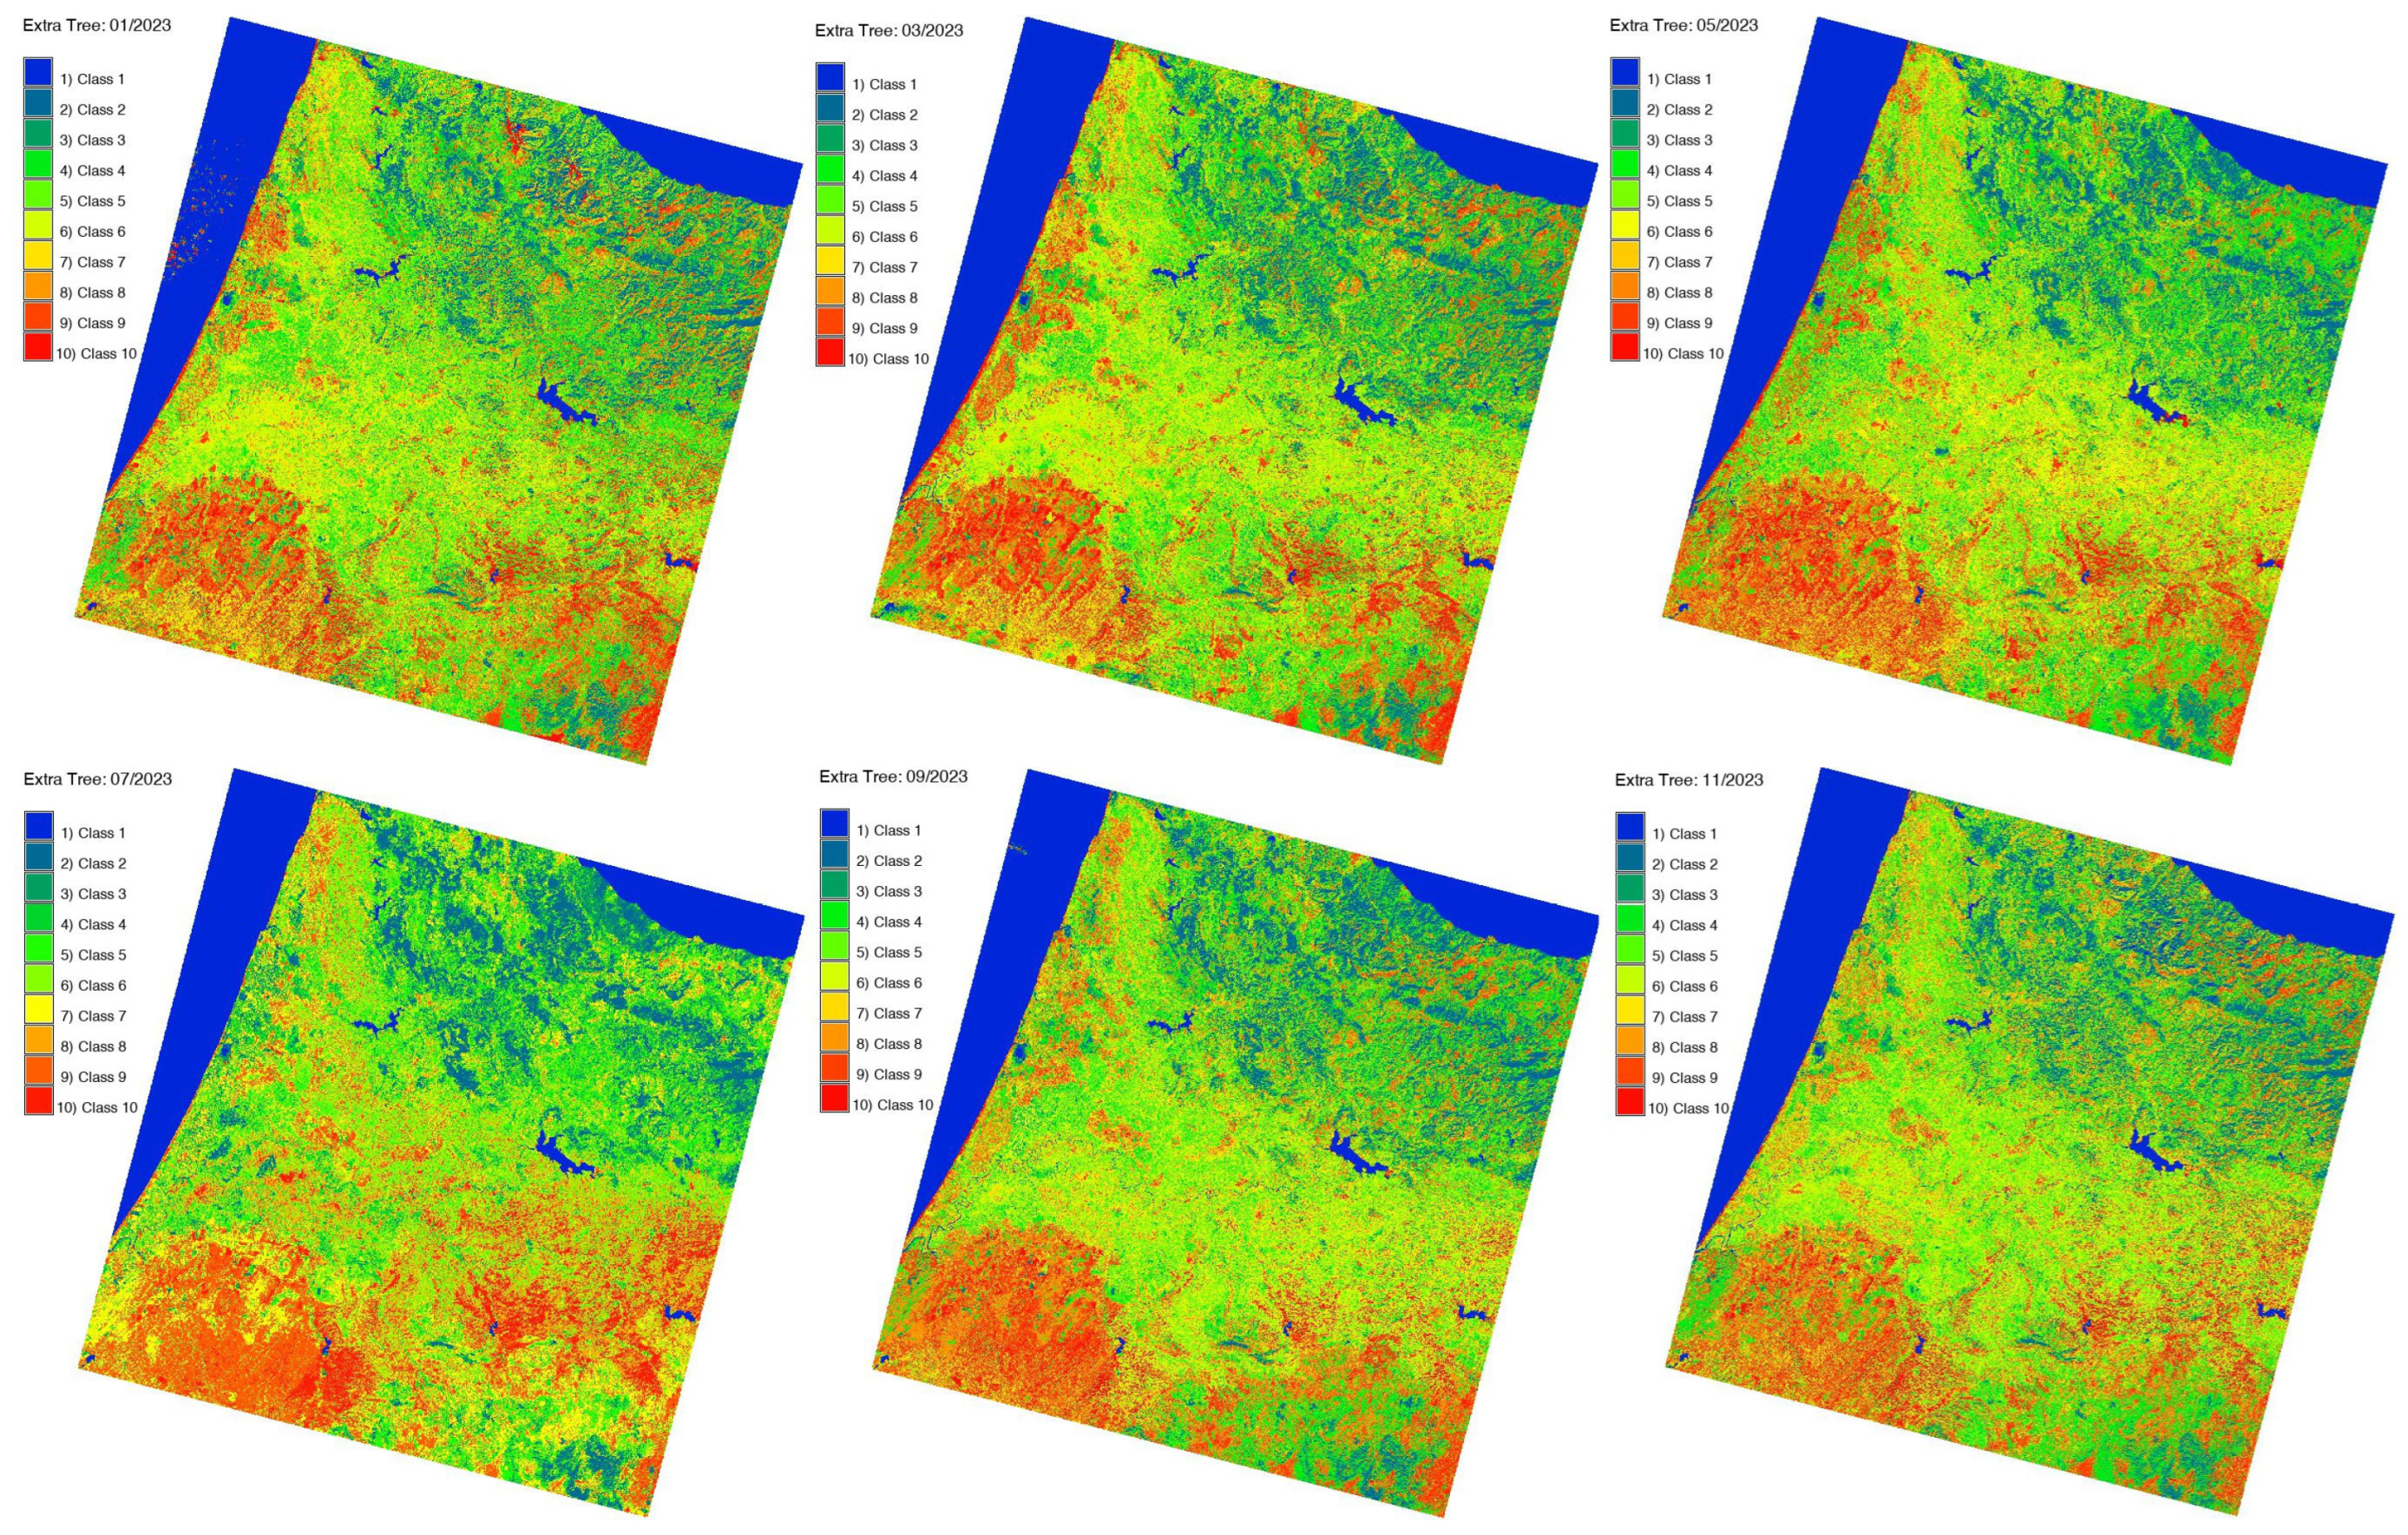
Compared to other land cover types, the mosaic vegetation types of deciduous forests developed partially and differently for both algorithms, with more density and a homogeneous pattern across the entire study area. Figure 8 shows the land cover type patterns over the Rif Mountains and surrounding areas, defined using an improved ML algorithm. The analysis of the presented maps approved the previously reported current environmental problems of Morocco which include deforestation, overgrazing [103], soil erosion, landscape deterioration and desertification [104,105,106], water scarcity, and climate change [107]. Besides natural variability of the Rif region, forest areas are affected by human factors (socio-demographic, economic, and urban dynamics) and hazards caused by erosion and forest fires [108]. The expansion of agricultural lands negatively affects the mountainous forests of the Rif [109,110,111]. In addition, the contrasts from hot and humid climates and the varied topography of the Rif facilitates landslides that present geomorphological risks in Northern Morocco [112,113,114].
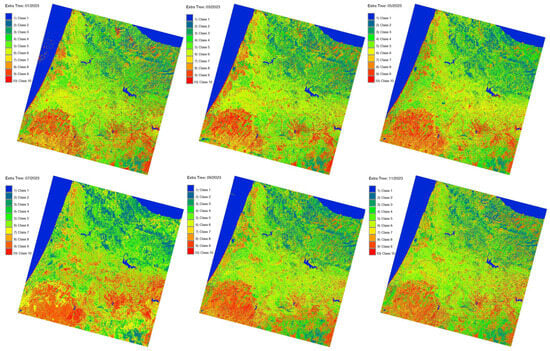
Figure 8.
Results of satellite image classification using supervised ML method with GRASS GIS ‘Extra Tree’ algorithm.
5.3. Comparison Between Performance of Algorithms
Selecting the optimal method of land cover modeling ensures the formalization of our understanding of Earth‘s environmental system and dynamics through the quantification of various landscape elements. By quantifying the distribution of land cover types, cartographic models enable the interpretation of relations between patches that constitute a complex mosaic of Earth’s landscape which integrates different components into a coherent framework. Therefore, technical improvements of the parameters that differ in various algorithms ‘MaxLike’, ‘DecisionTreeClassifier’, and ‘ExtraTreesClassifier’ were assessed to analyse the best performance of the algorithms for land cover mapping.
The most complex landscape patches with high heterogeneity can be better distinguished, including sparsely distributed and densely distributed vegetation segments. Compared to the previous results in Figure 6 and Figure 7, the results of the Extra tree are not quite similar for the classification maps based on the “Decision tree” (Figure 7) and “Extra tree” algorithms (Figure 8), because they rely on the extremely random trees method. The “Extra tree” algorithm is similar to the random forest algorithm in its nature, but it processes images much faster. Therefore, technically, this algorithm is an improved ensemble supervised ML method.
However, this algorithm creates many decision trees using random sampling of pixels for each tree. The most important and unique feature of the “Extra trees” algorithm is that it randomly selects a pixel division value. Therefore, compared with the “decision tree” algorithms, the land cover types are diverse and uncorrelated. The best performance among the three image processing methods is demonstrated by the “decision tree” algorithms, which divide the image into land cover classes with precision and detail.
- 1: Bimonthly class separability matrices between 10 classes of land cover types in Rif Mountains, Morocco: January and March 2023 (1).
- 2: Bimonthly class separability matrices between 10 classes of land cover types in Rif Mountains, Morocco: May and July 2023 (2).
- 3: Bimonthly class separability matrices between 10 classes of land cover types in Rif Mountains, Morocco: September and November 2023 (3).
The visualization of Earth landscapes using cartographic methods has many approaches; one of them is the use of RS data. This method uses satellite images as input data for their processing and classification. Typically, cartography relies on the use of traditional GIS methods that can produce a visualization using a defined workflow dependent on a particular software. The detection of land cover types depicted on these maps is perceptible to the human eye depending on the spatial and temporal resolution of the RS data. However, the use of automation and ML approaches facilitates image processes, thanks to a more objective and accurate classification of satellite images.
5.4. Bimonthly Evaluation of the Land Cover Types
The bimonthly evaluation of land cover types offers an advantage over annual dynamics, where usually the landscape is evaluated at the same time but with intervals of several years. In contrast, bimonthly evaluations enable a more close look into the gradual slight changes that are caused by the seasonal climate effects. Complex interactions between human activities, climate change, and environmental dynamics result in a high vulnerability of landscapes and ecosystems in Morocco. This is particularly important in northern Morocco, a region which is highly sensitive to the contrasting effects of climate variability, ranging from the arid Sahara to the humid Mediterranean, and where current land cover types are affected by pastoralism. As well as highlighting the current distribution of land cover types in northern Morocco, using RS data processed by ML algorithms presents new maps that allow for the quantification of land cover changes computed in pixels. For instance, numerical analysis has revealed that even for the least modified areas of bare areas located near desert, regional inventories show slight changes over diverse seasonal periods during the calendar year. Spatial biases are also apparent if comparing such land cover types as grassland, croplands, and forests.
5.5. Accuracy Assessment
The accuracy assessment is presented in Figure 9 and the computational results are available in Table 2 and Table 3. The spectral reflectance of these elements can be formally evaluated through digital numbers read from the satellite images using ML algorithms. Hence, selecting an optimal approach that accurately discriminates pixels on the image and identifies their category correctly presents an important process in cartographic framework. The suitability of algorithms has been assessed according to four criteria: (1) ease of constructing using functionality of GRASS GIS modules, (2) the ability of the algorithm to derive physical insight into land cover types from the satellite images for environmental investigation, (3) the ability to use each model to make quantitations based the processed satellite data and to generate numerical reports, (4) accuracy assessment in which the models might be tested.
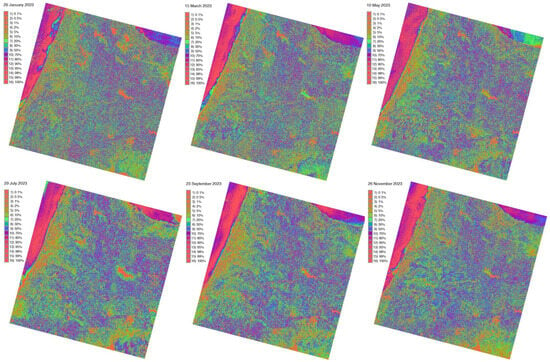
Figure 9.
Accuracy evaluation using computed correctly classified pixels (%), GRASS GIS.

Table 2.
Bimonthly evaluation of the class means of Digital Numbers (DN) computed for pixels assigned to 10 land cover classes in landscapes of Rif Mountains, north Morocco. Each multispectral band (1 to 7) of Landsat 8-9 OLI/TIRS is evaluated. Period: 2023, January to May.

Table 3.
Bimonthly evaluation of the class means of Digital Numbers (DN) computed for pixels assigned to 10 land cover classes in landscapes of Rif Mountains, north Morocco. Each multispectral band (1 to 7) of Landsat 8–9 OLI/TIRS is evaluated. Period: 2023, July to November.
Here, the rejection threshold map contains the index of a confidence level calculated for each classified pixel in the classified image of the 10 land cover classes in the Morocco region. Confidence intervals are defined and the rejection map is visualized with lower values meaning ‘keep the correctly classified pixel’ and higher values meaning “reject a misclassified pixel that could belong to another class category”. Thus, this map identifies cells in the classified raster image that have a low probability, i.e., a high rejection index, of being correctly assigned to the target class.
The maps describing land use in the Rif mountain region are scientific and useful decision-making tools for Moroccan authorities and educational institutions. The images processed by the GRASS GIS methods can be used in research work as the input data for modeling systems of bimonthly vegetation cycles in the geomorphological context of the Rif. In addition, they can also be used for the operational monitoring of bimonthly vegetation changes in northern Morocco in order to apply research recommendations that require precise knowledge of the Rif territories.
Additionally, the stability of the computed points during performed iterations of the classification are summarised in Table 4. They include the convergence of classes in bimonthly periods: January, March, May, July, September and November 2023.

Table 4.
Computed points stability for iterations during classification and convergence of classes: January, March, May, July, September and November 2023.
The statistical analysis with computed initial means for each class of pixels in multispectral bands of the satellite images are provided in Appendix A. Additionally, standard deviations for Digital Numbers (DNs) of pixels are computed by 10 corresponding classes with results reported in Appendix B.
6. Conclusions
The general objective of this paper was to improve the production of land cover maps in northern Morocco using ML methods of GRASS GIS. Our results clearly show that the land cover types in northern Morocco are changing. Nevertheless, the dynamics of such changes are vastly underrepresented in existing case studies on environmental mapping in northern Africa. At the same time, satellite images present the largest provider of information on the distribution of landscape patches and vegetation. To this end, we applied the advanced algorithms ‘Decision trees’ and ‘Extra trees’ for processing a time series of the Landsat 8-9 OLI/TIRS satellite images.
More than this, however, we have also shown the technical difference between the unsupervised and supervised classification (clustering) of RS data. This is useful for the further development of cartographic methods of RS data processing in the paradigm of information processing systems. Therefore, the specific objective of this paper aims to improve land cover mapping in northern Morocco from the time series of Landsat satellite images using ML methods by GRASS GIS and cartographic scripts. Two challenges have been identified in this work. The first concerns the technical choice of the classification algorithm (supervised “DecisionTreeClassifier” and “ExtraTreesClassifier” vs unsupervised clustering by MaxLike) using GRASS GIS, while the second concerns the identification of seasonal bimonthly landscape dynamics in the Rif Mountains of Morocco using repetitive data cycles from January to November 2023. A comparison of these data enabled the relationship between the growth of vegetation and mountain geomorphology to be revealed.
Taken together, this paper shows that the least well recorded region of the northern Morocco is largely affected by environmental changes: the comparison of presented maps showed the dynamics of agricultural and forest areas in the order of 7–10% within the year of 2023, and a slight increase in bare soil of 8% during the same year. Moreover, a notable change in the areas occupied by deciduous and mixed forest is detected. Currently, there are no land cover maps available for Morocco that depict bimonthly dynamics of land cover types for the region of the Rif Mountains. In this regard, this paper contributes to improve this gap through presenting new maps for further evaluating of biophysical and environmental parameters in Northern Morocco.
This paper demonstrated the implementation of the ML cartographic approach to RS data processing, technically performed using GRASS GIS tools. The presented work enabled the building of a classification workflow of six multispectral satellite images covering Northern Morocco, around the Rif Mountains. Several applications of the presented results and the GRASS GIS satellite image processing methods are described in this paper. The demonstrated maps show the dynamics in the land cover of northern Morocco, which presents the environmental dynamics that reflect the impact factors from regional ecological, vegetal, and geological settings in North Africa.
Funding
The publication was funded by the Editorial Office of Geomatics, Multidisciplinary Digital Publishing Institute (MDPI), who provided a 100% discount for the APC of this manuscript.
Institutional Review Board Statement
Not applicable.
Informed Consent Statement
Not applicable.
Data Availability Statement
Data are contained within the article.
Acknowledgments
The author thanks the reviewers for reading and reviewing this manuscript.
Conflicts of Interest
The author declares no conflicts of interest.
Abbreviations
The following abbreviations are used in this manuscript:
| API | Application Programming Interface |
| DTC | Decision Tree Classifier |
| ETC | Extra Trees Classifier |
| EO | Earth Observation |
| FAO | Food and Agriculture Organization |
| GRASS | Geographic Resources Analysis Support System |
| GIS | Geographic Information System |
| Landsat OLI/TIRS | Landsat Operational Land Imager and Thermal Infrared Sensor |
| GEBCO | General Bathymetric Chart of the Oceans |
| GMT | Generic Mapping Tools |
| QGIS | Quantum Geographic Information System |
| ML | Machine Learning |
| RS | Remote Sensing |
| SWIR | Shortwave Infrared |
| NIR | Near Infrared |
| USGS | United States Geological Survey |
| WGS84 | World Geodetic System 84 |
Appendix A. Initial Means for Classes of Pixels in Each Multispectral Band of the Landsat OLI/TIRS Satellite Images

Table A1.
January 2023: initial means for each multispectral band of Landsat OLI/TIRS images.
Table A1.
January 2023: initial means for each multispectral band of Landsat OLI/TIRS images.
| Class | Band 1 | Band 2 | Band 3 | Band 4 | Band 5 | Band 6 | Band 7 |
|---|---|---|---|---|---|---|---|
| Class 1 | 7353.24 | 7533.21 | 8177.38 | 7818.66 | 10,987.1 | 10,158.3 | 8739.9 |
| Class 2 | 7569.99 | 7774.52 | 8500.84 | 8237.08 | 11,888.8 | 10,959.1 | 9396.37 |
| Class 3 | 7786.75 | 8015.83 | 8824.3 | 8655.49 | 12,790.5 | 11,759.9 | 10,052.8 |
| Class 4 | 8003.51 | 8257.14 | 9147.76 | 9073.91 | 13,692.2 | 12,560.7 | 10,709.3 |
| Class 5 | 8220.27 | 8498.45 | 9471.21 | 9492.32 | 14,593.9 | 13,361.5 | 11,365.8 |
| Class 6 | 8437.03 | 8739.76 | 9794.67 | 9910.73 | 15,495.6 | 14,162.3 | 12,022.2 |
| Class 7 | 8653.78 | 8981.07 | 10,118.1 | 10,329.1 | 16,397.3 | 14,963.1 | 12,678.7 |
| Class 8 | 8870.54 | 9222.38 | 10,441.6 | 10,747.6 | 17,299 | 15,763.9 | 13,335.2 |
| Class 9 | 9087.3 | 9463.69 | 10,765 | 11,166 | 18,200.8 | 16,564.7 | 13,991.6 |
| Class 10 | 9304.06 | 9705 | 11,088.5 | 11,584.4 | 19,102.5 | 17,365.5 | 14,648.1 |

Table A2.
March 2023: initial means for each multispectral band of Landsat OLI/TIRS satellite images.
Table A2.
March 2023: initial means for each multispectral band of Landsat OLI/TIRS satellite images.
| Class | Band 1 | Band 2 | Band 3 | Band 4 | Band 5 | Band 6 | Band 7 |
|---|---|---|---|---|---|---|---|
| Class 1 | 8036.12 | 8397.21 | 9295.02 | 9561.14 | 13,138.1 | 12,962.9 | 10,897.1 |
| Class 2 | 8246.35 | 8665.51 | 9702.28 | 10,172.8 | 14,019.7 | 13,972.2 | 11,692.2 |
| Class 3 | 8456.57 | 8933.81 | 10,109.5 | 10,784.5 | 14,901.3 | 14,981.5 | 12,487.3 |
| Class 4 | 8666.8 | 9202.11 | 10,516.8 | 11,396.2 | 15,783 | 15,990.8 | 13,282.5 |
| Class 5 | 8877.03 | 9470.41 | 10,924.1 | 12,007.9 | 16,664.6 | 17,000.2 | 14,077.6 |
| Class 6 | 9087.26 | 9738.71 | 11,331.3 | 12,619.6 | 17,546.2 | 18,009.5 | 14,872.7 |
| Class 7 | 9297.49 | 10,007 | 11,738.6 | 13,231.3 | 18,427.9 | 19,018.8 | 15,667.8 |
| Class 8 | 9507.72 | 10,275.3 | 12,145.8 | 13,842.9 | 19,309.5 | 20,028.1 | 16,463 |
| Class 9 | 9717.94 | 10,543.6 | 12,553.1 | 14,454.6 | 20,191.1 | 21,037.4 | 17,258.1 |
| Class 10 | 9928.17 | 10,811.9 | 12,960.4 | 15,066.3 | 21,072.7 | 22,046.7 | 18,053.2 |

Table A3.
May 2023: initial means for each multispectral band of Landsat OLI/TIRS satellite images.
Table A3.
May 2023: initial means for each multispectral band of Landsat OLI/TIRS satellite images.
| Class | Band 1 | Band 2 | Band 3 | Band 4 | Band 5 | Band 6 | Band 7 |
|---|---|---|---|---|---|---|---|
| Class 1 | 7598.78 | 7764.07 | 8434.53 | 7941.99 | 12,295.6 | 10,618.7 | 8849.61 |
| Class 2 | 7754.07 | 7949.13 | 8718.98 | 8335.56 | 13,270.4 | 11,401 | 9511.46 |
| Class 3 | 7909.36 | 8134.19 | 9003.43 | 8729.14 | 14,245.2 | 12,183.3 | 10,173.3 |
| Class 4 | 8064.65 | 8319.25 | 9287.89 | 9122.72 | 15,219.9 | 12,965.7 | 10,835.2 |
| Class 5 | 8219.95 | 8504.31 | 9572.34 | 9516.29 | 16,194.7 | 13,748 | 11,497 |
| Class 6 | 8375.24 | 8689.37 | 9856.79 | 9909.87 | 17,169.5 | 14,530.3 | 12,158.8 |
| Class 7 | 8530.53 | 8874.43 | 10,141.2 | 10,303.4 | 18,144.3 | 15,312.6 | 12,820.7 |
| Class 8 | 8685.82 | 9059.49 | 10,425.7 | 10,697 | 19,119.1 | 16,095 | 13,482.5 |
| Class 9 | 8841.12 | 9244.55 | 10,710.1 | 11,090.6 | 20,093.9 | 16,877.3 | 14,144.4 |
| Class 10 | 8996.41 | 9429.61 | 10,994.6 | 11,484.2 | 21,068.7 | 17,659.6 | 14,806.2 |

Table A4.
July 2023: initial means for each multispectral band of Landsat OLI/TIRS satellite images.
Table A4.
July 2023: initial means for each multispectral band of Landsat OLI/TIRS satellite images.
| Class | Band 1 | Band 2 | Band 3 | Band 4 | Band 5 | Band 6 | Band 7 |
|---|---|---|---|---|---|---|---|
| Class 1 | 8146.96 | 8572.74 | 9528.06 | 9871.64 | 12,802.2 | 13,459.3 | 11,517.8 |
| Class 2 | 8370.6 | 8848.08 | 9926.18 | 10,412.8 | 13,530.9 | 14,431.9 | 12,322.4 |
| Class 3 | 8594.23 | 9123.41 | 10,324.3 | 10,954 | 14,259.6 | 15,404.5 | 13,127.1 |
| Class 4 | 8817.87 | 9398.75 | 10,722.4 | 11,495.2 | 14,988.3 | 16,377.2 | 13,931.7 |
| Class 5 | 9041.5 | 9674.09 | 11,120.5 | 12,036.4 | 15,717.1 | 17,349.8 | 14,736.3 |
| Class 6 | 9265.14 | 9949.43 | 11,518.6 | 12,577.6 | 16,445.8 | 18,322.4 | 15,541 |
| Class 7 | 9488.77 | 10,224.8 | 11,916.7 | 13,118.9 | 17,174.5 | 19,295.1 | 16,345.6 |
| Class 8 | 9712.41 | 10,500.1 | 12,314.9 | 13,660.1 | 17,903.2 | 20,267.7 | 17,150.3 |
| Class 9 | 9936.04 | 10,775.4 | 12,713 | 14,201.3 | 18,631.9 | 21,240.3 | 17,954.9 |
| Class 10 | 10,159.7 | 11,050.8 | 13,111.1 | 14,742.5 | 19,360.6 | 22,212.9 | 18,759.6 |

Table A5.
September 2023: initial means for each multispectral band of Landsat OLI/TIRS images.
Table A5.
September 2023: initial means for each multispectral band of Landsat OLI/TIRS images.
| Class | Band 1 | Band 2 | Band 3 | Band 4 | Band 5 | Band 6 | Band 7 |
|---|---|---|---|---|---|---|---|
| Class 1 | 8037.45 | 8299.79 | 8964.58 | 9252.55 | 11,892.9 | 12,555.5 | 10,819.7 |
| Class 2 | 8252.53 | 8565.39 | 9363.68 | 9802.02 | 12,631.3 | 13,569.5 | 11,680.2 |
| Class 3 | 8467.62 | 8830.99 | 9762.77 | 10,351.5 | 13,369.8 | 14,583.6 | 12,540.8 |
| Class 4 | 8682.7 | 9096.59 | 10,161.9 | 10,901 | 14,108.2 | 15,597.6 | 13,401.3 |
| Class 5 | 8897.79 | 9362.19 | 10,561 | 11,450.4 | 14,846.6 | 16,611.6 | 14,261.9 |
| Class 6 | 9112.87 | 9627.78 | 10,960 | 11,999.9 | 15,585.1 | 17,625.6 | 15,122.4 |
| Class 7 | 9327.96 | 9893.38 | 11,359.1 | 12,549.4 | 16,323.5 | 18,639.6 | 15,983 |
| Class 8 | 9543.04 | 10,159 | 11,758.2 | 13,098.9 | 17,061.9 | 19,653.6 | 16,843.5 |
| Class 9 | 9758.13 | 10,424.6 | 12,157.3 | 13,648.3 | 17,800.4 | 20,667.6 | 17,704.1 |
| Class 10 | 9973.21 | 10,690.2 | 12,556.4 | 14,197.8 | 18,538.8 | 21,681.7 | 18,564.6 |

Table A6.
November 2023: initial means for each multispectral band of Landsat OLI/TIRS images.
Table A6.
November 2023: initial means for each multispectral band of Landsat OLI/TIRS images.
| Class | Band 1 | Band 2 | Band 3 | Band 4 | Band 5 | Band 6 | Band 7 |
|---|---|---|---|---|---|---|---|
| Class 1 | 7805.3 | 7978.69 | 8394.85 | 8339.26 | 10,618.8 | 10,876.8 | 9549.69 |
| Class 2 | 7994.42 | 8207.25 | 8745.73 | 8818 | 11,398.4 | 11,816.7 | 10,351.8 |
| Class 3 | 8183.55 | 8435.81 | 9096.6 | 9296.74 | 12,178 | 12,756.6 | 11,154 |
| Class 4 | 8372.67 | 8664.38 | 9447.48 | 9775.48 | 12,957.6 | 13,696.6 | 11,956.1 |
| Class 5 | 8561.79 | 8892.94 | 9798.36 | 10,254.2 | 13,737.2 | 14,636.5 | 12,758.2 |
| Class 6 | 8750.92 | 9121.5 | 10,149.2 | 10,733 | 14,516.8 | 15,576.5 | 13,560.4 |
| Class 7 | 8940.04 | 9350.07 | 10,500.1 | 11,211.7 | 15,296.4 | 16,516.4 | 14,362.5 |
| Class 8 | 9129.17 | 9578.63 | 10,851 | 11,690.4 | 16,076 | 17,456.4 | 15,164.7 |
| Class 9 | 9318.29 | 9807.2 | 11,201.9 | 12,169.2 | 16,855.6 | 18,396.3 | 15,966.8 |
| Class 10 | 9507.41 | 10,035.8 | 11,552.8 | 12,647.9 | 17,635.2 | 19,336.3 | 16,768.9 |
Appendix B. Standard Deviations for DNs of Pixels by 10 Computed Classes

Table A7.
Bimonthly evaluation of the standard deviations of Digital Numbers (DN) computed for pixels assigned to 10 land cover classes in landscapes of Rif Mountains, north Morocco. Evaluated each multispectral band (1 to 7) of Landsat 8–9 OLI/TIRS. Period: 2023, January to May.
Table A7.
Bimonthly evaluation of the standard deviations of Digital Numbers (DN) computed for pixels assigned to 10 land cover classes in landscapes of Rif Mountains, north Morocco. Evaluated each multispectral band (1 to 7) of Landsat 8–9 OLI/TIRS. Period: 2023, January to May.
| Class | Band 1 | Band 2 | Band 3 | Band 4 | Band 5 | Band 6 | Band 7 |
|---|---|---|---|---|---|---|---|
| 2023: January | |||||||
| 1 | 520.366 | 535.906 | 762.029 | 534.589 | 458.971 | 261.960 | 185.243 |
| 2 | 490.239 | 471.037 | 624.903 | 718.469 | 1108.75 | 864.994 | 643.283 |
| 3 | 469.625 | 475.629 | 523.194 | 551.304 | 924.17 | 813.025 | 684.606 |
| 4 | 314.352 | 297.355 | 402.396 | 473.559 | 946.247 | 881.536 | 697.401 |
| 5 | 355.762 | 363.823 | 482.001 | 628.670 | 1123.910 | 809.348 | 943.121 |
| 6 | 398.402 | 397.373 | 474.544 | 609.048 | 1059.400 | 1019.420 | 849.959 |
| 7 | 831.164 | 913.648 | 997.848 | 1243.020 | 1609.220 | 1416.340 | 1089.100 |
| 8 | 602.747 | 649.726 | 694.899 | 843.584 | 1472.750 | 926.428 | 972.410 |
| 9 | 563.373 | 645.449 | 846.794 | 1005.060 | 1844.240 | 1204.890 | 1309.140 |
| 10 | 3912.350 | 4022.450 | 3523.310 | 3432.850 | 3098.910 | 2796.470 | 2599.350 |
| 2023: March | |||||||
| 1 | 490.469 | 541.212 | 879.207 | 716.637 | 616.488 | 686.935 | 613.483 |
| 2 | 255.312 | 246.682 | 318.072 | 462.128 | 1664.020 | 929.262 | 719.619 |
| 3 | 541.560 | 602.780 | 686.249 | 782.835 | 1273.070 | 980.419 | 834.318 |
| 4 | 344.733 | 387.283 | 524.843 | 812.884 | 1659.040 | 980.065 | 855.260 |
| 5 | 377.657 | 422.529 | 565.366 | 724.443 | 1044.500 | 753.815 | 856.870 |
| 6 | 507.082 | 559.630 | 652.069 | 974.570 | 1023.500 | 866.568 | 784.542 |
| 7 | 449.736 | 488.873 | 597.974 | 692.265 | 1060.560 | 878.137 | 929.794 |
| 8 | 532.728 | 589.376 | 727.215 | 948.085 | 1317.450 | 934.689 | 1002.260 |
| 9 | 507.096 | 562.500 | 709.818 | 853.806 | 1051.740 | 1083.610 | 1336.400 |
| 10 | 753.846 | 857.879 | 1039.350 | 1108.080 | 1502.720 | 1502.480 | 2189.920 |
| 2023: May | |||||||
| 1 | 465.095 | 566.529 | 901.861 | 522.758 | 321.154 | 193.603 | 120.269 |
| 2 | 277.062 | 255.083 | 376.608 | 450.477 | 1258.88 | 804.346 | 710.667 |
| 3 | 441.646 | 468.557 | 562.157 | 597.613 | 1136.880 | 723.626 | 673.917 |
| 4 | 378.651 | 385.161 | 519.410 | 649.726 | 1220.780 | 868.215 | 1039.880 |
| 5 | 258.976 | 264.420 | 393.296 | 494.295 | 1055.540 | 951.268 | 799.838 |
| 6 | 228.533 | 221.204 | 444.333 | 414.391 | 1722.940 | 994.491 | 630.409 |
| 7 | 531.397 | 586.941 | 678.976 | 806.428 | 1337.73 | 1061.7 | 936.166 |
| 8 | 623.942 | 671.415 | 760.778 | 817.799 | 1089.700 | 905.306 | 884.892 |
| 9 | 528.555 | 602.147 | 767.459 | 860.058 | 1806.600 | 1088.830 | 1165.730 |
| 10 | 1210.190 | 1398.230 | 1656.380 | 1682.400 | 1778.850 | 1867.540 | 2167.590 |

Table A8.
Bimonthly evaluation of the standard deviations of Digital Numbers (DN) computed for pixels assigned to 10 land cover classes in landscapes of Rif Mountains, north Morocco. Evaluated each multispectral band (1 to 7) of Landsat 8–9 OLI/TIRS. Period: 2023, July to November.
Table A8.
Bimonthly evaluation of the standard deviations of Digital Numbers (DN) computed for pixels assigned to 10 land cover classes in landscapes of Rif Mountains, north Morocco. Evaluated each multispectral band (1 to 7) of Landsat 8–9 OLI/TIRS. Period: 2023, July to November.
| Class | Band 1 | Band 2 | Band 3 | Band 4 | Band 5 | Band 6 | Band 7 |
|---|---|---|---|---|---|---|---|
| 2023: July | |||||||
| 1 | 401.603 | 474.680 | 753.823 | 554.671 | 452.066 | 377.558 | 279.117 |
| 2 | 444.544 | 494.063 | 605.472 | 689.234 | 1469.020 | 1074.000 | 858.682 |
| 3 | 400.815 | 449.109 | 548.777 | 721.564 | 1773.570 | 1030.710 | 912.245 |
| 4 | 329.822 | 337.588 | 456.271 | 617.552 | 934.712 | 737.397 | 693.313 |
| 5 | 383.645 | 392.394 | 484.058 | 558.823 | 955.127 | 757.462 | 640.994 |
| 6 | 369.823 | 422.794 | 574.353 | 625.855 | 807.736 | 699.93 | 634.601 |
| 7 | 380.957 | 393.860 | 462.246 | 493.918 | 938.201 | 756.140 | 818.874 |
| 8 | 389.170 | 433.991 | 512.028 | 543.331 | 810.822 | 715.835 | 672.958 |
| 9 | 585.918 | 680.160 | 803.684 | 738.175 | 743.199 | 762.175 | 944.871 |
| 10 | 994.099 | 1126.100 | 1284.760 | 1153.090 | 1115.620 | 1242.490 | 1575.490 |
| 2023: September | |||||||
| 1 | 437.651 | 443.108 | 680.601 | 464.861 | 251.267 | 134.622 | 109.822 |
| 2 | 352.790 | 343.761 | 458.110 | 604.993 | 1647.410 | 1009.150 | 737.153 |
| 3 | 413.844 | 428.298 | 527.591 | 627.276 | 1270.460 | 820.868 | 669.725 |
| 4 | 609.427 | 665.603 | 750.628 | 922.569 | 2049.290 | 1237.420 | 1107.210 |
| 5 | 410.913 | 444.970 | 557.272 | 605.301 | 936.943 | 802.527 | 790.452 |
| 6 | 412.096 | 463.575 | 605.626 | 711.301 | 1026.750 | 826.580 | 710.861 |
| 7 | 476.481 | 556.664 | 690.121 | 675.737 | 961.119 | 727.211 | 750.357 |
| 8 | 560.709 | 661.131 | 788.185 | 748.966 | 878.300 | 826.902 | 929.749 |
| 9 | 734.715 | 872.060 | 1021.830 | 874.668 | 875.353 | 1032.820 | 1289.020 |
| 10 | 1228.510 | 1477.600 | 1759.470 | 1582.050 | 1479.630 | 1594.770 | 1825.860 |
| 2023: November | |||||||
| 1 | 408.799 | 366.029 | 518.468 | 358.299 | 494.063 | 288.290 | 183.250 |
| 2 | 337.779 | 313.223 | 378.857 | 471.889 | 1236.690 | 864.664 | 718.244 |
| 3 | 329.228 | 309.538 | 391.118 | 526.252 | 1133.950 | 971.402 | 842.809 |
| 4 | 357.573 | 340.276 | 405.652 | 474.368 | 868.293 | 878.208 | 719.913 |
| 5 | 407.823 | 418.715 | 501.585 | 583.480 | 1177.420 | 746.789 | 760.614 |
| 6 | 560.647 | 596.644 | 680.376 | 807.904 | 1923.630 | 1063.100 | 992.282 |
| 7 | 404.268 | 434.357 | 567.739 | 689.356 | 1145.220 | 911.636 | 828.516 |
| 8 | 502.947 | 558.014 | 686.296 | 677.680 | 976.150 | 885.420 | 857.641 |
| 9 | 571.593 | 667.463 | 845.177 | 950.398 | 1288.210 | 1164.560 | 1261.840 |
| 10 | 1130.670 | 1394.490 | 1762.720 | 1842.670 | 1953.210 | 2219.250 | 2058.000 |
References
- Corenblit, D.; Steiger, J. Vegetation as a major conductor of geomorphic changes on the Earth surface: Toward evolutionary geomorphology. Earth Surf. Process. Landforms 2009, 34, 891–896. [Google Scholar] [CrossRef]
- Muir, F.M.E.; Hurst, M.D.; Richardson-Foulger, L.; Rennie, A.F.; Naylor, L.A. VedgeSat: An automated, open-source toolkit for coastal change monitoring using satellite-derived vegetation edges. Earth Surf. Process. Landforms 2024, 49, 2405–2423. [Google Scholar] [CrossRef]
- Pu, G.; Quackenbush, L.J.; Stehman, S.V. Using Google Earth Engine to Assess Temporal and Spatial Changes in River Geomorphology and Riparian Vegetation. JAWRA J. Am. Water Resour. Assoc. 2021, 57, 789–806. [Google Scholar] [CrossRef]
- Cary, T. Landsat Data as a Tool for the Geosciences. J. Geol. Educ. 1990, 38, 318–322. [Google Scholar] [CrossRef]
- Xiong, N.; Chen, H.; Li, R.; Su, H.; Dai, S.; Wang, J. A Method of Chestnut Forest Identification Based on Time Series and Key Phenology from Sentinel-2. Remote Sens. 2023, 15, 5374. [Google Scholar] [CrossRef]
- Chen, X.; Zhang, X.; Zhuang, C.; Hu, X. Detecting the Lake Area Seasonal Variations in the Tibetan Plateau from Multi-Sensor Satellite Data Using Deep Learning. Water 2025, 17, 68. [Google Scholar] [CrossRef]
- Kuta, A.A.; Grebby, S.; Boyd, D.S. Remote Monitoring of the Impact of Oil Spills on Vegetation in the Niger Delta, Nigeria. Appl. Sci. 2025, 15, 338. [Google Scholar] [CrossRef]
- Pan, D.; Li, C.; Yang, G.; Ren, P.; Ma, Y.; Chen, W.; Feng, H.; Chen, R.; Chen, X.; Li, H. Identification of the Initial Anthesis of Soybean Varieties Based on UAV Multispectral Time-Series Images. Remote Sens. 2023, 15, 5413. [Google Scholar] [CrossRef]
- Ding, N.; Li, M. Mapping Forest Abrupt Disturbance Events in Southeastern China—Comparisons and Tradeoffs of Landsat Time Series Analysis Algorithms. Remote Sens. 2023, 15, 5408. [Google Scholar] [CrossRef]
- Yang, J.; Hu, Y.; Ma, Y.; Wang, M.; Zhang, N.; Li, Z.; Zhang, J. Combined Retrieval of Oil Film Thickness Using Hyperspectral and Thermal Infrared Remote Sensing. Remote Sens. 2023, 15, 5415. [Google Scholar] [CrossRef]
- Ahmadian, N.; Ghasemi, S.; Wigneron, J.P.; Zölitz, R. Comprehensive study of the biophysical parameters of agricultural crops based on assessing Landsat 8 OLI and Landsat 7 ETM+ vegetation indices. GIsci. Remote Sens. 2016, 53, 337–359. [Google Scholar] [CrossRef]
- Lemenkova, P. Mapping Woodlands in Angola, Tropical Africa: Calculation of Vegetation Indices From Remote Sensing Data. Agric. For. 2024, 70, 185–202. [Google Scholar] [CrossRef]
- Imtiaz, F.; Farooque, A.A.; Randhawa, G.S.; Wang, X.; Esau, T.J.; Acharya, B.; Hashemi Garmdareh, S.E. An inclusive approach to crop soil moisture estimation: Leveraging satellite thermal infrared bands and vegetation indices on Google Earth engine. Agric. Water Manag. 2024, 306, 109172. [Google Scholar] [CrossRef]
- Johansson, D.; Strömquist, L. Interpretation of geomorphology and vegetation of LANDSAT satellite images from semi-arid central Tanzania. Nor. Geogr. Tidsskr.-Nor. J. Geogr. 1978, 32, 49–54. [Google Scholar] [CrossRef]
- Cooley, S.W.; Smith, L.C.; Stepan, L.; Mascaro, J. Tracking Dynamic Northern Surface Water Changes with High-Frequency Planet CubeSat Imagery. Remote Sens. 2017, 9, 1306. [Google Scholar] [CrossRef]
- Reda Sahrane, Y.E.K.; Bounab, A. Investigating the effects of landscape characteristics on landslide susceptibility and frequency-area distributions: The case of Taounate province, Northern Morocco. Geocarto Int. 2022, 37, 17686–17712. [Google Scholar] [CrossRef]
- Marco, Y.C.; Vidal-Matutano, P.; Morales, J.; Valido, P.H.; Potì, A.; Kehl, M.; Linstädter, J.; Weniger, G.C.; Mikdad, A. Late Glacial Landscape Dynamics Based on Macrobotanical Data: Evidence From Ifri El Baroud (NE Morocco). Environ. Archaeol. 2021, 26, 131–145. [Google Scholar] [CrossRef]
- Aouraghe, H.; Agusti, J.; Ouchaou, B.; Bailon, S.; Lopez-Garcia, J.M.; Haddoumi, H.; Hammouti, K.E.; Oujaa, A.; Bougariane, B. The Holocene vertebrate fauna from Guenfouda site, Eastern Morocco. Hist. Biol. 2010, 22, 320–326. [Google Scholar] [CrossRef]
- Benvenuti, M.; Nesi, J.; Papini, M.; Risaliti, G.; Sani, F.; Moratti, G. Geology of the Toundoute Region (South Morocco): A window on the Early Jurassic-Cretaceous tectono-sedimentary evolution of the Central High Atlas. J. Maps 2024, 20, 2419456. [Google Scholar] [CrossRef]
- Ouallali, A.; Aassoumi, H.; Moukhchane, M.; Moumou, A.; Houssni, M.; Spalevic, V.; Keesstra, S. Sediment mobilization study on Cretaceous, Tertiary and Quaternary lithological formations of an external Rif catchment, Morocco. Hydrol. Sci. J. 2020, 65, 1568–1582. [Google Scholar] [CrossRef]
- Bouziane Khalloufi, D.O.; Lelièvre, H. New paleontological and geological data about Jbel Tselfat (Late Cretaceous of Morocco). Hist. Biol. 2010, 22, 57–70. [Google Scholar] [CrossRef]
- Ali EL-Omairi, M.; El Garouani, A.; Shebl, A. Investigation of lineament extraction: Analysis and comparison of digital elevation models in the Ait Semgane region, Morocco. Remote Sens. Appl. Soc. Environ. 2024, 36, 101321. [Google Scholar] [CrossRef]
- Cai, Y.; Shi, Q.; Xu, X.; Liu, X. A novel approach towards continuous monitoring of forest change dynamics in fragmented landscapes using time series Landsat imagery. Int. J. Appl. Earth Obs. Geoinf. 2023, 118, 103226. [Google Scholar] [CrossRef]
- Lemenkova, P. Exploitation d’images satellitaires Landsat de la région du Cap (Afrique du Sud) pour le calcul et la cartographie d’indices de végétation à l’aide du logiciel GRASS GIS. Physio-Géo 2024, 20, 113–129. [Google Scholar] [CrossRef]
- Xiong, Y.; Kang, Q.; Xu, W.; Huang, S.; Dai, F.; Wang, L.; Lu, N.; Kou, W. The dynamics of tea plantation encroachment into forests and effect on forest landscape pattern during 1991–2021 through time series Landsat images. Ecol. Indic. 2022, 141, 109132. [Google Scholar] [CrossRef]
- Noy, K.; Silver, M.; Pesek, O.; Yizhaq, H.; Marais, E.; Karnieli, A. Spatial and spectral analysis of fairy circles in Namibia on a landscape scale using satellite image processing and machine learning analysis. Int. J. Appl. Earth Obs. Geoinf. 2023, 121, 103377. [Google Scholar] [CrossRef]
- Lemenkova, P. Artificial Neural Networks for Mapping Coastal Lagoon of Chilika Lake, India, Using Earth Observation Data. J. Mar. Sci. Eng. 2024, 12, 709. [Google Scholar] [CrossRef]
- Wei Su, D.S.; Zhang, X. Satellite image analysis using crowdsourcing data for collaborative mapping: Current and opportunities. Int. J. Digit. Earth 2020, 13, 645–660. [Google Scholar] [CrossRef]
- Potter, C. Ten years of forest cover change in the Sierra Nevada detected using Landsat satellite image analysis. Int. J. Remote Sens. 2014, 35, 7136–7153. [Google Scholar] [CrossRef]
- Lemenkova, P. Deep Learning Methods of Satellite Image Processing for Monitoring of Flood Dynamics in the Ganges Delta, Bangladesh. Water 2024, 16, 1141. [Google Scholar] [CrossRef]
- Wang, F.; Han, L.; Liu, L.; Bai, C.; Ao, J.; Hu, H.; Li, R.; Li, X.; Guo, X.; Wei, Y. Advancements and Perspective in the Quantitative Assessment of Soil Salinity Utilizing Remote Sensing and Machine Learning Algorithms: A Review. Remote Sens. 2024, 16, 4812. [Google Scholar] [CrossRef]
- Cui, J.; Zhang, X.; Du, C.; Li, G. Remote Sensing Identification of Harmful Algae in Ulansuhai Lake with Machine Learning. Water 2025, 17, 50. [Google Scholar] [CrossRef]
- Vasconcelos, R.N.; de Santana, M.M.M.; Costa, D.P.; Duverger, S.G.; Ferreira-Ferreira, J.; Oliveira, M.; Barbosa, L.d.S.; Cordeiro, C.L.; Franca Rocha, W.J.S. Machine Learning Model Reveals Land Use and Climate’s Role in Caatinga Wildfires: Present and Future Scenarios. Fire 2025, 8, 8. [Google Scholar] [CrossRef]
- Farah, I.R.; Ahmed, M.B. Towards an intelligent multi-sensor satellite image analysis based on blind source separation using multi-source image fusion. Int. J. Remote Sens. 2010, 31, 13–38. [Google Scholar] [CrossRef]
- Lemenkova, P. Monitoring Seasonal Fluctuations in Saline Lakes of Tunisia Using Earth Observation Data Processed by GRASS GIS. Land 2023, 12, 1995. [Google Scholar] [CrossRef]
- Layati, E.; Ouigmane, A.; de Carvalho Alves, M.; Bagyaraj, M.; Qadem, A.; Ghachi, M.E. Contribution of GIS and Remote Sensing to Study and Analyze the Physiographic Characteristics of the Oued El-Abid Watershed (Central High Atlas, Morocco). Pap. Appl. Geogr. 2022, 8, 146–162. [Google Scholar] [CrossRef]
- Layati, E.; Ghachi, M.E. Oued Lakhdar watershed (Morocco), monitoring land use/cover changes: Remote sensing and GIS approach. Geol. Ecol. Landscapes 2024, 1–13. [Google Scholar] [CrossRef]
- da Paz Gomes Brandão Ferraz, D.; Vicens, R.S. Comparison between machine learning classification and trajectory-based change detection for identifying eucalyptus areas in Landsat time series. Remote Sens. Appl. Soc. Environ. 2024, 101444. [Google Scholar] [CrossRef]
- Lemenkova, P. GRASS GIS for classification of Landsat TM images by maximum likelihood discriminant analysis: Tokyo area, Japan. Geod. Glas. 2020, 51, 5–25. [Google Scholar] [CrossRef]
- Laroche-Pinel, E.; Cianciola, V.; Singh, K.; Vivaldi, G.A.; Brillante, L. Assessing the spatial-temporal performance of machine learning in predicting grapevine water status from Landsat 8 imagery via block-out and date-out cross-validation. Agric. Water Manag. 2024, 306, 109163. [Google Scholar] [CrossRef]
- Nilkamal More, V.B.N.; Banerjee, B. Machine learning on high performance computing for urban greenspace change detection: Satellite image data fusion approach. Int. J. Image Data Fusion 2020, 11, 218–232. [Google Scholar] [CrossRef]
- García-Pedrero, A.; Gonzalo-Martín, C.; Lillo-Saavedra, M. A machine learning approach for agricultural parcel delineation through agglomerative segmentation. Int. J. Remote Sens. 2017, 38, 1809–1819. [Google Scholar] [CrossRef]
- Nasiri, V.; Hawryło, P.; Janiec, P.; Socha, J. Comparing Object-Based and Pixel-Based Machine Learning Models for Tree-Cutting Detection with PlanetScope Satellite Images: Exploring Model Generalization. Int. J. Appl. Earth Obs. Geoinf. 2023, 125, 103555. [Google Scholar] [CrossRef]
- Ebrahimy, H.; Zhang, Z. Per-pixel accuracy as a weighting criterion for combining ensemble of extreme learning machine classifiers for satellite image classification. Int. J. Appl. Earth Obs. Geoinf. 2023, 122, 103390. [Google Scholar] [CrossRef]
- Fu, H.; Li, H.; Fu, A.; Wang, X.; Wang, Q. Transportation emissions monitoring and policy research: Integrating machine learning and satellite imaging. Transp. Res. Part Transp. Environ. 2024, 136, 104421. [Google Scholar] [CrossRef]
- Padhy, R.; Dash, S.K.; Mishra, J. Joint feature selection and classification of low-resolution satellite images using the SAT-6 dataset. High-Confid. Comput. 2024, 100278. [Google Scholar] [CrossRef]
- Lemenkova, P. Random Forest Classifier Algorithm of Geographic Resources Analysis Support System Geographic Information System for Satellite Image Processing: Case Study of Bight of Sofala, Mozambique. Coasts 2024, 4, 127–149. [Google Scholar] [CrossRef]
- Habib, M.; Okayli, M. An Overview of Modern Cartographic Trends Aligned with the ICA’s Perspective. Rev. Int. Geomat. 2023, 32, 1–16. [Google Scholar] [CrossRef]
- Lemenkova, P. Landscape Fragmentation and Deforestation in Sierra Leone, West Africa, Analysed Using Satellite Images. Transylv. Rev. Syst. Ecol. Res. 2024, 26, 13–26. [Google Scholar] [CrossRef]
- Khaldi, R.; Tabik, S.; Puertas-Ruiz, S.; de Giles, J.P.; Correa, J.A.H.; Zamora, R.; Segura, D.A. Individual mapping of large polymorphic shrubs in high mountains using satellite images and deep learning. Int. J. Appl. Earth Obs. Geoinf. 2024, 134, 104191. [Google Scholar] [CrossRef]
- Lemenkova, P.; Debeir, O. Satellite Image Processing by Python and R Using Landsat 9 OLI/TIRS and SRTM DEM Data on Côte d’Ivoire, West Africa. J. Imaging 2022, 8, 317. [Google Scholar] [CrossRef] [PubMed]
- Pereira, J.; Pereira, A.; Gil, A.; Mantas, V.M. Lithology mapping with satellite images, fieldwork-based spectral data, and machine learning algorithms: The case study of Beiras Group (Central Portugal). CATENA 2023, 220, 106653. [Google Scholar] [CrossRef]
- Eskandari, S.; Bordbar, S.K. Provision of land use and forest density maps in semi-arid areas of Iran using Sentinel-2 satellite images and vegetation indices. Adv. Space Res. 2025, 75, 1616–1622. [Google Scholar] [CrossRef]
- Aboutofail, S.; Slimani, H. The Paleocene–Eocene Thermal Maximum (PETM) interval in the southwestern Mediterranean Tethys at Morocco: New data from a high-resolution study of dinoflagellate cysts and palynofacies in the Rif Chain. Palaeogeogr. Palaeoclimatol. Palaeoecol. 2024, 655, 112522. [Google Scholar] [CrossRef]
- McGregor, H.V.; Dupont, L.; Stuut, J.B.W.; Kuhlmann, H. Vegetation change, goats, and religion: A 2000-year history of land use in southern Morocco. Quat. Sci. Rev. 2009, 28, 1434–1448. [Google Scholar] [CrossRef]
- Criniti, S.; Martín-Martín, M.; Hlila, R.; Maaté, A.; Maaté, S. Detrital signatures of the Ghomaride Culm cycle (Rif Cordillera, N Morocco): New constraints for the northern Gondwana plate tectonics. Mar. Pet. Geol. 2024, 165, 106861. [Google Scholar] [CrossRef]
- Parish, R.; Funnell, D. Climate change in mountain regions: Some possible consequences in the Moroccan High Atlas. Glob. Environ. Chang. 1999, 9, 45–58. [Google Scholar] [CrossRef]
- El Talibi, H.; Zaghloul, M.N.; Perri, F.; Aboumaria, K.; Rossi, A.; El Moussaoui, S. Sedimentary evolution of the siliciclastic Aptian–Albian Massylian flysch of the Chouamat Nappe (central Rif, Morocco). J. Afr. Earth Sci. 2014, 100, 554–568. [Google Scholar] [CrossRef]
- Bonardi, G.; de Capoa, P.; Di Staso, A.; Estévez, A.; Martín-Martín, M.; Martín-Rojas, I.; Perrone, V.; Tent-Manclús, J.E. Oligocene-to-Early Miocene depositional and structural evolution of the Calabria–Peloritani Arc southern terrane (Italy) and geodynamic correlations with the Spain Betics and Morocco Rif. Geodin. Acta 2003, 16, 149–169. [Google Scholar] [CrossRef]
- Maaté, A.; Martín-Algarra, A.; Martín-Martín, M.; Serra-Kiel, J. Nouvelles donnéessur le Paléocène-Éocène des zones internes bético-rifaines. Geobios 2000, 33, 409–418. [Google Scholar] [CrossRef]
- Slimani, H.; Mahboub, I.; Toufiq, A.; Jbari, H.; Chakir, S.; Tahiri, A. Bartonian to Priabonian dinoflagellate cyst biostratigraphy and paleoenvironments of the M’karcha section in the Southern Tethys margin (Rif Chain, Northern Morocco). Mar. Micropaleontol. 2019, 153, 101785. [Google Scholar] [CrossRef]
- Martín-Martín, M.; Guerrera, F.; Cañaveras, J.C.; Alcalá, F.J.; Serrano, F.; Maaté, A.; Hlila, R.; Maaté, S.; Tramontana, M.; Sánchez-Navas, A.; et al. Paleogene evolution of the External Rif Zone (Morocco) and comparison with other western Tethyan margins. Sediment. Geol. 2023, 448, 106367. [Google Scholar] [CrossRef]
- Ait Brahim, L.; Chotin, P.; Hinaj, S.; Abdelouafi, A.; El Adraoui, A.; Nakcha, C.; Dhont, D.; Charroud, M.; Sossey Alaoui, F.; Amrhar, M.; et al. Paleostress evolution in the Moroccan African margin from Triassic to Present. Tectonophysics 2002, 357, 187–205. [Google Scholar] [CrossRef]
- Leblanc, D.; Olivier, P. Role of strike-slip faults in the Betic-Rifian orogeny. Tectonophysics 1984, 101, 345–355. [Google Scholar] [CrossRef]
- Araña, V.; Vegas, R. Plate tectonics and volcanism in the gibraltar arc. Tectonophysics 1974, 24, 197–212. [Google Scholar] [CrossRef]
- Perri, F.; Martín-Martín, M.; Maaté, A.; Hlila, R.; Maaté, S.; Criniti, S.; Capobianco, W.; Critelli, S. Provenance and paleogeographic implications for the Cenozoic sedimentary cover of the Ghomaride Complex (Internal Rif Belt), Morocco. Mar. Pet. Geol. 2022, 143, 105811. [Google Scholar] [CrossRef]
- Talmat, S.; Martín-Martín, M.; Benyoucef, M.; Ferré, B.; Belhai, D. The Koudiat El Madene unit (Kabylian “Dorsal”, Algeria) and its correlation with similar units belonging to the Rif-Betic Arc (Morocco and Spain). J. Afr. Earth Sci. 2025, 223, 105515. [Google Scholar] [CrossRef]
- Chakkour, S.; Ennouni, H.; Sahli, A.; Kadaoui, K.; Houssni, M.; Kassout, J.; Ater, M. Vegetation composition and ecological characteristics of the fragmented Alnus glutinosa woodlands of Morocco. Ecol. Front. 2024, 45, 54–67. [Google Scholar] [CrossRef]
- Hamouch, C.; Chaaouan, J.; Bouiss, C.E. Spatial-temporal assessment of soil erosion using the RUSLE model in the upstream Inaouène watershed, Northern Morocco. Nat. Hazards Res. 2025, 5, 1–9. [Google Scholar] [CrossRef]
- Ed-Dakiri, S.; Etebaai, I.; Moussaoui, S.E.; Tawfik, A.; Lamgharbaj, M.; Talibi, H.E.; Dekkaki, H.C.; Taher, M. Assessing soil erosion risk through geospatial analysis and magnetic susceptibility: A study in the Oued Ghiss dam watershed, Central Rif, Morocco. Sci. Afr. 2024, 26, e02401. [Google Scholar] [CrossRef]
- Boubekraoui, H.; Maouni, Y.; Ghallab, A.; Draoui, M.; Maouni, A. Spatio-temporal analysis and identification of deforestation hotspots in the Moroccan western Rif. Trees For. People 2023, 12, 100388. [Google Scholar] [CrossRef]
- Aqil, H.; Khattach, D.; Gout, R.E.; Mandour, A.E.; Kaufmann, O. Contribution de la gravimétrie à l’étude de la structure profonde du bassin de Bou-Houria (Maroc Nord-oriental): Implications hydrogéologiques. Hydrol. Sci. J. 2015, 60, 736–745. [Google Scholar] [CrossRef]
- Zouhri, L.; Gorini, C.; Mania, J.; Deffontaines, B.; Zerouali, A.E.H. Spatial distribution of resistivity in the hydrogeological systems, and identification of the catchment area in the Rharb basin, Morocco/Répartition spatiale de la résistivité dans les systèmes hydrogéologiques et détection des zones de captages dans le bassin du Rharb, Maroc. Hydrol. Sci. J. 2004, 49, 398. [Google Scholar] [CrossRef]
- Al Karkouri, J. Les milieux montagneux marocains à l’épreuve du changement climatique (cas de la montagne rifaine). Hespéris-Tamuda 2017, 52, 237–267. [Google Scholar]
- Duarte, D.; Magalhães, V.H.; Hernández-Molina, F.J.; Roque, C.; Menapace, W. Interaction between active tectonics, bottom-current processes and coral mounds: A unique example in the NW Moroccan Margin, southern Gulf of Cadiz. Deep. Sea Res. Part I Oceanogr. Res. Pap. 2024, 209, 104330. [Google Scholar] [CrossRef]
- Chabli, A.; Chalouan, A.; Akil, M.; Galindo-Zaldívar, J.; Ruano, P.; Sanz de Galdeano, C.; López-Garrido, A.C.; Marín-Lechado, C.; Pedrera, A. Plio-Quaternary paleostresses in the Atlantic passive margin of the Moroccan Meseta: Influence of the Central Rif escape tectonics related to Eurasian-African plate convergence. J. Geodyn. 2014, 77, 123–134, SI: Geodynamic evolution of the Alboran domain. [Google Scholar] [CrossRef]
- Lghamour, M.; Karrat, L.; Picotti, V.; Hajdas, I.; Haghipour, N.; Guidobaldi, G.; Wyss Heeb, K.; Gourari, L. Late Pleistocene to Holocene alluvial deposits of the Inaouène Valley and their paleoenvironmental significance (north Morocco). Quat. Sci. Rev. 2024, 344, 108941. [Google Scholar] [CrossRef]
- Kairouani, H.; Abbassi, A.; Zaghloul, M.N.; El Mourabet, M.; Micheletti, F.; Fornelli, A.; Mongelli, G.; Critelli, S. The Jurassic climate change in the northwest Gondwana (External Rif, Morocco): Evidence from geochemistry and implication for paleoclimate evolution. Mar. Pet. Geol. 2024, 163, 106762. [Google Scholar] [CrossRef]
- Malusà, M.G.; Ellero, A.; Ottria, G. Tectonics of the Mw 6.8 Al Haouz earthquake (Morocco) reveals minor role of asthenospheric upwelling. Tectonophysics 2024, 891, 230533. [Google Scholar] [CrossRef]
- Sadkaoui, D.; Brahim, B.; Kader, S.; Agharroud, K.; Mihraje, A.I.; Aluni, K.; Aassoumi, H.; Sassioui, S.; Spalevic, V.; Sestras, P. Evaluation of tectonic activity using morphometric indices: Study of the case of Taïliloute ridge (middle-Atlas region, Morocco). J. Afr. Earth Sci. 2024, 213, 105219. [Google Scholar] [CrossRef]
- Costa, A.M.; da Conceição Freitas, M.; Teixeira, A.; Costa, P.J.; Santos, R.N.; Cachão, M.; Fatela, F.; Pereira, R.; Tereso, J.P.; Lopes, V.P.; et al. Environmental changes and historical occupation at Oued Laksar (Ksar Seghir), Morocco. Quat. Int. 2024, 712, 109578. [Google Scholar] [CrossRef]
- Boutahar, A.; Gonzalez, P.C.; Picone, R.M.; Crisafulli, A.; Mesa, J.M.; Redouan, F.Z.; El Bakali, I.; Kadiri, M.; Lamrani, Z.; Merzouki, A. Modern pollen–vegetation relationship in the Rif mountains (Northern Morocco). Rev. Palaeobot. Palynol. 2023, 310, 104828. [Google Scholar] [CrossRef]
- Muller, S.D.; Daoud-Bouattour, A.; Fauquette, S.; Bottollier-Curtet, M.; Rifai, N.; Robles, M.; Saber, E.R.; El Madihi, M.; Moukrim, S.; Rhazi, L. Holocene history of peatland communities of central Rif (Northern Morocco). Geobios 2022, 70, 35–53. [Google Scholar] [CrossRef]
- Ajbilou, R.; Marañón, T.; Arroyo, J. Ecological and biogeographical analyses of Mediterranean forests of northern Morocco. Acta Oecologica 2006, 29, 104–113. [Google Scholar] [CrossRef]
- Marañón, T.; Ajbilou, R.; Ojeda, F.; Arroyo, J. Biodiversity of woody species in oak woodlands of southern Spain and northern Morocco. For. Ecol. Manag. 1999, 115, 147–156. [Google Scholar] [CrossRef]
- Salmon, J.; Friedl, M.A.; Frolking, S.; Wisser, D.; Douglas, E.M. Global rain-fed, irrigated, and paddy croplands: A new high resolution map derived from remote sensing, crop inventories and climate data. Int. J. Appl. Earth Obs. Geoinf. 2015, 38, 321–334. [Google Scholar] [CrossRef]
- Zayani, I.; Ammari, M.; Ben Allal, L.; Bouhafa, K. Agroforestry olive orchards for soil organic carbon storage: Case of Saiss, Morocco. Heliyon 2023, 9, e22910. [Google Scholar] [CrossRef]
- Lemenkova, P. Evapotranspiration, vapour pressure and climatic water deficit in Ethiopia mapped using GMT and TerraClimate dataset. J. Water Land Dev. 2022, 54, 201–209. [Google Scholar] [CrossRef]
- Becker, N.C. Painting by numbers: A GMT primer for merging swath-mapping sonar data of different types and resolutions. Comput. Geosci. 2005, 31, 1075–1077. [Google Scholar] [CrossRef]
- Lemenkova, P. Mapping Climate Parameters over the Territory of Botswana Using GMT and Gridded Surface Data from TerraClimate. ISPRS Int. J.-Geo-Inf. 2022, 11, 473. [Google Scholar] [CrossRef]
- Bawa, S.; Onotu, A.A.; Akomolafe, E.A.; Sa’i, U.I. Understanding the Topography of the Gulf of Guinea Seabed Using GMT Scripting and GEBCO Gridded Data. In Proceedings of the 2024 IEEE Mediterranean and Middle-East Geoscience and Remote Sensing Symposium (M2GARSS), Oran, Algeria, 15–17 April 2024; pp. 516–520. [Google Scholar] [CrossRef]
- Shi, H.; Du, Z.; Lu, Y.; Hu, X.; Ke, X. Amery Ice Shelf Digital Elevation Model from GLAS and GMT. In Proceedings of the 2009 Third International Symposium on Intelligent Information Technology Application, Nanchang, China, 21–22 November 2009; Volume 2, pp. 129–133. [Google Scholar] [CrossRef]
- Fang, Z.; Jiang, G.; Xu, C.; Wang, S. A tectonic geodesy mapping software based on QGIS. Geod. Geodyn. 2020, 11, 31–39. [Google Scholar] [CrossRef]
- Wang, Y.; Peng, Y.; Hu, X.; Zhang, P. Fine-Resolution Forest Height Estimation by Integrating ICESat-2 and Landsat 8 OLI Data with a Spatial Downscaling Method for Aboveground Biomass Quantification. Forests 2023, 14, 1414. [Google Scholar] [CrossRef]
- Abd El-Rahman Hegab, M.; Abou El Magd, I.; Hamed Abd El Wahid, K. Revealing Potential Mineralization Zones Utilizing Landsat-9, ASTER and Airborne Radiometric Data at Elkharaza-Dara Area, North Eastern Desert, Egypt. Egypt. J. Remote Sens. Space Sci. 2024, 27, 716–733. [Google Scholar] [CrossRef]
- Xu, Y.; Tan, Y.; Abd-Elrahman, A.; Fan, T.; Wang, Q. Incorporation of Fused Remote Sensing Imagery to Enhance Soil Organic Carbon Spatial Prediction in an Agricultural Area in Yellow River Basin, China. Remote Sens. 2023, 15, 2017. [Google Scholar] [CrossRef]
- Aghababaei, M.; Ebrahimi, A.; Naghipour, A.A.; Asadi, E.; Verrelst, J. Classification of Plant Ecological Units in Heterogeneous Semi-Steppe Rangelands: Performance Assessment of Four Classification Algorithms. Remote Sens. 2021, 13, 3433. [Google Scholar] [CrossRef]
- Kusi, K.K.; Khattabi, A.; Mhammdi, N. Integrated assessment of ecosystem services in response to land use change and management activities in Morocco. Arab. J. Geosci. 2021, 14, 418. [Google Scholar] [CrossRef]
- Hamdani, N.; Baali, A. Impact of Land Use/Land Cover (LULC) Changes on the Watersheds of Three Lakes in the Central Middle Atlas, (Morocco). In Advanced Technology for Smart Environment and Energy; Springer Nature: Cham, Switzerland, 2024; pp. 185–196. [Google Scholar] [CrossRef]
- Kusi, K.K.; Khattabi, A.; Mhammdi, N. Analyzing the impact of land use change on ecosystem service value in the main watersheds of Morocco. Environ. Dev. Sustain. 2023, 25, 2688–2715. [Google Scholar] [CrossRef]
- El fallah, K.; El kharrim, K.; Belghyti, D. Land use land cover change detection by using remote sensing in Meknes province, Morocco with an indicator based (DPSIR) approach. Vegetos 2025, 38, 2181–2193. [Google Scholar] [CrossRef]
- Diachronic Analysis of Land Use/Land Cover Impacts on Carbon Storage in Agadir City (Morocco); Springer Nature: Cham, Switzerland, 2024. [CrossRef]
- Zaher, H.; Sabir, M.; Benjelloun, H.; Paul-Igor, H. Effect of forest land use change on carbohydrates, physical soil quality and carbon stocks in Moroccan cedar area. J. Environ. Manag. 2020, 254, 109544. [Google Scholar] [CrossRef] [PubMed]
- Moumane, A.; Al Karkouri, J.; Benmansour, A.; El Ghazali, F.E.; Fico, J.; Karmaoui, A.; Batchi, M. Monitoring long-term land use, land cover change, and desertification in the Ternata oasis, Middle Draa Valley, Morocco. Remote Sens. Appl. Soc. Environ. 2022, 26, 100745. [Google Scholar] [CrossRef]
- Mulas, M.; Bellavite, D.; Lubino, M.; Belkheiri, O.; Enne, G. Participatory Approach for Integrated Development and Management of North African Marginal Zones: Demonstrative Plan to Fight Desertification in Morocco and Tunisia. Ital. J. Agron. 2012, 7, e46. [Google Scholar] [CrossRef]
- Kouba, Y.; Gartzia, M.; El Aich, A.; Alados, C.L. Deserts do not advance, they are created: Land degradation and desertification in semiarid environments in the Middle Atlas, Morocco. J. Arid. Environ. 2018, 158, 1–8. [Google Scholar] [CrossRef]
- Mayaux, P.L.; Fernandez, S. Blinded like a state: Water scarcity and the quantification dilemma in Morocco. Geoforum 2024, 155, 104093. [Google Scholar] [CrossRef]
- Chebli, Y.; Chentouf, M.; Ozer, P.; Hornick, J.L.; Cabaraux, J.F. Forest and silvopastoral cover changes and its drivers in northern Morocco. Appl. Geogr. 2018, 101, 23–35. [Google Scholar] [CrossRef]
- Aouatif Adghir, H.D.J.; Kettani, K. The Tipulidae (Diptera) of northern Morocco with a focus on the Rif region, including the description of a new species of Tipula (Lunatipula) and an updated checklist for Morocco. Ann. SociéTé Entomol. Fr. 2018, 54, 522–538. [Google Scholar] [CrossRef]
- Boutahar, A.; Gonzalez, P.C.; Picone, R.M.; Crisafulli, A.; Mesa, J.M.; Redouan, F.Z.; Bakali, I.E.; Kadiri, M.; Lamrani, Z.; Merzouki, A. The relationships between modern pollen rain assemblages and vegetation from Sougna Mountain (Rif Mountains-Northern Morocco). Palynology 2024, 48, 2358016. [Google Scholar] [CrossRef]
- Jiménez, J.A.; Ros, R.M.; Cano, M.J.; Guerra, J. Contribution to the bryophyte flora of Morocco: Terricolous and saxicolous bryophytes of the Jbel Bouhalla. J. Bryol. 2002, 24, 243–250. [Google Scholar] [CrossRef]
- Dahmani, L.; Laaribya, S.; Naim, H.; Dindaroglu, T. Landslide hazard mapping in Chefchaouen, Morocco: AHP-GIS integration. Int. J. Environ. Stud. 2024, 24, 12483. [Google Scholar] [CrossRef]
- Es-Smairi, A.; Moutchou, B.E.; Touhami, A.E.O.; Namous, M.; Mir, R.A. Landslide susceptibility mapping using GIS-based bivariate models in the Rif chain (northernmost Morocco). Geocarto Int. 2022, 37, 15347–15377. [Google Scholar] [CrossRef]
- Manaouch, M.; Sadiki, M.; Aghad, M.; Pham, Q.B.; Batchi, M.; Karkouri, J.A. Assessment of landslide susceptibility using machine learning classifiers in Ziz upper watershed, SE Morocco. Phys. Geogr. 2024, 45, 203–230. [Google Scholar] [CrossRef]
Disclaimer/Publisher’s Note: The statements, opinions and data contained in all publications are solely those of the individual author(s) and contributor(s) and not of MDPI and/or the editor(s). MDPI and/or the editor(s) disclaim responsibility for any injury to people or property resulting from any ideas, methods, instructions or products referred to in the content. |
© 2025 by the author. Licensee MDPI, Basel, Switzerland. This article is an open access article distributed under the terms and conditions of the Creative Commons Attribution (CC BY) license (https://creativecommons.org/licenses/by/4.0/).

