Abstract
Background: Multiple myeloma (MM) is one of the most common cancers of the blood system. N6-methyladenosine (m6A) plays an important role in cancer progression. We aimed to investigate the prognostic relevance of the m6A score in multiple myeloma through a series of bioinformatics analyses. Methods: The microarray dataset GSE4581 and GSE57317 used in this study were downloaded from the Gene Expression Omnibus (GEO) database. The m6A score was calculated using the GSVA package. The Random forests, univariate Cox regression analysis and Lasso analyses were performed for the differentially expressed genes (DEGs). Kaplan–Meier analysis and an ROC curve were used to diagnose the effectiveness of the model. Results: The GSVA R software package was used to predict the function. A total of 21 m6A genes were obtained, and 286 DEGs were identified between high and low m6A score groups. The risk model was constructed and composed of PRX, LBR, RB1, FBXL19-AS1, ARSK, MFAP3L, SLC44A3, UNC119 and SHCBP1. Functional analysis of risk score showed that with the increase in the risk score, Activated CD4 T cells, Memory B cells and Type 2 T helper cells were highly infiltrated. Conclusions: Immune checkpoints such as HMGB1, TGFB1, CXCL9 and HAVCR2 were significantly positively correlated with the risk score. We believe that the m6A score has a certain prognostic value in multiple myeloma.
1. Introduction
Multiple myeloma (MM) is the second most common hematologic malignancy [1]. Its main characteristics are plasma cell cloning and proliferation and heterogeneous genome landscape [2]. MM has been treated with immunomodulatory drugs, protease antibodies, monoclonal antibodies and stem cell transplantation in the past few decades. However, it is still a type of incurable plasma cell malignancy [3,4]. Meanwhile, the MM has been reported, and its development is evolutionary [5]. It obviously exacerbates the difficulty of treatment. Fortunately, the development and application of microarray technology and bioinformatics analysis could help to screen and identify genetic variation in the course of the disease to a certain extent. Now, risk-adapted therapies are becoming the new standard of care. Survival analysis is essential in treatment decisions and clinical studies. Therefore, there is an urgent need to develop reliable and robust models to estimate patient survival from large amounts of data.
N6-methyladenosine (m6A) is one of the post-transcriptional modifications of RNA and one of the most common internal chemical modifications in eukaryotes and nuclear replicating viruses [6]. M6A-related regulatory factors can be involved in various physiological and pathological processes by regulating RNA stability, mRNA splicing or translation [7,8,9,10]. Several studies have reported that m6A was involved in the occurrence and progression of a variety of cancers, including colorectal cancer [11], endometrial cancer [12], oral squamous cell carcinoma [13], osteosarcoma [14] and glioma [15]. However, the clinical value and potential mechanism of m6A-related genes in multiple myeloma still need to be further explored.
However, no one has analyzed its prognostic role in multiple myeloma based on the m6A score. In this study, we intend to download multiple myeloma data from the GEO public database. The m6A score was calculated, and a risk model was constructed. The survival analysis and function prediction were performed. Thus, it might provide a research basis for the study of m6A in multiple myeloma.
2. Materials and Methods
2.1. Multiple Myeloma Data Set and Preprocessing
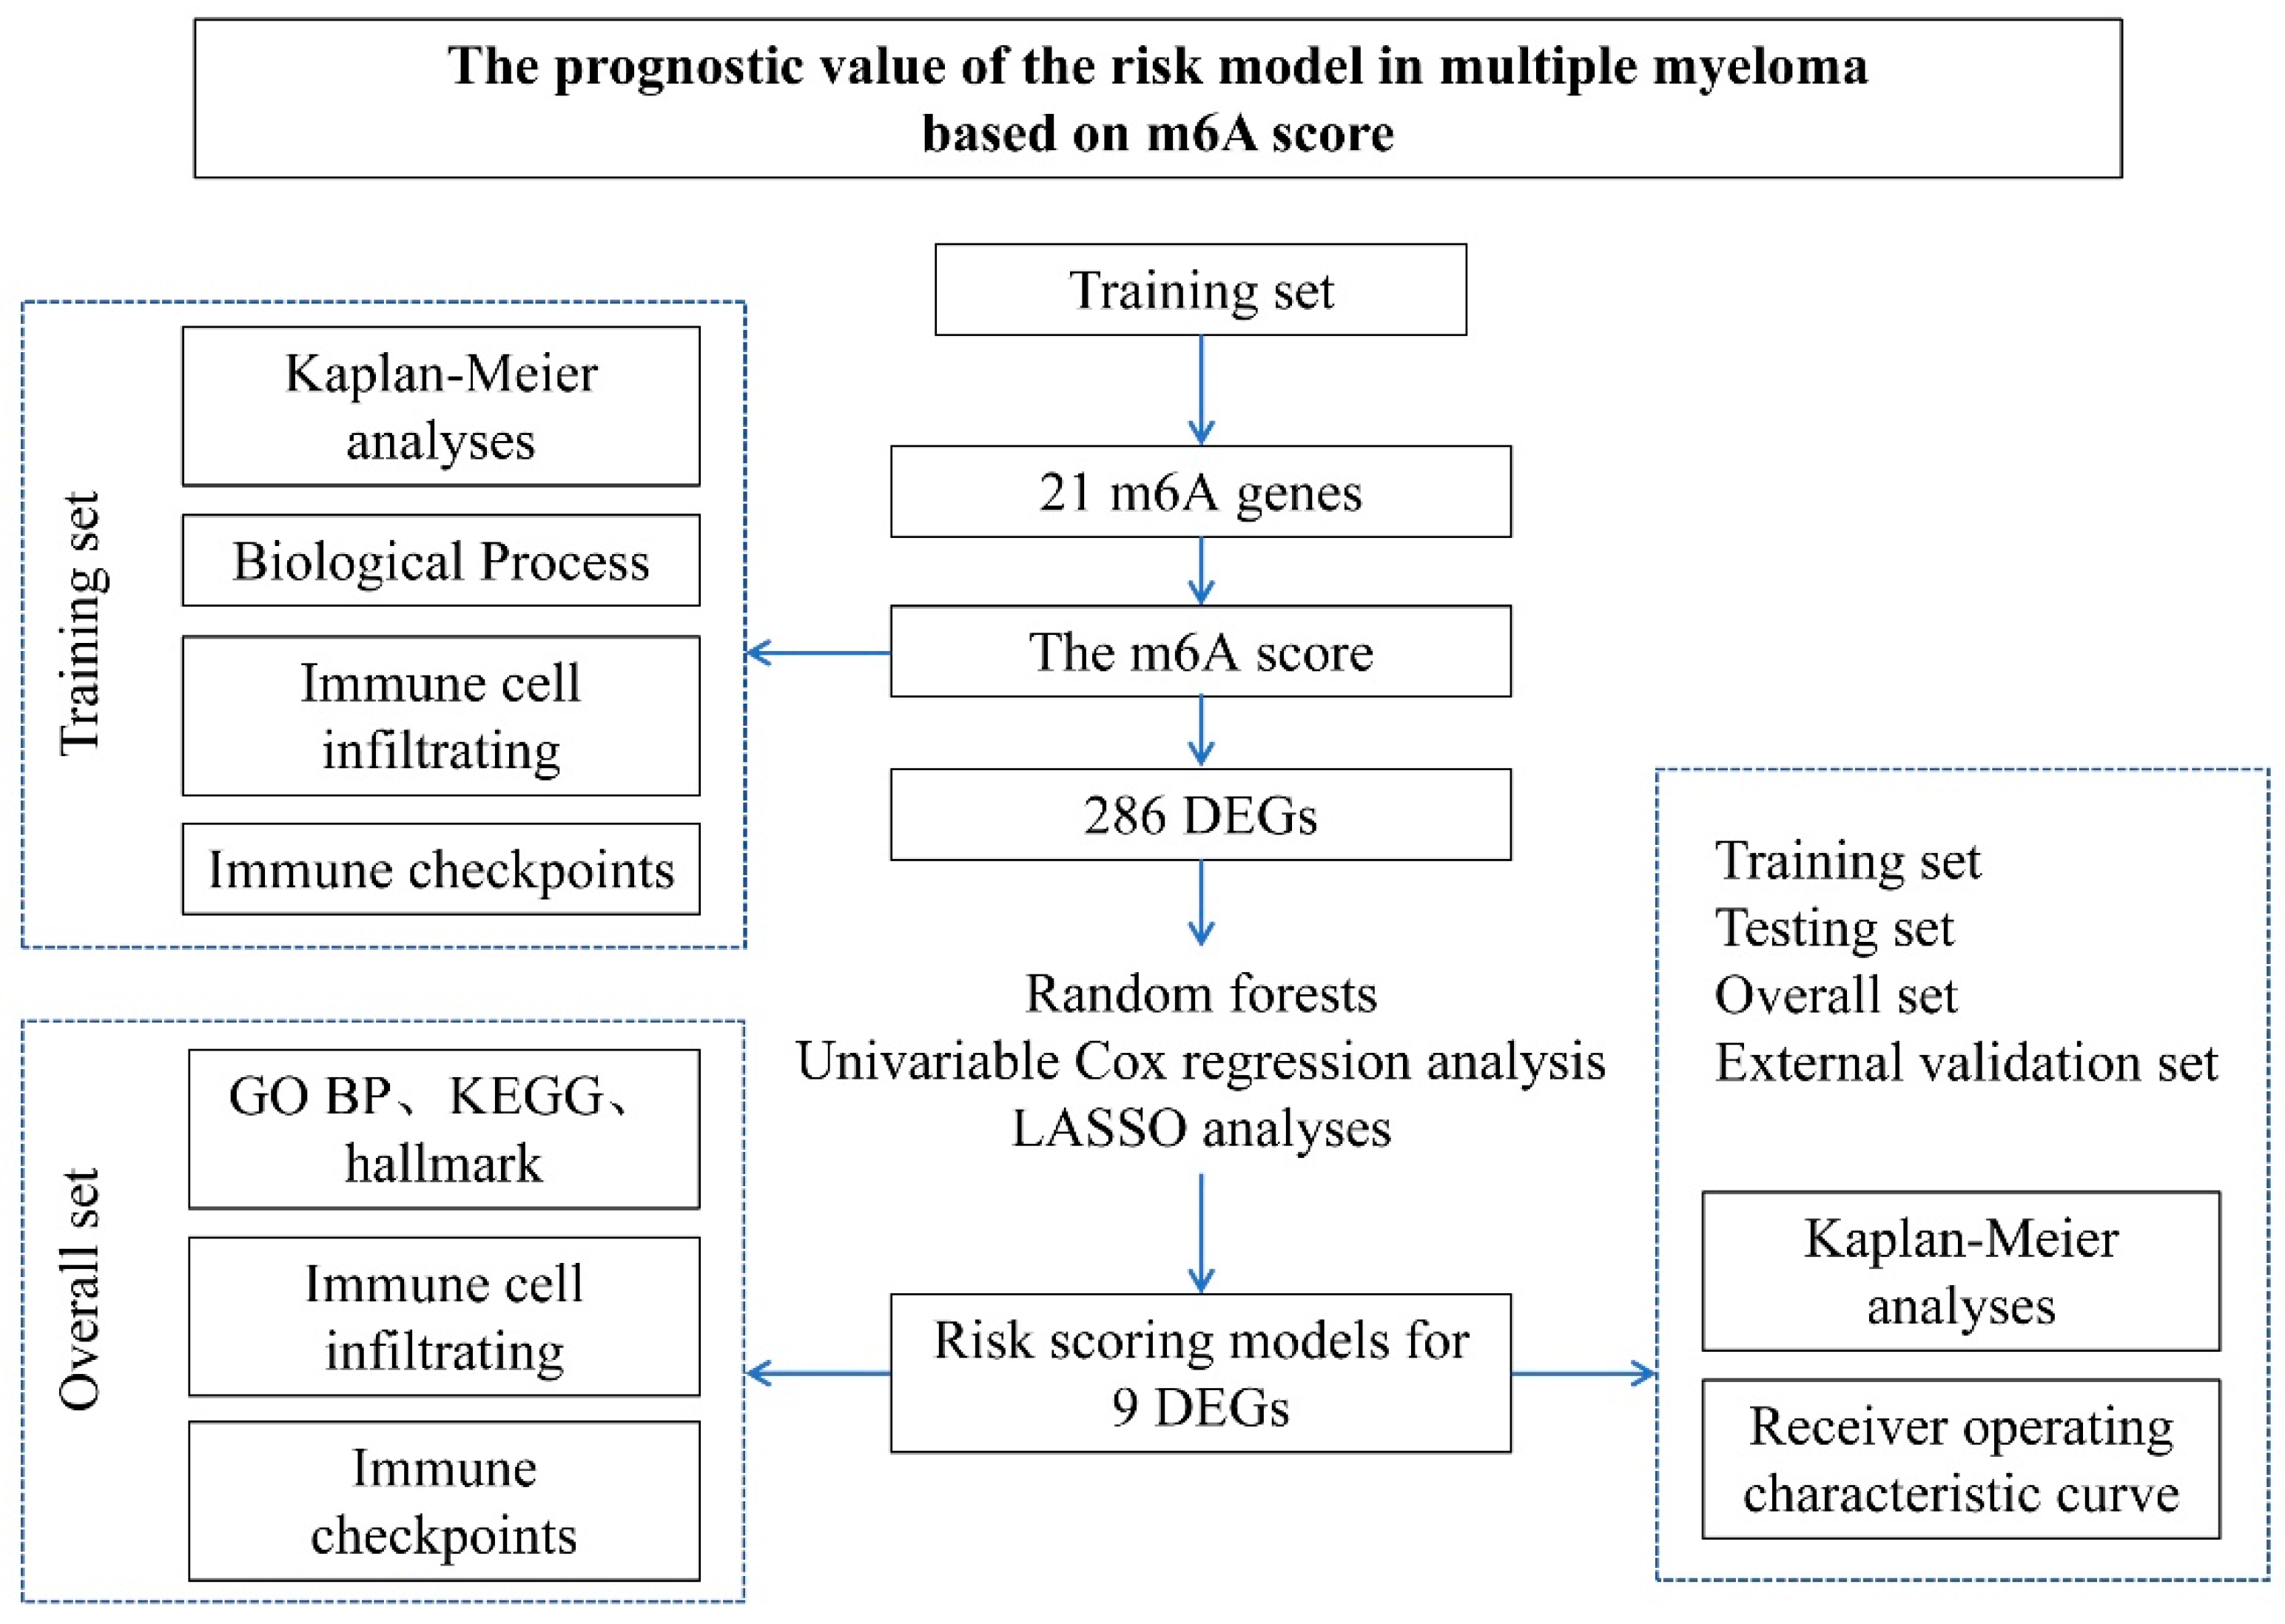
In this study, all datasets used were publicly available, and the workflow is shown (Figure 1). There are multiple myeloma data sets from Gene Expression Omnibus (GEO) (http://www.ncbi.nlm.nih.gov/geo/, accessed on 13 July 2019) to download. Datasets GSE4581 (n = 413) and GSE57317 (n = 55) from the same platform (GPL570) were used for myeloma network analysis. After chi-square test analysis (Figure 1), GSE4581 was randomly divided into a training set (207 samples) and an internal testing set (206 samples) in a 1:1 ratio. GSE57317 contains 55 samples as an external validation set. The raw data from the microarray dataset were generated by Affymetrix. The quantile normalization and background correction of the raw data were performed using the Affy package’s RMA algorithm. The R Bioconductor software package and the R software (version 3.6.1) were applied to analyze all the data.
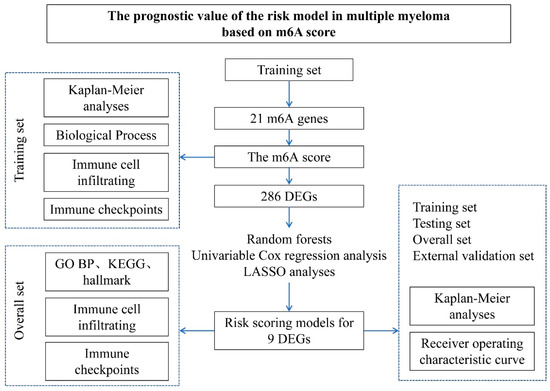
Figure 1.
The Study workflow. The prognostic gene characterization of m6A in multiple myeloma. GSE4581 (overall set) was randomly divided into a training set and an internal testing set. GSE57317 is an external validation set.
2.2. Calculation of m6A Score
A total of 21 m6A genes were obtained. The score of m6A was calculated using the GSVA package. The Gene set variation analysis (GSVA) transforms the expression matrix of genes between different samples into the expression matrix of genes set between samples to evaluate the enrichment of different pathways. The value of each pathway in each sample is given a score. Thus, the m6A score was obtained. The minimum p-value method was used to determine the two groups with high and low m6A scores.
2.3. Functional Analysis
We downloaded all the gene sets from the MSIgDB database. The ssGSEA method was used to calculate the abundance of 28 types of immune cells. We used the GSVA R software package for immune checkpoint cluster and scoring by executing the GSVA, including the GO BP (Biological Process), KEGG and Hallmark Gene sets [16]. The selection criteria of immune checkpoint cluster-related pathways were based on the corrected p value less than 0.05. The selection criteria of immune checkpoint score-related pathways were based on the correlation analysis p value less than 0.05.
2.4. Establishment of m6A Risk Score
The differentially expressed genes (DEGs) between the low and high m6A score groups were identified by the Limma package in R [17]. The p values < 0.05 and |log FC| > 1.5 sets were used to determine the immune checkpoint subtypes of DEGs in the significance standard [18]. Then, the Random forest in the machine learning method of the Caret package was used for gene dimensionality reduction, and Univariate Cox regression analysis was applied to determine representative genes. The prognostic genes and their Lasso regression coefficients were obtained by selecting the highest lambda value (“min” lambda) through 1000 cross-validation in the training set using the Lasso method. The risk score is the sum of the expression value of genes screened by LASSO * the regression coefficient of LASSO. * represented a multiplication symbol.
2.5. Statistical Analysis of Data
The R package ggplot2 was used to visualize the data. The Benjamini–Hochberg method was applied to analyze differentially expressed genes by converting p-values to FDR to identify important genes. The receiver operating characteristic package (pROC) was used to generate the ROC curve and calculate the area under the curve (AUC) [19]. The generation and visualization of survival curves are realized by applying Kaplan–Meier analysis. The Logarithmic rank test was used to determine the statistical significance of the differences in each dataset. The R package survminer was adopted to generate all survival curves. The pheatmap was applied to generate all the heat maps. All data statistical analysis was performed in R (https://cran.r-project.org/bin/windows/base/old/3.6.1/, version 3.6.1, accessed on 5 July 2019). The normality of variables was tested by using the Shapiro–Wilk normality test. For normally distributed variables, an unpaired Student’s t-test was used to compare the differences between the two groups. The Wilcoxon test was used to compare variables that are not normally distributed. One-way ANOVA analysis was applied for the parametric method to compare the mean values between multiple groups. However, the Kruskal–Wallis test was applied for the non-parametric. The two-sided was used in all tests. p values < 0.05 were considered statistically significant.
3. Results
3.1. Establishment of m6A Score in Multiple Myeloma
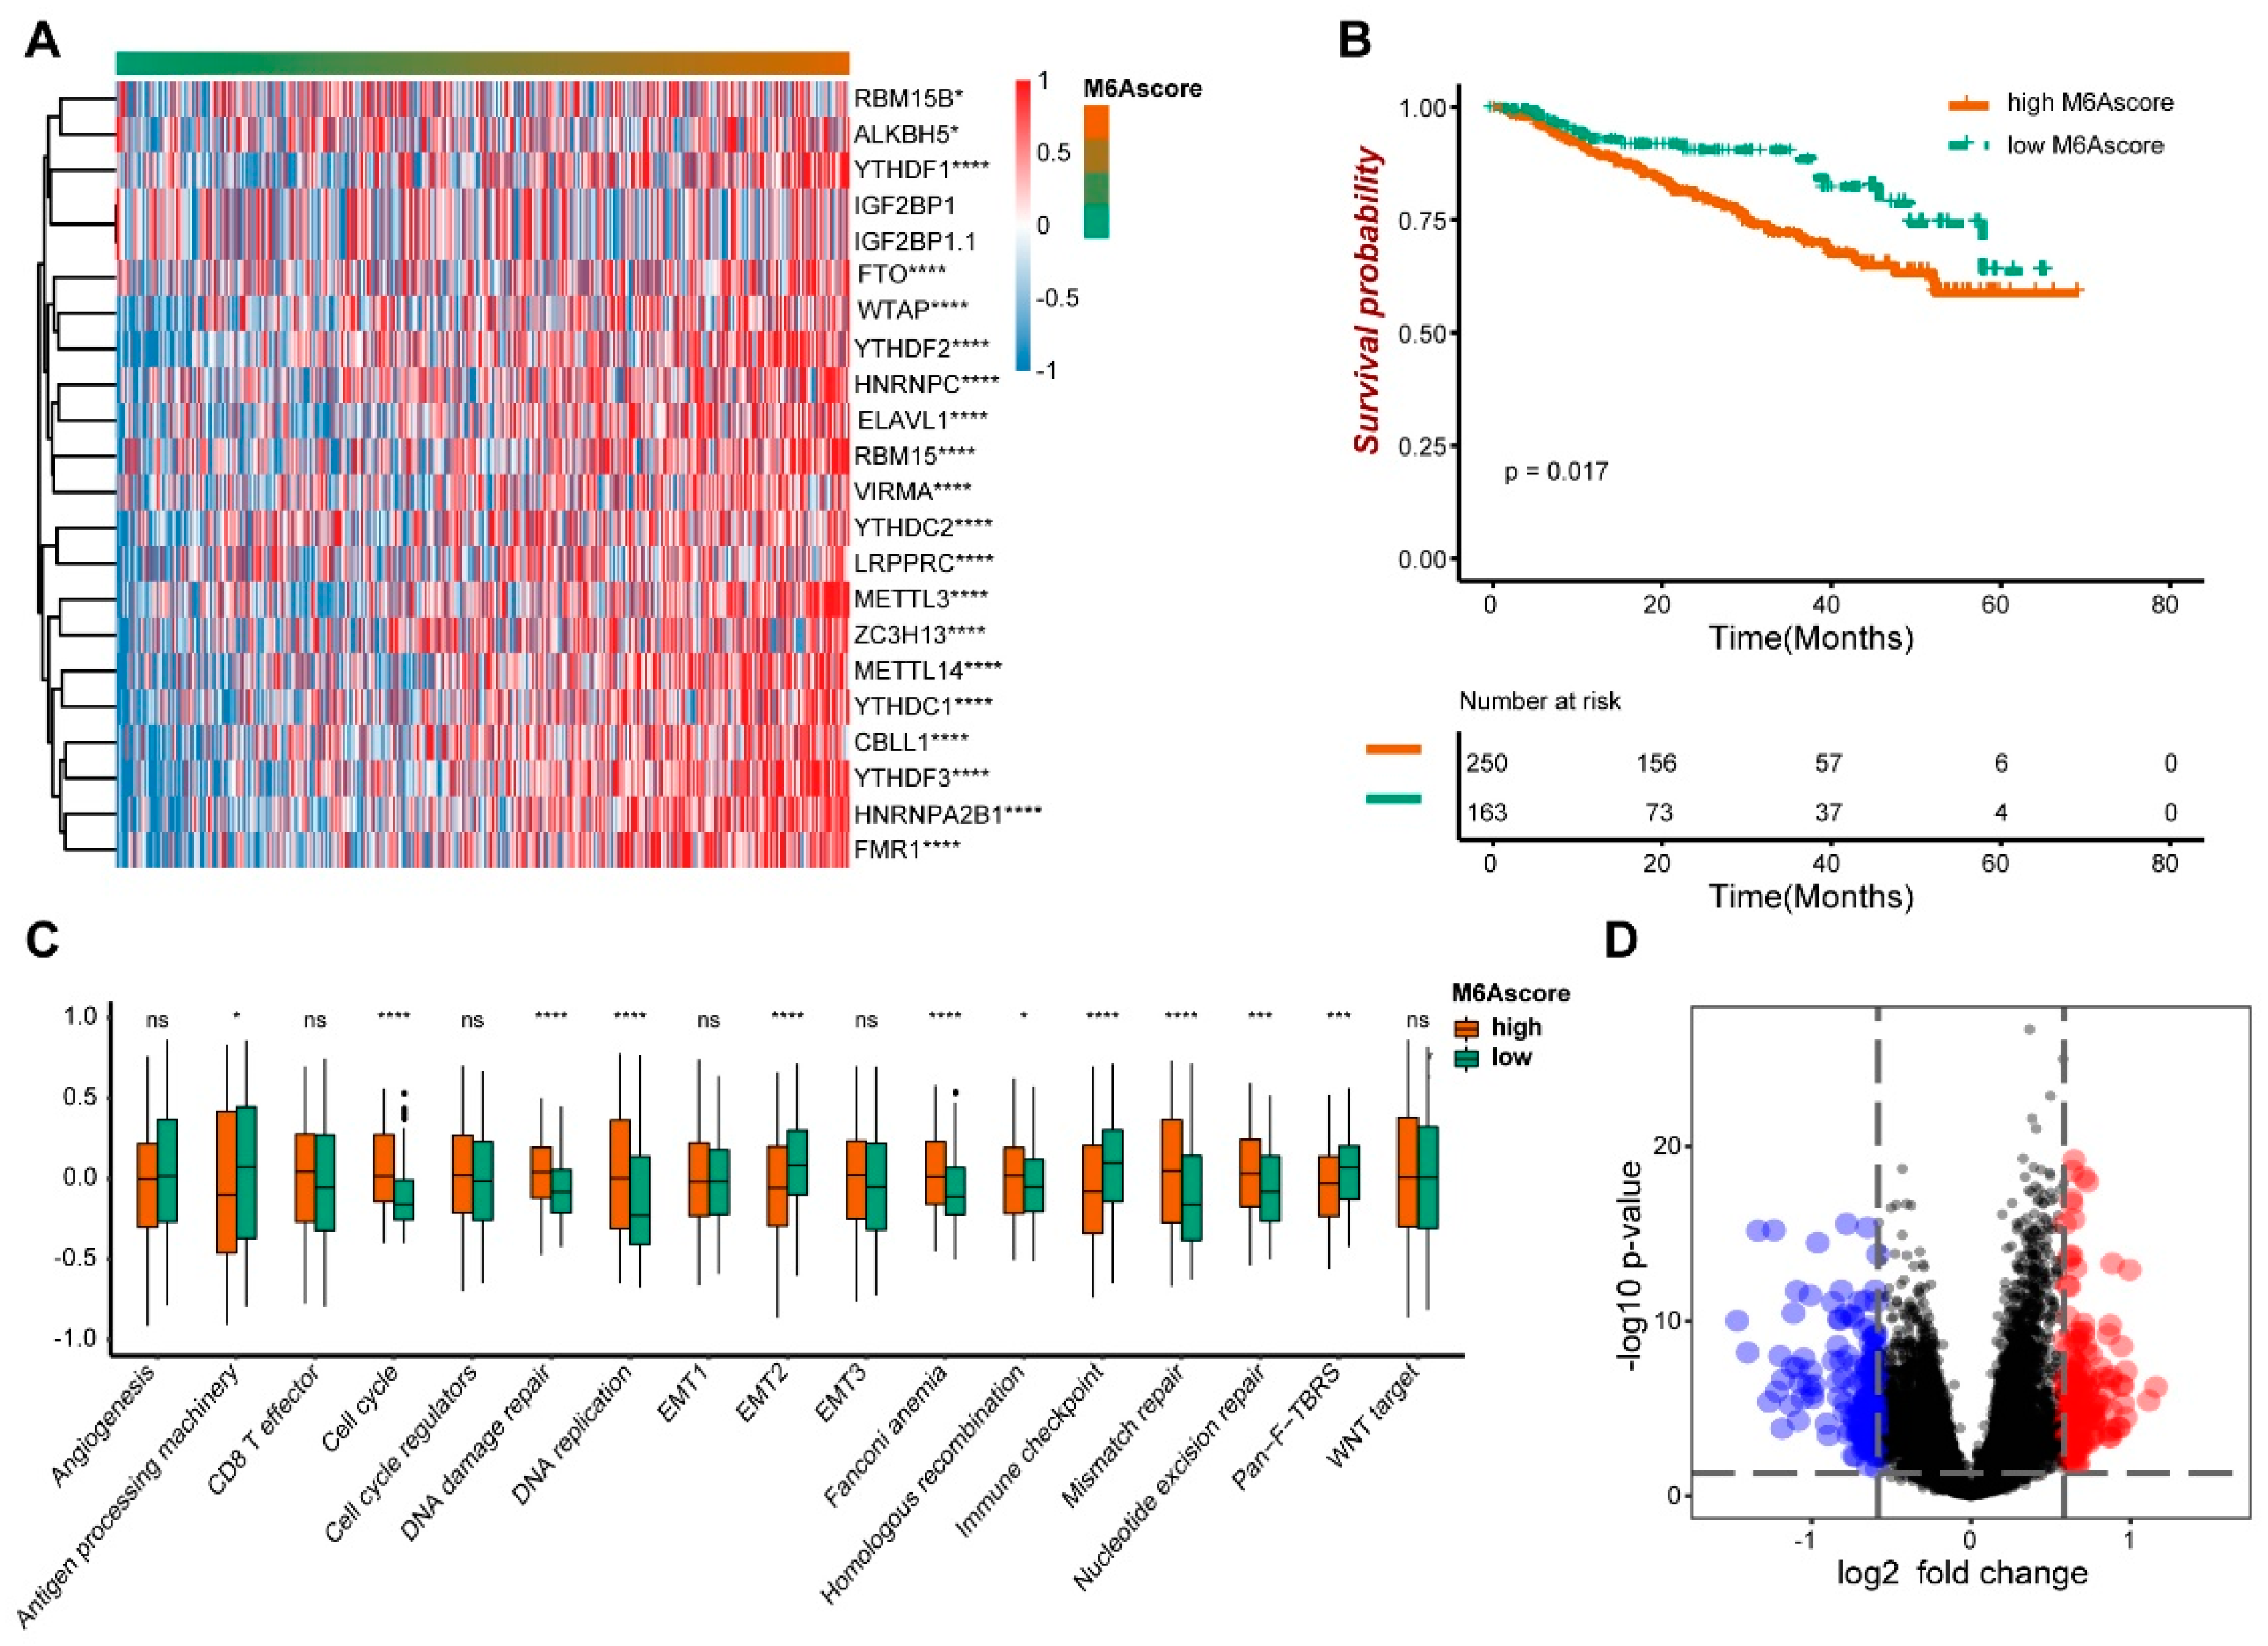
We obtained 21 m6A genes in the GSE4581 dataset, and the GSVA package was used to calculate the m6A score. A heat map visualization of the expression of 21 m6A genes with m6A score changes can be seen in Figure 2A. The 19 m6A genes, including ALKBH5, YTHDF1, FTO, WTAP and YTHDF2, were significantly correlated with the m6A score. The survival time of the high m6A score group was significantly lower than that of the group with the low score (p = 0.017) (Figure 2B). Meanwhile, the high and low m6A score groups showed the difference in the biological functions, including the Cell Cycle, DNA Damage Repair, DNA Replication and EMT2 (Figure 2C). The genetic differences between the two groups’ m6A scores were analyzed by performing the Limma package and visualized by a volcano map (Figure 2D). Therefore, it is speculated that the m6A score might have a certain diagnostic value to distinguish multiple myeloma patients.
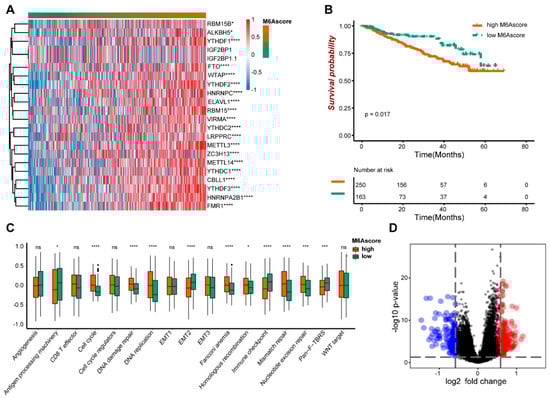
Figure 2.
The prognostic characteristics of m6A score. (A) The expression of the m6A gene. (B) The survival analysis of high and low m6A scores. (C) The biological function analysis of high and low m6A score groups. (D) The volcano maps showed different genes between high and low m6A scores. * indicates significant, with the p value less than 0.05, *** indicates p value less than 0.001, and **** indicates p value less than 0.0001.
3.2. Immune Infiltration and Immune Checkpoint Differences of m6A Score
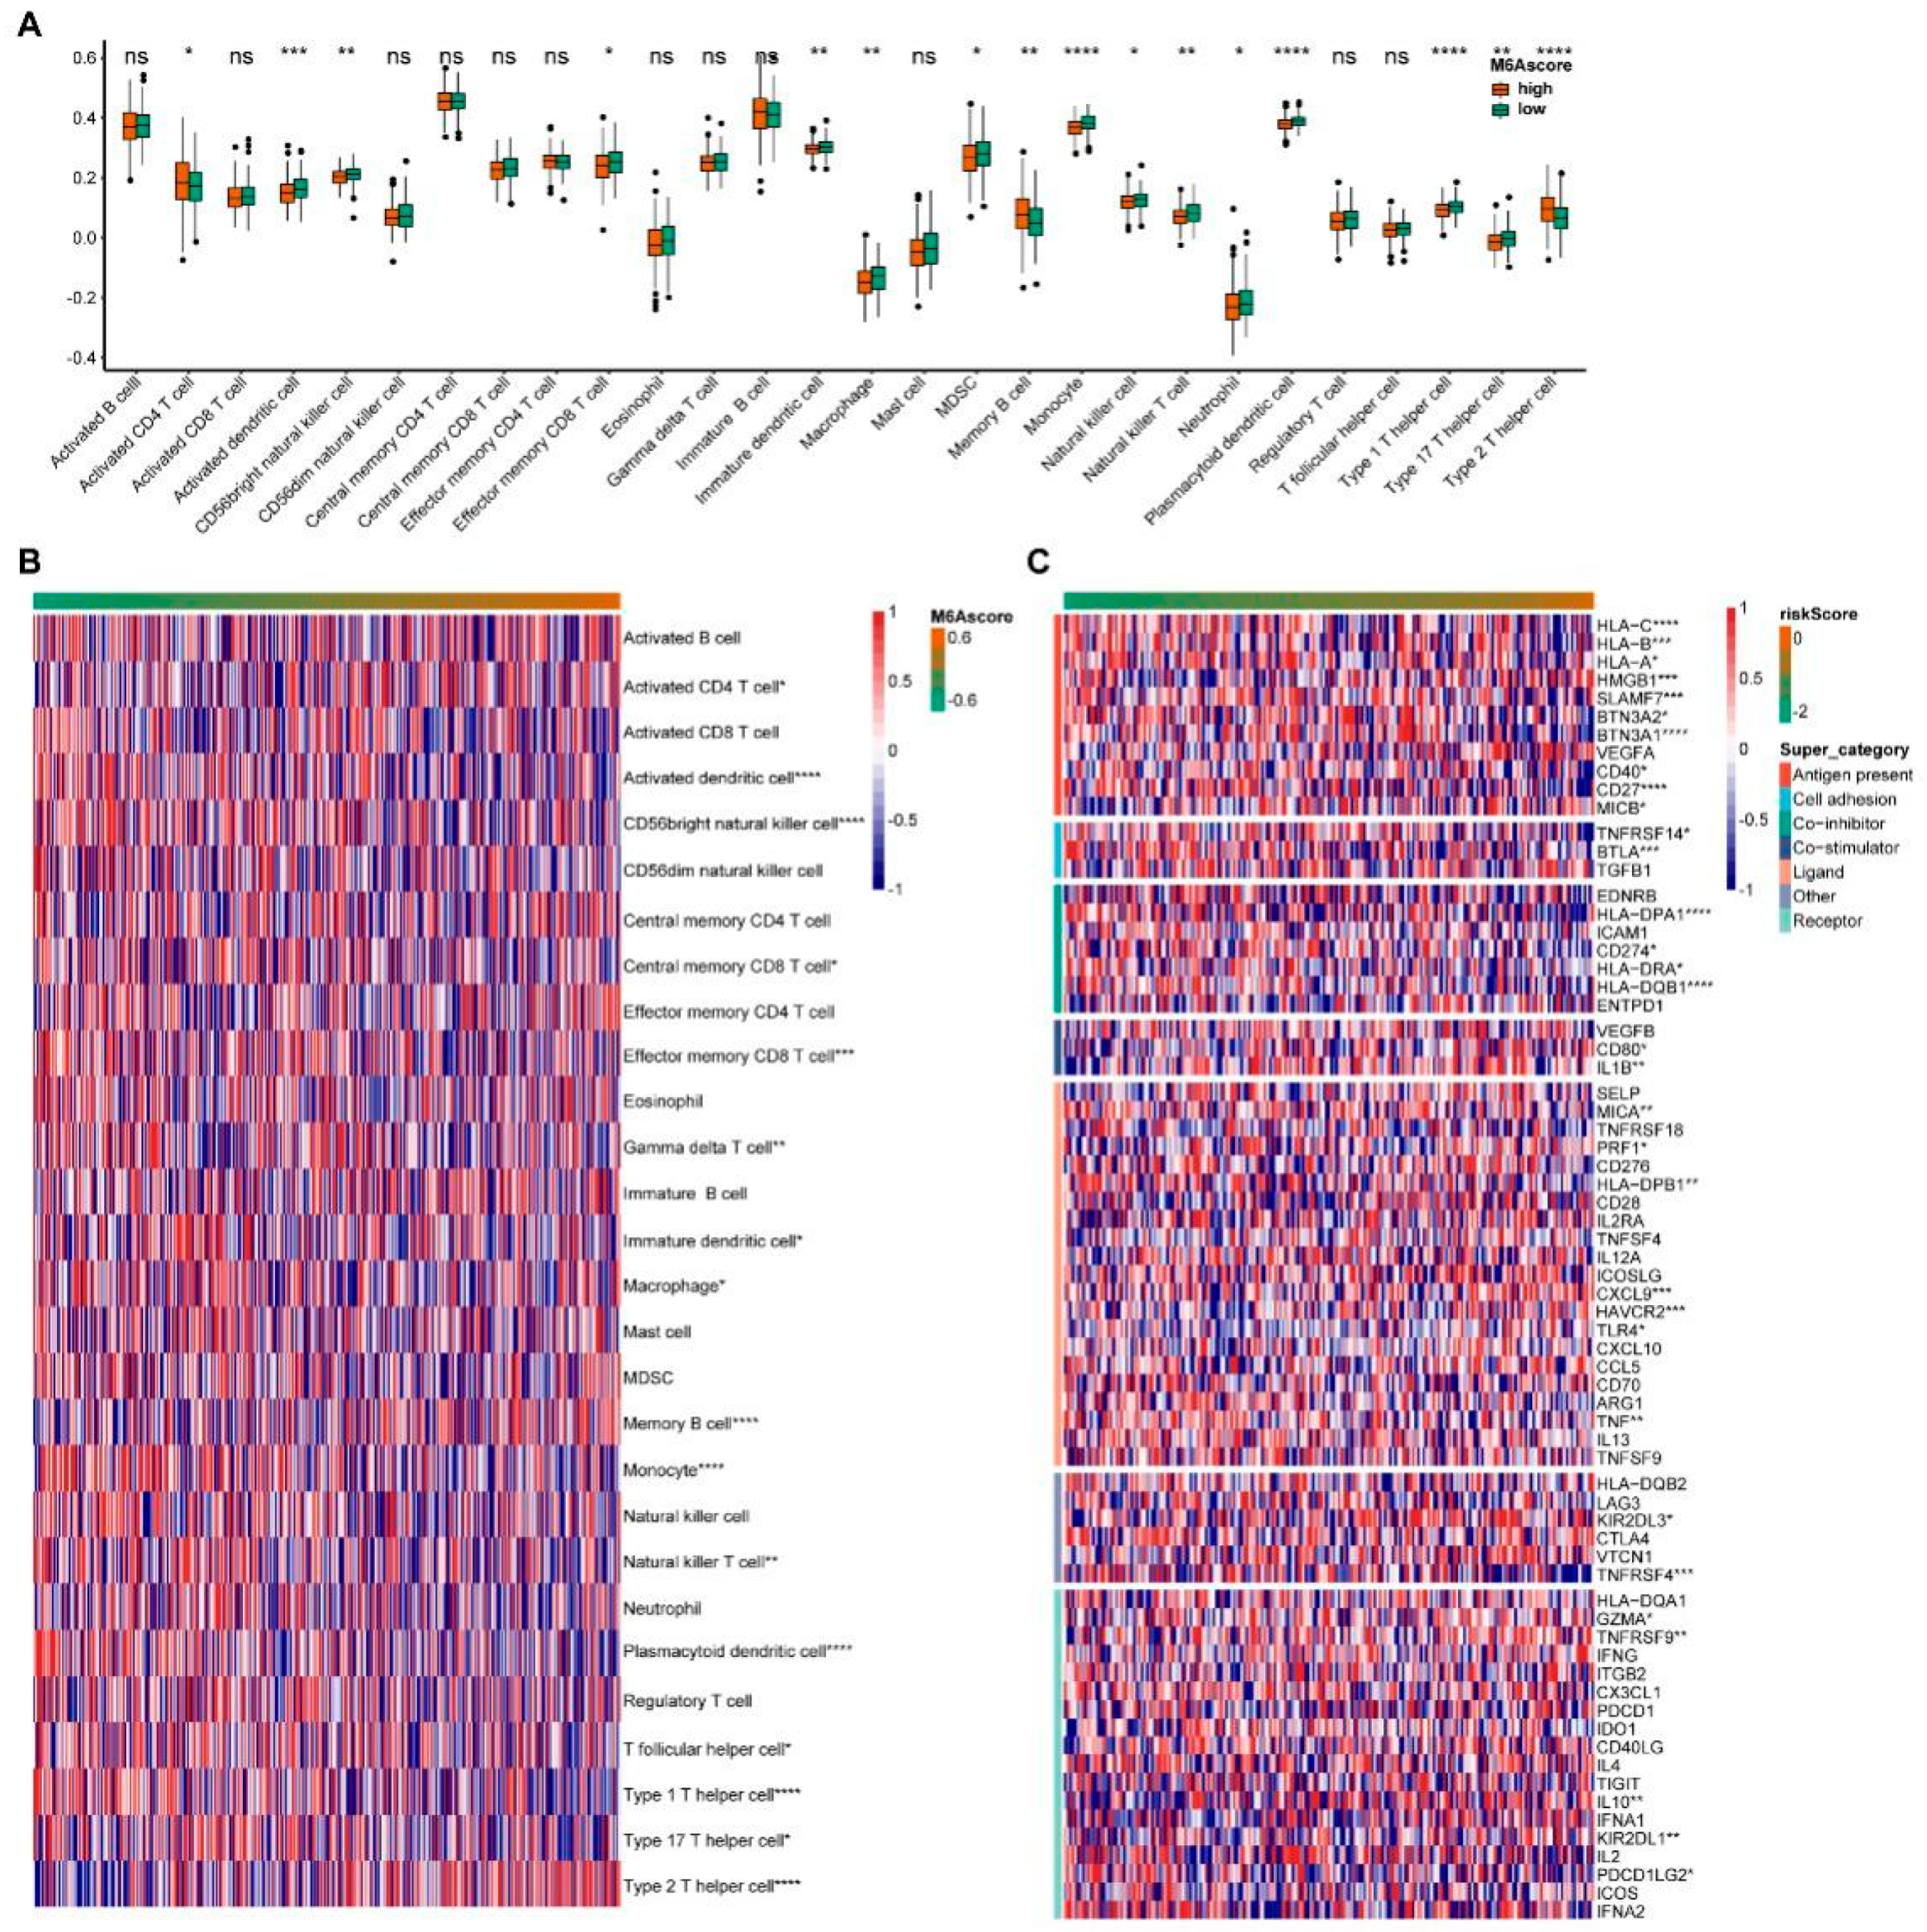
Next, we analyzed the data for 28 immune cell infiltrates. The immune cells showed significant differences between the high and low m6A scores groups, including the activated dendritic cells, CD56 bright natural killer cells, Monocytes, Plasmacytoid dendritic cells, Type 1 T helper cells, Type 2 T helper cells and other immune cells (Figure 3A). We continued to analyze the situation of immune cell infiltration from low to high m6A scores (Figure 3B). With the increase in the m6A score, the abundance of Memory B cells and Type 2 T helper cells increased, while activated dendritic cells, CD56 bright natural killer cells, Effector memory CD8 T cells and Monocytes decreased. Meanwhile, we analyzed the changes of immune checkpoints in the m6A score. With the m6A scores ranked from low to high, the expression abundance of immune checkpoints showed significant differences in multiple categories, including antigen-present, cell adhesion, co-inhibitor, co-stimulator, ligand and receptor (Figure 3C).
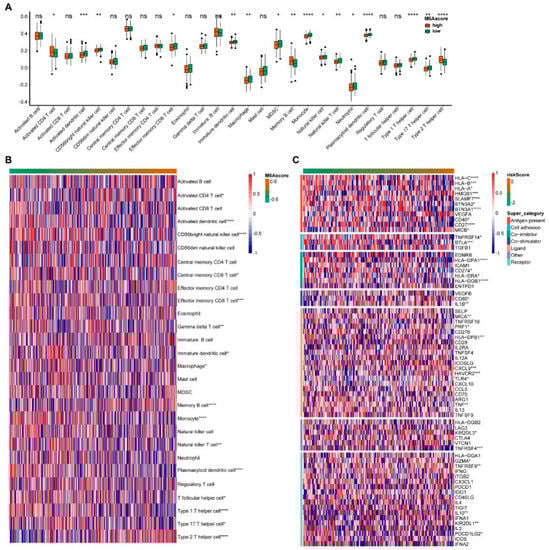
Figure 3.
Immune infiltration and immune checkpoint changes with m6A score. (A) Invasion of immune cells between the high and low m6A score groups. (B) The abundance of immune cells with m6A score. (C) The levels of the immune checkpoint with m6A score. * indicates significant, with a p value less than 0.05, ** indicates p value less than 0.01, *** indicates p value less than 0.001, and **** indicates p value less than 0.0001.
3.3. Establishment of Risk Scores Based on m6A Score
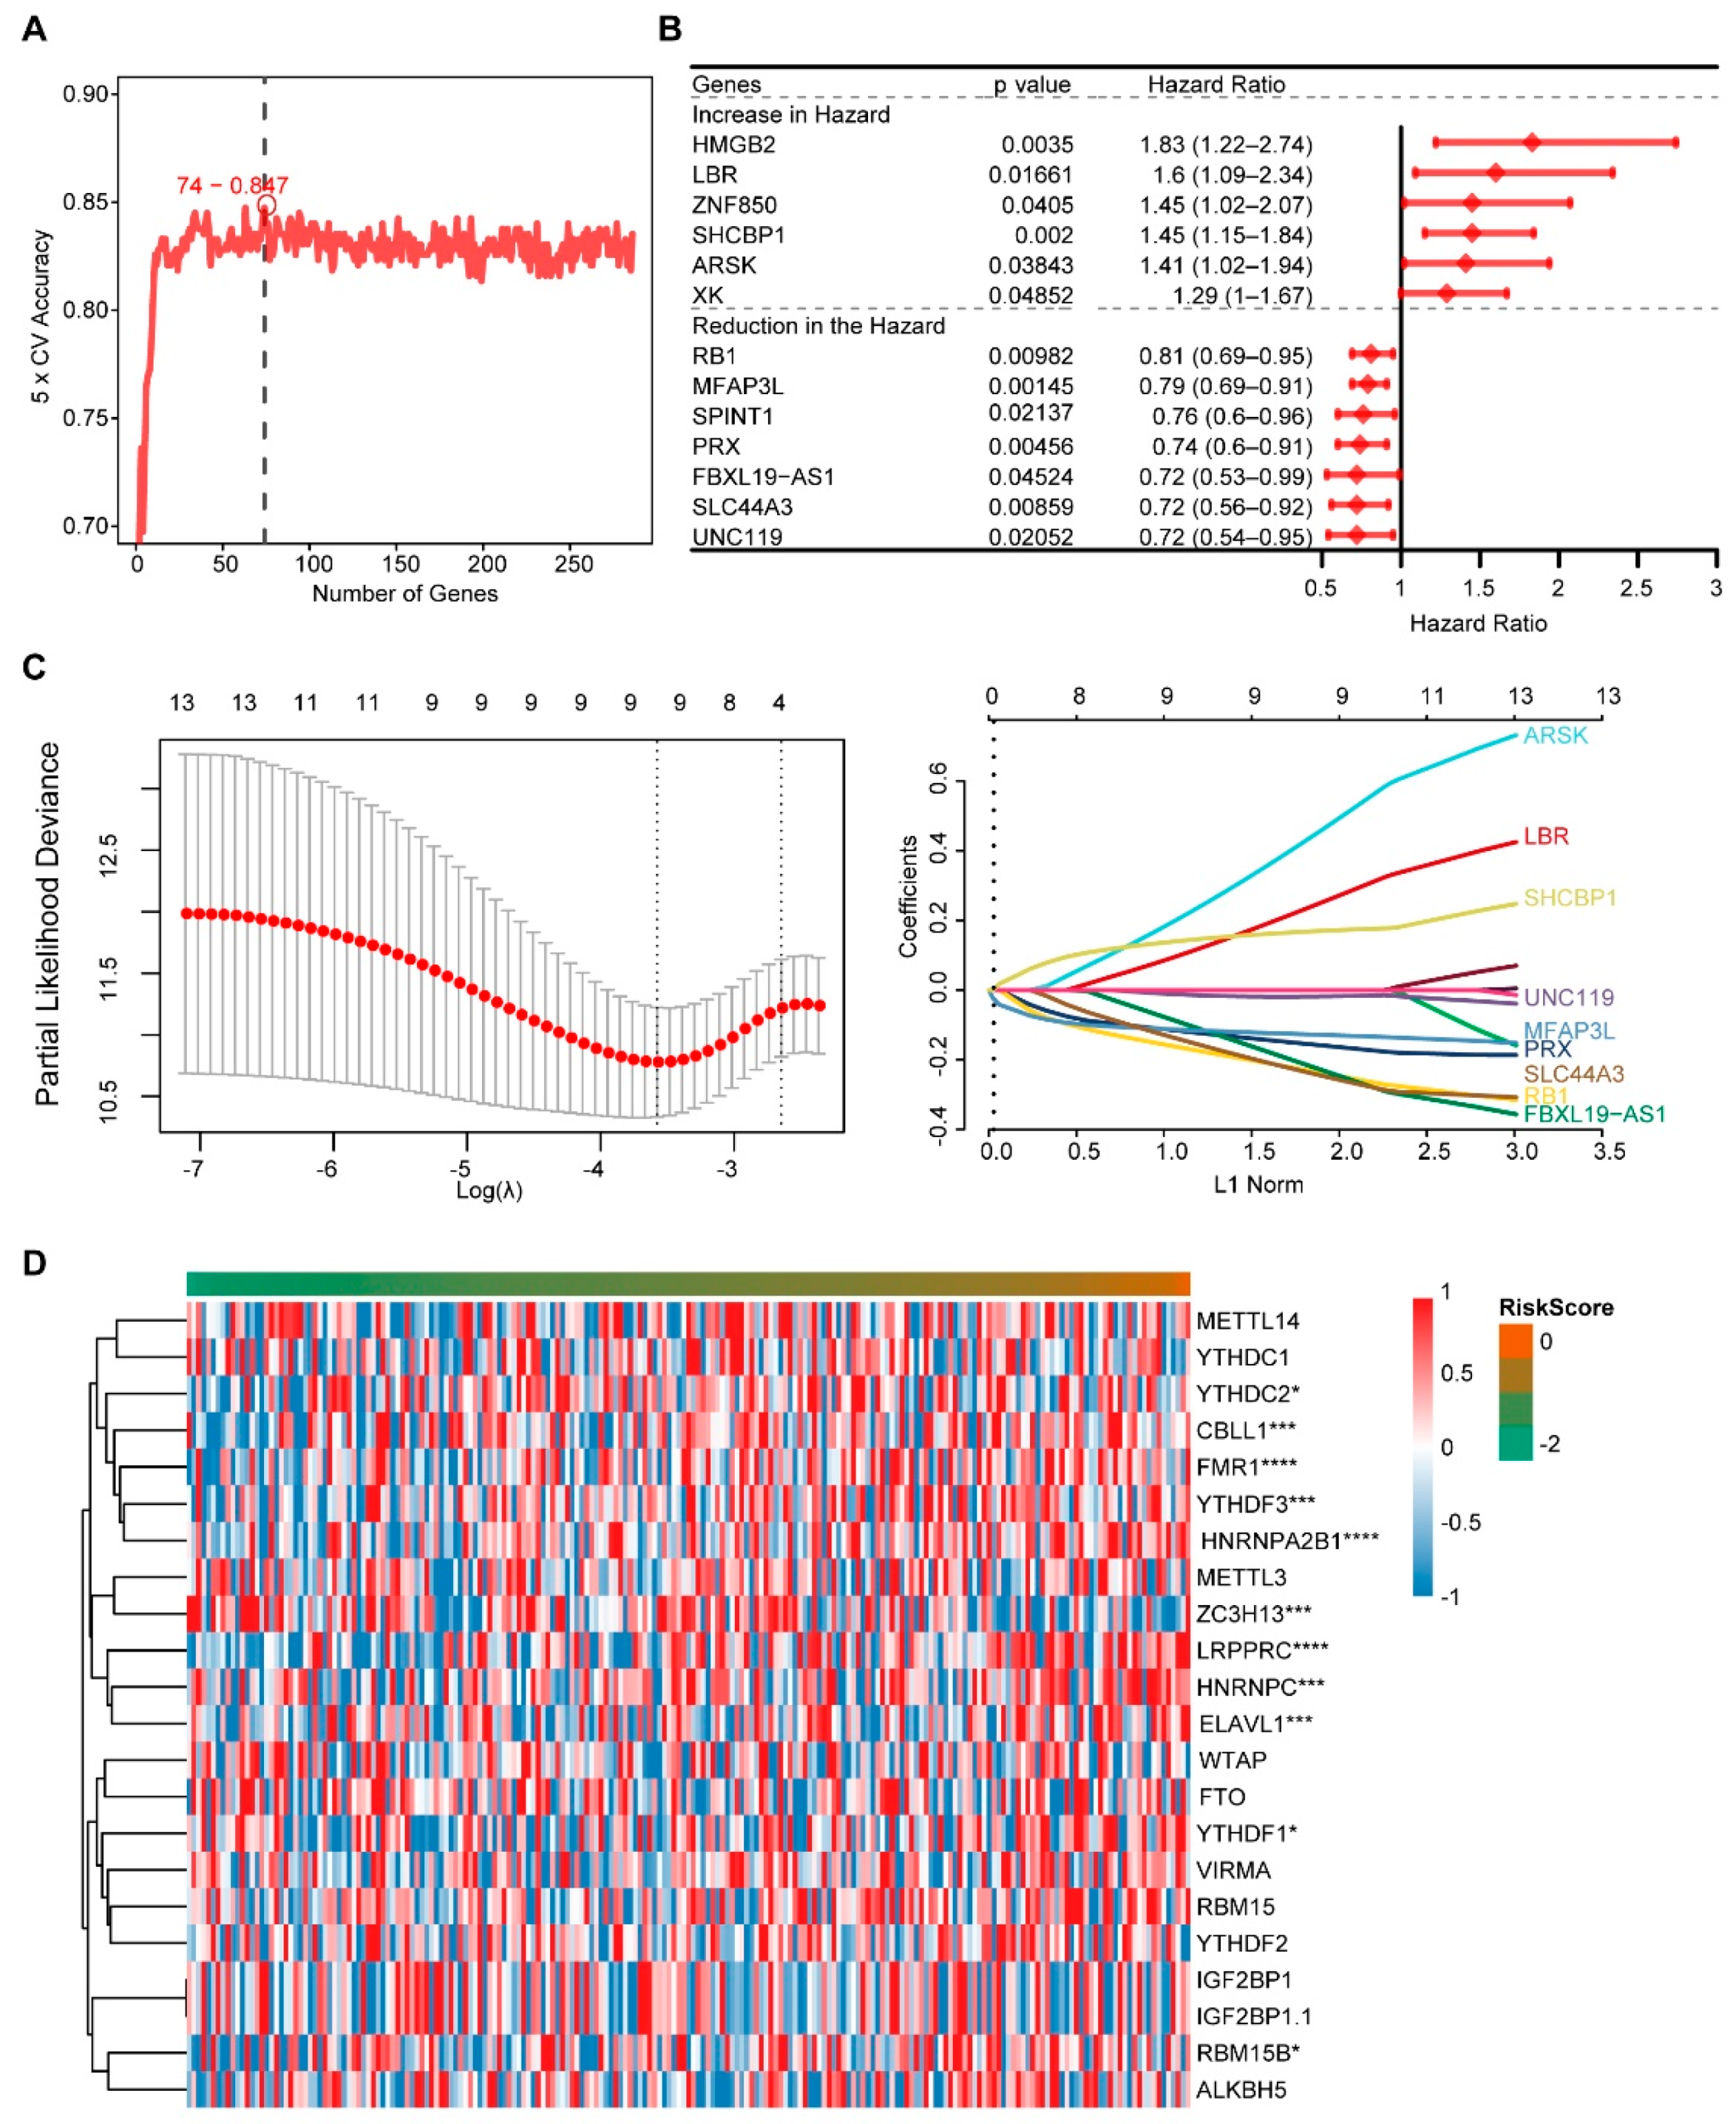
We obtained 286 DEGs between the two groups of m6A scores using Limma analysis, then 74 genes were obtained using Random forest (Figure 4A), and 13 genes were obtained using Univariate analysis (Figure 4B). The nine genes used to construct the Risk model were screened using the LASSO method, including PRX, LBR, RB1, FBXL19-AS1, ARSK, MFAP3L, SLC44A3, UNC119 and SHCBP1 (Figure 4C). Risk score = (−0.1257) * PRX + (0.1278) * LBR + (−0.1790) * RB1 + (−0.1191) * FBXL19-AS1 + (0.2528) * ARSK + (−0.1169) * MFAP3L + (−0.1636) * SLC44A3 + (−0.0158) * UNC119 + (0.1486) * SHCBP1. * represented a multiplication symbol. The heat map was used to visualize the expression of 21 m6A genes with risk scores (Figure 4D). The levels of m6A genes such as CBLL1, FMR1, YTHDF3, hnRNPA2B1 and ZC3H13 significantly changed with the risk score change.
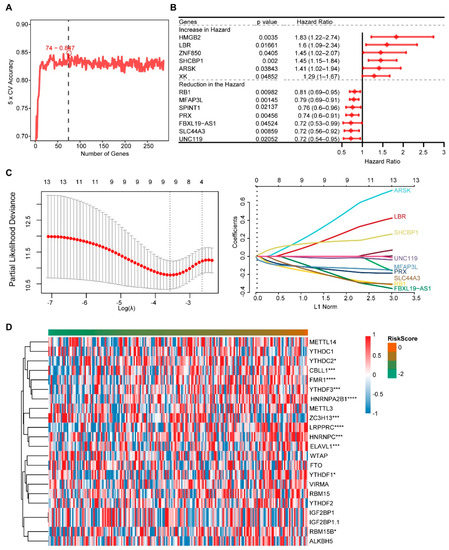
Figure 4.
Screening of high and low m6A score genes and construction of the risk score. (A) The Random forest analysis. (B) The Univariate Cox analysis of DEGs. (C) The LASSO regression analysis. (D) The levels of m6A genes. * indicates significant, with a p value less than 0.05, *** indicates p value less than 0.001, and **** indicates p value less than 0.0001.
3.4. Prognostic Analysis and Model Efficacy of Risk Score
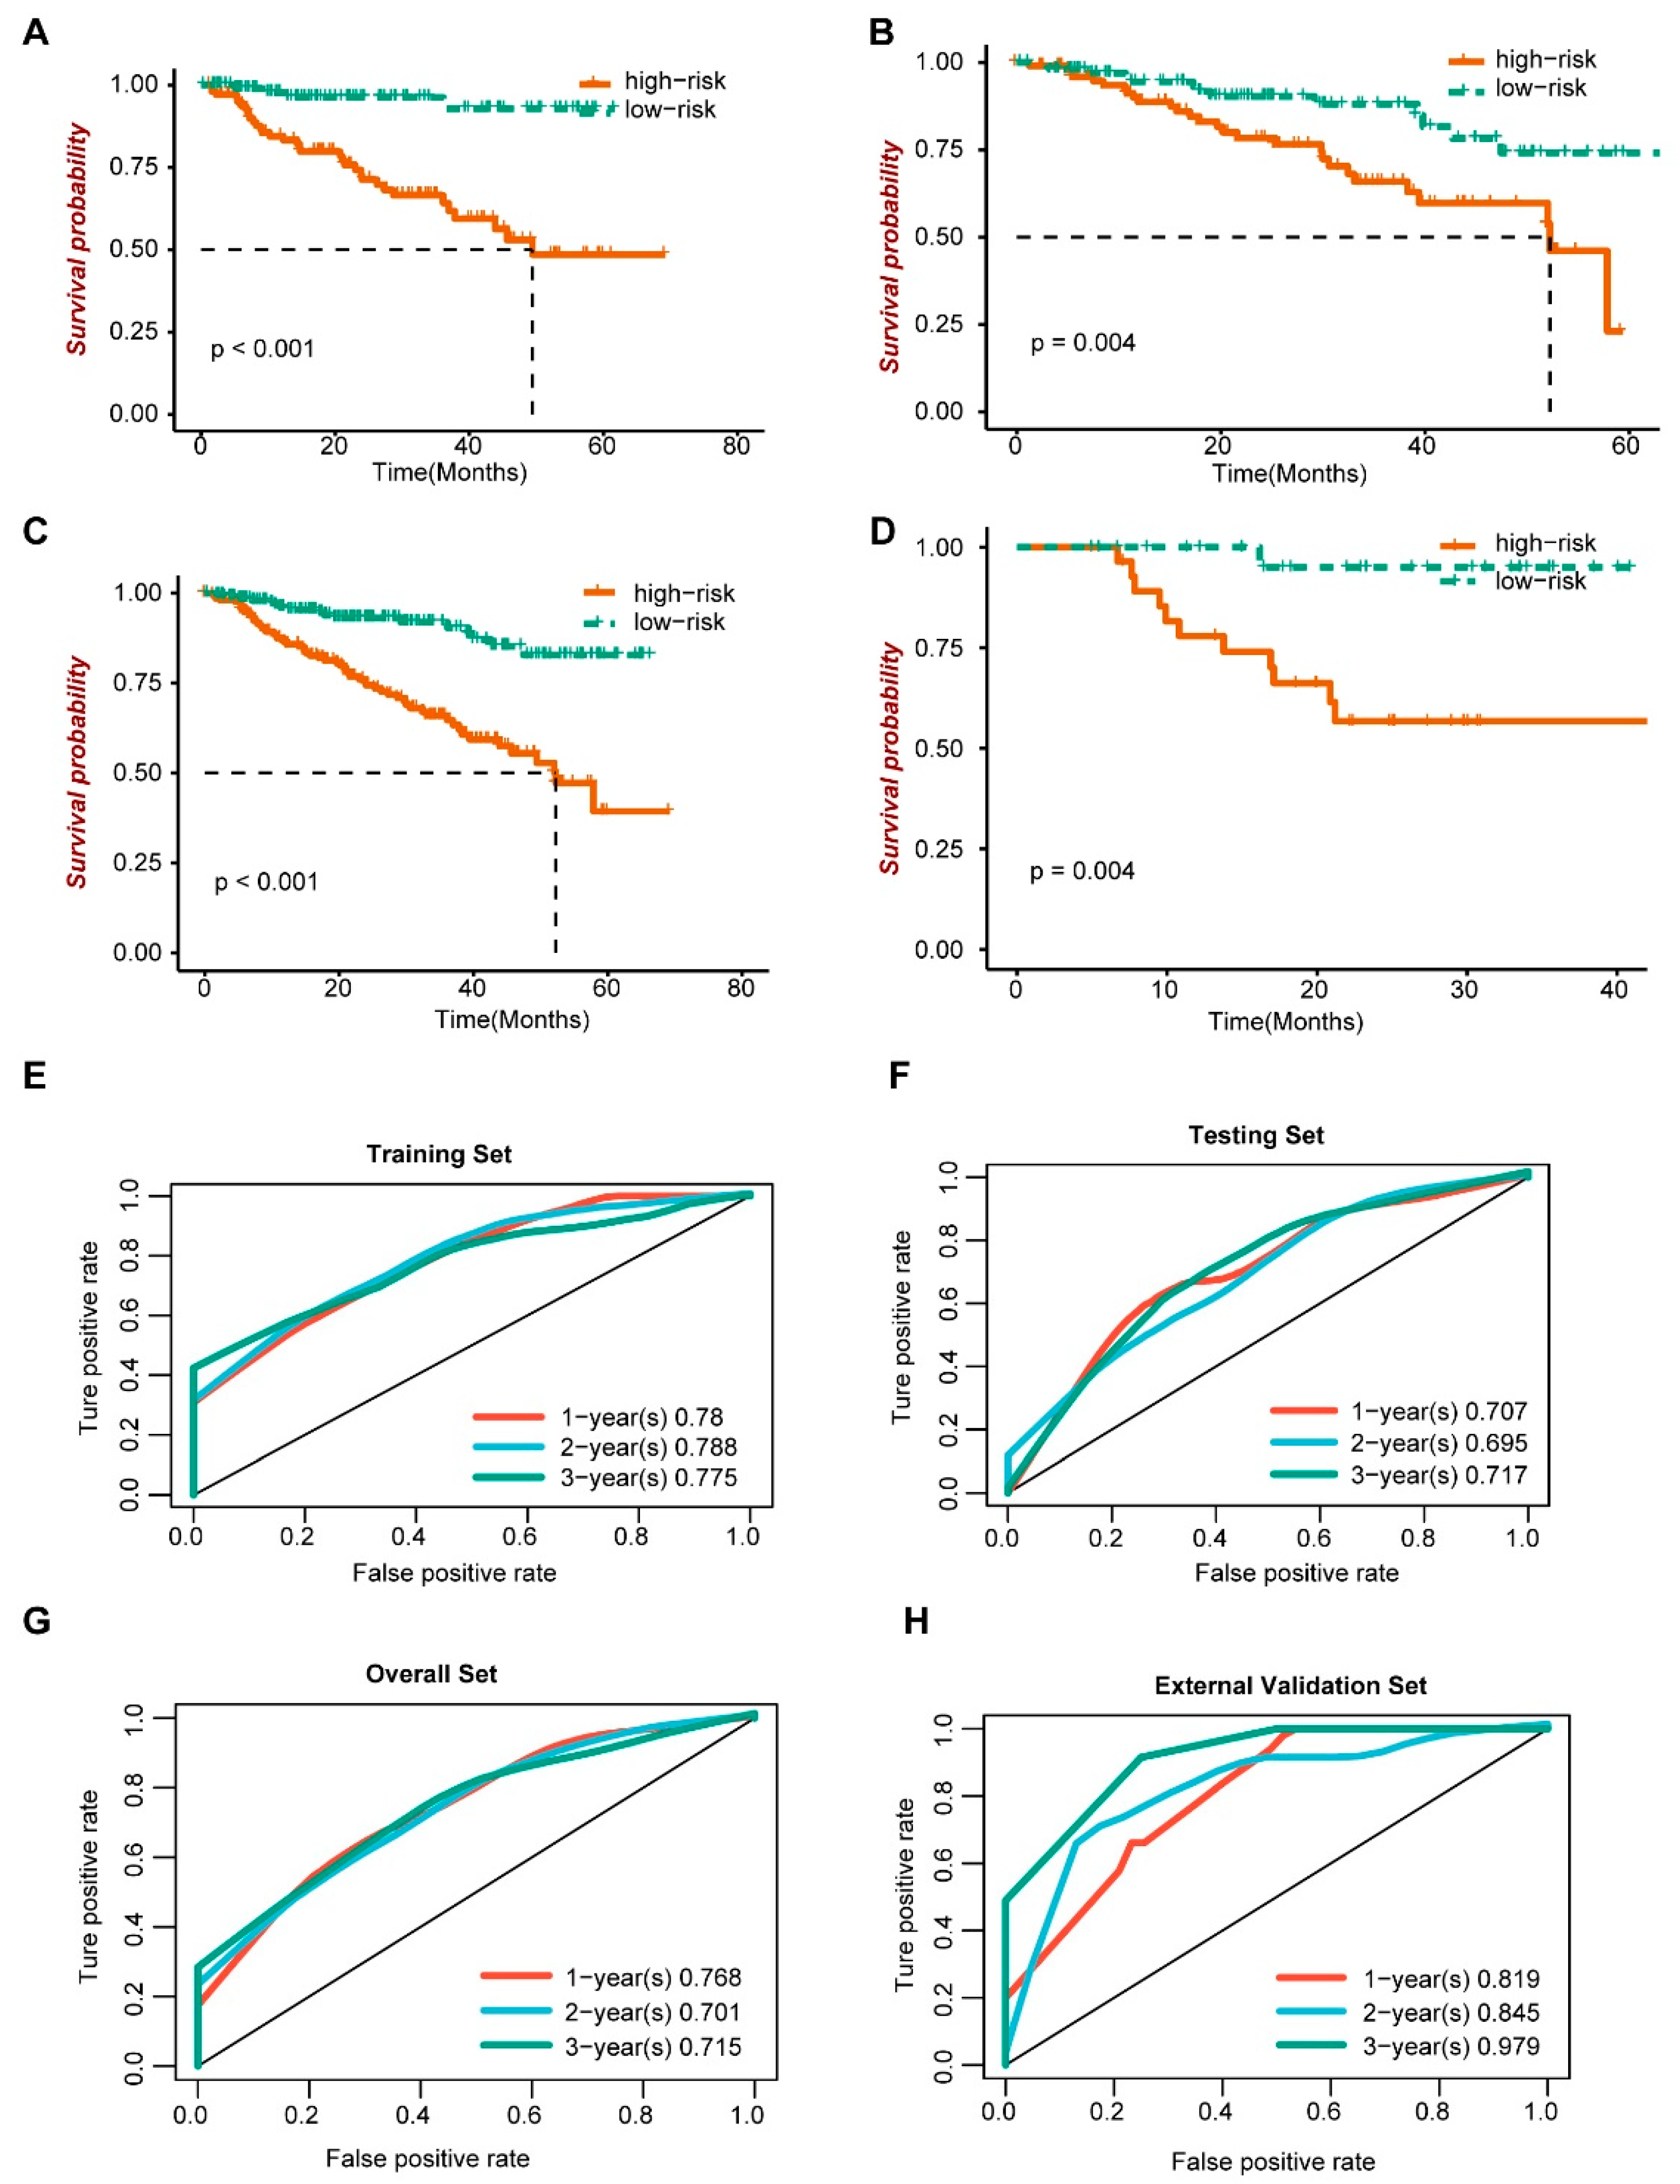
We further evaluated the prognosis of the risk score model. In the training set (Figure 5A), the validation set (Figure 5B), the overall data set (Figure 5C) and the external validation set (Figure 5D), the survival analysis showed that patients with the high-risk score had a poor prognosis, with p values less than 0.05. Then, the effectiveness of the risk score model was evaluated in the training set (Figure 5E), the verification set (Figure 5F), the overall data set (Figure 5G) and the external verification set (Figure 5H). Among them, in overall sets, the sensitivity at 1, 2 and 3 years was 0.557, 0.557 and 0.671, respectively; the specificity was 0.823, 0.823 and 0.704, respectively; the accuracy was 0.772, 0.772 and 0.697, respectively; and the AUC was 0.768, 0.701 and 0.715, respectively. The time-dependent ROC curve analysis showed that the model is effective.
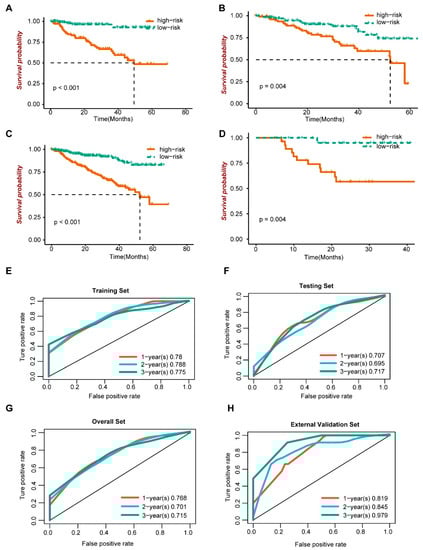
Figure 5.
Prognosis and efficacy evaluation of risk score model. (A–D) Survival analysis. (E–H) ROC curve.
3.5. Functional Analysis of Prognostic Models
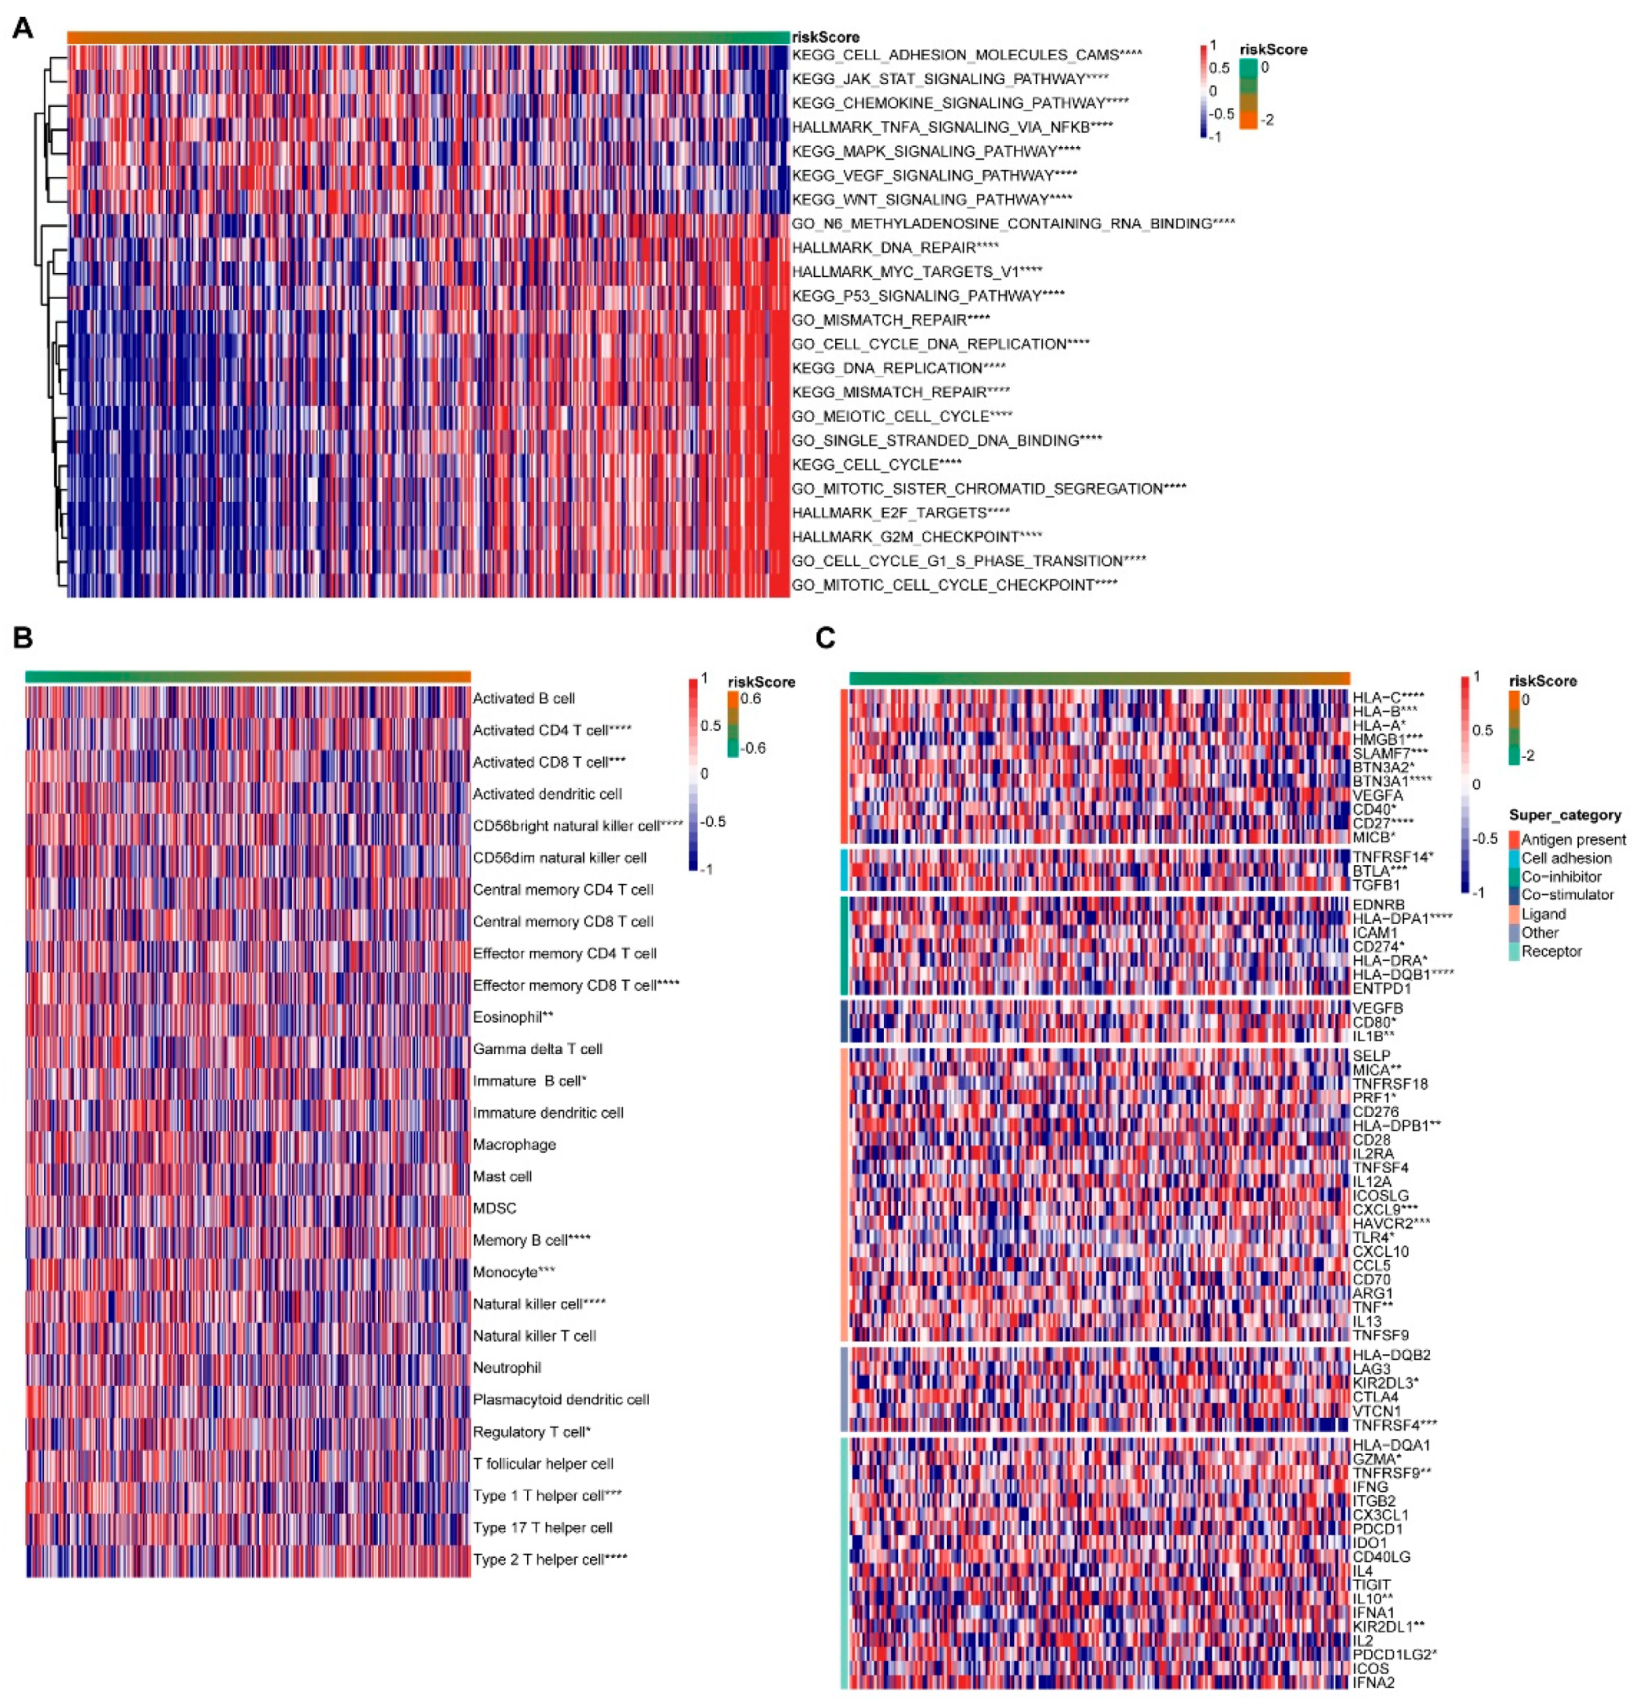
Then, in the GO BP (Biological Process), KEGG and Hallmark gene concentration, we used the GSVA R package to conduct related pathway analysis for the risk score (Figure 6A). As the risk score went up, the Cell adhesion molecules cams, the JAK-STAT signaling pathway, the TNFA signaling pathway and the MAPK signaling pathway all decreased. The DNA repair, the MYC targets V1, the P53 signaling pathway, the Cell cycle DNA replication, the DNA replication, the Meiotic cell cycle, the Cell cycle, the Mitotic sister chromatid segregation, the G2M checkpoint, the Cell cycle G1 S phase transition and the Mitotic cell cycle checkpoint increased. The higher the risk score is, the worse the patient’s survival rate is. It was suggested that the above pathway is related to the poor survival of patients. The immune cell infiltration was ranked according to the risk score from low to high (Figure 6B). The Activated CD4 T cell, Memory B cell and Type 2 T helper cell significantly increased with increasing risk scores. The Activated CD8 T cell, CD56 bright natural killer cell, Effector memory CD8 T cell, Monocyte, the natural killer cell and Type 1 T helper cell decreased significantly as the risk score increased. The immunization checkpoint was ranked as the risk score goes from low to high (Figure 6C). The levels of HLA-C, HLA-B, SLAMF7, BTN3A1, CD27, BTLA, HLA-DPA1, HLA-DQB1 and TNFRSF4 decreased significantly with the increase in the risk score, while HMGB1, CXCL9 and HAVCR2 increased.
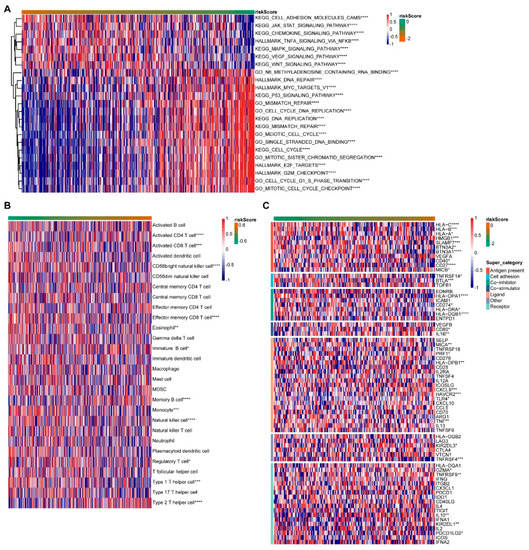
Figure 6.
Functional sequencing of prognostic models. (A) Pathway analysis. (B) Immune cell invasion. (C) Expression of immune checkpoints. * indicates a correlation p value less than 0.05, ** indicates p value less than 0.01, *** indicates p value less than 0.001, and **** indicates p value less than 0.0001.
4. Discussion
This study performed survival analysis and functional analysis of multiple myeloma genomes based on the m6A score. A risk model based on the m6A score was established to explore the influence of risk score on function, immune cells and immune checkpoints.
M6A is one of the most common RNA modifications. It has been reported that m6A disorder was closely related to the occurrence and development of cancer [20]. Our study found significant differences in the survival time and the biological function analysis between the two groups with high and low m6A scores. The higher the m6A score was, the shorter the survival time of patients was, which suggested that the study of multiple myeloma grouped by m6A score has certain clinical significance. The m6A score was negatively correlated with the survival rate of patients. It has been reported that m6A could regulate the biological process of cells by regulating the expression of genes [21,22]. In myeloid leukemia, promoter-bound METTL3 relies on translational control by m6A to maintain its status [23]. In liver cancer studies, KIAA1429 promotes cancer progression through post-transcriptional modification of GATA3 dependent on m6A [24]. All these suggested that m6A is involved in cancer development and confirmed the rationality of our grouping from the side.
Then, the Limma analysis, Random forest analysis, Univariate Cox regression analysis and Lasso analysis were performed to screen the DEGs of the two groups with high and low m6A scores. The risk prognoses model was constructed, containing PRX, LBR, RB1, FBXL19-AS1, ARSK, MFAP3L, SLC44A3, UNC119 and SHCBP1. Among them, PRX is involved in the regulation mechanism of the P53 signal [25,26]. RB1 is an important indicator of cell cycle regulation [27]. MFAP3L and SHCBP1 are involved in the development of breast cancer [28,29]. Meanwhile, the enrichment of pathways changed with the risk scores, including the P53 signaling pathway, Cell cycle DNA replication, DNA replication, Meiotic cell cycle and cell cycle. These pathways are involved in the development of multiple myeloma and are associated with the poor prognosis of patients. Therefore, it could be speculated that genes related to the m6A score affect the prognosis of multiple myeloma by regulating the related signaling pathways. The effect of the m6A score on the prognosis of patients with multiple myeloma was also verified.
The immune cells mainly influence the immune microenvironment of the tumor. We analyzed the invasion of immune cells and found that the immune cells, including the Activated CD4 T cell, the Memory B cell and the Type 2 T helper cell, were highly infiltrated in patients with multiple myeloma with poor prognosis. The CD4 T cell is also highly invasive in colorectal cancer patients [30]. The Type 2 T helper cells show contradictory effects in cancer immunity [31]. The opposite is true for immune cells with anti-tumor activity, including the activated CD8 T cell, CD56bright natural killer cell, Effector memory CD8 T cell, Monocyte, natural killer cell and Type 1 T helper cell, etc. GSVA was used to analyze the correlation between risk score and immune checkpoints such as the antigen present, cell adhesion, co-inhibitor, co-stimulator, Ligand and receptor. Among them, HMGB1, CXCL9 and HAVCR2 were all significantly positively correlated with the risk score. HMGB1 is one of the damage-associated molecular patterns (DAMP) and plays a multifunctional role in inflammation and the development of cancer (such as colorectal cancer) [32,33]. It has been reported that CXCL9 is associated with the infiltration of immune cells and affects the prognosis of breast cancer patients [34]. HAVCR2 inhibitors have been proven to have certain tumor-suppressive effects in various preclinical tumor models [35]. All of these suggest that the risk score model has good efficiency. Meanwhile, it is further verified that the m6A score has a certain diagnostic effect on the prognosis of patients with multiple myeloma.
However, due to the lack of clinical data on multiple myeloma in the data set, our study was still limited. We were unable to further analyze its clinical features. Meanwhile, we need to verify their specific expression in clinical samples for m6A-related genes, and DEGs screened based on public data. As for the risk model constructed by nine DEGs, it still needs the support of a large number of sample data. Functional prediction also needs to be validated in concrete experimental models.
5. Conclusions
In our study of multiple myeloma, the patients with a high m6A score had a poorer prognosis. The m6A score was closely related to immune cell infiltration and the immune checkpoint. Thus, the m6A score could be used as a potential prognostic marker in multiple myeloma.
Author Contributions
G.X., Q.Y. and W.W. were involved in the conception of this study. G.X. and Q.Y. analyzed the dataset and prepared the figures and tables. Q.Y. and W.W. checked the manuscript. All authors have read and agreed to the published version of the manuscript.
Funding
This work is supported by a China National Science Foundation grant (81401227); Natural Science Foundation of Hunan Province, China grant (2019JJ20035); Natural Science Foundation of Hunan Province, China grant (2020JJ5942).
Institutional Review Board Statement
Not applicable.
Informed Consent Statement
Not applicable.
Data Availability Statement
The data supporting the findings of this study are from previously reported studies and datasets. The processed data are available from corresponding author upon request.
Conflicts of Interest
The authors declare that there is no conflict of interest regarding the publication of this paper.
References
- Barwick, B.G.; Gupta, V.A.; Vertino, P.M.; Boise, L.H. Cell of origin and genetic alterations in the pathogenesis of multiple myeloma. Front. Immunol. 2019, 10, 1121. [Google Scholar] [CrossRef] [Green Version]
- Neuse, C.J.; Lomas, O.C.; Schliemann, C.; Shen, Y.J.; Manier, S.; Bustoros, M.; Ghobrial, I.M. Genome instability in multiple myeloma. Leukemia 2020, 34, 2887–2897. [Google Scholar] [CrossRef] [PubMed]
- Fonseca, R.; Abouzaid, S.; Bonafede, M.; Cai, Q.; Parikh, K.; Cosler, L.; Richardson, P. Trends in overall survival and costs of multiple myeloma, 2000–2014. Leukemia 2017, 31, 1915–1921. [Google Scholar] [CrossRef] [Green Version]
- Shah, U.A.; Mailankody, S. Emerging immunotherapies in multiple myeloma. BMJ 2020, 370, m3176. [Google Scholar] [CrossRef] [PubMed]
- Pawlyn, C.; Morgan, G.J. Evolutionary biology of high-risk multiple myeloma. Nat. Rev. Cancer 2017, 17, 543–556. [Google Scholar] [CrossRef]
- Wu, Y.; Zhou, C.; Yuan, Q. Role of DNA and RNA N6-adenine methylation in regulating stem cell fate. Curr. Stem Cell Res. Ther. 2018, 13, 31–38. [Google Scholar] [CrossRef]
- Du, Y.; Hou, G.; Zhang, H.; Dou, J.; He, J.; Guo, Y.; Li, L.; Chen, R.; Wang, Y.; Deng, R.; et al. SUMOylation of the m6A-RNA methyltransferase METTL3 modulates its function. Nucleic Acids Res. 2018, 46, 5195–5208. [Google Scholar] [CrossRef]
- Zhao, B.S.; Roundtree, I.A.; He, C. Post-transcriptional gene regulation by mRNA modifications. Nat. Rev. Mol. Cell. Biol. 2017, 18, 31–42. [Google Scholar] [CrossRef]
- Lence, T.; Akhtar, J.; Bayer, M.; Schmid, K.; Spindler, L.; Ho, C.H.; Kreim, N.; Andrade-Navarro, M.A.; Poeck, B.; Helm, M.; et al. m(6)A modulates neuronal functions and sex determination in Drosophila. Nature 2016, 540, 242–247. [Google Scholar] [CrossRef] [PubMed]
- Taguchi, Y.; Dharshini, S.; Gromiha, M.M. Identification of transcription factors, biological pathways, and diseases as mediated by N6-methyladenosine using tensor decomposition-based unsupervised feature extraction. Appl. Sci. 2021, 11, 213. [Google Scholar] [CrossRef]
- Liu, X.; Liu, L.; Dong, Z.; Li, J.; Yu, Y.; Chen, X.; Ren, F.; Cui, G.; Sun, R. Expression patterns and prognostic value of m(6)A-related genes in colorectal cancer. Am. J. Transl. Res. 2019, 11, 3972–3991. [Google Scholar]
- Wang, Y.; Ren, F.; Song, Z.; Wang, X.; Ma, X. Multiomics profile and prognostic gene signature of m6A regulators in uterine corpus endometrial carcinoma. J. Cancer 2020, 11, 6390–6401. [Google Scholar] [CrossRef] [PubMed]
- Huang, G.Z.; Wu, Q.Q.; Zheng, Z.N.; Shao, T.R.; Chen, Y.C.; Zeng, W.S.; Lv, X.Z. M6A-related bioinformatics analysis reveals that HNRNPC facilitates progression of OSCC via EMT. Aging 2020, 12, 11667–11684. [Google Scholar] [CrossRef] [PubMed]
- Li, J.; Rao, B.; Yang, J.; Liu, L.; Huang, M.; Liu, X.; Cui, G.; Li, C.; Han, Q.; Yang, H.; et al. Dysregulated m6A-related regulators are associated with tumor metastasis and poor prognosis in osteosarcoma. Front. Oncol. 2020, 10, 769. [Google Scholar] [CrossRef] [PubMed]
- Visvanathan, A.; Patil, V.; Arora, A.; Hegde, A.S.; Arivazhagan, A.; Santosh, V.; Somasundaram, K. Essential role of METTL3-mediated m(6)A modification in glioma stem-like cells maintenance and radioresistance. Oncogene 2018, 37, 522–533. [Google Scholar] [CrossRef]
- Subramanian, A.; Tamayo, P.; Mootha, V.K.; Mukherjee, S.; Ebert, B.L.; Gillette, M.A.; Paulovich, A.; Pomeroy, S.L.; Golub, T.R.; Lander, E.S.; et al. Gene set enrichment analysis: A knowledge-based approach for interpreting genome-wide expression profiles. Proc. Natl. Acad. Sci. USA 2005, 102, 15545–15550. [Google Scholar] [CrossRef] [Green Version]
- Ritchie, M.E.; Phipson, B.; Wu, D.; Hu, Y.; Law, C.W.; Shi, W.; Smyth, G.K. limma powers differential expression analyses for RNA-sequencing and microarray studies. Nucleic Acids Res. 2015, 43, e47. [Google Scholar] [CrossRef]
- Zhang, H.; Song, J.; Dong, J.; Liu, Z.; Lin, L.; Wang, B.; Ma, Q.; Ma, L. Tumor microenvironment analysis identified subtypes associated with the prognosis and the tumor response to immunotherapy in bladder cancer. Front. Genet. 2021, 12, 551605. [Google Scholar] [CrossRef]
- Robin, X.; Turck, N.; Hainard, A.; Tiberti, N.; Lisacek, F.; Sanchez, J.C.; Müller, M. pROC: An open-source package for R and S+ to analyze and compare ROC curves. BMC Bioinform. 2011, 12, 77. [Google Scholar] [CrossRef]
- Zhao, W.; Qi, X.; Liu, L.; Ma, S.; Liu, J.; Wu, J. Epigenetic regulation of m(6)A modifications in human cancer. Mol. Ther. Nucleic Acids 2020, 19, 405–412. [Google Scholar] [CrossRef]
- He, L.; Li, H.; Wu, A.; Peng, Y.; Shu, G.; Yin, G. Functions of N6-methyladenosine and its role in cancer. Mol. Cancer 2019, 18, 176. [Google Scholar] [CrossRef] [Green Version]
- Chen, X.Y.; Zhang, J.; Zhu, J.S. The role of m(6)A RNA methylation in human cancer. Mol. Cancer 2019, 18, 103. [Google Scholar] [CrossRef] [Green Version]
- Barbieri, I.; Tzelepis, K.; Pandolfini, L.; Shi, J.; Millán-Zambrano, G.; Robson, S.C.; Aspris, D.; Migliori, V.; Bannister, A.J.; Han, N.; et al. Promoter-bound METTL3 maintains myeloid leukaemia by m(6)A-dependent translation control. Nature 2017, 552, 126–131. [Google Scholar] [CrossRef] [PubMed]
- Lan, T.; Li, H.; Zhang, D.; Xu, L.; Liu, H.; Hao, X.; Yan, X.; Liao, H.; Chen, X.; Xie, K.; et al. KIAA1429 contributes to liver cancer progression through N6-methyladenosine-dependent post-transcriptional modification of GATA3. Mol. Cancer 2019, 18, 186. [Google Scholar] [CrossRef]
- Popowich, D.A.; Vavra, A.K.; Walsh, C.P.; Bhikhapurwala, H.A.; Rossi, N.B.; Jiang, Q.; Aalami, O.O.; Kibbe, M.R. Regulation of reactive oxygen species by p53: Implications for nitric oxide-mediated apoptosis. Am. J. Physiol. Heart Circ. Physiol. 2010, 298, H2192–H2200. [Google Scholar] [CrossRef] [PubMed] [Green Version]
- Morinaka, A.; Funato, Y.; Uesugi, K.; Miki, H. Oligomeric peroxiredoxin-I is an essential intermediate for p53 to activate MST1 kinase and apoptosis. Oncogene 2011, 30, 4208–4218. [Google Scholar] [CrossRef] [PubMed] [Green Version]
- Knudsen, E.S.; Pruitt, S.C.; Hershberger, P.A.; Witkiewicz, A.K.; Goodrich, D.W. Cell cycle and beyond: Exploiting new RB1 controlled mechanisms for cancer therapy. Trends Cancer 2019, 5, 308–324. [Google Scholar] [CrossRef]
- Savci-Heijink, C.D.; Halfwerk, H.; Koster, J.; van de Vijver, M.J. A novel gene expression signature for bone metastasis in breast carcinomas. Breast Cancer Res. Treat. 2016, 156, 249–259. [Google Scholar] [CrossRef] [PubMed] [Green Version]
- Feng, W.; Li, H.C.; Xu, K.; Chen, Y.F.; Pan, L.Y.; Mei, Y.; Cai, H.; Jiang, Y.M.; Chen, T.; Feng, D.X. SHCBP1 is over-expressed in breast cancer and is important in the proliferation and apoptosis of the human malignant breast cancer cell line. Gene 2016, 587, 91–97. [Google Scholar] [CrossRef] [PubMed]
- Toor, S.M.; Murshed, K.; Al-Dhaheri, M.; Khawar, M.; Abu Nada, M.; Elkord, E. Immune checkpoints in circulating and tumor-infiltrating CD4(+) T cell subsets in colorectal cancer patients. Front. Immunol. 2019, 10, 2936. [Google Scholar] [CrossRef]
- Chraa, D.; Naim, A.; Olive, D.; Badou, A. T lymphocyte subsets in cancer immunity: Friends or foes. J. Leukoc. Biol. 2019, 105, 243–255. [Google Scholar] [CrossRef]
- Cheng, K.J.; Alshawsh, M.A.; Mejia Mohamed, E.H.; Thavagnanam, S.; Sinniah, A.; Ibrahim, Z.A. HMGB1: An overview of its versatile roles in the pathogenesis of colorectal cancer. Cell. Oncol. 2020, 43, 177–193. [Google Scholar] [CrossRef]
- Wang, S.; Zhang, Y. HMGB1 in inflammation and cancer. J. Hematol. Oncol. 2020, 13, 116. [Google Scholar] [CrossRef] [PubMed]
- Li, Y.; Liang, M.; Lin, Y.; Lv, J.; Chen, M.; Zhou, P.; Fu, F.; Wang, C. Transcriptional expressions of CXCL9/10/12/13 as prognosis factors in breast cancer. J. Oncol. 2020, 2020, 4270957. [Google Scholar] [CrossRef] [PubMed]
- Das, M.; Zhu, C.; Kuchroo, V.K. Tim-3 and its role in regulating anti-tumor immunity. Immunol. Rev. 2017, 276, 97–111. [Google Scholar] [CrossRef] [PubMed] [Green Version]
Publisher’s Note: MDPI stays neutral with regard to jurisdictional claims in published maps and institutional affiliations. |
© 2021 by the authors. Licensee MDPI, Basel, Switzerland. This article is an open access article distributed under the terms and conditions of the Creative Commons Attribution (CC BY) license (https://creativecommons.org/licenses/by/4.0/).