Article

A Smart Health (sHealth)-Centric Method toward Estimation of Sleep Deficiency Severity from Wearable Sensor Data Fusion

by
Md Juber Rahman
1,*,
Bashir I. Morshed
2 and
Chrysanthe Preza
1
1
Electrical and Computer Engineering Department, The University of Memphis, Memphis, TN 38111, USA
2
Department of Computer Science, Texas Tech University, Lubbock, TX 79409, USA
*
Author to whom correspondence should be addressed.
BioMedInformatics 2021, 1(3), 106-126; https://doi.org/10.3390/biomedinformatics1030008
Submission received: 4 July 2021 / Revised: 22 September 2021 / Accepted: 15 October 2021 / Published: 26 October 2021

Abstract

:
Sleep deficiency impacts the quality of life and may have serious health consequences in the long run. Questionnaire-based subjective assessment of sleep deficiency has many limitations. On the other hand, objective assessment of sleep deficiency is challenging. In this study, we propose a polysomnography-based mathematical model for computing baseline sleep deficiency severity score and then investigated the estimation of sleep deficiency severity using features available only from wearable sensor data including heart rate variability and single-channel electroencephalography for a dataset of 500 subjects. We used Monte-Carlo feature selection (MCFS) and inter-dependency discovery for selecting the best features and removing multi-collinearity. For developing the Regression model we investigated both the frequentist and the Bayesian approaches. An artificial neural network achieved the best performance of RMSE = 5.47 and an R-squared value of 0.67 for sleep deficiency severity estimation. The developed method is comparable to conventional methods of Functional Outcome of Sleep Questionnaire and Epworth Sleepiness Scale for assessing the impact of sleep apnea on sleep deficiency. Moreover, the results pave the way for reliable and interpretable sleep deficiency severity estimation using single-channel EEG.

1. Introduction

Sleep is an important biological process and plays a key role in restoring energy, solidifying and consolidating memories, and repairing body cells. It is controlled by the circadian biological clock and sleep/wake homeostasis and also helps regulate metabolism and cardiovascular function [1]. With the rise of obesity, excessive usage of personal gadgets, rapid urbanization, and other socio-economic changes, sleep/wake homeostasis is increasingly impacted, disrupting the normal circadian rhythm and healthy sleep. Good quality sleep is essential for optimal health and improved quality of life. Neither body nor the brain can function properly without sufficient sleep. Research suggests that complete sleep deprivation significantly impairs attention and working memory [2]. Moreover, it also affects other important functions, such as long-term memory and decision-making. Even partial sleep deprivation can negatively impact attention, and vigilance in the long run [3]. Moreover, sleep deficiency can lead to physical and mental health problems, injuries, loss of productivity, and even greater risk of life-threatening diseases [4,5].
The common practice to evaluate sleep health is to use standard questionnaires along with a sleep test where a polysomnogram is captured. The questionnaire-based approach has many limitations including high bias, long evaluation period, etc. Polysomnogram is expensive, has limited availability, and less user-friendly. In recent years, there has been a significant expansion in the development and use of multi-modal sensors and technologies to monitor sleep which includes sleep patterns monitoring, wellness applications, sleep coaching of individuals with chronic conditions, etc. [6]. Kuo et al. developed an actigraphy-based wearable device for sleep quality assessment [7]. Mendonca et al. proposed a method for sleep quality estimation using electrocardiogram by cardiopulmonary coupling analysis [8]. Azimi et al. reported an objective IoT-based longitudinal study for sleep quality assessment [9]. They estimated the sleep quality average to classify sleep into good or poor quality. Bsoul et al. developed a Sleep Efficiency Index based on ECG features using support vector machines [10]. Some research group explored deep learning based approaches for sleep assessment/scoring [11,12,13,14]. During sleep scoring information from the electrophysiological signal are extracted to detect sleep stages, arousals, respiratory events, movements, etc. Additionally, some commercial devices e.g., the Fitbit Charge smart band (Fitbit Inc., San Francisco, CA, USA), the Apple Watch (Apple Inc., Cupertino, CA, USA), the Oura sleep ring (Oura Health Ltd., Oulu, Finland) have attempted the estimation of sleep scores from non-polysomnographic measures. However, most of the previous approaches were focused on sleep quality assessment or sleep score estimation. Sleep deficiency provides a more specific evaluation of sleep disorder than sleep score or the sleep quality, as sleep deficiency includes lack of enough sleep (sleep deprivation), not getting all types of sleep that the human body needs, and poor quality of sleep [15]. Early detection of sleep deficiency is beneficial to avoid many linked chronic health problems, including heart disease, kidney disease, high blood pressure, diabetes, stroke, obesity, and depression. A method for objective assessment of sleep deficiency from wearable sensor data only is not well-established yet requiring further investigation.
The main objective of this work was to develop a physiological sensor data-based objective sleep deficiency assessment method that can be integrated with user-friendly wearables e.g., smartwatch, smart band, etc. We proposed a mathematical model to facilitate a quantitative evaluation of sleep deficiency based on polysomnogram features. Then we addressed the same problem of estimating sleep deficiency severity when polysomnogram data is not available, with a machine learning-driven model using ECG/EEG based features that can be captured by wearables. The contribution of this work is summarised below:
(i)
Reported a mathematical model for quantifying Sleep Deficiency Severity (SDS).
(ii)
Reported a machine-learning driven model for estimation of SDS from wearable EEG based spectral features.
(iii)
Identified robust biomarkers with the help of Monte Carlo feature selection and Inter-dependency discovery for SDS monitoring in presence of confounding factors.
(iv)
Assessed the impact of obstructive sleep apnea on SDS.
The results pave the way for automated sleep deficiency severity assessment using single-channel EEG.

2. Materials and Methods

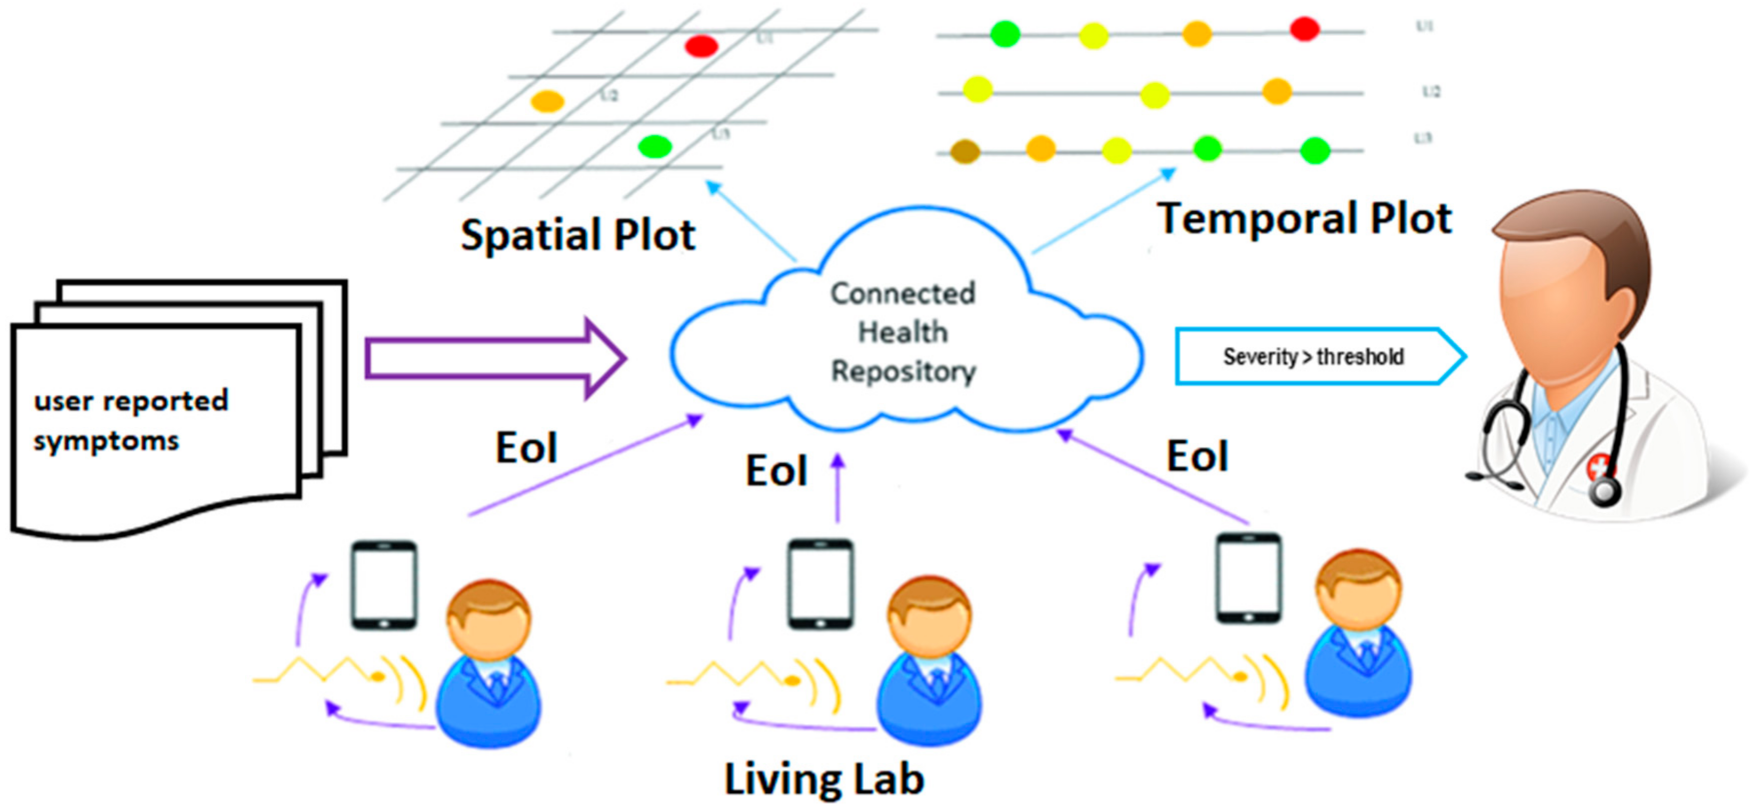
2.1. Smart Health (sHealth) Framework

We define “Smart Health (sHealth)” as a system that uses embedded artificial intelligence such as edge computing, machine learning, etc. and aims to deliver improved healthcare using users’ smart devices, wearables, and the Internet of Things (IoT) centric solutions. It not only benefits and monitors individual user’s health but also collects spatiotemporal community-wide data for collective and social well-being and informed policy makings. It is an emerging paradigm for efficient processing, sharing, and visualization of healthcare data, which is coming from different IoT devices, and wearable sensors. sHealth can be perceived as an upgraded and extended version of Mobile Health (mHealth). We previously reported a framework for sHealth and conducted a pilot study to evaluate the technical feasibility of the framework [16]. The system architecture for the sHealth framework is shown in Figure 1. The main components in the framework are various sensors, such as battery-less body-worn passive sensors with a scanner (i.e., reader for the passive sensors), commercial wearables, a custom smartphone app (SCC-Health app), and a custom web server (SCC-Health server). Details of the design and functionality of the sensors and scanner can be found elsewhere [17]. For physiological data collection, we utilized novel inkjet-printed (IJP) sensors in addition to commercial wearables such as a smart wristband (Mi Band 2, Xiaomi, Beijing, China) and a fingertip pulse oximeter (CMS50E, Crucial Medical Systems, Atlanta, GA, USA) [18]. The IJP sensors were zero-power, analog, wireless, and fully passive. Data collected in the IJP sensors were pre-processed and digitized by a custom-made scanner. Data from the scanner is transmitted to the smartphone via Bluetooth. Data reliability check, feature extraction, and classification or regression analysis using pre-trained machine learning models are performed in the smartphone for disease detection and severity assessment. The computed severity of the disease is then visualized in the smartphone as well as shared with the webserver using Wi-Fi (or cellular network) for observing the temporal and spatial distribution of the diseases. The webserver is accessible at http://sccmobilehealth.com (accessed on 30 June 2021), please see the supplementay materials for details. The app was developed using Android studio 3.1 with build tool version 25.0.2 and the minimum SDK level of 19. The pre-trained machine learning models integrated with the app for Events of Interest (EoI) computation were developed and evaluated in WEKA. By EoI we mean a change in disease-related biomarkers i.e., heart rate, oxygen saturation level, spectral power, etc. that help in detecting a disease or indicate a progression/exacerbation in the disease. Additionally, electronic forms were used to collect user-reported symptoms and user activity logs [19].
The process of spatiotemporal visualization is fully automated and near real-time [20]. For personalized monitoring of diseases, temporal trends of disease severity for a participant can be visualized using a time plot graph [20]. Flow graphs have been used for community health trend monitoring over time. In addition to that, a spatial plot was used to visualize the severity of the disease in different areas at a period interval (averaged) [20]. Color coding has been used to indicate severity where red indicates the highest severity and green indicates the lowest severity.

2.2. Sleep Health Assessment Overview

As shown in Figure 2 conventional methods of sleep health assessment fall under two broad categories-subjective assessment and objective assessment of sleep. Subjective assessment of sleep deficiency using standard questionnaires is well investigated and is widely used in clinical practice. Some of the well-accepted and popular methods for subjective sleep quality assessment are- the Pittsburgh Sleep Quality Index (PSQI), the Epworth Sleepiness Scale (ESS), and the Functional Outcome of Sleep Questionnaire (FOSQ).
PSQI uses a seven component questionnaire and the subject assigns a score of 0–3 for each component [21]. The components are-subjective sleep quality, sleep latency, sleep duration, habitual sleep efficiency, sleep disturbances, use of sleep medication, and daytime dysfunction. A global score > 5 indicates poor sleep quality. FOSQ has 21 questions related to activity levels, vigilance, intimacy and relationships, general productivity, and social outcomes [22]. The potential range of scores for each subscale is 1–4 with higher scores indicating greater insomnia severity. Similarly, in ESS the subject assigns a score of 0–3 for 8 questions aimed at assessing daytime sleepiness. A total score of 16–24 indicates excessive daytime sleepiness suggesting the need for medical attention [23]. The Karolinska Sleep Diary (KSD) is another questionnaire that was developed to assess subjective sleep quality [24].
Subjective reports of sleep quality are important in the clinical setting and can help determine whether further screening and/or treatment for a sleep complaint might be warranted [25]. However, subjective methods suffer from high bias, require active user participation, and a longer period (2 weeks–1 month) for sleep deficiency evaluation. Objective sleep quality consists not only of the total duration of sleep, but also of the architecture of sleep (amount of the different sleep stages across the sleep episode), the amount of wake time during the sleep episode, and the frequency and duration of awakenings across the night [26]. Prominent quantitative metrics that are used for objective sleep assessment are- the Sleep Quality/Efficiency Index and the Sleep Score.

2.2.1. Sleep Quality/Efficiency Index (SQI)

Several quantitative metrics have been developed to measure the quality of sleep from physiological sensor data. However, there is still a lack of standard and well-established definitions for the term ‘Sleep Quality’ [27]. Usually, it is used to refer to a score computed from the collection of quantitative sleep measures i.e., sleep duration, sleep onset time, degree of fragmentation, etc. [28].

2.2.2. Sleep Score

The concept of sleep score has been introduced mainly by commercial entities i.e., Fitbit, Polar, Oura, Apple, etc. Sleep score is usually tracked by smartphone apps based on data collected using a smart band or a smartwatch during sleep. There is no well-accepted and standard definition for Sleep score. Fitbit computes overall sleep score as a sum of individual scores in sleep duration, sleep quality, and restoration, for a total score of up to 100. Most people have a sleep score between 72 and 83. Sleep score ranges are: Excellent: 90–100, Good: 80–89, Fair: 60–79, Poor: Less than 60 [29]. A previous validation study showed that Fitbit smart bands performance is promising in detecting sleep-wake states and sleep stage composition relative to gold standard polysomnogram [30]. Oura sleep ring measures sleep using sensors that capture the body signals including resting heart rate (RHR), heart rate variability (HRV), body temperature, respiratory rate, and movement, to determine sleep patterns and compute the sleep score [31]. Sleep score-based monitoring has been criticized due to a lack of consistency in measurement and the impact of a sleep-related disease on sleep score is not well-investigated [32]. Scientific study suggests that current consumer sleep tracking technologies are immature for diagnosing sleep disorders, but they may be reasonably satisfactory for general purpose and non-clinical use [33].

2.2.3. Sleep Deficiency Severity (SDS)

This is a new metric proposed by the authors aimed at pre-clinical early evaluation of sleep deficiency and is based on a fusion of features from ECG, EEG, SpO2, and other wearable sensors. Sleep deficiency is more than sleep quality or sleep efficiency as it includes sleep deprivation, sleep fragmentation, sleep duration etc. in addition to sleep quality which mainly measures the time spent in deep sleep stages. According to US National Institute for Health [34], sleep deprivation is a condition which happens when a person does not get enough sleep whereas sleep deficiency is a broader concept that occurs for the following reasons-
(a)
A person does not get enough sleep (sleep deprivation)
(b)
A person’s sleep is out of sync of his body’s natural clock
(c)
A person does not get all the different types of sleep that his body needs
(d)
The person has a sleep disorder that prevents him from getting enough sleep
(e)
The person gets a poor quality sleep
The currently used sleep assessment metrics are not capturing all these components/causes of sleep deficiency e.g., sleep quality equation doesnot take SpO2 level into consideration.

2.3. Dataset

Sleep Health Heart Study (SHHS) is a dataset available from the National Sleep Research Resource [35]. SHHS was implemented as a multi-center cohort study in two phases by the US National Heart Lung & Blood Institute. Unattended home polysomnograms were obtained for both the phases of SHHS by certified and trained technicians. The polysomnogram data was saved in European Data Format (EDF). Data processing and initial scoring were done using Compumedics software (Compumedics Ltd., Abbotsford, Australia) as part of SHHS. Two manual scorings were included to annotate the database with sleep duration, sleep efficiency, arousal index, sleep stages, oxygen saturation level, etc. A dataset of 500 subjects containing good quality data for both ECG and EEG is available from the dataset provider and is recommended for use in a research study. In our study, for developing the regression models we used this dataset of 500 subjects. The gender distribution of records in the dataset is as follows: male: 231, female: 269. The age of the subjects ranges from 44 to 89 years old with a mean of 65 years old and a standard deviation of 10.41 years. The body mass index (BMI) of the subjects ranges from 18–46 with a mean of 27.51 kg per square meter and a standard deviation of 4.11 kg per square meter.

2.4. Mathematical Model for Baseline SDS Score

Guidelines for computing a composite sleep health score from polysomnographic measures have been developed and reported in previous research studies [36,37]. In this study, we developd a generalized mathematical model for computing the baseline SDS score. The model is described in Equation (1) below, where Zneg is the sleep attribute (normalized) that increases sleep deficiency (i.e., higher is responsible for more sleep deficiency). The MAX function in the equation forces the lower bound of Sleep deficiency Severity to 0:
S l e e p   D e f i c i e n c y   S e v e r i t y = M A X 0 , S   ×   100
where:
S = 1 m   i = 1 m Z n e g i 1 n j = 1 n Z p o s j  
where:
Z = X m i n X m a x X m i n   X    
Zpos is the sleep attribute (normalized) that reduces sleep deficiency (i.e., higher is better), m is the total number of negative attributes, and n is the total number of positive attributes. The positive attributes available from the SHHS dataset are as follows:
Sleep time—Duration of entire sleep.
Sleep efficiency—Percentage of time in bed that was spent sleeping, or the ratio of total sleep time to total time in bed, expressed as a percentage.
Time deep sleep (%)—Percent time in sleep stages 3 and 4.
Time REM sleep (%)—Percent Time in rapid eye movement sleep (REM).
SpO2 (%)—Average oxygen saturation (SpO2) level in sleep.
The negative attributes available from SHHS is as follows:
Sleep Fragmentation Index (SFI)-Total number of arousals per hour of sleep i.e., ratio of the count of arousals to total sleep time in hours.
In computing the sleep deficiency severity, all the attributes have been normalized on a scale of 0–1. To achieve a consistent “higher is better” rule the value of each negative attribute is subtracted from 1. Then, the attribute values have been summed up to develop a composite score. The composite score has been multiplied by 100 and divided by the total no. of positive and negative attributes to obtain the SDSin the range of 0–100. Statistical analysis has been conducted to investigate the relationship of baseline SDS with age, gender, and BMI. Additionally, the partial correlation of SDS (controlling for age and BMI) with HRV and EEG features has been investigated.

2.5. Feature Extraction & Feature Selection from Polysomnogram

2.5.1. Feature Extraction

The recording montage for polysomnograms consisted of data from 14 channels which include- ECG, EEG, electrooculogram (EOG), electromyogram (EMG), nasal airflow, thoracic and abdominal movement signal, SpO2, sleep hypnogram, etc. Hardware filters have been used for preliminary noise reduction. The cutoff frequency for hardware filters had been as follows: ECG 0.15 Hz, EOG 0.15 Hz, EMG 0.15 Hz, EEG 0.15 Hz, Thoracic respiration signal of 0.05 Hz, Abdominal respiration signal 0.05 Hz. The sampling rate is 125 Hz for EEG, ECG, and EMG signals. For EOG, the sampling rate is 50 Hz. In investigating a minimalistic approach, we considered the use of features from ECG, EEG, SpO2 signals considering the sensors are more user-friendly and widely used. For RR interval correction we used malik’s rule followed by a cubic interpolation for the determination of normal-to-normal (NN) intervals [38]. From the NN interval series time domain and frequency domain features have been extracted following the HRV guidelines using the HRV Toolkit available from Physionet [39]. For the power spectrum estimation, we used Lomb’s periodogram method. The entire ECG record has been divided into 5-min epochs to estimate short-term components of HRV. In total 20 HRV features have been extracted.
From EEG, we computed spectral features as described in Table 1. The feature extraction was carried out using a MATLAB App called SpectralTrainFig [40]. SpectralTrainFig was specially designed for SHHS to conduct spectral analysis of EEG signals using European Data Format (EDF) files. The EEG signal was collected using two channels from the central region of the brain. One of the channels was C4-A1 and the other one was C3-A2. The power spectral densities for these two channels are very similar. In our study, we have only used the signal from the C4 channel as it has been designated as the primary EEG channel in the movement (NREM) power, and Total power at each frequency band. Also, 102 EEG spectral features i.e., REM, N-REM power at single frequencies have been computed for 51 frequencies from 0 to 25 Hz with a 0.5 Hz gap i.e., 0 Hz, 0.5 Hz, 1 Hz, 1.5 Hz, …, 24.5 Hz, 25 Hz.

2.5.2. Monte Carlo Feature Selection and Interdependency Discovery

Feature selection has been done primarily to compare the relative importance of ECG and EEG-based features for SDS estimation. Monte-Carlo Feature Selection (MCFS) and inter-dependency discovery has been used for ranking the feature importance. In MCFS the relative importance of features is estimated by building hundreds of trees for a randomly selected subset of features [41]. In a mathematic notion, i subsets of m randomly selected features are constructed where m << n, n being the total number of features and for each subset, k trees are constructed and their performance is assessed for classification/regression. Finally, i × m trees are constructed and evaluated. The procedure has been illustrated in Figure 3. Weighted accuracy of a tree as defined by Equation (2) is used as a metric to assess the classification or regression ability of the tree.
W a c = 1 c   i = 1 c n i j n i 1 + n i 2 + + n i c
where c = number of classes, i, j = 1,2, …, c; nij is the number of samples from class i classified as class j and ∑nij = n is the number of all samples.
The Relative Importance (RI) of feature gd denoted by RIgd is defined by Equation (3):
R I g d = x = 1 m . k W a c   x     u   r g d x I G r g d x n o .     i n   r g d x n o .     i n   x v
where Wac stands for the weighted accuracy for xth tree, I G r g d x stands for the information gain for node r g d x , (no. in r g d x ) denotes the number of samples in the node r g d x , (no. in x) denotes the number of samples in the root of the xth tree, and u and v are fixed positive reals. Information gain (IG) is measured by Gini index or gain ratio [42].
Both ECG and EEG have correlated features that introduce the problem of multi-collinearity. To deal with this, the inter-dependency discovery was used to remove features with strong pairwise interactions. rmcfs package from R has been used for feature ranking using Monte-Carlo feature selection and interdependency discovery (MCFS-ID) method [42]. The steps of preprocessing, feature extraction, feature selection, and regression has been shown in Figure 3.

2.6. Machine-Learning Driven Method for SDS Estimation

For developing the machine learning-based regression model we only used the EEG spectral features and anthropometric measures and explored machine learning and deep learning methods as described below:

2.6.1. Regression Model

For developing the regression model, the dataset was randomly shuffled and was divided into the training (70%), validation(15%), and the test (15%) set. The training set has been used for gradient computation and updating the network weights and biases. The validation set was used to monitor error during the training process. The validation set is also useful in monitoring overfitting, as overfitting causes a high validation error while training error goes down. The test set was used for comparing different models. For finding the best model, we investigated Bayesian regression method, and artificial neural network (ANN). Bayesian inference facilitates overcoming insufficient data or poorly distributed data as it allows to put a prior on the coefficients and the noise so that in the absence of data, the priors can take over. In a Bayesian framework, the regression model is stated in a probabilistic manner where the Bayesian sampling algorithm returns a probability distribution (known as the posterior of the effect) that is compatible with the observed data instead of a point estimate. The posterior distribution is obtained by the product of the prior distribution and the likelihood function. The model for Bayesian linear regression can be represented by Equation (4):
y   ~   N W T X ,   σ 2 I  
where response data points y is sampled from a multivariate Gaussian distribution that has a mean equal to the product of W coefficients and the predictors X and variance of σ2. I–is the N × N Identity matrix [43]. In this work, we used Markov Chain Monte Carlo Method (MCMC) sampling and weakly informative prior for Bayesian regression. To verify convergence potential scale reduction statistic R-hat was used [44].
An artificial neural network (ANN) is capable of approximating any linear or non-linear relationship including multi-dimensional regression mapping problems quite well. However, the ANN must have enough neurons in the hidden layers and the data distribution should be consistent. During the training process, an ANN fits a function on a set of inputs to produce a set of associated outputs. Once training is finished the network forms a generalization of the input-output relationship and can be utilized to generate outputs for unseen inputs. The structure of ANN has multiple layers with interconnected artificial neurons as the building blocks for each layer. Each neuron has weights that are adjusted during the training process. Training stops when any of these conditions occur: the maximum number of epochs (repetitions) is reached, or the maximum amount of time is exceeded or performance is minimized to the goal or the performance gradient falls below minimum gradient. The ANN used in this study is of feed-forward type and has 3 layers–input, output, and hidden layer. The number of neurons in each layer is input-117, hidden–10, output-1. The used activation functions are- relu for the hidden layer and softmax for the output layer. Levenberg-Marquardt optimization with backpropagation was used as the training algorithm [45]. The hyperparameters used for the ANN are as follows: max epochs = 1000, min gradient = 1 × 10⁻⁷, momentum (Mu) = 0.001, Mu decrease ratio = 0.1, Mu increase ratio = 0.1. To facilitate proper training and evaluation the input data was randomly divided into training (80%), and test set (20%). Root mean squared error (RMSE) and R-squared (R2) values were used for performance evaluation of both the Bayesian model and ANN. Additionally, Pareto smoothed importance sampling (PSIS) diagnostic plot was used for the Bayesian model. Good Pareto k estimates (k < 0.5) in the PSIS diagnostic plot show that the model fits the data. The version of PSIS used in this work corresponds to the algorithm presented in Vehtari et al. [46].

2.6.2. Assessment of Obstructive Sleep Apnea Impact

It is well perceived that obstructive sleep apnea (OSA) has a negative consequence on sleep and is a reason for sleep deficiency. OSA induces behavioral sleep problems, bedtime resistance, and a significantly shortened sleep duration [47]. Apnea-hypopnea Index (AHI) is used to quantify the degree of OSA. We investigated the correlation of ESS, FOSQ, and SDS with AHI to examine which one better captures the impact of OSA on sleep deficiency.

3. Results

The probability density plot of SDS computed using the Equation (1) has been shown in Figure 4. The histogram of SDS follows a Gaussian distribution with a mean of 60 (N = 500) and a standard deviation of 22.
A boxplot comparison between the sleep deficiency severities of males and females has been shown in Figure 5. No significant (p-value > 0.05) difference was observed between the average SDS of males with that of females. SDS shows a moderate (r = −0.35, p = 0.0) correlation with age, i.e., higher the age, the higher is the sleep deficiency. The scatterplot of age and SDS with a trend line has been visualized in Figure 6. Additionally, SDS shows a weak (r = −0.21, p = 0.0) positive correlation with body mass index (BMI). Boxplots of SDS for normal and overweight categories are shown in Figure 7. The overweight category has a higher SDS.
The partial correlation (controlled for age and BMI) of HRV and EEG features with baseline SDS computed using Equation (1) indicated a significant correlation for several features. A co-variate analysis have been performed to investigate the relationship of SDS with these features when controlled for age and BMI. The best five features from each sensor showing a significant correlation with SDS have been listed in Table 2.
Although both HRV and EEG features show a significant partial correlation with SDS, the correlation for EEG features is much stronger than HRV features indicating that EEG features have relatively higher importance than HRV features in estimating SDS. Hence, in developing the regression method, only EEG and anthropometric measures have been used.
MCFS results indicate that out of 150 features 117 are important based on the cut-off value of feature relative importance (RI) as shown in Figure 8. The line with red/gray dots gives RI values, the vertical bar plot gives the difference δ between consecutive RI values. Informative features are separated from non-informative ones by the cutoff value and are presented in the plot as red and gray dots, respectively. The convergence of MCFS-ID algorithm has been shown in Figure 9. The distance function (red line) shows the difference between two consecutive rankings–zero means no changes between two rankings (see the left y-axis). The common part (in blue color) gives the fraction of features that overlap for two different rankings (see the right y-axis). The ranking stabilizes after some iterations: the distance tends to zero and the common part tends to 1. Beta1 shows the slope of the tangent of a smoothed distance function. If beta1 tends to 0 (the right y-axis) then the distance is given by a flat line. The top-ranked 20 features based on normalized relative importance by MCFS-ID have been shown in Figure 10.
The distribution of posterior R2 for estimated SDS using Bayesian regression indicates an approximately normally distributed pattern. In MCMC diagnostics R-hat values for all parameters were less than 1.1. A posterior predictive check on MCMC sampler has been shown in Figure 11a. The dark blue line shows the observed data while the light blue lines are simulations from the posterior predictive distribution. The patterns for both distributions are in agreement with some deviations for the peak. Figure 11b shows the probability density plot for the estimated SDS using Bayesian regression where the solid line indicates the point estimate from the ordinary least squares method. The plot–of–fit for the Bayesian regression model is shown in Figure 12 where R-squared value = 0.60 and RMSE = 5.63. The PSIS diagnostics plot for the Bayesian model has been shown in Figure 13 which reveals that only a few points are outside the acceptable threshold. The estimated shape parameter k for each observation is used as a measure of the observation’s influence on the posterior distribution of the model.
For SDS estimation, ANN achieved a performance of RMSE of 4.65 and R-squared value of 0.86 in the training set, and an RMSE of 5.47 and R-squared value of 0.67 in the test set. The fit of the regression plot for the ANN model has been shown in Figure 14. The dashed line indicates the ideal trend line and the solid line indicates the fitted trend line for the actual versus predicted values. The histogram of prediction error showed symmetrically skewed and almost normally distributed patterns with a higher frequency in the error bin ± 2. The residual plot for the regression analysis shows a random scattering around the zero lines.
A comparison of ANN performance with other models has been shown in Table 3. ANN outperforms other models with a lower error measured by RMSE. Figure 15 shows a direct comparison of the developed SDS scale with MW8 sleep quality score reported earlier by Landry et al. [37]. An inverse relationship between SDS and MW8 sleep quality score is observed with a negative correlation (r = −0.34), meaning that a lower sleep quality is associated with a higher SDS. Figure 16a shows the impact of OSA as captured by the Epworth Sleepiness Scale (ESS). It can be seen that ESS does not reveal an informative trend and failed (r < 0.1) to capture the impact of severe OSA on the sleep deficiency of OSA patients. Similarly, Figure 16b shows the correlation of the Functional Outcome of Sleep Questionnaire (FOSQ) with the apnea-hypopnea index. The trend in this case also fails (r < 0.19) to capture the impact of OSA severity on sleep deficiency. Figure 16c shows that SDS, as computed using the proposed method, shows a good positive correlation (r = 0.31) with AHI. As OSA severity increases, SDS also proportionately increases.

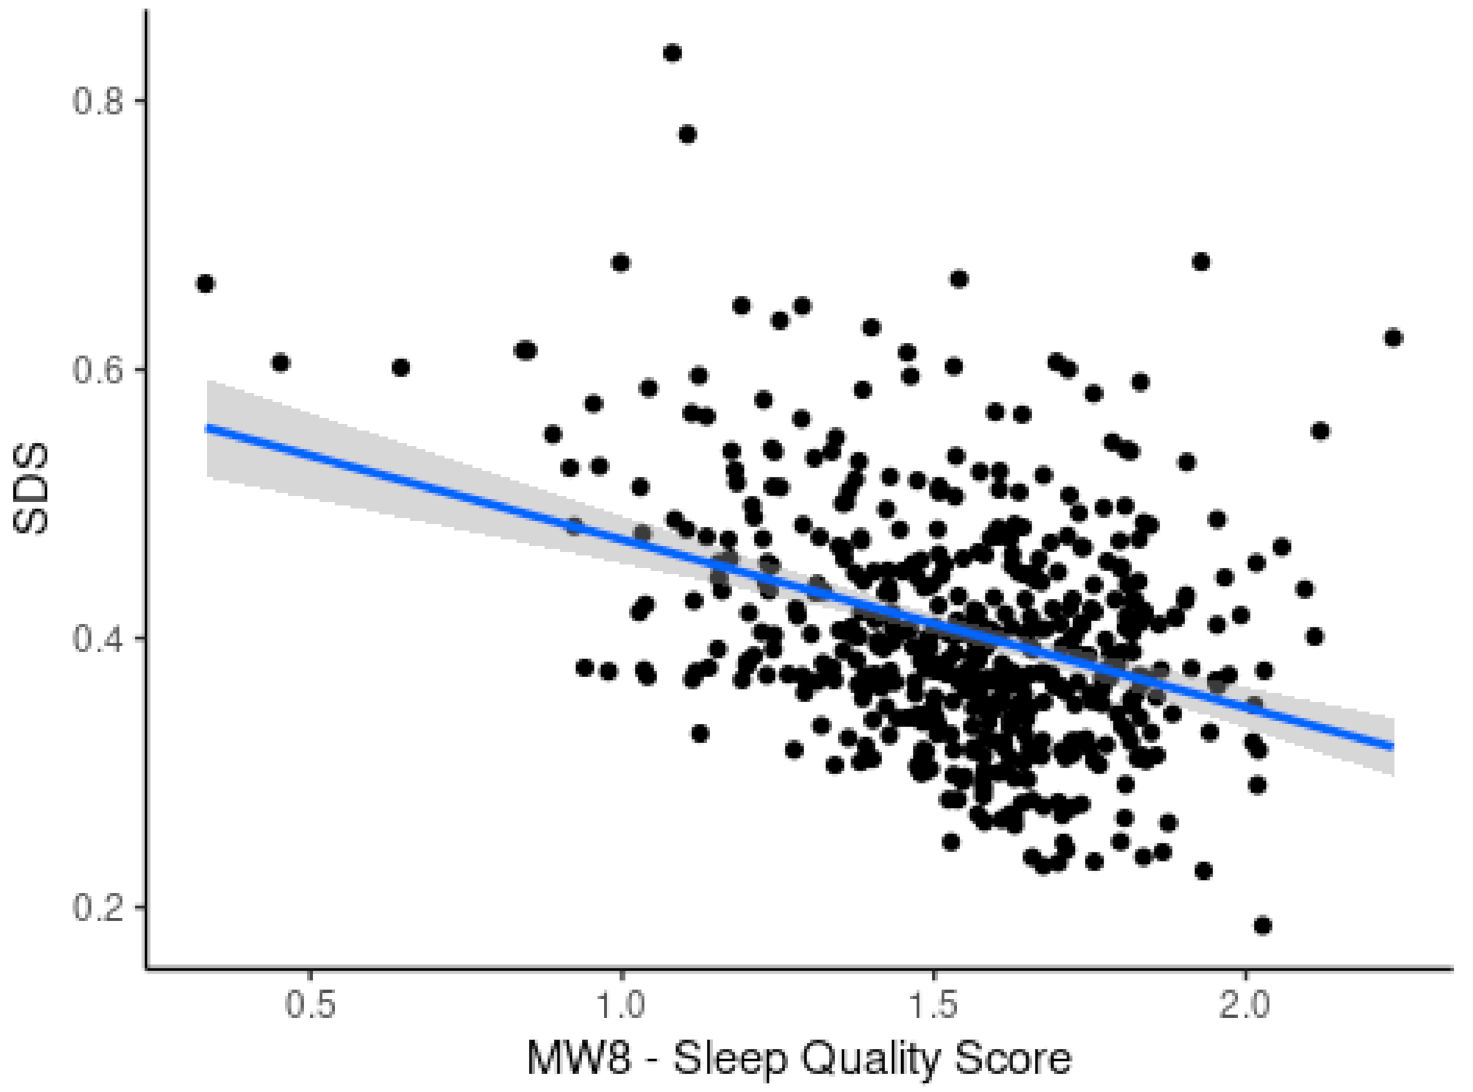
4. Discussion and Limitations

While quantification and longitudinal monitoring of sleep deficiency are beneficial for early diagnosis and continuous monitoring of sleep disorder and may facilitate corrective habitual actions and practices that adversely affect good sleep, it is noteworthy that sleep deficiency is not only linked with the physiological disorder but also emotional stress and other factors. To reduce the variability in everyday measurement a moving average over a week or longer period as well as sleep pattern visualization may provide better insights when added to the SDS score. Signal quality and data reliability also impact the measurements and hence a data reliability metric may be used to enhance the usability of the method. It is noteworthy that we could not directly compare the utility of SDS with that of sleep score as sleep score formulae used by commercial entities are not publicly available to the best of our knowledge. Moreover, the mathematical model which served as a baseline for machine learning-driven models is not a gold standard but based on recommendation and findings of previous research studies. There is a gap between the polysomnogram based model and the machine learning based model as machine-learning model is only using limited information/features available from the EEG sensor. It actually points out that there is a trade-off between comfort and accuracy. While minimizing no of ensors do increase the user comfort level and make the process more user-friendly it does compromise some performance.

5. Conclusions

In this study, we analyzed SDS and its relationship with HRV, and EEG-based features. We performed a feature ranking using MCFS-ID for identifying the most informative features for SDS estimation. Finally, we developed a regression method using ANN for SDS score estimation from spectral features of single-channel EEG. The findings of this study increased the interpretability of SDS and paves way for the usage of SDS as a potential indicator for automated sleep disorder checks using wearables. In future studies, we are aiming a large scale deployment of the model for longitudinal monitoring of SDS with wearables.

Supplementary Materials

A Smart Health(sHealth) framework was developed previously for implementing the sleep deficiency severity algorithm. The framework is available online at www.sccmobilehealth.com. Associated codes and resources are available at our GitHub repo at https://github.com/esarplab.

Author Contributions

M.J.R. and B.I.M. conceived of the presented idea. M.J.R. developed the algorithm and performed the computations including the data analytics. B.I.M. and C.P. supervised the findings of this work and verified the analytical methods. All authors have read and agreed to the published version of the manuscript.

Funding

This material is based upon work supported by the US National Science Foundation under Grant No. 1637250.

Informed Consent Statement

Approval has been obtained from an institutional review board at the University of Memphis (IRB# PRO-FY2017-474).

Data Availability Statement

The data used in this study was obtained from the National Sleep Research Resource. Anyone interested may apply here https://sleepdata.org/data/requests/shhs/start for getting access to the dataset.

Acknowledgments

We acknowledge the contributions of B.E. Harmon, Md Sabbir bin Zaman, Sharmin Afroz, and Mamun Rahman in developing the overall Smart Health (sHealth) framework.

Conflicts of Interest

The authors declare no conflict of interest. The funders had no role in the design of the study; in the collection, analyses, or interpretation of data; in the writing of the manuscript, or in the decision to publish the results.

Appendix A. Definitions of Terms Used

Oscillations (OSC)Neural Oscillations are rhythmic or repititive patterns of neural activity which is observed in the central nervous system.
Heart Rate Variability (HRV)is a set of quantitative measures that indicates the variation in the time interval between heartbeats.
Deltawaves are high amplitude neural oscillations with a frequency between 0.5 and 4 hertz and aid in characterizing the depth of sleep. Delta waves are usually associated with slow-wave sleep (SWS) i.e., the deep stage 3 of NREM sleep.
Thetawaves are classified as slow activity. Theta activity during wakefullness reflects the build-up of sleep need.
Alphawaves represents non-arousal and are seen in the electroencephalogram (EEG) during a normal wakeful state where the subject is quietly resting. Alpha waves usually have a higher amplitude.
Betawaves are evoked by intense attention and are observed during REM sleep and waking and are dominent when a person is not sleeping.
Gammawaves are the fastest waves produced inside the brain and are linked to learning, memory, and voluntary motor movement.
Table A1. Description of HRV features used.
FeatureDescription
AVNNMean of Normal to Normal interval
pNN1xNNx count divided by the total no. of all NN intervals where NNx is the nnumber of pairs of adjacent NN intervals differing by more than x ms.
HRMean heart rate in beat per minute
VLF PPower in very low frequency range (≤0.04 Hz)
LF/HFRatio of LF/HF power
Table A2. Definition of spectral features used.
alpha_nremAlpha power density in non-rapid eye movement sleep (NREM)
alpha_remAlpha power density in rapid eye movement sleep (REM)
alpha_sleepAlpha power density in sleep
beta_nremBeta power density in non-rapid eye movement sleep (NREM)
beta_remBeta power density in rapid eye movement sleep (REM)
beta_sleepBeta power density in sleep
delta_nremDelta power density in non-rapid eye movement sleep (NREM)
delta_remDelta power density in rapid eye movement sleep (REM)
delta_sleepDelta power density in sleep
fastsigma_nremFast sigma power density in non-rapid eye movement sleep (NREM)
fastsigma_remFast sigma power density in rapid eye movement sleep (REM)
fastsigma_sleepFast sigma power density in sleep
nrem_0_5_hzNon-rapid eye movement sleep (NREM) power density at 0.5 Hertz
nrem_0_hzNon-rapid eye movement sleep (NREM) power density at 0 Hertz
nrem_10_5_hzNon-rapid eye movement sleep (NREM) power density at 10.5 Hertz
nrem_10_hzNon-rapid eye movement sleep (NREM) power density at 10.0 Hertz
nrem_11_5_hzNon-rapid eye movement sleep (NREM) power density at 11.5 Hertz
nrem_11_hzNon-rapid eye movement sleep (NREM) power density at 11.0 Hertz
nrem_12_5_hzNon-rapid eye movement sleep (NREM) power density at 12.5 Hertz
nrem_12_hzNon-rapid eye movement sleep (NREM) power density at 12.0 Hertz
nrem_13_5_hzNon-rapid eye movement sleep (NREM) power density at 13.5 Hertz
nrem_13_hzNon-rapid eye movement sleep (NREM) power density at 13.0 Hertz
nrem_14_5_hzNon-rapid eye movement sleep (NREM) power density at 14.5 Hertz
nrem_14_hzNon-rapid eye movement sleep (NREM) power density at 14.0 Hertz
nrem_15_5_hzNon-rapid eye movement sleep (NREM) power density at 15.5 Hertz
nrem_15_hzNon-rapid eye movement sleep (NREM) power density at 15.0 Hertz
nrem_16_5_hzNon-rapid eye movement sleep (NREM) power density at 16.5 Hertz
nrem_16_hzNon-rapid eye movement sleep (NREM) power density at 16.0 Hertz
nrem_17_5_hzNon-rapid eye movement sleep (NREM) power density at 17.5 Hertz
nrem_17_hzNon-rapid eye movement sleep (NREM) power density at 17.0 Hertz
nrem_18_5_hzNon-rapid eye movement sleep (NREM) power density at 18.5 Hertz
nrem_18_hzNon-rapid eye movement sleep (NREM) power density at 18.0 Hertz
nrem_19_5_hzNon-rapid eye movement sleep (NREM) power density at 19.5 Hertz
nrem_19_hzNon-rapid eye movement sleep (NREM) power density at 19.0 Hertz
nrem_1_5_hzNon-rapid eye movement sleep (NREM) power density at 1.5 Hertz
nrem_1_hzNon-rapid eye movement sleep (NREM) power density at 1.0 Hertz
nrem_20_5_hzNon-rapid eye movement sleep (NREM) power density at 20.5 Hertz
nrem_20_hzNon-rapid eye movement sleep (NREM) power density at 20.0 Hertz
nrem_21_5_hzNon-rapid eye movement sleep (NREM) power density at 21.5 Hertz
nrem_21_hzNon-rapid eye movement sleep (NREM) power density at 21.0 Hertz
nrem_22_5_hzNon-rapid eye movement sleep (NREM) power density at 22.5 Hertz
nrem_22_hzNon-rapid eye movement sleep (NREM) power density at 22.0 Hertz
nrem_23_5_hzNon-rapid eye movement sleep (NREM) power density at 23.5 Hertz
nrem_23_hzNon-rapid eye movement sleep (NREM) power density at 23.0 Hertz
nrem_24_5_hzNon-rapid eye movement sleep (NREM) power density at 24.5 Hertz
nrem_24_hzNon-rapid eye movement sleep (NREM) power density at 24.0 Hertz
nrem_25_hzNon-rapid eye movement sleep (NREM) power density at 25.0 Hertz
nrem_2_5_hzNon-rapid eye movement sleep (NREM) power density at 2.5 Hertz
nrem_2_hzNon-rapid eye movement sleep (NREM) power density at 2.0 Hertz
nrem_3_5_hzNon-rapid eye movement sleep (NREM) power density at 3.5 Hertz
nrem_3_hzNon-rapid eye movement sleep (NREM) power density at 3.0 Hertz
nrem_4_5_hzNon-rapid eye movement sleep (NREM) power density at 4.5 Hertz
nrem_4_hzNon-rapid eye movement sleep (NREM) power density at 4.0 Hertz
nrem_5_5_hzNon-rapid eye movement sleep (NREM) power density at 5.5 Hertz
nrem_5_hzNon-rapid eye movement sleep (NREM) power density at 5.0 Hertz
nrem_6_5_hzNon-rapid eye movement sleep (NREM) power density at 6.5 Hertz
nrem_6_hzNon-rapid eye movement sleep (NREM) power density at 6.0 Hertz
nrem_7_5_hzNon-rapid eye movement sleep (NREM) power density at 7.5 Hertz
nrem_7_hzNon-rapid eye movement sleep (NREM) power density at 7.0 Hertz
nrem_8_5_hzNon-rapid eye movement sleep (NREM) power density at 8.5 Hertz
nrem_8_hzNon-rapid eye movement sleep (NREM) power density at 8.0 Hertz
nrem_9_5_hzNon-rapid eye movement sleep (NREM) power density at 9.5 Hertz
nrem_9_hzNon-rapid eye movement sleep (NREM) power density at 9.0 Hertz
rem_0_5_hzRapid eye movement sleep (REM) power density at 0.5 Hertz
rem_0_hzRapid eye movement sleep (REM) power density at 0 Hertz
rem_10_5_hzRapid eye movement sleep (REM) power density at 10.5 Hertz
rem_10_hzRapid eye movement sleep (REM) power density at 10.0 Hertz
rem_11_5_hzRapid eye movement sleep (REM) power density at 11.5 Hertz
rem_11_hzRapid eye movement sleep (REM) power density at 11.0 Hertz
rem_12_5_hzRapid eye movement sleep (REM) power density at 12.5 Hertz
rem_12_hzRapid eye movement sleep (REM) power density at 12.0 Hertz
rem_13_5_hzRapid eye movement sleep (REM) power density at 13.5 Hertz
rem_13_hzRapid eye movement sleep (REM) power density at 13.0 Hertz
rem_14_5_hzRapid eye movement sleep (REM) power density at 14.5 Hertz
rem_14_hzRapid eye movement sleep (REM) power density at 14.0 Hertz
rem_15_5_hzRapid eye movement sleep (REM) power density at 15.5 Hertz
rem_15_hzRapid eye movement sleep (REM) power density at 15.0 Hertz
rem_16_5_hzRapid eye movement sleep (REM) power density at 16.5 Hertz
rem_16_hzRapid eye movement sleep (REM) power density at 16.0 Hertz
rem_17_5_hzRapid eye movement sleep (REM) power density at 17.5 Hertz
rem_17_hzRapid eye movement sleep (REM) power density at 17.0 Hertz
rem_18_5_hzRapid eye movement sleep (REM) power density at 18.5 Hertz
rem_18_hzRapid eye movement sleep (REM) power density at 18.0 Hertz
rem_19_5_hzRapid eye movement sleep (REM) power density at 19.5 Hertz
rem_19_hzRapid eye movement sleep (REM) power density at 19.0 Hertz
rem_1_5_hzRapid eye movement sleep (REM) power density at 1.5 Hertz
rem_1_hzRapid eye movement sleep (REM) power density at 1.0 Hertz
rem_20_5_hzRapid eye movement sleep (REM) power density at 20.5 Hertz
rem_20_hzRapid eye movement sleep (REM) power density at 20.0 Hertz
rem_21_5_hzRapid eye movement sleep (REM) power density at 21.5 Hertz
rem_21_hzRapid eye movement sleep (REM) power density at 21.0 Hertz
rem_22_5_hzRapid eye movement sleep (REM) power density at 22.5 Hertz
rem_22_hzRapid eye movement sleep (REM) power density at 22.0 Hertz
rem_23_5_hzRapid eye movement sleep (REM) power density at 23.5 Hertz
rem_23_hzRapid eye movement sleep (REM) power density at 23.0 Hertz
rem_24_5_hzRapid eye movement sleep (REM) power density at 24.5 Hertz
rem_24_hzRapid eye movement sleep (REM) power density at 24.0 Hertz
rem_25_hzRapid eye movement sleep (REM) power density at 25.0 Hertz
rem_2_5_hzRapid eye movement sleep (REM) power density at 2.5 Hertz
rem_2_hzRapid eye movement sleep (REM) power density at 2.0 Hertz
rem_3_5_hzRapid eye movement sleep (REM) power density at 3.5 Hertz
rem_3_hzRapid eye movement sleep (REM) power density at 3.0 Hertz
rem_4_5_hzRapid eye movement sleep (REM) power density at 4.5 Hertz
rem_4_hzRapid eye movement sleep (REM) power density at 4.0 Hertz
rem_5_5_hzRapid eye movement sleep (REM) power density at 5.5 Hertz
rem_5_hzRapid eye movement sleep (REM) power density at 5.0 Hertz
rem_6_5_hzRapid eye movement sleep (REM) power density at 6.5 Hertz
rem_6_hzRapid eye movement sleep (REM) power density at 6.0 Hertz
rem_7_5_hzRapid eye movement sleep (REM) power density at 7.5 Hertz
rem_7_hzRapid eye movement sleep (REM) power density at 7.0 Hertz
rem_8_5_hzRapid eye movement sleep (REM) power density at 8.5 Hertz
rem_8_hzRapid eye movement sleep (REM) power density at 8.0 Hertz
rem_9_5_hzRapid eye movement sleep (REM) power density at 9.5 Hertz
rem_9_hzRapid eye movement sleep (REM) power density at 9.0 Hertz
sigma_nremSigma power density in non-rapid eye movement sleep (NREM)
sigma_remSigma power density in rapid eye movement sleep (REM)
sigma_sleepSigma power density in sleep
slowosc_nremSlow oscillation power density in non-rapid eye movement sleep (NREM)
slowosc_remSlow oscillation power density in rapid eye movement sleep (REM)
slowosc_sleepSlow oscillation power density in sleep
slowsigma_nremSlow sigma power density in non-rapid eye movement sleep (NREM)
slowsigma_remSlow sigma power density in rapid eye movement sleep (REM)
slowsigma_sleepSlow sigma power density in sleep
theta_nremTheta power density in non-rapid eye movement sleep (NREM)
theta_remTheta power density in rapid eye movement sleep (REM)
theta_sleepTheta power density in sleep

References

  1. Mukherjee, S.; Patel, S.R.; Kales, S.N.; Ayas, N.T.; Strohl, K.P.; Gozal, D.; Malhotra, A. An official American Thoracic Society statement: The importance of healthy sleep. Recommendations and future priorities. Am. J. Respir. Crit. Care Med. 2015, 191, 1450–1458. [Google Scholar] [CrossRef] [PubMed] [Green Version]
  2. Dai, C.; Zhang, Y.; Cai, X.; Peng, Z.; Zhang, L.; Shao, Y.; Wang, C. Effects of sleep deprivation on working memory: Change in functional connectivity between the dorsal attention, default mode, and fronto-parietal networks. Front. Hum. Neurosci. 2020, 14, 360. [Google Scholar] [CrossRef] [PubMed]
  3. Alhola, P.; Polo-Kantola, P. Sleep deprivation: Impact on cognitive performance. Neuropsychiatr. Dis. Treat. 2007, 3, 553–567. [Google Scholar] [PubMed]
  4. Spiegel, K.; Tasali, E.; Leproult, R.; Van Cauter, E. Effects of poor and short sleep on glucose metabolism and obesity risk. Nat. Rev. Endocrinol. 2009, 5, 253–261. [Google Scholar] [CrossRef] [PubMed]
  5. Sharma, M.; Sawhney, J.; Panda, S. Sleep quality and duration—Potentially modifiable risk factors for Coronary Artery Disease? Indian Hear. J. 2014, 66, 565–568. [Google Scholar] [CrossRef] [Green Version]
  6. Perez-Pozuelo, I.; Zhai, B.; Palotti, J.; Mall, R.; Aupetit, M.; Garcia-Gomez, J.M.; Taheri, S.; Guan, Y.; Fernandez-Luque, L. The future of sleep health: A data-driven revolution in sleep science and medicine. NPJ Digit. Med. 2020, 3, 42. [Google Scholar] [CrossRef] [PubMed]
  7. Kuo, C.-E.; Liu, Y.-C.; Chang, D.-W.; Young, C.-P.; Shaw, F.-Z.; Liang, S.-F. Development and Evaluation of a Wearable Device for Sleep Quality Assessment. IEEE Trans. Biomed. Eng. 2016, 64, 1547–1557. [Google Scholar] [CrossRef]
  8. Mendonca, F.; Mostafa, S.S.; Morgado-Dias, F.; Ravelo-Garcia, A.G. Sleep Quality Estimation by Cardiopulmonary Coupling Analysis. IEEE Trans. Neural Syst. Rehabil. Eng. 2018, 26, 2233–2239. [Google Scholar] [CrossRef]
  9. Azimi, I.; Oti, O.; Labbaf, S.; Niela-Vilen, H.; Axelin, A.; Dutt, N.; Liljeberg, P.; Rahmani, A.M. Personalized Maternal Sleep Quality Assessment: An Objective IoT-based Longitudinal Study. IEEE Access 2019, 7, 93433–93447. [Google Scholar] [CrossRef]
  10. Bsoul, M.; Minn, H.; Nourani, M.; Gupta, G.; Tamil, L. Real-time sleep quality assessment using single-lead ECG and multi-stage SVM classifier. In Proceedings of the 2010 Annual International Conference of the IEEE Engineering in Medicine and Biology, Buenos Aires, Argentina, 31 August–4 September 2010; IEEE: Piscataway, NJ, USA, 2010; pp. 1178–1181. [Google Scholar]
  11. Sors, A.; Bonnet, S.; Mirek, S.; Vercueil, L.; Payen, J.-F. A convolutional neural network for sleep stage scoring from raw single-channel EEG. Biomed. Signal Process. Control. 2018, 42, 107–114. [Google Scholar] [CrossRef]
  12. Fernandez-Blanco, E.; Rivero, D.; Pazos, A. EEG signal processing with separable convolutional neural network for automatic scoring of sleeping stage. Neurocomputing 2020, 410, 220–228. [Google Scholar] [CrossRef]
  13. Biswal, S.; Sun, H.; Goparaju, B.; Westover, M.B.; Sun, J.; Bianchi, M.T. Expert-level sleep scoring with deep neural networks. J. Am. Med. Inform. Assoc. 2018, 25, 1643–1650. [Google Scholar] [CrossRef] [Green Version]
  14. Pathak, S.; Lu, C.; Nagaraj, S.B.; van Putten, M.; Seifert, C. STQS: Interpretable mul-ti-modal Spatial-Temporal-seQuential model for automatic Sleep scoring. Artif. Intell. Med. 2021, 114, 102038. [Google Scholar] [CrossRef]
  15. Sleep Deprivation and Deficiency. National Institute of Health, US Dept. of Health and Human Services. Available online: https://www.nhlbi.nih.gov/health-topics/sleep-deprivation-and-deficiency (accessed on 4 July 2021).
  16. Rahman, J.; Morshed, B.I. SCC Health: A Framework for Online Estimation of Disease Severity for the Smart and Connected Community. In Proceedings of the 2019 IEEE International Conference on Electro Information Technology (EIT), Brookings, SD, USA, 20–22 May 2019; Institute of Electrical and Electronics Engineers (IEEE): Piscataway, NJ, USA, 2019; pp. 373–378. [Google Scholar]
  17. Zaman, S.; Morshed, B.I. A low-power portable scanner for body-worn Wireless Resistive Analog Passive (WRAP) sensors for mHealth applications. Measurement 2021, 177, 109214. [Google Scholar] [CrossRef]
  18. Rahman, J.; Morshed, B.I.; Harmon, B. A Field Study to Capture Events of Interest (EoI) from Living Labs Using Wearables for Spatiotemporal Monitoring Towards a Framework of Smart Health (sHealth). In Proceedings of the 2020 42nd Annual International Conference of the IEEE Engineering in Medicine & Biology Society (EMBC), Montreal, QC, Canada, 20–24 July 2021; pp. 5943–5947. [Google Scholar] [CrossRef]
  19. Morshed, B.I.; Harmon, B.; Zaman, S.; Rahman, J.; Afroz, S.; Rahman, M. Inkjet Printed Fully-Passive Body-Worn Wireless Sensors for Smart and Connected Community (SCC). J. Low Power Electron. Appl. 2017, 7, 26. [Google Scholar] [CrossRef] [Green Version]
  20. Afroz, S.; Morshed, B.I. Web Visualization of Temporal and Spatial Health Data from Smartphone App in Smart and Connected Community (SCC). In Proceedings of the 2018 IEEE International Smart Cities Conference (ISC2), Kansas City, MO, USA, 16–19 September 2018; Institute of Electrical and Electronics Engineers (IEEE): Piscataway, NJ, USA, 2018; pp. 1–6. [Google Scholar]
  21. Buysse, D.J.; Reynolds, C.F.; Monk, T.H.; Berman, S.R.; Kupfer, D.J. The Pittsburgh sleep quality index: A new instrument for psychiatric practice and research. Psychiatry Res. 1989, 28, 193–213. [Google Scholar] [CrossRef]
  22. Weaver, T.E.; Laizner, A.M.; Evans, L.K.; Maislin, G.; Chugh, D.K.; Lyon, K.; Smith, P.L.; Schwartz, A.R.; Redline, S.; Pack, A.I.; et al. An instrument to measure functional status outcomes for disorders of excessive sleepiness. Sleep 1997, 20, 835–843. [Google Scholar] [CrossRef] [PubMed]
  23. Johns, M.W. A New Method for Measuring Daytime Sleepiness: The Epworth Sleepiness Scale. Sleep 1991, 14, 540–545. [Google Scholar] [CrossRef] [PubMed] [Green Version]
  24. Åkerstedt, T.; Hume, K.; Minors, D.; Waterhouse, J. The Subjective Meaning of Good Sleep, An Intraindividual Approach Using the Karolinska Sleep Diary. Percept. Mot. Ski. 1994, 79, 287–296. [Google Scholar] [CrossRef] [PubMed]
  25. O’Donnell, D.; Silva, E.J.; Münch, M.; Ronda, J.M.; Wang, W.; Duffy, J.F. Comparison of subjective and objective assessments of sleep in healthy older subjects without sleep complaints. J. Sleep Res. 2009, 18, 254–263. [Google Scholar] [CrossRef] [Green Version]
  26. Zhang, L.; Zhao, Z.X. Objective and subjective measures for sleep disorders. Neurosci. Bull. 2007, 23, 236–240. [Google Scholar] [CrossRef] [PubMed] [Green Version]
  27. Krystal, A.D.; Edinger, J.D. Measuring sleep quality. Sleep Med. 2008, 9, S10–S17. [Google Scholar] [CrossRef]
  28. Sun, S.; Zhao, X.; Ren, J.; Cheng, J.; Zhou, J.; Su, C. Characteristics of objective sleep and its related risk factors among Parkinson’s disease patients with and without restless legs syndrome. Front. Neurol. 2021, 12. [Google Scholar] [CrossRef] [PubMed]
  29. What’s Sleep Score in the Fitbit App? Available online: https://help.fitbit.com/articles/en_US/Help_article/2439.htm. (accessed on 25 June 2021).
  30. de Zambotti, M.; Goldstone, A.; Claudatos, S.; Colrain, I.M.; Baker, F.C. A validation study of Fitbit Charge 2™ compared with polysomnography in adults. Chronobiol. Int. 2018, 35, 465–476. [Google Scholar] [CrossRef]
  31. How Oura Measures Your Sleep. Available online: https://ouraring.com/blog/sleep-score/ (accessed on 25 June 2021).
  32. That Sleep Tracker Could Make Your Insomnia Worse, New York Times. Available online: https://www.nytimes.com/2019/06/13/health/sleep-tracker-insomnia-orthosomnia.html (accessed on 25 June 2021).
  33. Liang, Z.; Martell, M.A.C. Validity of Consumer Activity Wristbands and Wearable EEG for Measuring Overall Sleep Parameters and Sleep Structure in Free-Living Conditions. J. Health Inform. Res. 2018, 2, 152–178. [Google Scholar] [CrossRef]
  34. Sleep deprivation and deficiency, National Heart, Lung and Blood Institute, NIH. Available online: https://www.nhlbi.nih.gov/health-topics/sleep-deprivation-and-deficiency (accessed on 30 June 2021).
  35. Quan, S.F.; Howard, B.V.; Iber, C.; Kiley, J.P.; Nieto, F.J.; O’Connor, G.T.; Rapoport, D.M.; Redline, S.; Robbins, J.; Samet, J.M.; et al. The sleep heart health study: Design, rationale, and methods. Sleep 1997, 20, 1077–1085. [Google Scholar] [PubMed] [Green Version]
  36. Rosipal, R.; Lewandowski, A.; Dorffner, G. In search of objective components for sleep quality indexing in normal sleep. Biol. Psychol. 2013, 94, 210–220. [Google Scholar] [CrossRef] [PubMed] [Green Version]
  37. Landry, G.J.; Best, J.R.; Liu-Ambrose, T. Measuring sleep quality in older adults: A comparison using subjective and objective methods. Front. Aging Neurosci. 2015, 7, 166. [Google Scholar] [CrossRef] [Green Version]
  38. Malik, M.; Farrell, T.; Cripps, T.; Camm, A.J. Heart rate variability in relation to prognosis after myocardial infarction: Selection of optimal processing techniques. Eur. Hear. J. 1989, 10, 1060–1074. [Google Scholar] [CrossRef]
  39. Goldberger, A.L.; Amaral, L.A.N.; Glass, L.; Hausdorff, J.M.; Ivanov, P.C.; Mark, R.G.; Mietus, J.E.; Moody, G.B.; Peng, C.K.; Stanley, H.E. PhysioBank, PhysioToolkit, and PhysioNet. Circulation 2000, 101, e215–e220. [Google Scholar] [CrossRef] [Green Version]
  40. SpectralTrainFig. MATLAB Central File Exchange. Available online: https://www.mathworks.com/matlabcentral/fileexchange/49852-spectraltrainfig (accessed on 10 September 2021).
  41. Draminski, M.; Rada-Iglesias, A.; Enroth, S.; Wadelius, C.; Koronacki, J.; Komorowski, J. Monte Carlo feature selection for supervised classification. Bioinformatics 2007, 24, 110–117. [Google Scholar] [CrossRef] [PubMed] [Green Version]
  42. Dramiński, M.; Koronacki, J.; Drami\’Nski, M. rmcfs: An R Package for Monte Carlo Feature Selection and Interdependency Discovery. J. Stat. Softw. 2018, 85, 1–28. [Google Scholar] [CrossRef] [Green Version]
  43. Bishop, C.M.; Tipping, M.E. Bayesian regression and classification. Nato Sci. Ser. Sub Ser. III Comput. Syst. Sci. 2003, 190, 267–288. [Google Scholar]
  44. Goodrich, B.; Gabry, J.; Ali, I.; Brilleman, S. rstanarm: Bayesian Applied Regression Modeling via Stan. R package version 2.21.1. 2020. Available online: https://mc-stan.org/rstanarm (accessed on 21 August 2021).
  45. Marquardt, D.W. An Algorithm for Least-Squares Estimation of Nonlinear Parameters. J. Soc. Ind. Appl. Math. 1963, 11, 431–441. [Google Scholar] [CrossRef]
  46. Vehtari, A.; Simpson, D.; Gelman, A.; Yao, Y.; Gabry, J. Pareto smoothed importance sampling. arXiv 2015, arXiv:1507.02646. [Google Scholar]
  47. Kimoff, R.J. Sleep Fragmentation in Obstructive Sleep Apnea. Sleep 1996, 19, S61–S66. [Google Scholar] [CrossRef] [PubMed] [Green Version]
Figure 1. Workflow for Events of interest capture and spatiotemporal visualization in sHealth.
Biomedinformatics 01 00008 g001
Figure 2. Subjective and objective methods for sleep health assessments.
Biomedinformatics 01 00008 g002
Figure 3. Method for feature extraction, feature selection, and regression for sleep deficiency severity.
Biomedinformatics 01 00008 g003
Figure 4. Probability density plot for SDS distribution.
Biomedinformatics 01 00008 g004
Figure 5. Comparison of SDS between males and females.
Biomedinformatics 01 00008 g005
Figure 6. Correlation of SDS with Age.
Biomedinformatics 01 00008 g006
Figure 7. SDS for BMI Categories.
Biomedinformatics 01 00008 g007
Figure 8. Relative importance of features.
Biomedinformatics 01 00008 g008
Figure 9. Convergence of Monte-Carlo feature selection.
Biomedinformatics 01 00008 g009
Figure 10. Top 20 features by MCFS-ID algorithm.
Biomedinformatics 01 00008 g010
Figure 11. (a) posterior predictive check on MCMC sampler (b) density plot of Bayesian model estimated SDS including the point estimate.
Biomedinformatics 01 00008 g011
Figure 12. Plot–of–fit for the Bayesian regression model.
Biomedinformatics 01 00008 g012
Figure 13. PSIS diagnostic plot and regression plot for Bayesian method.
Biomedinformatics 01 00008 g013
Figure 14. Performance of Regression model in the train, validation, and test set.
Biomedinformatics 01 00008 g014
Figure 15. Scatterplot showing correlation of SDS with MW8 sleep quality score.
Biomedinformatics 01 00008 g015
Figure 16. Correlation of (a) ESS with AHI (b) FOSQ with AHI (c) SDS with AHI.
Biomedinformatics 01 00008 g016
Table 1. Spectral Features Extracted from EEG.
EEG BandFrequency (Hz)Features
Slow OSC0.5–1Spectral Power-
REM, NREM, Total
(for each band)
Delta0.5–4
Theta4–8
Alpha8–13
Sigma12–14
Beta13–30
Gamma36–90
Table 2. Partial Correlation of SDS with HRV and EEG features.
HRV FeaturesEEG Features
Featurerp-valueFeaturerp-value
AVNN0.090.04slowosc_nrem0.390.01
pNN100.080.04delta_nrem0.390.01
HR−0.110.02slowosc_sleep0.330.01
VLF−0.110.02delta_sleep0.290.01
LF/HF−0.130.01theta_rem0.250.01
N.B. Variables in the table have been described in the Appendix A.
Table 3. A Comparion of ANN Performance with other models.
ModelR2RMSE
Linear Regression0.58.72
Support Vector Machine0.696.3
Random Forest 0.537.36
Additive Regression0.517.82
ANN0.675.47
Publisher’s Note: MDPI stays neutral with regard to jurisdictional claims in published maps and institutional affiliations.

