
A Comprehensive Analysis of Trapezius Muscle EMG Activity in Relation to Stress and Meditation

 ,
,  and
and 
Abstract
1. Introduction
2. Materials and Methods
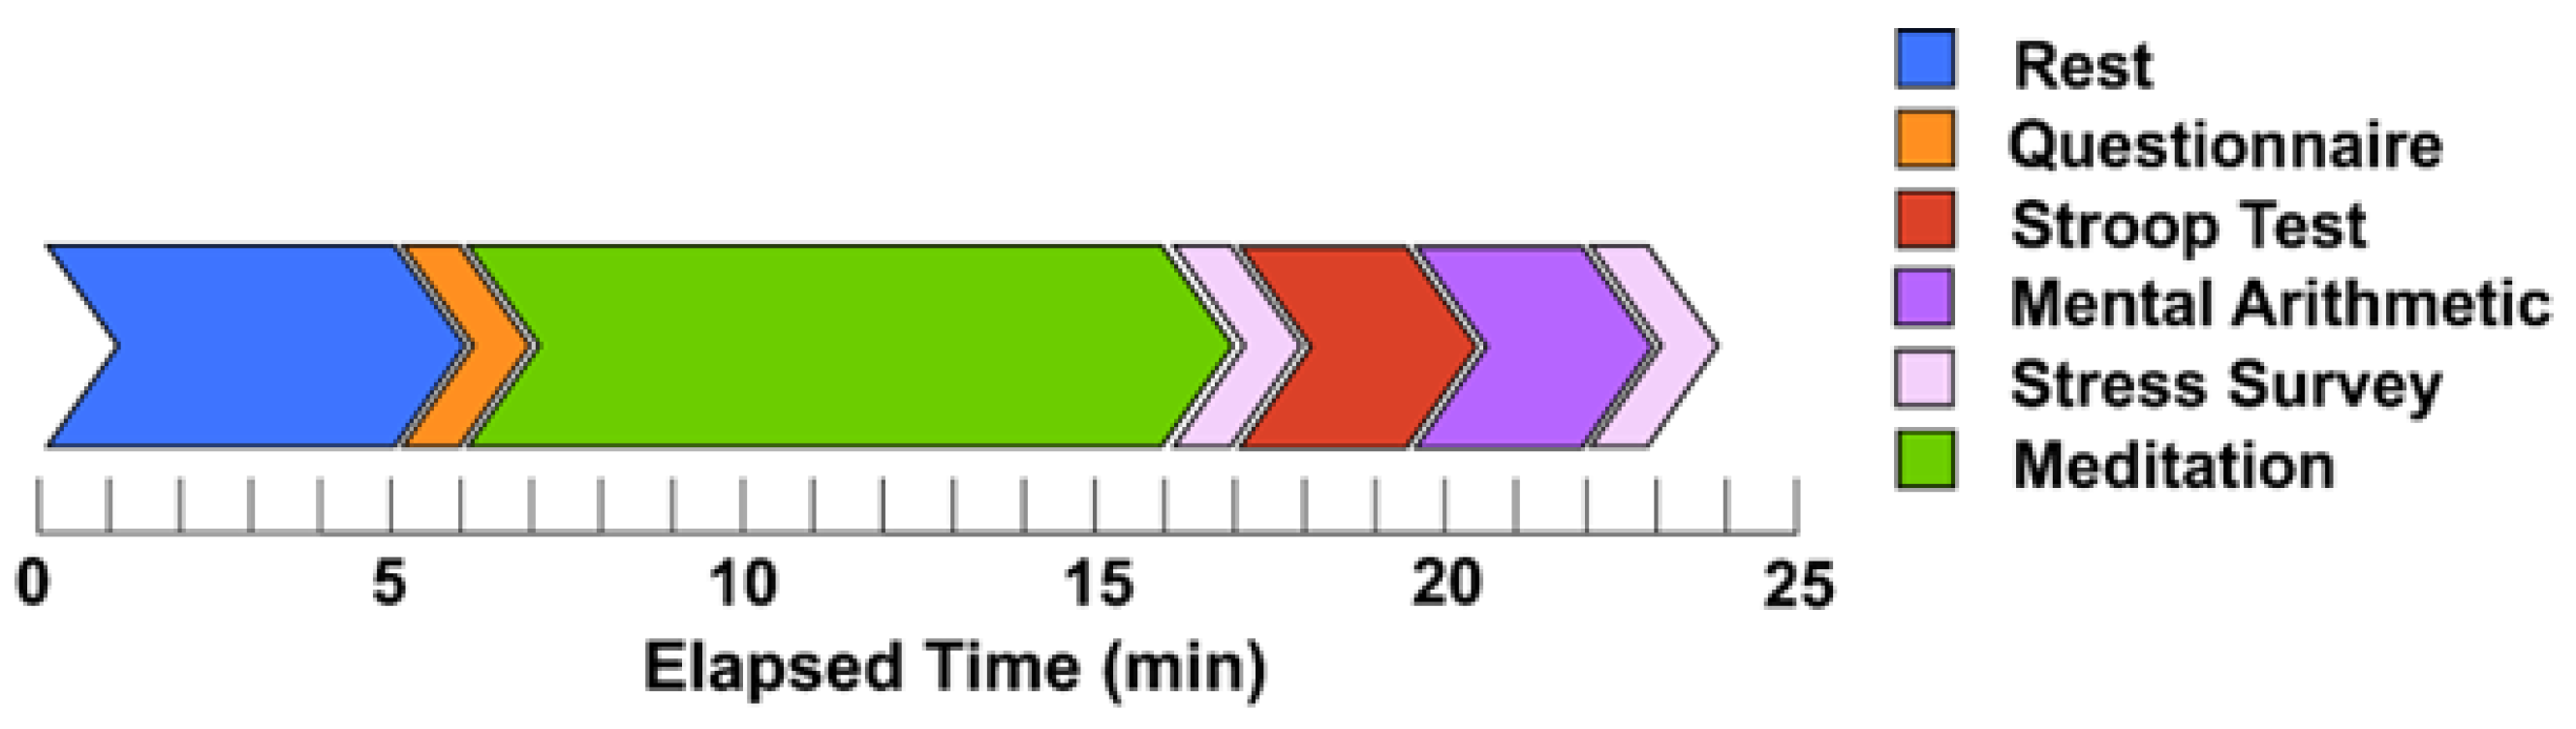
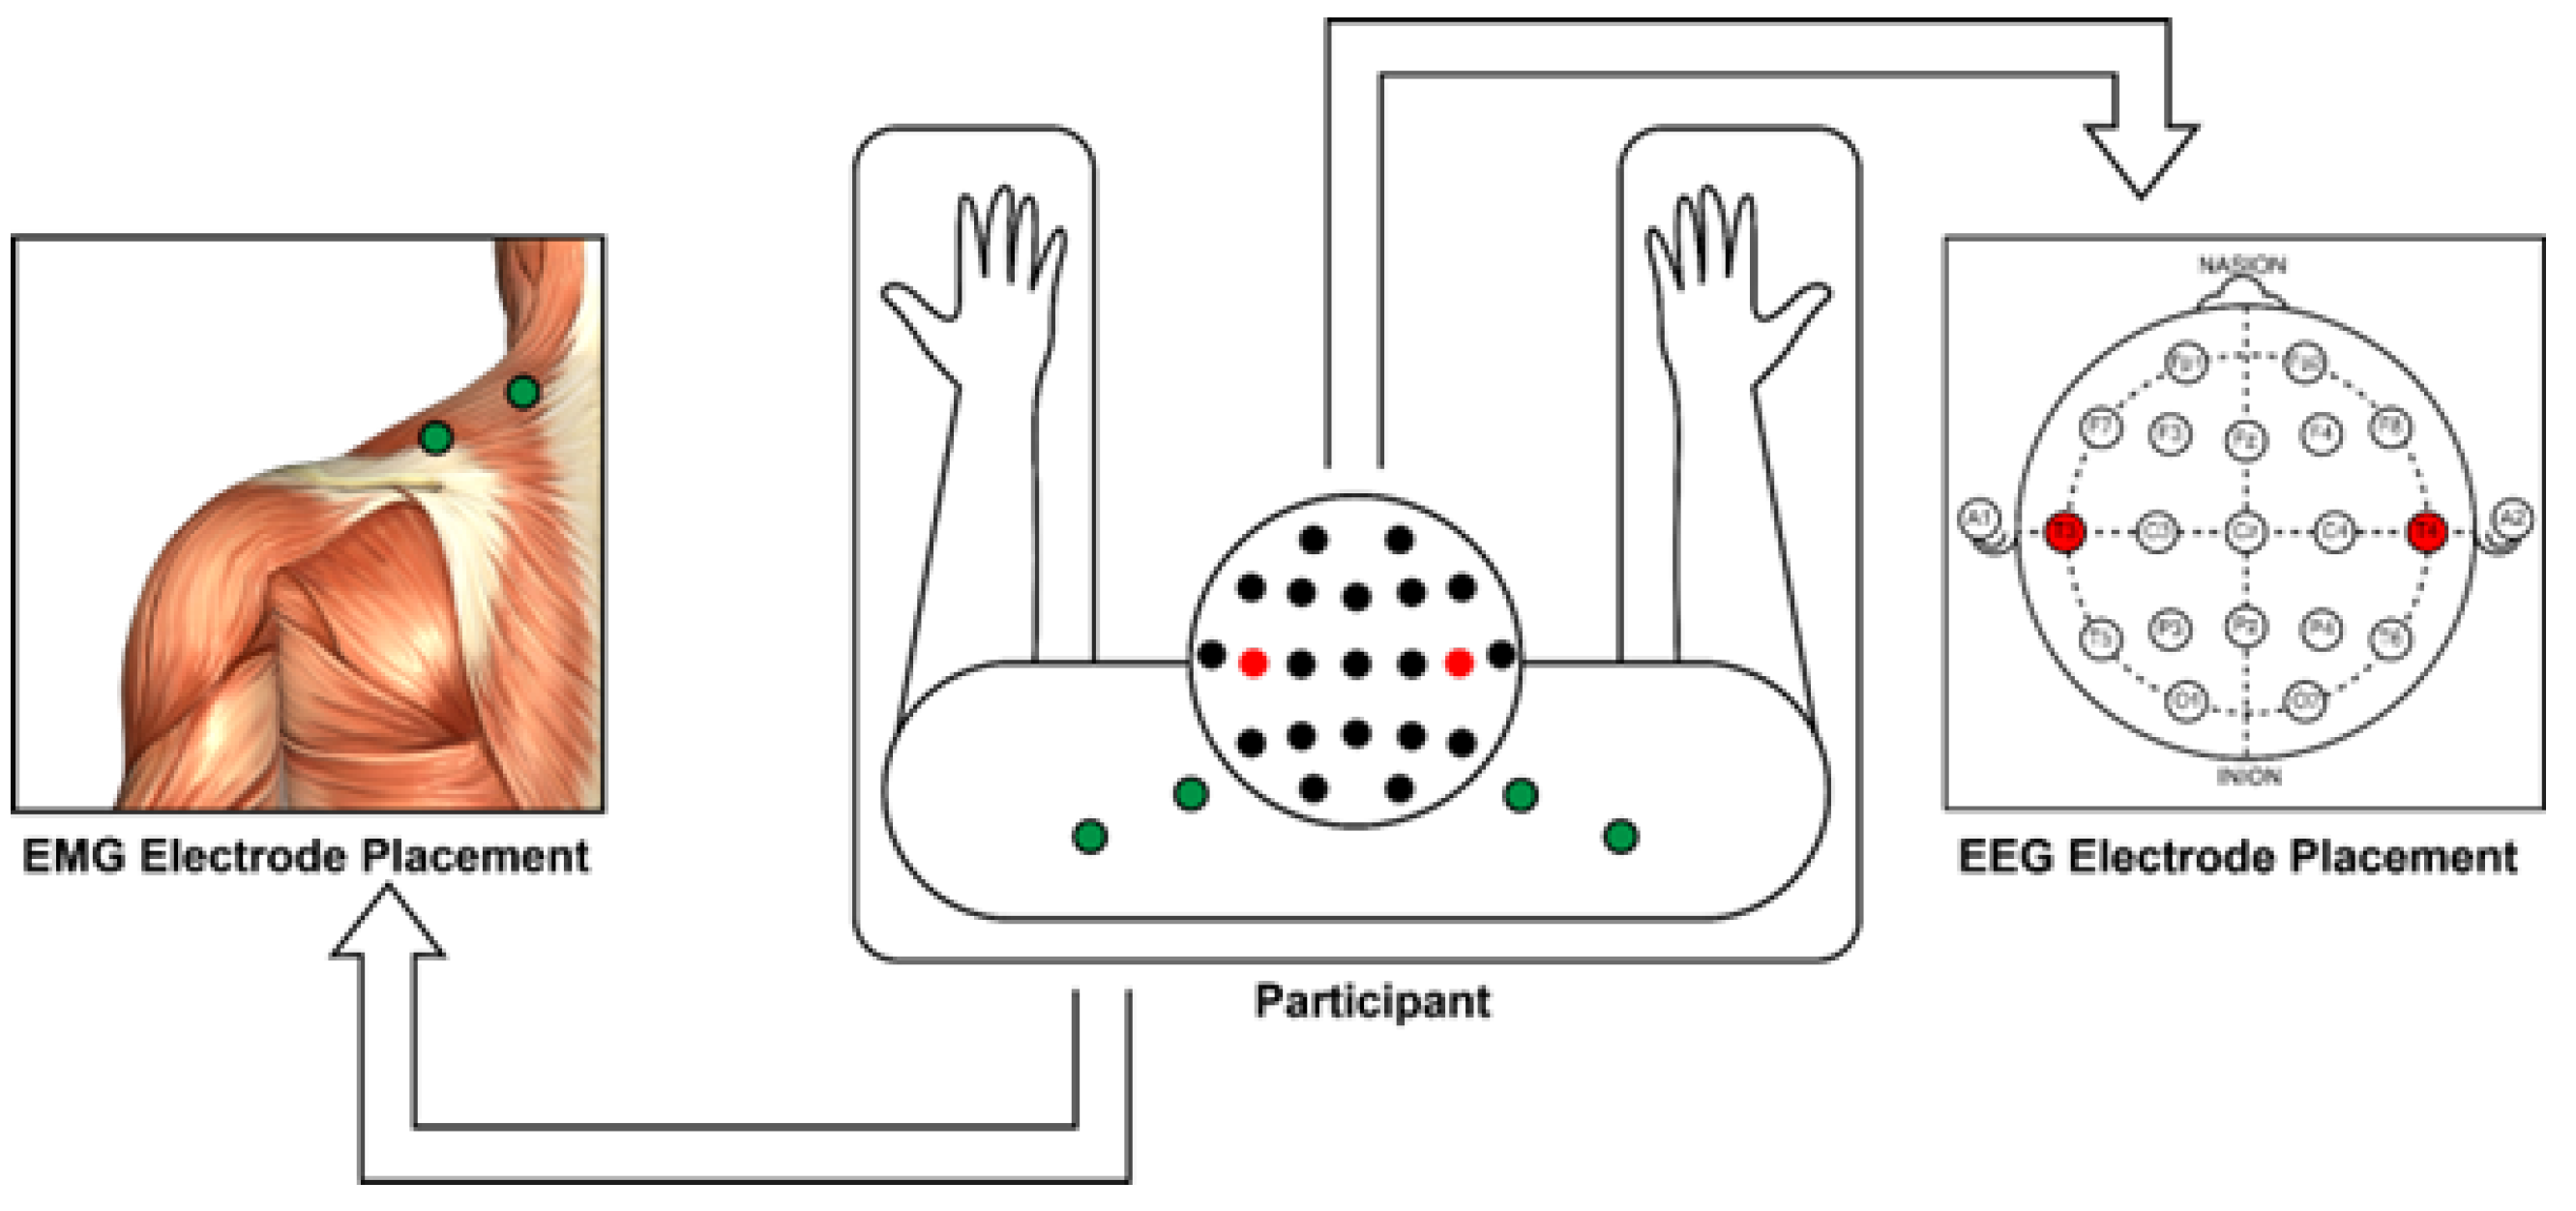
2.1. Experimental Protocol and Data Acquistion
2.2. Signal Processing
2.3. Feature Evaluation
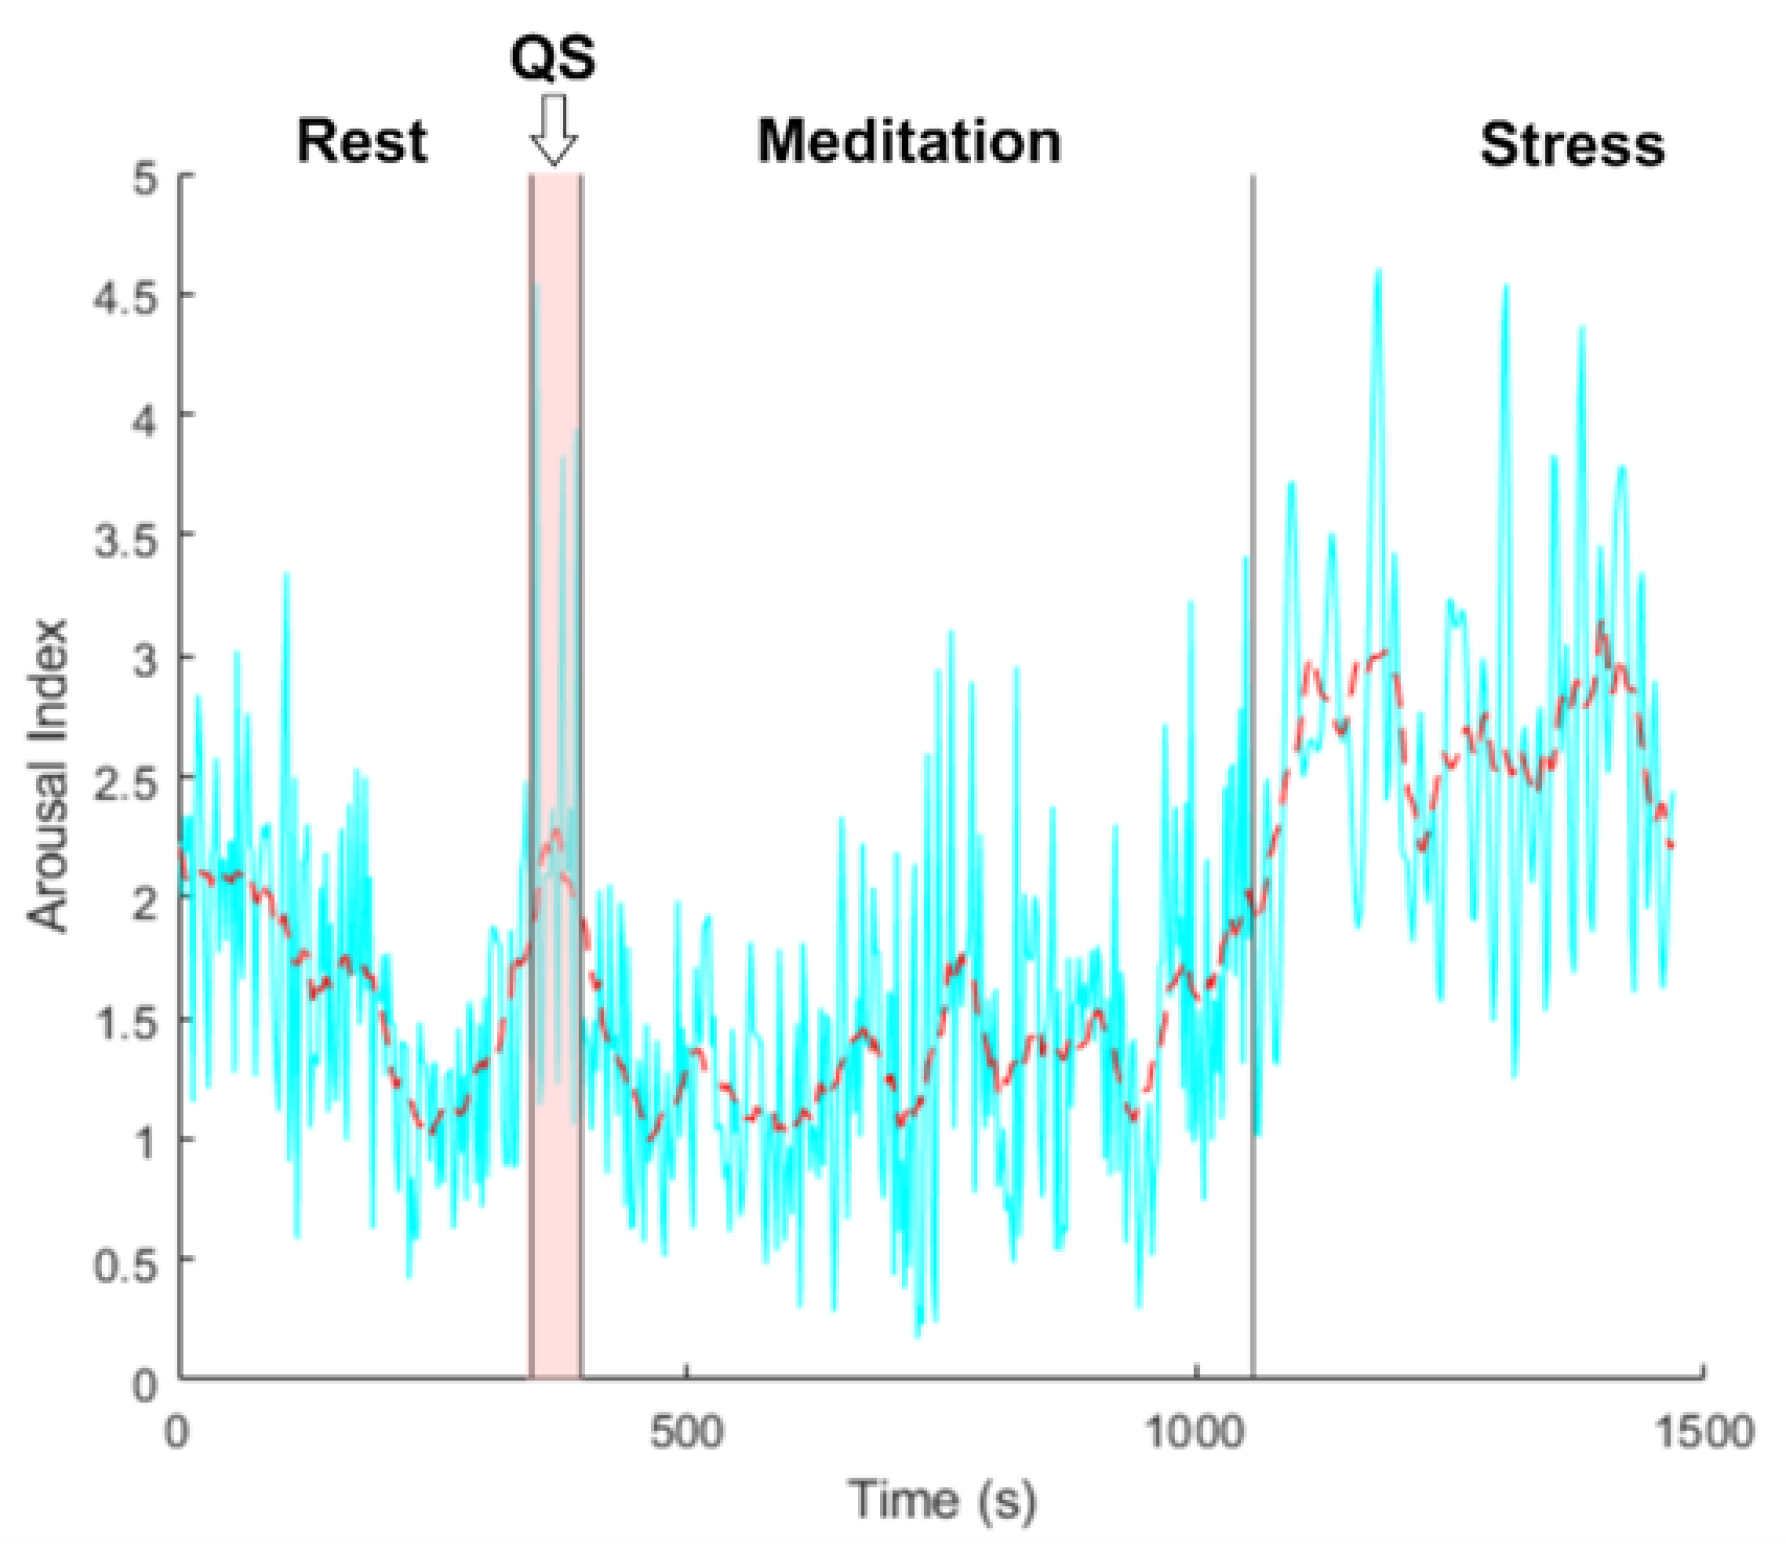
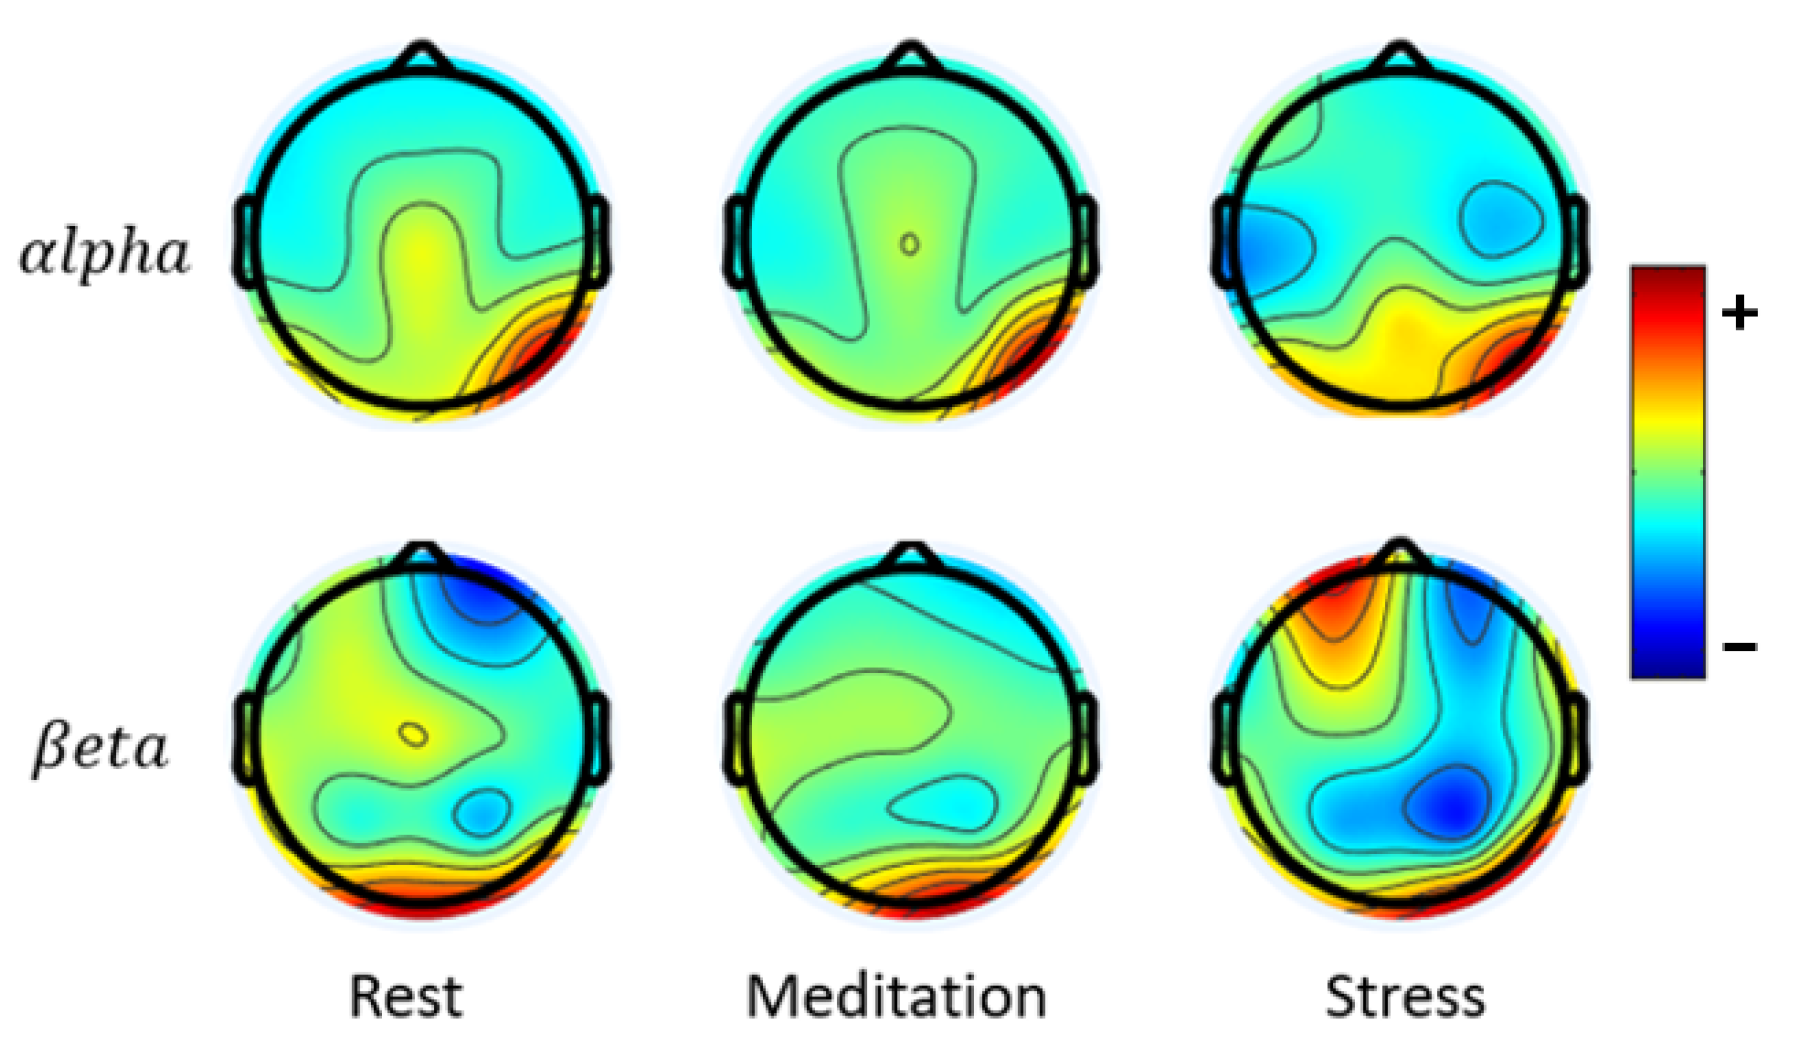
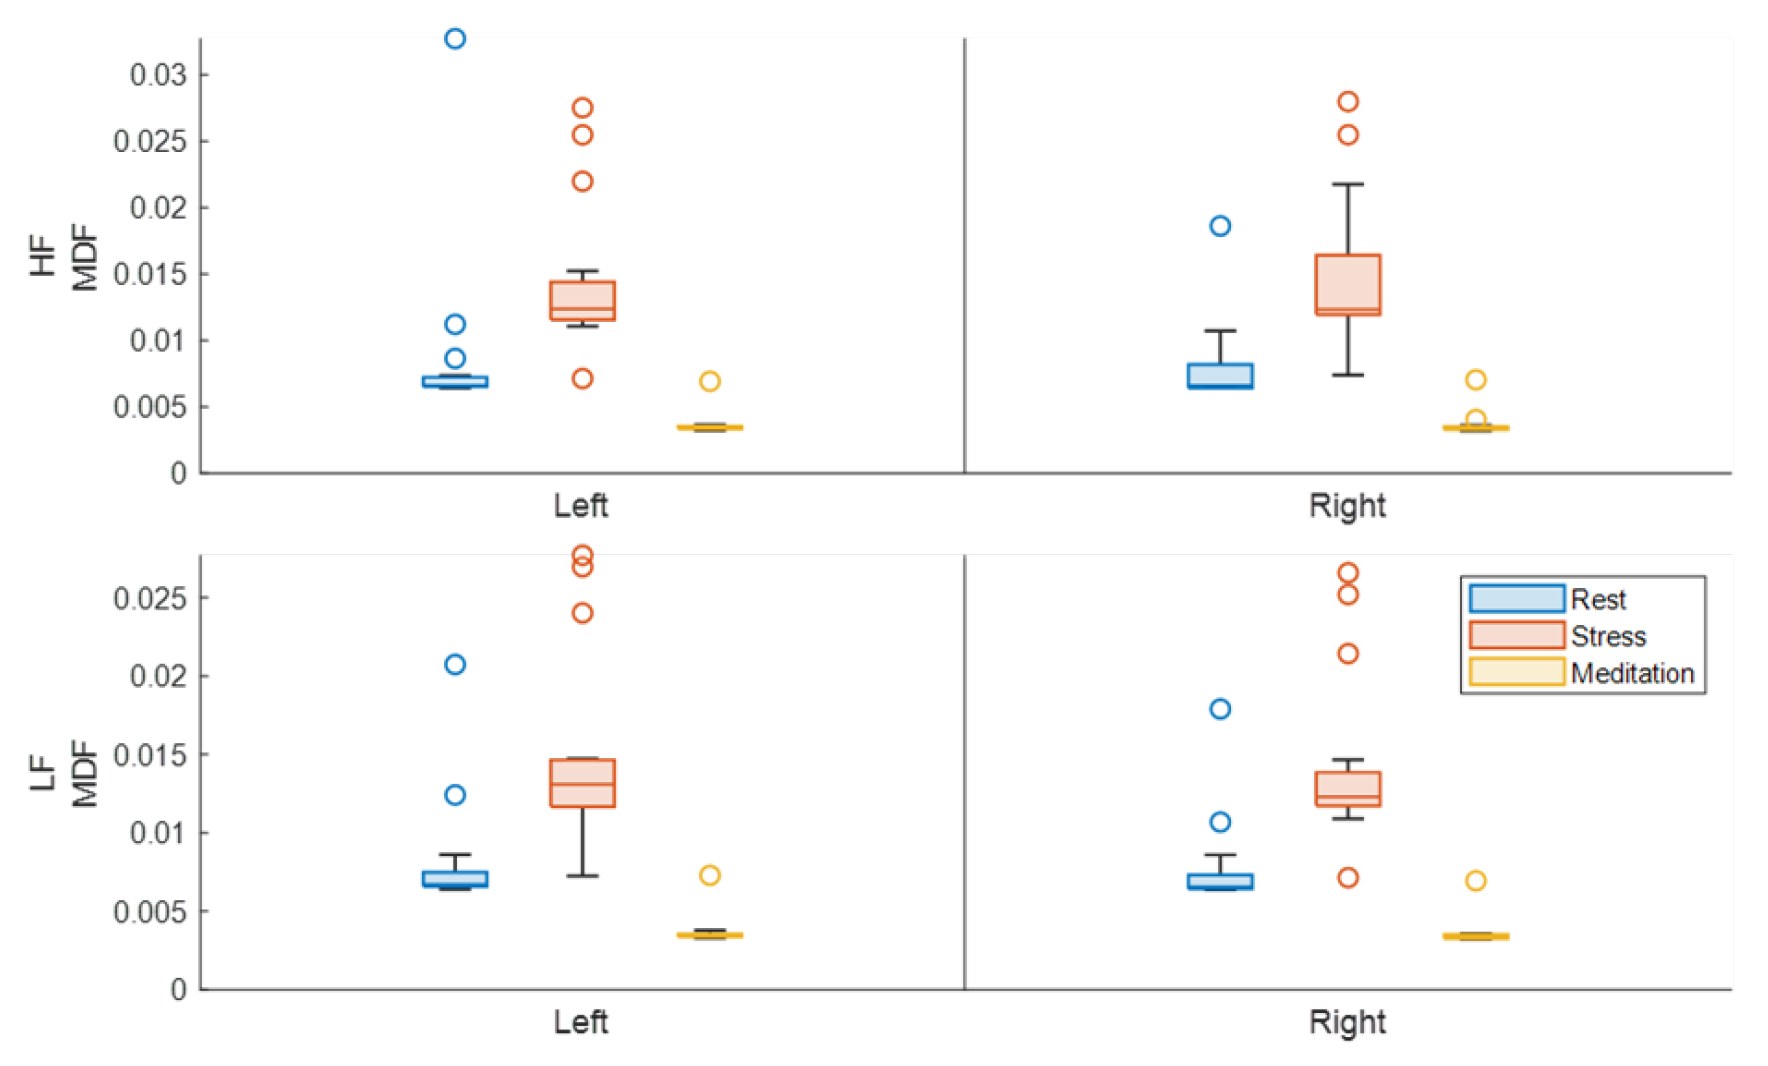
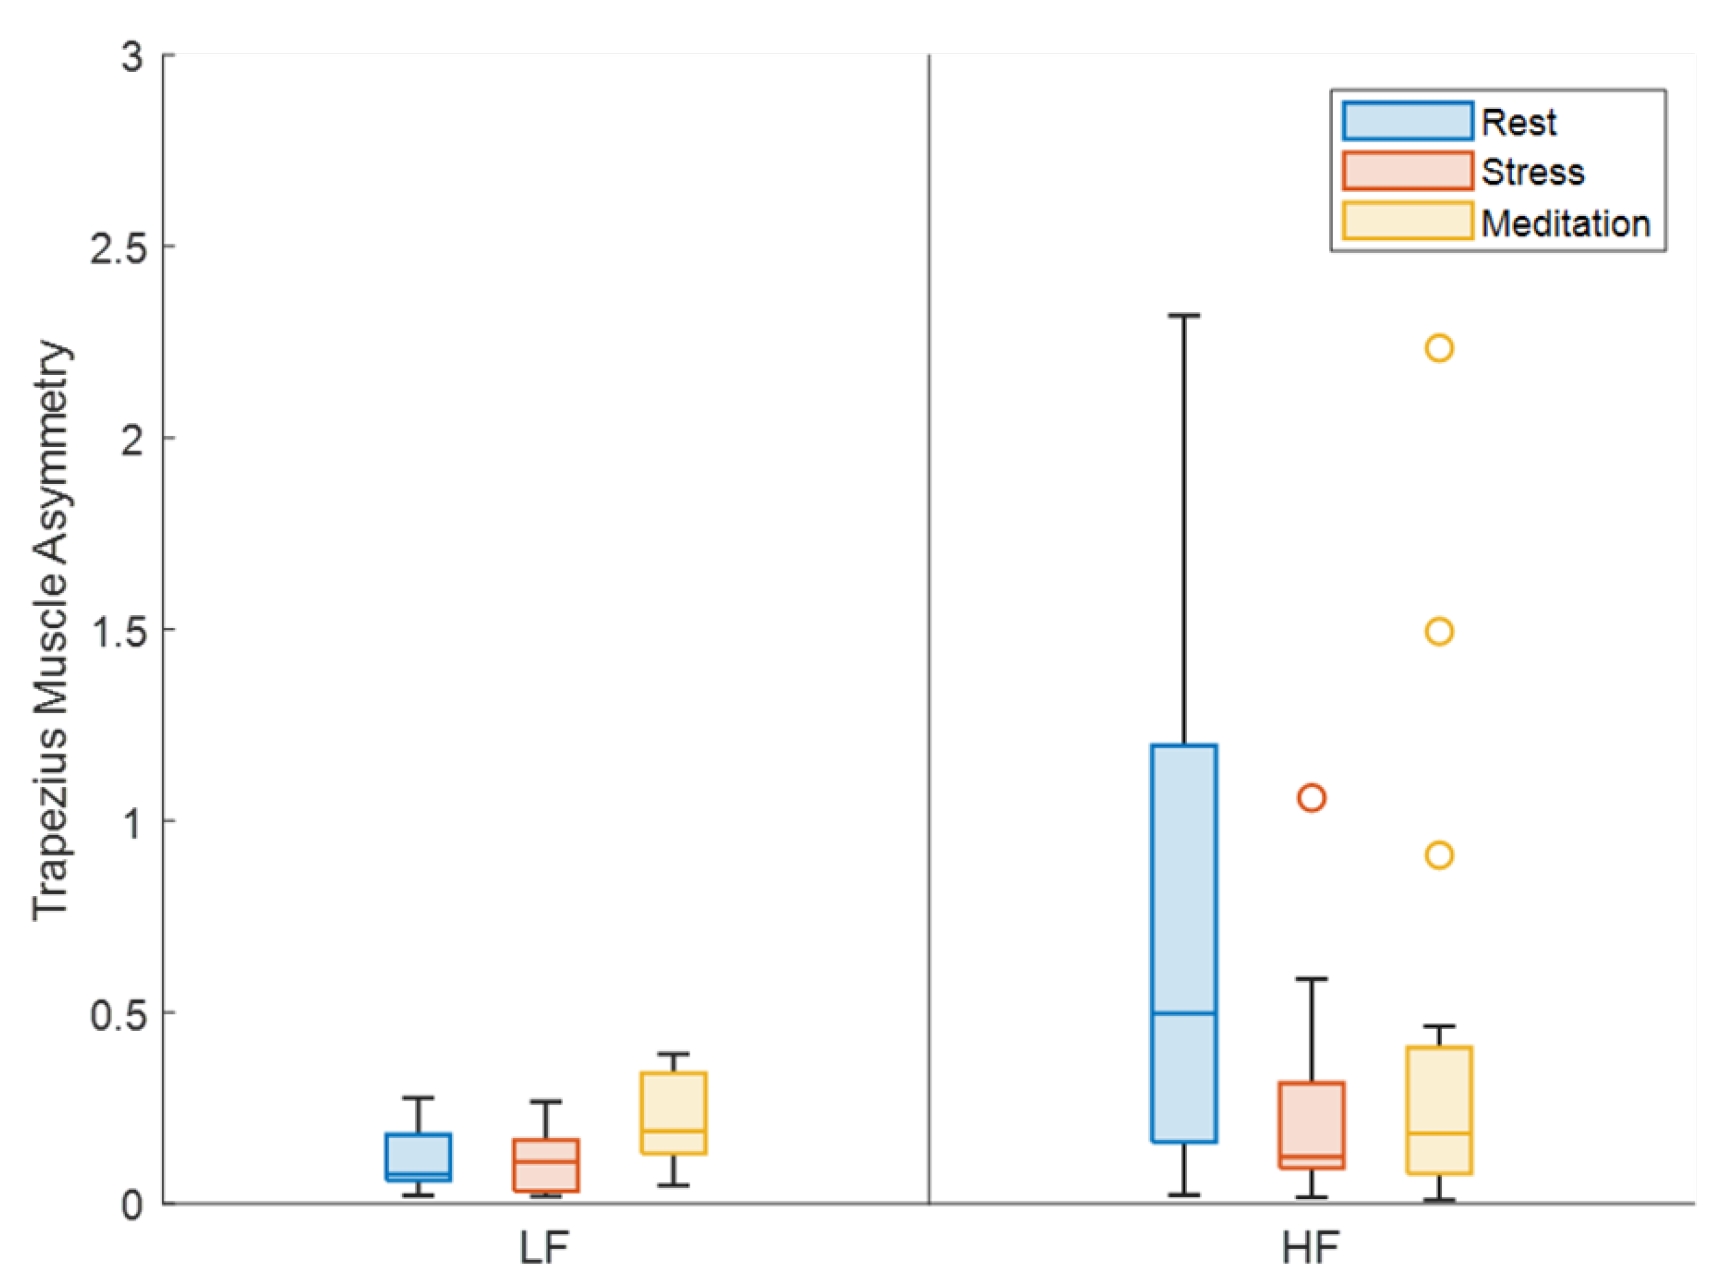
3. Results
4. Discussion
5. Limitations
6. Conclusions
Author Contributions
Funding
Institutional Review Board Statement
Informed Consent Statement
Data Availability Statement
Conflicts of Interest
References
- Boyd, D. Workplace Stress. Available online: https://www.stress.org/workplace-stress (accessed on 27 February 2024).
- Katmah, R.; Al-Shargie, F.; Tariq, U.; Babiloni, F.; Al-Mughairbi, F.; Al-Nashash, H. A Review on Mental Stress Assessment Methods Using EEG Signals. Sensors 2021, 21, 5043. [Google Scholar] [CrossRef] [PubMed]
- Sincero, S. Three Different Kinds of Stress. 2012. Available online: https://explorable.com/three-different-kinds-of-stress (accessed on 27 February 2024).
- Levine, G.N. Psychological Stress and Heart Disease: Fact or Folklore? Am. J. Med. 2022, 135, 688–696. [Google Scholar] [CrossRef] [PubMed]
- Melchior, M.; Caspi, A.; Milne, B.J.; Danese, A.; Poulton, R.; Moffitt, T.E. Work stress precipitates depression and anxiety in young, working women and men. Psychol. Med. 2007, 37, 1119–1129. [Google Scholar] [CrossRef] [PubMed]
- Bui, T.; Zackula, R.; Dugan, K.; Ablah, E. Workplace Stress and Productivity: A Cross-Sectional Study. Kans. J. Med. 2021, 14, 42–45. [Google Scholar] [CrossRef] [PubMed]
- Montani, F.; Vandenberghe, C.; Khedhaouria, A.; Courcy, F. Examining the inverted U-shaped relationship between workload and innovative work behavior: The role of work engagement and mindfulness. Hum. Relat. 2020, 73, 59–93. [Google Scholar] [CrossRef]
- Ford, J.; Ildefonso, K.; Jones, M.; Arvinen-Barrow, M. Sport-related anxiety: Current insights. Open Access J. Sport. Med. 2017, 8, 205–212. [Google Scholar] [CrossRef]
- Vagg, P.R.; Spielberger, C.D. The Job Stress Survey: Assessing perceived severity and frequency of occurrence of generic sources of stress in the workplace. J. Occup. Health Psychol. 1999, 4, 288–292. [Google Scholar] [CrossRef]
- Kim, H.G.; Cheon, E.J.; Bai, D.S.; Lee, Y.H.; Koo, B.H. Stress and Heart Rate Variability: A Meta-Analysis and Review of the Literature. Psychiatry Investig. 2018, 15, 235–245. [Google Scholar] [CrossRef]
- Fernandes, A.; Helawar, R.; Lokesh, R.; Tari, T.; Shahapurkar, A.V. Determination of stress using Blood Pressure and Galvanic Skin Response. In Proceedings of the 2014 International Conference on Communication and Network Technologies, Sivakasi, India, 18–19 December 2014; pp. 165–168. [Google Scholar] [CrossRef]
- Pourmohammadi, S.; Maleki, A. Stress detection using ECG and EMG signals: A comprehensive study. Comput. Methods Programs Biomed. 2020, 193, 105482. [Google Scholar] [CrossRef]
- Wang, J.; Sun, Y.; Sun, S. Recognition of Muscle Fatigue Status Based on Improved Wavelet Threshold and CNN-SVM. IEEE Access 2020, 8, 207914–207922. [Google Scholar] [CrossRef]
- Mukund, K.; Subramaniam, S. Skeletal muscle: A review of molecular structure and function, in health and disease. WIREs Syst. Biol. Med. 2020, 12, e1462. [Google Scholar] [CrossRef] [PubMed]
- Kuo, I.Y.; Ehrlich, B.E. Signaling in Muscle Contraction. Cold Spring Harb. Perspect. Biol. 2015, 7, a006023. [Google Scholar] [CrossRef]
- Carson, R. Neural pathways mediating bilateral interactions between the upper limbs. Brain Res. Rev. 2005, 49, 641–662. [Google Scholar] [CrossRef] [PubMed]
- Hasegawa, K.; Kasuga, S.; Takasaki, K.; Mizuno, K.; Liu, M.; Ushiba, J. Ipsilateral EEG mu rhythm reflects the excitability of uncrossed pathways projecting to shoulder muscles. J. Neuroeng. Rehabil. 2017, 14, 85. [Google Scholar] [CrossRef] [PubMed]
- Chino, T.; Kinoshita, S.; Abo, M. Repetitive Transcranial Magnetic Stimulation and Rehabilitation Therapy for Upper Limb Hemiparesis in Stroke Patients: A Narrative Review. Prog. Rehabil. Med. 2023, 8, 20230005. [Google Scholar] [CrossRef]
- Wang, L.; Zhu, Q.X.; Zhong, M.H.; Zhou, R.Z.; Liu, X.Q.; Tang, N.S.; Feng, X.C.; Gao, C.F. Effects of corticospinal tract integrity on upper limb motor function recovery in stroke patients treated with repetitive transcranial magnetic stimulation. J. Integr. Neurosci. 2022, 21, 50. [Google Scholar] [CrossRef] [PubMed]
- Park, T.; Lee, M.; Jeong, T.; Shin, Y.I.; Park, S.M. Quantitative Analysis of EEG Power Spectrum and EMG Median Power Frequency Changes after Continuous Passive Motion Mirror Therapy System. Sensors 2020, 20, 2354. [Google Scholar] [CrossRef] [PubMed]
- Nakayashiki, K.; Saeki, M.; Takata, Y.; Hayashi, Y.; Kondo, T. Modulation of event-related desynchronization during kinematic and kinetic hand movements. J. Neuroeng. Rehabil. 2014, 11, 90. [Google Scholar] [CrossRef]
- Petrichella, S.; Johnson, N.; He, B. The influence of corticospinal activity on TMS-evoked activity and connectivity in healthy subjects: A TMS-EEG study. Open Access 2017, 12, e0174879. [Google Scholar] [CrossRef] [PubMed]
- Muthukumaraswamy, S.D. High-frequency brain activity and muscle artifacts in MEG/EEG: A review and recommendations. Front. Hum. Neurosci. 2013, 7, 138. [Google Scholar] [CrossRef]
- Ahmed, M.H.; Kaya, M.; Taebi, A.; Thibbotuwawa Gamage, P. Feasibility of Trapezius Muscle Electromyography and Electrocardiography to Monitor Stress Levels in High Demand Positions. In Proceedings of the Volume 5: Biomedical and Biotechnology, New Orleans, LA, USA, 29 October–2 November 2023; p. V005T06A023. [Google Scholar] [CrossRef]
- Luijcks, R.; Hermens, H.J.; Bodar, L.; Vossen, C.J.; Os, J.V.; Lousberg, R. Experimentally Induced Stress Validated by EMG Activity. PLoS ONE 2014, 9, e95215. [Google Scholar] [CrossRef]
- Schleifer, L.M.; Spalding, T.W.; Kerick, S.E.; Cram, J.R.; Ley, R.; Hatfield, B.D. Mental stress and trapezius muscle activation under psychomotor challenge: A focus on EMG gaps during computer work. Psychophysiology 2008, 45, 356–365. [Google Scholar] [CrossRef] [PubMed]
- Larsson, S.E.; Larsson, R.; Zhang, Q.; Cai, H.; Ake Oberg, P. Effects of psychophysiological stress on trapezius muscles blood flow and electromyography during static load. Eur. J. Appl. Physiol. Occup. Physiol. 1995, 71, 493–498. [Google Scholar] [CrossRef] [PubMed]
- Sharma, N.; Gedeon, T. Objective measures, sensors and computational techniques for stress recognition and classification: A survey. Comput. Methods Programs Biomed. 2012, 108, 1287–1301. [Google Scholar] [CrossRef] [PubMed]
- Sarilho De Mendonça, F.; De Tarso Camillo De Carvalho, P.; Biasotto-Gonzalez, D.A.; Calamita, S.A.P.; De Paula Gomes, C.A.F.; Amorim, C.F.; Fumagalli, M.A.; Politti, F. Muscle fiber conduction velocity and EMG amplitude of the upper trapezius muscle in healthy subjects after low-level laser irradiation: A randomized, double-blind, placebo-controlled, crossover study. Lasers Med. Sci. 2018, 33, 737–744. [Google Scholar] [CrossRef] [PubMed]
- Oberg, T.; Sandsjo, L.; Kadefors, R. Electromyogram mean power frequency in non-fatigued trapezius muscle. Eur. J. Appl. Physiol. Occup. Physiol. 1990, 61, 362–369. [Google Scholar] [CrossRef] [PubMed]
- Hummel, A.; Läubli, T.; Pozzo, M.; Schenk, P.; Spillmann, S.; Klipstein, A. Relationship between perceived exertion and mean power frequency of the EMG signal from the upper trapezius muscle during isometric shoulder elevation. Eur. J. Appl. Physiol. 2005, 95, 321–326. [Google Scholar] [CrossRef] [PubMed]
- Grosse, P.; Cassidy, M.; Brown, P. EEG–EMG, MEG–EMG and EMG–EMG frequency analysis: Physiological principles and clinical applications. Clin. Neurophysiol. 2002, 113, 1523–1531. [Google Scholar] [CrossRef] [PubMed]
- Westgaard, R.H.; Bonato, P.; Holte, K.A. Low-Frequency Oscillations (<0.3 Hz) in the Electromyographic (EMG) Activity of the Human Trapezius Muscle During Sleep. J. Neurophysiol. 2002, 88, 1177–1184. [Google Scholar] [CrossRef]
- Sushkova, O.S.; Morozov, A.A.; Kershner, I.A.; Petrova, N.G.; Gabova, A.V.; Chigaleychik, L.A.; Karabanov, A.V. Investigation of Distribution Laws of the Phase Difference of the Envelopes of Electromyograms of Antagonist Muscles in Parkinson’s Disease and Essential Tremor Patients. Radioelectron. Nanosyst. Inf. Technol. 2019, 11, 225–236. [Google Scholar] [CrossRef]
- McAuley, J.H. Physiological and pathological tremors and rhythmic central motor control. Brain 2000, 123, 1545–1567. [Google Scholar] [CrossRef] [PubMed]
- Raethjen, J.; Lindemann, M.; Morsnowski, A.; Dümpelmann, M.; Wenzelburger, R.; Stolze, H.; Fietzek, U.; Pfister, G.; Elger, C.E.; Timmer, J.; et al. Is the rhythm of physiological tremor involved in cortico-cortical interactions? Mov. Disord. 2004, 19, 458–465. [Google Scholar] [CrossRef]
- Salenius, S.; Portin, K.; Kajola, M.; Salmelin, R.; Hari, R. Cortical Control of Human Motoneuron Firing During Isometric Contraction. J. Neurophysiol. 1997, 77, 3401–3405. [Google Scholar] [CrossRef] [PubMed]
- Marsden, J.F.; Brown, P.; Salenius, S. Involvement of the sensorimotor cortex in physiological force and action tremor. Neuroreport 2001, 12, 1937–1941. [Google Scholar] [CrossRef]
- Sjörs, A.; Larsson, B.; Dahlman, J.; Falkmer, T.; Gerdle, B. Physiological responses to low-force work and psychosocial stress in women with chronic trapezius myalgia. BMC Musculoskelet. Disord. 2009, 10, 63. [Google Scholar] [CrossRef] [PubMed]
- Hanke, M.; Halchenko, Y.O. Neuroscience Runs on GNU/Linux. Front. Neuroinform. 2011, 5, 8. [Google Scholar] [CrossRef] [PubMed]
- Ahmed, M.H.; Kaya, M.; Taebi, A.; Thibbotuwawa Gamage, P. The Role of Meditation in Stress Recovery and Performance: An EEG Study. In Proceedings of the Volume 5: Biomedical and Biotechnology, New Orleans, LA, USA, 29 October–2 November 2023; p. V005T06A029. [Google Scholar] [CrossRef]
- Ribas, V.R.; Ribas, R.G.; Nóbrega, J.d.A.; da Nóbrega, M.V.; Espécie, J.A.d.A.; Calafange, M.T.; Calafange, C.d.O.M.; Martins, H.A.d.L. Pattern of anxiety, insecurity, fear, panic and/or phobia observed by quantitative electroencephalography (QEEG). Dement. Neuropsychol. 2018, 12, 264–271. [Google Scholar] [CrossRef] [PubMed]
- Roman-Liu, D.; Konarska, M. Characteristics of power spectrum density function of EMG during muscle contraction below 30%MVC. J. Electromyogr. Kinesiol. 2009, 19, 864–874. [Google Scholar] [CrossRef] [PubMed]
- Al-Mulla, R.M.; Sepulveda, F.; Colley, M. sEMG Techniques to Detect and Predict Localised Muscle Fatigue. In EMG Methods for Evaluating Muscle and Nerve Function; Schwartz, M., Ed.; InTech: Kent, UT, USA, 2012. [Google Scholar] [CrossRef][Green Version]
- Oskoei, M.; Hu, H. Support Vector Machine-Based Classification Scheme for Myoelectric Control Applied to Upper Limb. IEEE Trans. Biomed. Eng. 2008, 55, 1956–1965. [Google Scholar] [CrossRef]
- Phinyomark, A.; Thongpanja, S.; Hu, H.; Phukpattaranont, P.; Limsakul, C. The Usefulness of Mean and Median Frequencies in Electromyography Analysis. In Computational Intelligence in Electromyography Analysis—A Perspective on Current Applications and Future Challenges; Naik, G.R., Ed.; InTech: Kent, UT, USA, 2012. [Google Scholar] [CrossRef]
- Stulen, F.B.; De Luca, C.J. Frequency Parameters of the Myoelectric Signal as a Measure of Muscle Conduction Velocity. IEEE Trans. Biomed. Eng. 1981, BME-28, 515–523. [Google Scholar] [CrossRef]
- Wijsman, J.; Grundlehner, B.; Penders, J.; Hermens, H. Trapezius muscle EMG as predictor of mental stress. ACM Trans. Embed. Comput. Syst. 2013, 12, 1–20. [Google Scholar] [CrossRef]
- Bedeian, A.G.; Feild, H.S. Assessing Group Change Under Conditions of Anonymity and Overlapping Samples. Nurs. Res. 2002, 51, 63–65. [Google Scholar] [CrossRef] [PubMed]
- Dobrakowski, P.; Blaszkiewicz, M.; Skalski, S. Changes in the Electrical Activity of the Brain in the Alpha and Theta Bands during Prayer and Meditation. Int. J. Environ. Res. Public Health 2020, 17, 9567. [Google Scholar] [CrossRef] [PubMed]
- Berretz, G.; Packheiser, J.; Wolf, O.T.; Ocklenburg, S. Acute stress increases left hemispheric activity measured via changes in frontal alpha asymmetries. iScience 2022, 25, 103841. [Google Scholar] [CrossRef] [PubMed]
- Hinterberger, T.; Schmidt, S.; Kamei, T.; Walach, H. Decreased electrophysiological activity represents the conscious state of emptiness in meditation. Front. Psychol. 2014, 5, 99. [Google Scholar] [CrossRef] [PubMed]
- Vanhollebeke, G.; De Smet, S.; De Raedt, R.; Baeken, C.; Van Mierlo, P.; Vanderhasselt, M.A. The neural correlates of psychosocial stress: A systematic review and meta-analysis of spectral analysis EEG studies. Neurobiol. Stress 2022, 18, 100452. [Google Scholar] [CrossRef] [PubMed]
- Chand, T.; Alizadeh, S.; Jamalabadi, H.; Herrmann, L.; Krylova, M.; Surova, G.; van der Meer, J.; Wagner, G.; Engert, V.; Walter, M. EEG revealed improved vigilance regulation after stress exposure under Nx4—A randomized, placebo-controlled, double-blind, cross-over trial. IBRO Neurosci. Rep. 2021, 11, 175–182. [Google Scholar] [CrossRef]
- Kappel, S.L.; Looney, D.; Mandic, D.P.; Kidmose, P. Physiological artifacts in scalp EEG and ear-EEG. Biomed. Eng. Online 2017, 16, 103. [Google Scholar] [CrossRef]
- Pereira, L.A.; Taylor-Rodríguez, D.; Gutiérrez, L. A Bayesian nonparametric testing procedure for paired samples. Biometrics 2020, 76, 1133–1146. [Google Scholar] [CrossRef]


| Feature | Rest vs. Stress | Stress vs. Med | Med vs. Rest | ||
|---|---|---|---|---|---|
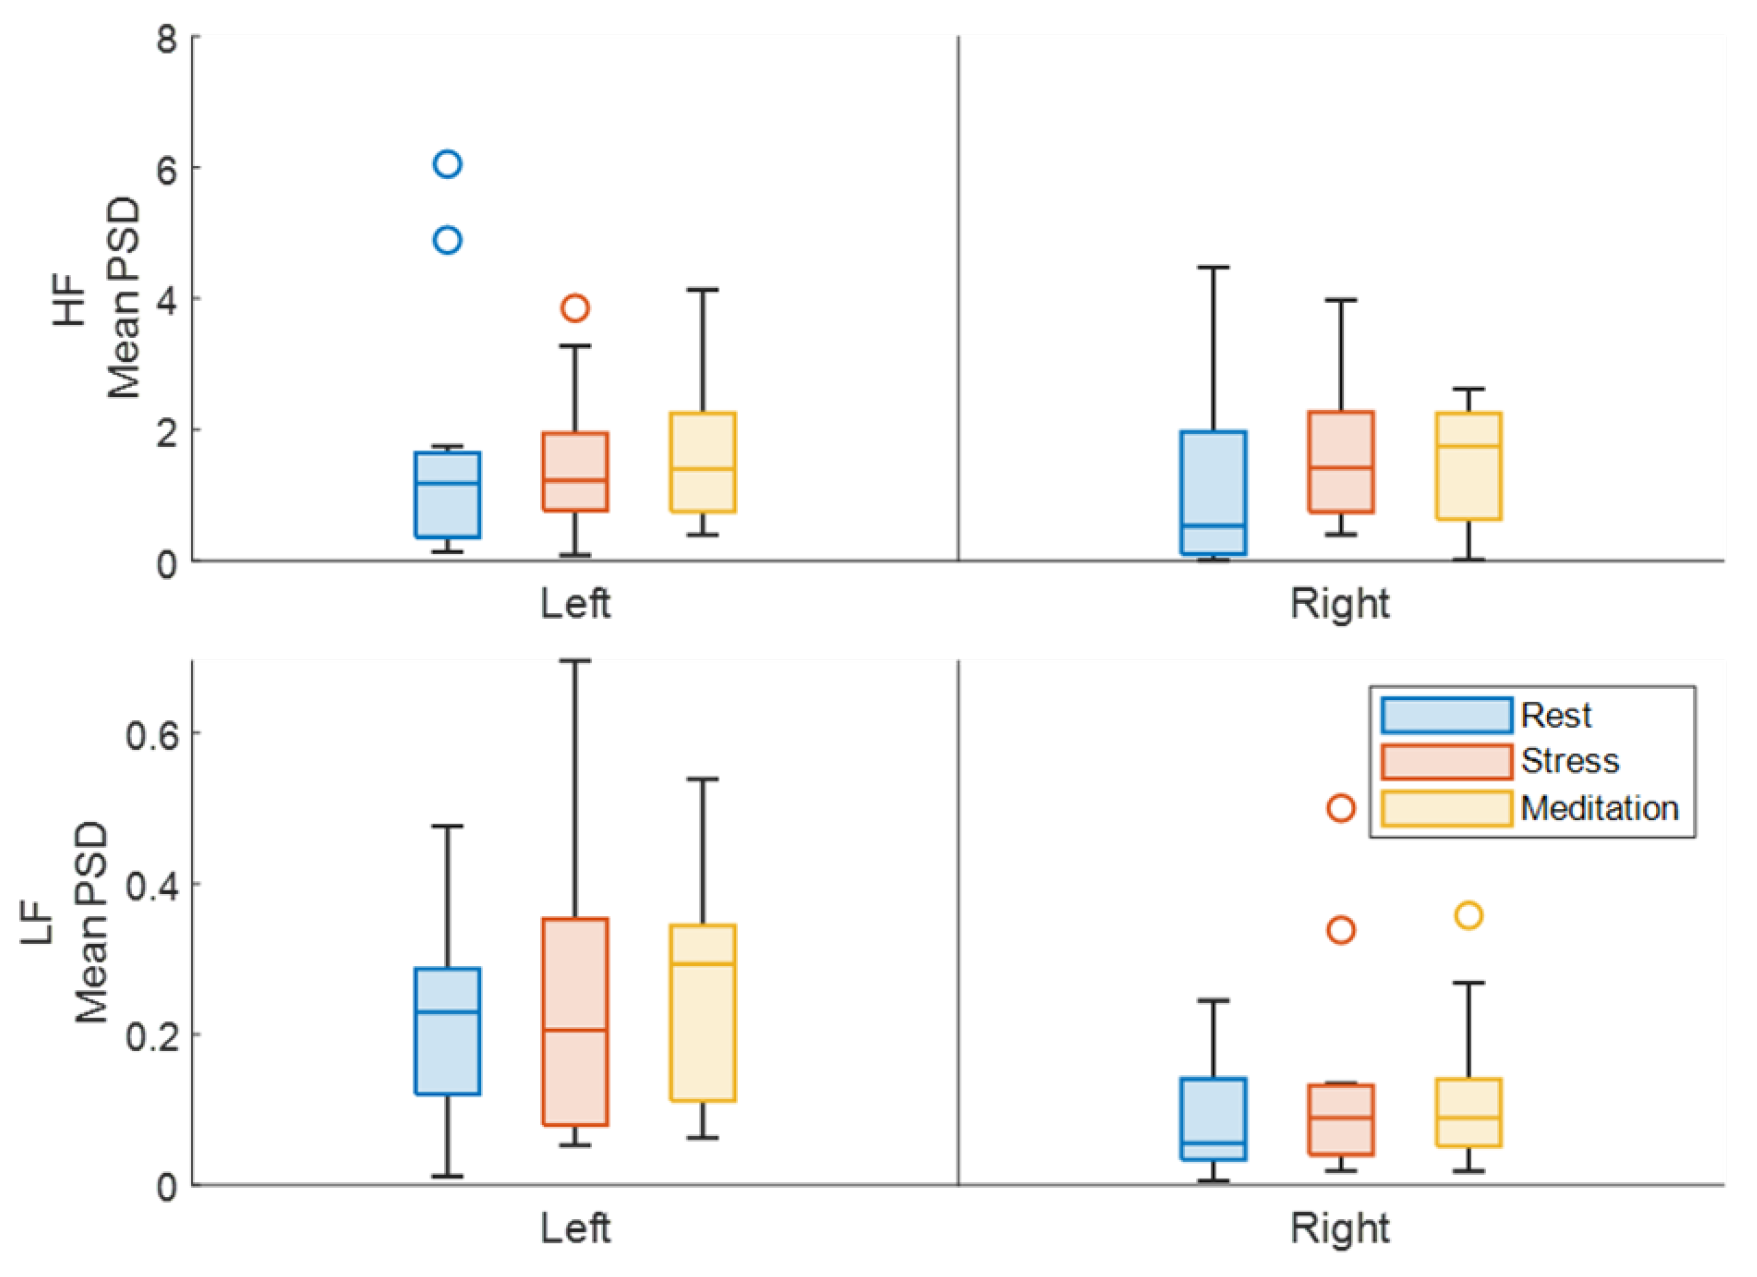
| Left | PSD | LF | 0.5374 | 0.6092 | 0.2199 |
| HF | 0.3201 | 0.3279 | 0.4499 | ||
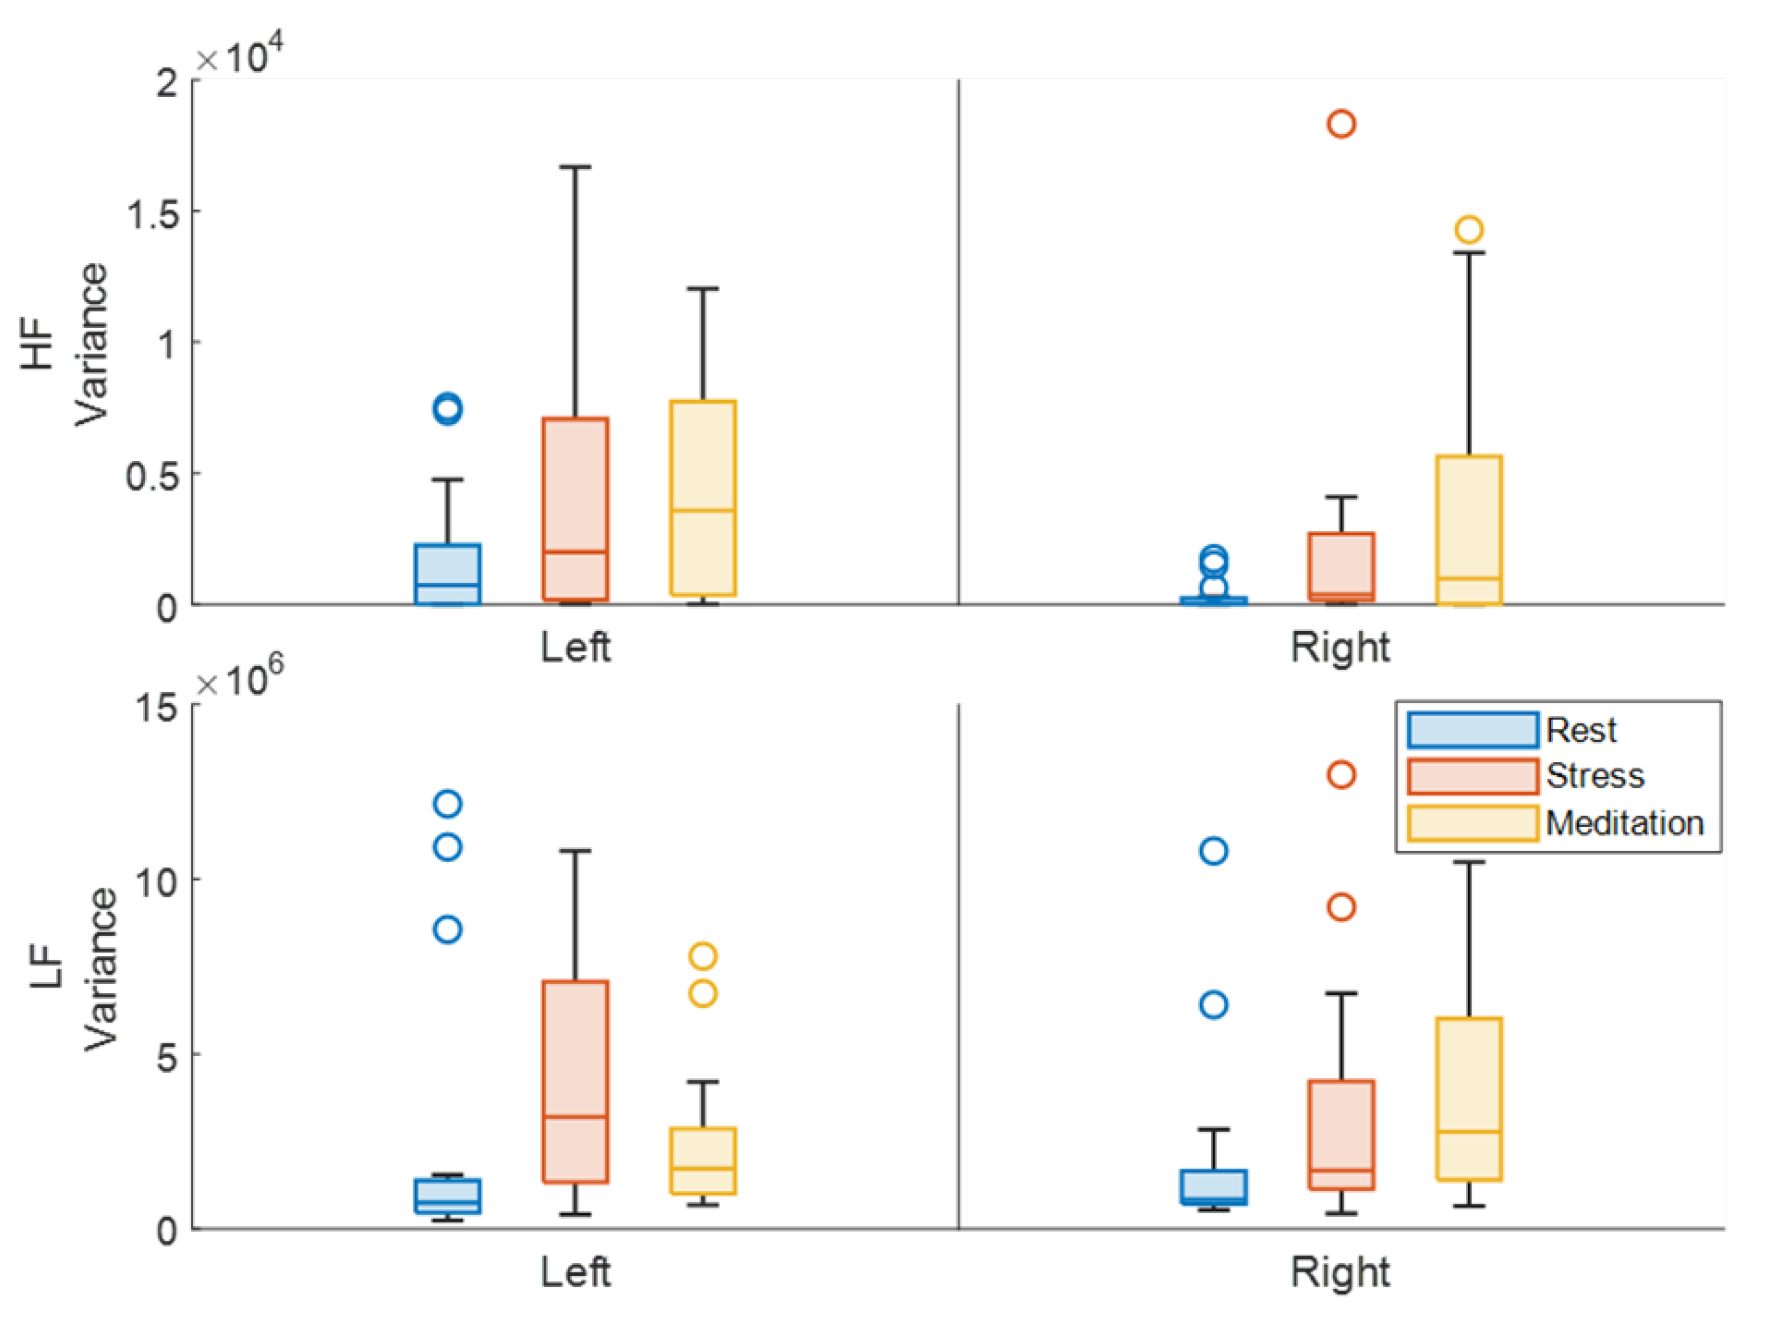
| VAR | LF | 0.0023 * | 0.0355 * | 0.8765 | |
| HF | 0.0910 | 0.7800 | 0.0386 * | ||
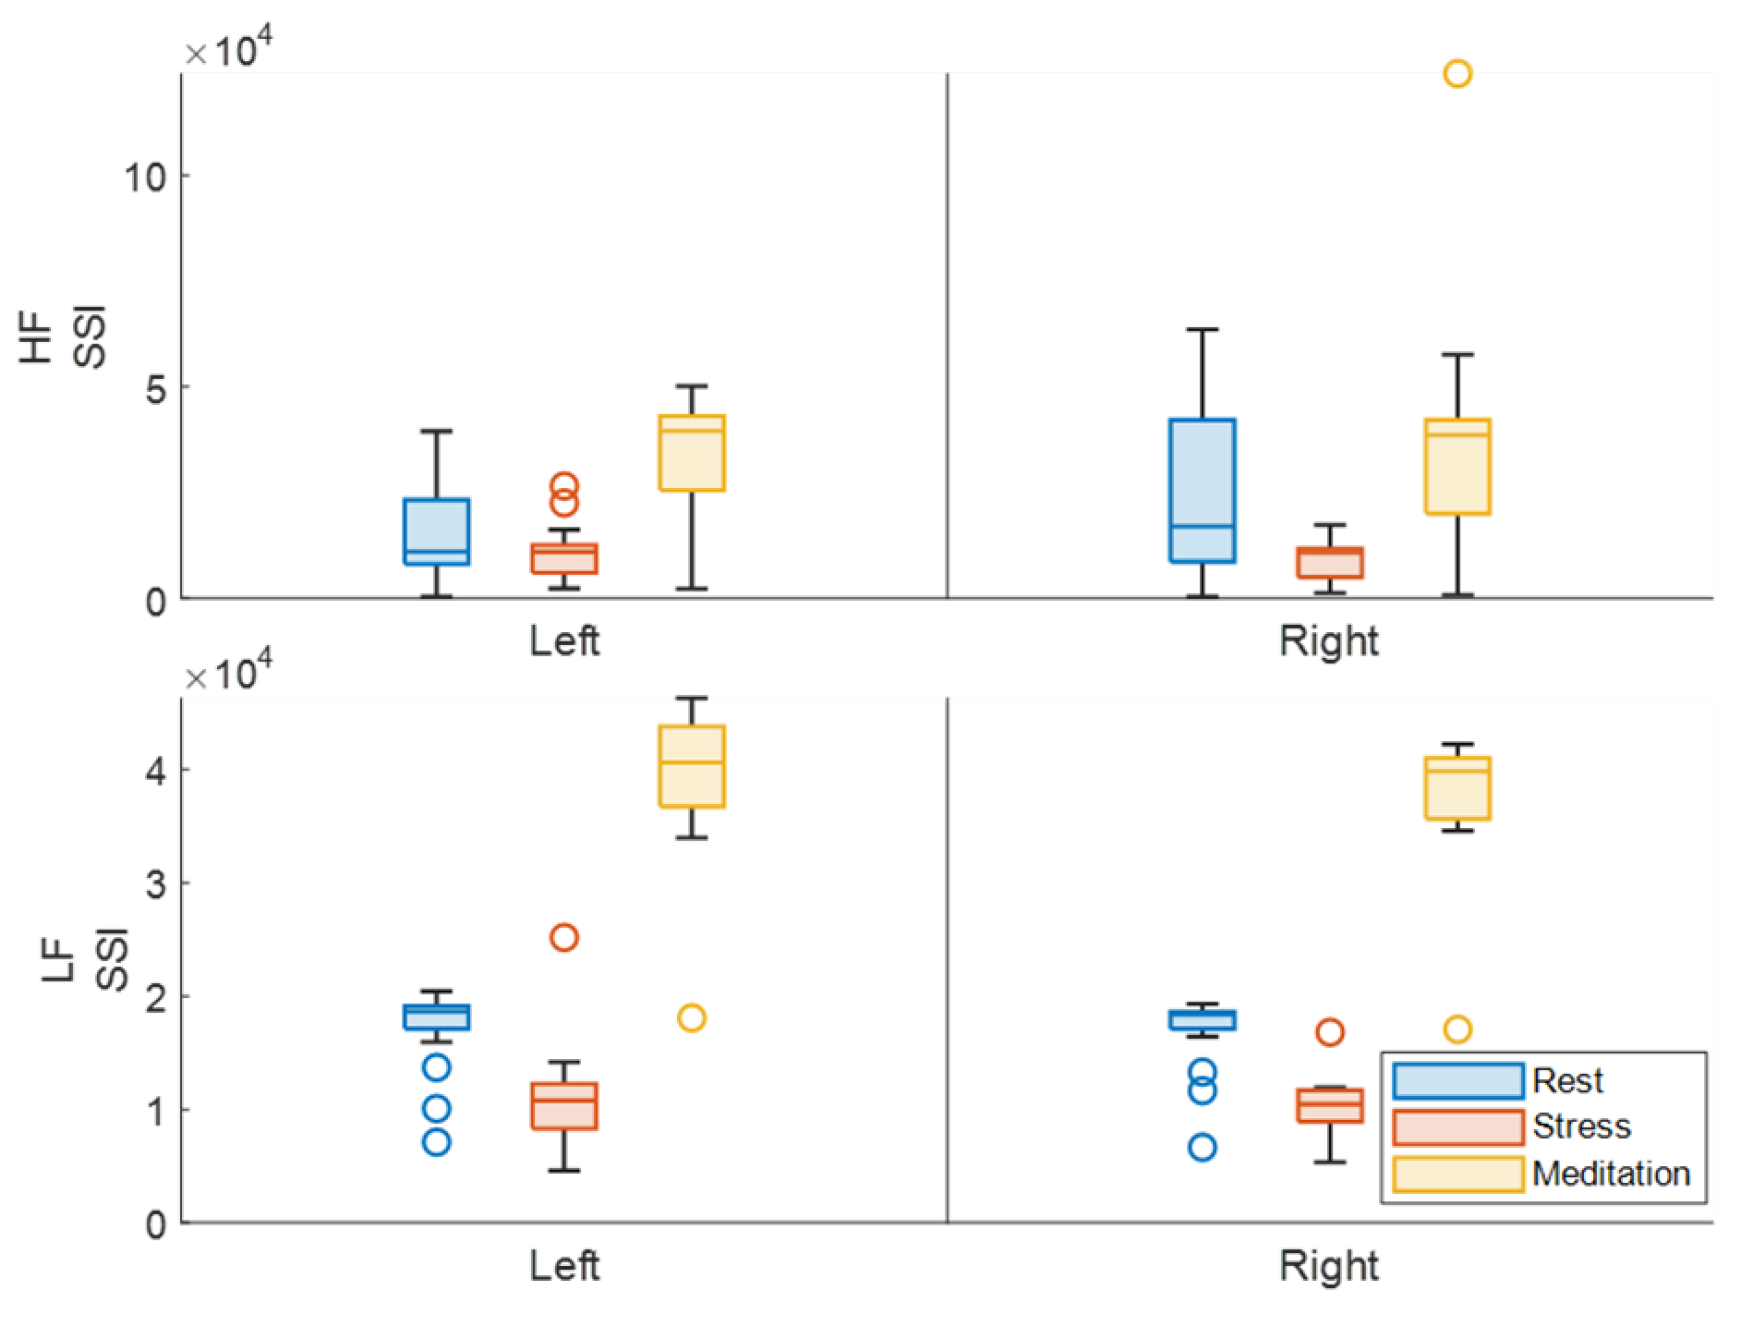
| SSI | LF | 2.3828e-04 * | 6.4430e-12 * | 6.2021e-09 * | |
| HF | 0.1781 | 2.6360e-13 * | 4.0569e-04 * | ||
| MDF | LF | 5.7280e-04 * | 6.0001e-07 * | 3.8382e-04 * | |
| HF | 0.0123 * | 4.9363e-07 * | 0.0075 * | ||
| Right | PSD | LF | 0.1662 | 0.8771 | 0.1926 |
| HF | 0.5023 | 0.4079 | 0.8108 | ||
| VAR | LF | 0.0831 | 0.3113 | 0.0284 * | |
| HF | 0.1246 | 0.8013 | 0.0183 * | ||
| SSI | LF | 4.0402e-06 * | 1.2465e-12 * | 7.5624e-09 * | |
| HF | 0.0157 * | 0.0010 * | 0.0317 * | ||
| MDF | LF | 2.7704e-04 * | 3.4723e-07 * | 1.0251e-04 * | |
| HF | 3.2553e-04 * | 4.3678e-07 * | 1.2133e-04 * | ||
| Asymmetry | LF | 0.8077 | 0.0029 * | 0.0013 * | |
| HF | 0.0172 * | 0.2995 | 0.0946 | ||
Disclaimer/Publisher’s Note: The statements, opinions and data contained in all publications are solely those of the individual author(s) and contributor(s) and not of MDPI and/or the editor(s). MDPI and/or the editor(s) disclaim responsibility for any injury to people or property resulting from any ideas, methods, instructions or products referred to in the content. |
© 2024 by the authors. Licensee MDPI, Basel, Switzerland. This article is an open access article distributed under the terms and conditions of the Creative Commons Attribution (CC BY) license (https://creativecommons.org/licenses/by/4.0/).
Share and Cite
Ahmed, M.; Grillo, M.; Taebi, A.; Kaya, M.; Thibbotuwawa Gamage, P. A Comprehensive Analysis of Trapezius Muscle EMG Activity in Relation to Stress and Meditation. BioMedInformatics 2024, 4, 1047-1058. https://doi.org/10.3390/biomedinformatics4020058
Ahmed M, Grillo M, Taebi A, Kaya M, Thibbotuwawa Gamage P. A Comprehensive Analysis of Trapezius Muscle EMG Activity in Relation to Stress and Meditation. BioMedInformatics. 2024; 4(2):1047-1058. https://doi.org/10.3390/biomedinformatics4020058
Chicago/Turabian StyleAhmed, Mohammad, Michael Grillo, Amirtaha Taebi, Mehmet Kaya, and Peshala Thibbotuwawa Gamage. 2024. "A Comprehensive Analysis of Trapezius Muscle EMG Activity in Relation to Stress and Meditation" BioMedInformatics 4, no. 2: 1047-1058. https://doi.org/10.3390/biomedinformatics4020058
APA StyleAhmed, M., Grillo, M., Taebi, A., Kaya, M., & Thibbotuwawa Gamage, P. (2024). A Comprehensive Analysis of Trapezius Muscle EMG Activity in Relation to Stress and Meditation. BioMedInformatics, 4(2), 1047-1058. https://doi.org/10.3390/biomedinformatics4020058