Article

Improvement of Statistical Models by Considering Correlations among Parameters: Local Anesthetic Agent Simulator for Pharmacological Education

1
Department of Pharmacology, Matsumoto Dental University, 1780 Gobara Hirooka, Shiojiri 399-0781, Nagano, Japan
2
Matsumoto Dental University Hospital, 1780 Gobara Hirooka, Shiojiri 399-0781, Nagano, Japan
*
Author to whom correspondence should be addressed.
BioMedInformatics 2024, 4(4), 2133-2148; https://doi.org/10.3390/biomedinformatics4040114
Submission received: 31 August 2024 / Revised: 12 October 2024 / Accepted: 12 October 2024 / Published: 14 October 2024

Abstract

:
Background: To elucidate the effects of local anesthetic agents (LAs), guinea pigs are used in pharmacological education. Herein, we aimed to develop a simulator for LAs. Previously, we developed a statistical model to simulate the LAs’ effects, and we estimated their parameters (mean [ μ ] and logarithm of standard deviation [ log σ ]) based on the results of animal experiments. The results of the Monte Carlo simulation were similar to those from the animal experiments. However, the drug parameter values widely varied among individuals, because this simulation did not consider correlations among parameters. Method: In this study, we set the correlations among these parameters, and we performed simulations using Monte Carlo simulation. Results: Weakly negative correlations were observed between μ and log σ ( r μ log σ ). In contrast, weakly positive correlations were observed among μ ( r μ ) and among log σ ( r log σ ). In the Monte Carlo simulation, the variability in duration was significant for small r μ log σ values, and the correlation for the duration between two drugs was significant for large r μ and r log σ values. When parameters were generated considering the correlation among the parameters, the correlation of the duration among the drugs became larger. Conclusions: These results suggest that parameter generation considering the correlation among parameters is important to reproduce the results of animal experiments in simulations.

Graphical Abstract

1. Introduction

Local anesthetic agents are used to eliminate pain during surgery. Understanding the relationship between the properties of local anesthetic agents and their effects is clinically important. Local anesthetic agents pass through the cell membrane, block the voltage-gated sodium channels from within the cell, and suppress nerve conduction [1,2]. The important factors that determine the action of local anesthetic agents include the drug’s lipid solubility, protein-binding ability, vasodilator effect, and the presence of vasoconstrictor agents [1,2]. We have been conducting animal experiments in pharmacology training to elucidate these factors. We conducted an experiment to compare and examine the effects of local anesthetic agents by subcutaneously injecting several types of local anesthetic agents into the backs of guinea pigs and measuring the number of reactions when stimulated with a needle.
As animal welfare becomes increasingly important, a corresponding decrease in the number of animals used for experiments is desirable. In identifying animal use alternatives, the 3Rs are an effective strategy: replacement (directly replace or avoid the use of animals), reduction (obtain comparable information levels using fewer animals), and refinement (minimize or eliminate animals’ pain and distress, improving their welfare) [3]. Computer simulations serve as alternatives to animal testing in various areas, including pharmacokinetics [4,5], organ bath systems, and cardiovascular systems (such as the following Strathclyde Pharmacology Simulation packages: OBSim, RatCVS, and Virtual Cat) [6]. While there are numerous commercially available simulators for technical training related to local anesthetics agents, to our knowledge, none specifically target pharmacological effects such as intensity or duration of drug effects. We aimed to develop a simulator for this purpose.
We first set up a model equation using a hierarchical Bayesian model to estimate the effects of local anesthetic agents based on the results obtained in animal experiments, and we estimated the parameter values [7]. The results were obtained by generating random numbers according to the parameter values in the simulation. This method is called Monte Carlo simulation. In pharmacology, Monte Carlo simulations have primarily been used for pharmacokinetic/pharmacodynamic (PK/PD) modeling techniques, especially in population pharmacokinetics, to optimize clinical outcomes through rational dosing strategies [8]. Previous studies have reported its application for antibacterial drugs [9,10,11], antiviral drugs [12,13,14], anticancer drugs [15], and opioids [16]. Moreover, there are several studies examining local anesthetic agents for population pharmacokinetics to determine the maximum recommended dose regimen [17] and for the confirmation of the molecular mechanism of the Na channel [18,19].
In our previous study [7], we adjusted parameter values based on the estimated values obtained, generated random numbers according to the parameter values, and performed Monte Carlo simulations to examine whether the same results as animal experiments could be obtained. We obtained similar results to animal experiments. However, the simulation did not consider the correlation between the durations of each drug, and the parameter values were generated using random numbers, with the correlation coefficients between drugs set to zero. Therefore, even when offset values were included in the model to account for individual differences, there were both drugs with values greater than the mean value and drugs with values less than the mean value within one individual. Thus, the magnitude relationship of the parameter values ( μ 0 ) was reversed between procaine (Pro) and lidocaine (Lid), which have close parameter values, and there were many individuals whose durations were opposite to the original one. However, individuals who tend to respond to one drug are likely to also respond to other drugs in clinical practice. Therefore, the duration of each drug is also correlated, and it is desirable to consider this correlation when creating a simulator.
In this study, we investigated the correlation between parameter values ( μ , log σ ) that determine the distribution of each drug. We performed a simulation using parameter values that considered the correlation among drugs by generating random numbers that followed a multivariate normal distribution, and we examined the correlation in duration among drugs. Moreover, we examined the effects of the correlation coefficient of the parameter values ( μ and log σ ) on the duration correlation. We aimed to create a simulator for local anesthetic agents that will yield results closer to those of animal experiments.

2. Materials and Methods

2.1. Animal Experiments

In this study, we used the drug parameter values estimated by Hierarchical Bayesian models and Hamiltonian Monte Carlo simulations, as reported in our previous study [7]. The data are available on Zenodo (see Supplementary Materials).
The animal experiment method was reproduced as follows: (1) Shave the hair on the back of the guinea pig; (2) Administer 0.1 mL of saline and five drugs, consisting of 1% procaine hydrochloride (Pro), 1% lidocaine hydrochloride (Lid), 1% mepivacaine hydrochloride (Mep), 1% bupivacaine hydrochloride (Bup), and 1% lidocaine hydrochloride, with 1/100,000 adrenaline (Lid + Adr), injected intradermally; (3) Stimulate each papule with a needle six times and count the number of skin contractions (this number was defined as a score ranging between 0 and 6 [maximum]); (4) stimulate at 5 min intervals up to 100 min. When a score of 6 was obtained three times in a row, the stimulation was finished, and that time was defined as the duration.
All of the results from 2019, 2021, and 2022 were used (total number of animals was 51). This experiment was approved by the Animal Management Committee of Matsumoto Dental University (No. 356 in 2019, No. 396 in 2021, and No. 413 in 2022).

2.2. Computer Simulation

2.2.1. Software and Programs Used

We used R (version 4.3.3; The R Foundation) [20] for data analysis. A random number seed value was set to ensure the reproducibility of the simulation. In this study, parameter values and score values were determined using multiple seed values. The programs used in this study are available on Zenodo (see Supplementary Materials).

2.2.2. Drug Parameters

The values estimated by model 1 (param1.csv) of the previous study [7] were used as references for the parameter values of each drug when performing the simulation. This model does not consider individual differences (offset values). According to these parameter values, we generated random numbers following an eight-variate standard normal distribution using Equations (1) and (2), and we set the values of mean ( μ ) and logarithmic standard deviation (SD) ( log σ ) in each drug and individual using Equations (3) and (4), respectively. Random numbers following a multivariate normal distribution were generated using the rmvrorm function of the mvtnorm library [21] in R. The conditions were as follows:
Σ = 1 r 12 r 13 r 14 u 1 0 0 0 r 12 1 r 23 r 24 0 u 2 0 0 r 13 r 23 1 r 34 0 0 u 3 0 r 14 r 24 r 34 1 0 0 0 u 4 u 1 0 0 0 1 s 12 s 13 s 14 0 u 2 0 0 s 12 1 s 23 s 24 0 0 u 3 0 s 13 s 23 1 s 34 0 0 0 u 4 s 14 s 24 s 34 1
X [ k , j ] N 8 ( 0 , Σ )
μ [ i , j ] = μ 0 [ i ] + s μ 0 [ i ] X [ i , j ]
log σ [ i , j ] = log σ 0 [ i ] + log s σ 0 [ i ] X [ i + 4 , j ]
where
Σ is the variance - covariance matrix ;
r is the correlation coefficient of μ among drugs ( r μ ) ;
s is the correlation coefficient of log σ among drugs ( r log σ ) ;
u is the correlation coefficient between μ and log σ in each drug ( r μ log σ ) ;
X are random numbers following an eight - variate standard normal distribution ;
i = 1 , 2 , 3 , 4 ( 1 : Pro , 2 : Lid , 3 : Mep , 4 : Bup ) ;
j = 1 , 2 , , n ( individuals ) ;
k = 1 , 2 , , 8 ( 1 , 5 : Pro ; 2 , 6 : Lid ; 3 , 7 : Mep ; 4 , 8 : Bup ) ;
μ [ i , j ] is the mean distribution in each drug and individual ;
μ 0 [ i ] and s μ 0 [ i ] are the mean and SD of μ [ i , j ] in each drug ;
log σ [ i , j ] is the SD of the distribution of each drug and individual ;
log σ 0 [ i ] and log s σ 0 [ i ] are the mean and SD of log σ [ i , j ] for each drug .

2.2.3. Probability Prediction Curve, Score Value, and Duration

The probability p that responds to a stimulus at time t for each individual was calculated using Equation (5) [7]. The sigmoid curve obtained using this equation was used as the probability prediction curve:
p = 1 Φ 100 1 0.7 × V adr t μ [ i , j ] σ [ i , j ]
where
Φ is the cumulative normal distribution function ;
μ [ i , j ] and σ [ i , j ] are the mean and SD of the drug for each individual , respectively ;
V adr is a dummy variable ;
( 0 when adrenaline is absent , 1 when adrenaline is present ) ;
t is time after administration ( min ) .
Next, the number of responses to the stimuli was obtained. The probability of responding to a stimulus was determined every 5 min from the start of the simulation, and random numbers were generated according to a binomial distribution based on the probability (trial = 6). The obtained value was used as the score value. When a score value of 6 occurred three times in a row, the third time was taken as the duration of the drug.

2.2.4. Comparison of Local Anesthetic Agent Duration between Animal and Simulation Data

A comparison of drug duration between each condition was performed based on a survival analysis. The results up to 100 min were used for animal experiments, and the results up to 180 min were used for the simulations. Anything longer than that was treated as censored data. The analysis was performed using the survfit function of the survival package [22] in R.

2.2.5. Statistical Methods

Peason’s and Spearman’s correlation coefficients were calculated among the parameters and durations. Pearson’s correlation coefficients were calculated for uncensored data (among parameters or among durations). Spearman’s correlation coefficients were calculated for censored data (among durations in animal experiments).
To investigate whether the influence of the value of r μ on the correlation of drug duration differs depending on the value of r log σ , a linear mixed model was used. The objective variable is the correlation coefficient of duration; the fixed effects are r μ , r log σ , and their interaction; and the random effect is a random seed value (categorical variable). Analysis was performed using a random intercept model using the lmer function of the lmerTest package [23], which extends the functionality of the lme4 package [24] in R.

3. Results

3.1. Correlation of Parameter Values of Each Drug in Animal Experiments

We examined the correlation between the parameter values of μ and log σ estimated by model 1 in the animal experiments [7] for each drug. Since we assumed that σ follows a lognormal distribution (that is, log σ follows a normal distribution), we used log σ as a parameter in this study. We identified an individual who was an outlier in Pro (Figure 1A). Pearson’s correlation coefficient between μ and log σ ( r μ log σ ) was 0.42 to 0.01 , which was a negative correlation to no correlation (Table 1).
We created a probability prediction curve using the parameter values for each individual (Figure 1B). In Pro, only one curve was different from the others. Bup had large variations in the horizontal position of the curve and the slope of the curve (Figure 1B).

3.2. Correlation of Parameter Values among Drugs in Animal Experiments

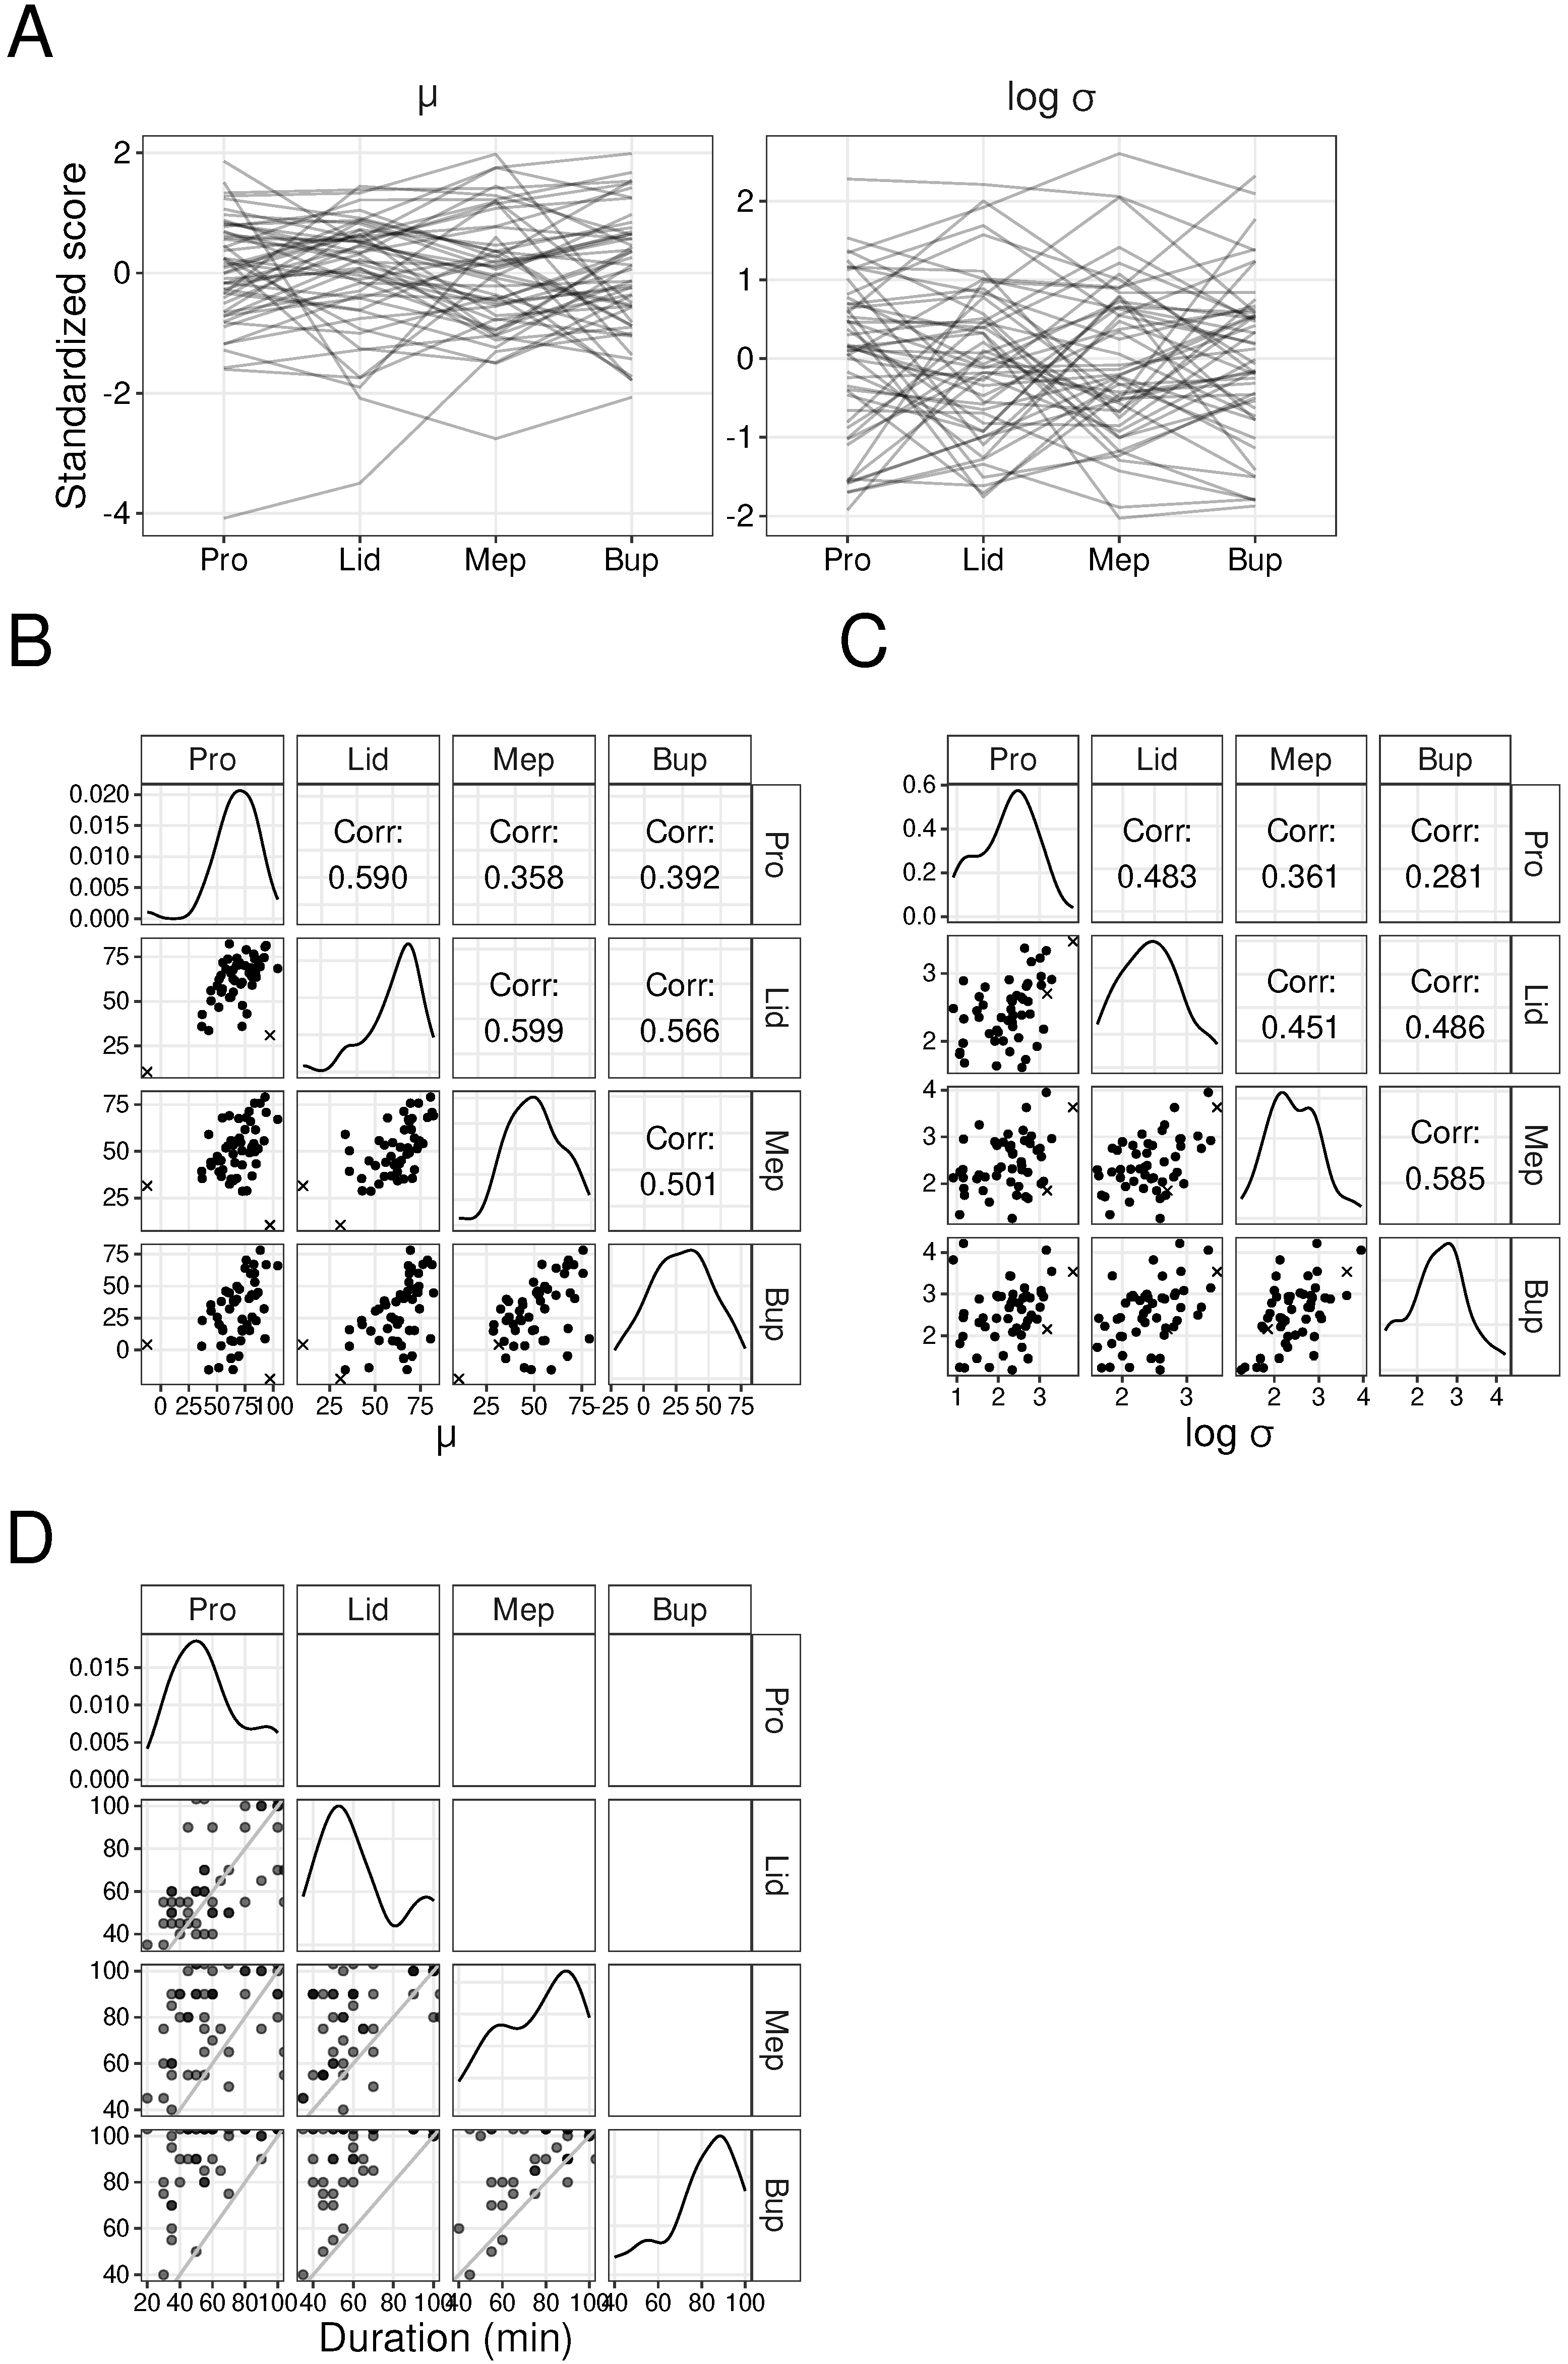
We compared the parameter values ( μ and log σ ) estimated from data obtained in animal experiments among different drugs. Given the variability in the mean values and SDs among these drugs, we calculated a standardized value (normal score) for each parameter. When we created parallel coordinates to examine the relationships between the parameters among the drugs, a tendency for the normal scores of all drugs to be large or small within the same individual was observed, although there was some variation (Figure 2A). These results suggest that there was a positive correlation between parameters among drugs in μ and log σ .
When examining the correlations of the parameter values among the drugs, we observed positive correlations in μ (Figure 2B) and log σ (Figure 2C). Figure 2B shows two values that were outliers from the group. Therefore, we considered individuals with an absolute normal score value of 2 or more as outliers. Table 2 shows the correlation coefficients after excluding outliers. After excluding outliers, r μ was about 0.4 to 0.6, and r log σ was about 0.3 to 0.6, indicating very weak to weak correlations. In addition, r μ log σ went from 0.31 to 0.01 , and the correlation became weaker than before the exclusion (Table 1).
The results of comparing the duration of each drug are shown in Figure 2D. There was a positive correlation in the duration among all the drugs. Due to the presence of censored data, it was inappropriate to calculate Pearson’s correlation coefficient. Therefore, we calculated Spearman’s rank correlation coefficient. Spearman’s rank correlation coefficient was about 0.39 to 0.59 before excluding outliers and about 0.38 to 0.60 after excluding outliers (Supplemental Table S1). These results suggest that there was a positive correlation between the durations among the drugs.

3.3. Effects of Correlation of Drug Parameter Values ( r μ log σ ) in Simulation Experiments

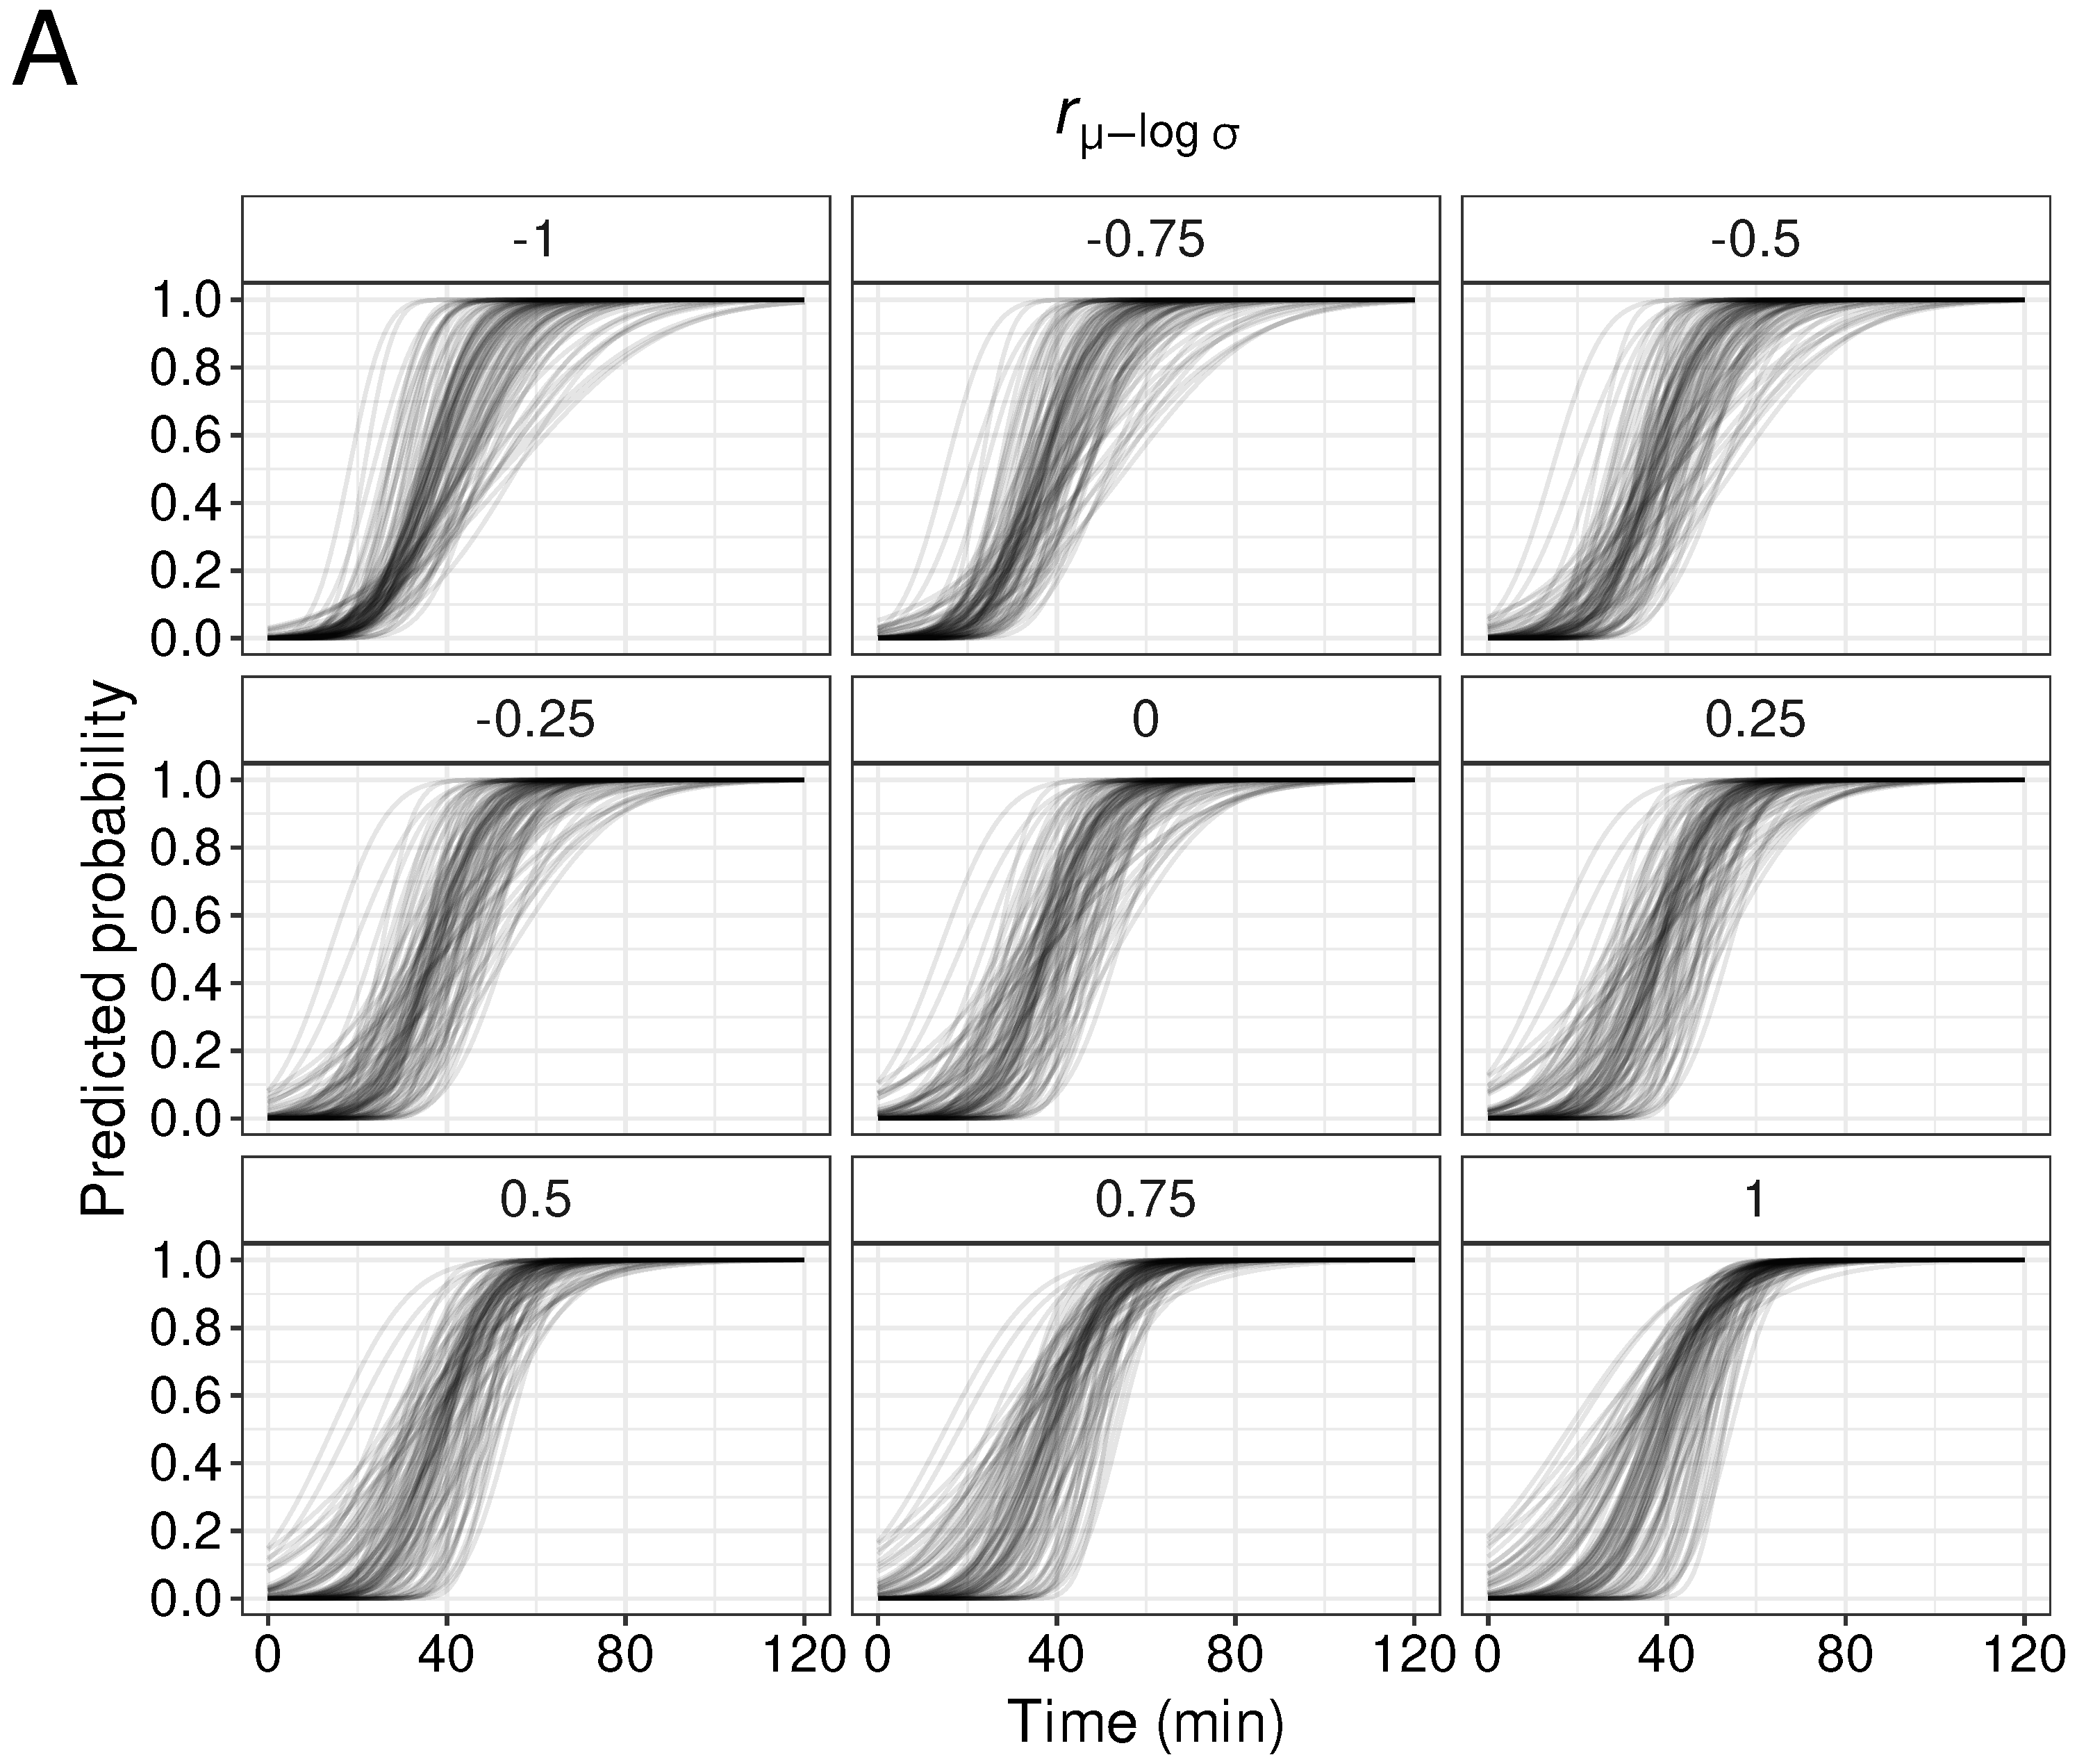
We examined the duration of each drug using Monte Carlo simulations. The drug parameter values ( μ 0 , s μ 0 , log σ 0 , and s log σ 0 ) were set based on the values of our previous study [7]. In addition, r μ log σ were set based on the values without outliers used in Table 1. The values of r μ and r log σ were set based on the values without outliers used in Table 2 (Table 3). First, we investigated the influence of r μ log σ on the shape of the probability prediction curve using the parameter values of Lid. In this simulation, the correlation coefficients among drugs ( r μ and r log σ ) were set to 0. We generated 100 sets of parameter values for each r μ log σ using random numbers, and we created a probability prediction curve. Out of the results obtained using parameter values generated using multiple seed values, the data for one seed value are shown (Figure 3A). When the value of r μ log σ is small, the range of the curve is narrow in the region where the predicted probability is small, and the range of the curve is wide in the region where the predicted probability is large. On the other hand, when the value of r μ log σ is large, the range of the curve is wide in the region where the predicted probability is small, and the range of the curve is narrow in the region where the predicted probability is large.
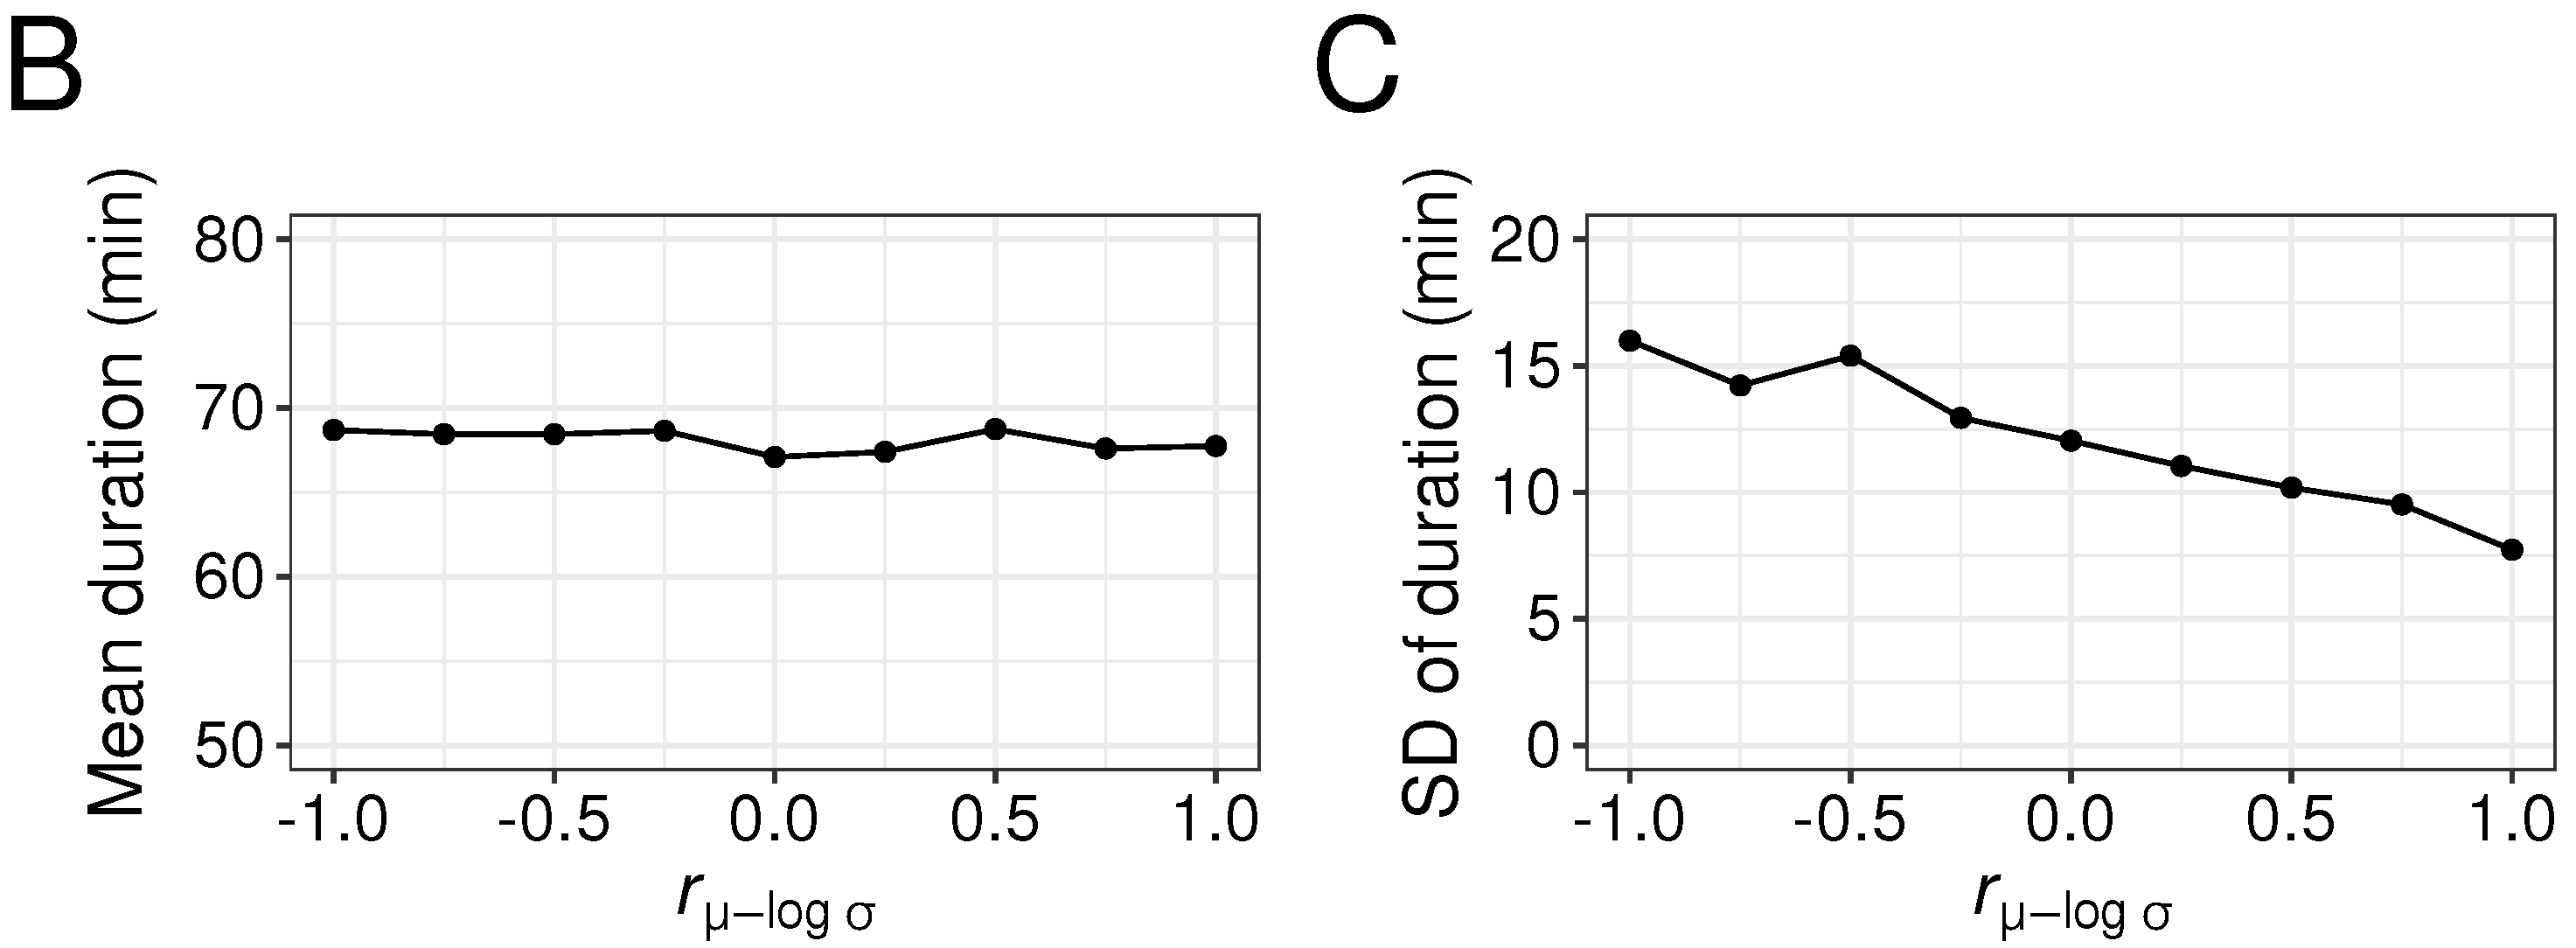
Next, score values were obtained via simulation using the generated parameter values, and the durations of the drugs were calculated. For each r μ log σ , the mean value and SD of 100 sets of durations were calculated. The mean duration was almost constant, regardless of r μ log σ (Figure 3B), but the SD decreased as r μ log σ increased (Figure 3C). These results are consistent with the results shown in Figure 3A. The results of the simulations performed under multiple conditions are shown in Supplementary Figure S1.

3.4. Effects of Correlations between Drug Parameter Values ( r μ and r log σ ) on Generated Parameters

We examined the influence of r μ and r log σ on the correlation of duration using Pro and Lid as representatives. Since both r μ and r log σ showed positive values (Figure 2 and Table 2), we set the values of r μ and r log σ between Pro and Lid to be from 0 to 1, and we obtained the duration via simulation. In this simulation, the r μ log σ value was set to 0. For each combination of r μ and r log σ , we generated 100 sets of parameter values and calculated the duration of Pro and Lid. As the value of r μ and/or r log σ increases, the correlation between durations increases (Figure 4A). The influence of r μ and r log σ was approximately the same under the present conditions (Figure 4B). The results of the simulations performed under multiple conditions are shown in Supplemental Figure S2.
Next, we examined whether the influence of the value of r μ on the duration correlation differed depending on the value of r log σ . Based on the analysis results of a mixed linear model considering the interaction between r μ and r log σ , we found that the influence of the value of r μ did not differ depending on the value of r log σ (term of interaction: t = 0.973 , degree of freedom = 277 , p = 0.331 ) (Supplemental Table S2).

3.5. Effects of Correlation Between Drug Parameter Values ( r μ log σ , r μ and r log σ ) on Duration

Using parameter values estimated from the results of animal experiments, we examined the correlations of the durations between each drug. The parameter value settings are shown in Table 3 and Table 4. We used the parameter values shown in Table 3, but r μ was set to 0 in Condition 1 and Condition 3, and r log σ was set to 0 in Condition 1 and Condition 2. After generating 100 sets of parameter values under each condition, a simulation was performed, and the correlation coefficients of the durations of the drugs were calculated (Figure 5 and Table 4). Similar to the results in Figure 4, when r μ and r log σ are set (Condition 1 and Condition 3), the correlation coefficient of duration among the drugs increases (Table 4). On the other hand, even when r μ log σ is set, the correlation coefficients of the durations are almost the same (Condition 1 vs. Condition 2, and Condition 3 vs. Condition 4), indicating that the influence of r μ log σ was small (Table 4). Spearman’s rank correlation coefficients are shown in Supplementary Table S3, and the results of simulations performed under multiple conditions are shown in Supplementary Figure S3.
Next, we compared the duration of the animal experiment and the simulation. When the median duration and 95% confidence interval of each drug were compared among the conditions, the simulation results for Pro, Lid, and Mep showed values close to the animal experiment results (Table 5). On the other hand, although it was not possible to determine the median value for Bup in the animal experiments, the simulation results showed almost the same value under all the conditions (Table 5). The Kaplan–Meier plots under multiple conditions are shown in Supplemental Figure S4.
In general, the duration of Lid was longer than that of Pro. However, in both animal experiments and simulations, many individuals exhibited a longer duration for Pro compared to Lid. Therefore, we investigated the rate at which numerical reversals were observed in parameter values and durations (Table 6). Among the 51 cases of animal experiments, the cases of Pro > Lid for the μ value, which is the original relationship, was 31 (61%), and Pro < Lid was 20 (39%). In the simulation results, the rate of Pro < Lid was about 30% in Condition 1 and Condition 2, but it was about 20% in Condition 3 and Condition 4 (Table 6). These results suggest that the probability of Pro < Lid decreases by considering the correlation among drugs. Similarly, when comparing the relationships between durations, out of 51 animal experiments, 29 cases (57%) were Pro < Lid, six cases (12%) were Pro = Lid, and 15 cases were Pro > Lid (29%). One case (2%) was impossible to judge because both cases were not completed within the time limit (raw data column in Table 6). In the simulation results, the rate of Pro > Lid was approximately 30% in Condition 1 and Condition 2, 19% in Condition 3, and 30% in Condition 4 (Table 6). These results indicate that the rate of Pro > Lid decreases in duration when considering the correlations among the drugs.

4. Discussion

In this study, we conducted a Monte Carlo simulation that considered the correlation of parameter values among drugs to examine the correlations between durations among drugs within the same individual. Our findings demonstrate that the correlations between parameter values is important.

4.1. The Model Used in This Study

In our previous study [7], we performed simulations using offset values that reflect individual differences. In this study, we performed simulations that considered correlations between parameters instead of offset values. Since these two simulations are performed under different conditions, the results cannot be compared directly. However, the results of this study showed that the correlations among the durations increased when the correlations among the parameters were considered (Figure 5 and Table 4). In the model of the previous study, even if an offset value was used, the variation in the drug parameter values ( μ ) within the same individual became large. On the other hand, in the model that considers the correlations among parameters, the variation in the parameter values within the same individual becomes small. Therefore, we consider that the model of this study better represents the actual situation, and that this model is more suitable for developing a simulator.

4.2. Drug Parameters

First, we will discuss the relationship between parameter values, the shape of the probability curve, and drug duration. According to Equation (5), when the value of μ is small, the probability curve shifts parallel to the right. On the other hand, when the value of log σ is large, the slope of the probability curve becomes small. Since the duration of the drug exists in a time period where the probability is close to 1, the duration becomes longer for small μ values and large log σ values.
Next, we will discuss the effects of r μ log σ , r μ , and r log σ on the duration.

4.2.1. Relationship between Duration and r μ log σ

The values of r μ log σ affect the shape of the probability prediction curve for a single drug. When r μ log σ is positive, both μ and log σ become large, or both become small. Therefore, the curve moves in parallel to the left and the slope becomes small, or the curve moves to the right and the slope becomes large, resulting in the variation in duration and its SD becoming small (Figure 3C). On the other hand, when r μ log σ is negative, the curve moves to the left and the slope becomes large, or the curve moves to the right and the slope becomes small, resulting in the variation in duration and its SD becoming large (Figure 3C). The results of animal experiments showed that the values of r μ log σ were negative, even when two outliers were excluded, indicating a weak negative correlation to no correlation (Table 1). However, since r μ log σ was small (approximately 0.3 in Lid), the effects on the duration were considered to be small.
In addition, the correlation coefficient of the generated parameter values was smaller than the set correlation coefficient ( r μ ) for the simulation (Table 2 and Table 4). It is thought that by generating score values using random numbers, the variation in duration becomes even greater, resulting in the correlation coefficient of duration among drugs becoming smaller.

4.2.2. Relationship between Duration and Parameters ( r μ and r log σ )

The values of r μ and r log σ do not impact a single drug’s duration individually, but they do influence the correlation of duration between two drugs. As μ and log σ directly influence the duration, larger values of r μ and r log σ result in either a longer or shorter duration for both drugs in each individual (Figure 4). This leads to a higher correlation coefficient for duration. In the results of the animal experiments, positive correlations were observed in the parameters (Table 2) and duration (Supplemental Table S1) among the drugs. These findings indicate consistent variations in the duration between drugs within individual subjects.

4.2.3. Significance of Setting the Correlation Coefficient between Parameters

The correlation coefficient of duration becomes larger by setting r μ and r log σ (Condition 1 vs. Condition 3 in Figure 5 and Table 4). The simulation in the previous study [7] was performed under Condition 1, which did not consider the correlation of parameter values among drugs. Therefore, the correlation coefficient of duration was less than 0.2, indicating that no correlation was observed. If a simulator is created under this condition, there will be large variations in the duration among drugs within one individual. On the other hand, in Condition 3 and Condition 4, which considered the correlation of parameter values between drugs, the correlation coefficients of duration were smaller than those of the parameter values. Therefore, by appropriately setting the correlation among parameters, results similar to those of animal experiments are obtained, making it possible to create a more appropriate simulator. However, since the absolute value of r μ log σ is small (maximum 0.3 ) (Table 1), r μ log σ may have little effect on the duration. We found similar correlation coefficients for Condition 3 and Condition 4 (Table 5), suggesting that setting r μ log σ is not essential.
Another advantage is that considering the correlation among parameters increases the rate of obtaining results in the expected order of duration (Table 6). In general, Lid has a longer duration of action than Pro. Therefore, the parameter value of μ is larger for Pro than for Lid. In both Condition 1 and Condition 2, the rates at which the parameter value would be Pro < Lid and the duration would be Pro > Lid were about 30% (Table 6). On the other hand, in Condition 3 and Condition 4, the rate of obtaining a reversal in parameter values and duration decreased to about 20%. These findings are consistent with the results shown in Figure 4. These results underscore the importance of considering the correlation of parameter values. The results of animal experiments showed a higher rate of outcomes contrary to the original expectations compared to the simulations (Table 6). In the animal experiments, the expected duration may not have been achieved due to significant variations in score values resulting from technical errors. Therefore, the rate at which such contradictory results were obtained may be smaller than that observed in this study.

4.3. Limitations of This Study

This study had several limitations. (1) Since this study used the results of animal experiments, it included abnormal data due to failures in experimental procedures such as drug administration and uneven stimulation strength. Therefore, we calculated correlation coefficients without two outliers based on the standardized score values. Nevertheless, there appears to be substantial variation among drugs (Figure 2A). (2) Since the observation time was limited to 100 min in the animal experiments, there were many censored data. Therefore, it was not possible to calculate Pearson’s correlation coefficient of the duration in the animal experiments. Although it is possible to compare correlations based on Spearman’s rank correlation coefficients, there is less information on the strength of the correlation compared to Pearson’s correlation coefficient. (3) In a previous study [7] and in this study, we assumed a simple distribution (normal distribution) for the parameters. Indeed, there may be a statistical distribution that fits better than the normal distribution. However, in general, it is assumed that the distribution of the parameter values follows a normal distribution. Moreover, the simple distribution is desirable to create a simulator considering the parameter generation using random numbers. The goodness of fit of the model and simplicity when creating a simulator are in a trade-off relationship. Here, we prioritized simplicity. (4) This model has not been externally validated. We estimated parameter values using all data in the previous study [7], and we did not examine the validity of the model by splitting the data. Therefore, this model may overfit data from animal experiments. However, the primary purpose in this study was to create a model that obtained results close to animal experiments. Considering this purpose, we think that this overfitting may be less problematic. (5) In this study, parameter values were set based on the results of animal experiments. Therefore, as described in a previous study [7], new animal experiments are required to perform simulations under new conditions (drugs and/or concentrations).

5. Conclusions

In this study, we calculated the correlation coefficients of drug parameter values based on the results of animal experiments. To generate drug parameter values considering their correlations among parameters in simulations, we used random numbers that followed a multivariate normal distribution. As a result, the variation in the drug parameter values within the same individual became small. In addition, the probability that the duration of Pro and Lid were reversed was reduced. Since these results using this model were more closely aligned with animal experiments, we believe that our aims of creating a more accurate simulator were achieved using this model. When designing simulators for other fields, it is crucial to consider the correlation of parameter values within individuals.

Supplementary Materials

The following supporting information can be downloaded at: www.mdpi.com/article/10.3390/biomedinformatics1010000/s1, Table S1: Spearman’s rank correlation coefficients of duration among drugs in animal experiments; Table S2: Analysis by Linear Mixed-Effects Models with interaction; Table S3: Spearman’s rank correlation coefficients on duration among drugs in each condition; Figure S1: Effects of correlation of parameters between μ and log σ on duration of Lid in simulation; Figure S2: Effects of correlation of parameters ( r μ and r log σ ) between Pro and Lid on duration in simulation; Figure S3: Effects of correlation of parameters among drugs on duration in simulation. All results based on multiple seed values are indicated; Figure S4: Survival analysis across all conditions. All results based on multiple seed values are indicated. The data are available from Zenodo (param1.csv and param1_individual.csv in https://doi.org/10.5281/zenodo.10775798). The programs used in this study are available from Zenodo (https://doi.org/10.5281/zenodo.10905849).

Author Contributions

Conceptualization, T.A.; methodology, T.A.; software, T.A. and H.K.; validation, T.A. and H.K.; formal analysis, T.A.; investigation, T.A.; resources, T.A. and H.K.; data curation, H.K.; writing—original draft preparation, T.A.; writing—review and editing, T.A. and H.K.; visualization, T.A. and H.K.; supervision, T.A.; project administration, T.A.; funding acquisition, T.A. All authors have read and agreed to the published version of the manuscript.

Funding

This research was funded by a Scientific Research Special Grant from Matsumoto Dental University.

Institutional Review Board Statement

The animal study protocol was approved by the Committee for Institution Animal Care and Use, Matsumoto Dental University (protocol code No. 356 in 2019, No. 396 in 2021, and No. 413 in 2022).

Informed Consent Statement

Not applicable.

Data Availability Statement

Data are contained within the article and Supplementary Materials.

Acknowledgments

We thank Norio Sogawa (Institution of Oral Science, Matsumoto Dental University) and all students for obtaining the animal data in the practice of pharmacology.

Conflicts of Interest

The authors declare no conflicts of interest.

Abbreviations

The following abbreviations are used in this manuscript:
ProProcaine
LidLidocaine
MepMepivacaine
BupBupivacaine
AdrAdrenaline
SDStandard deviation

References

  1. Brunton, L.; Knollman, B.C. Pharmacological Basis of Therapeutics, 14th ed.; McGraw-Hill Education: New York, NY, USA, 2022. [Google Scholar]
  2. Ritteri, J.; Flower, R.; Henderson, G.; Loke, Y.K.; MacEwan, D.; Rang, H. Rang & Dale’s Pharmacology, 9th ed.; Elsevier: Amsterdam, The Netherlands, 2019. [Google Scholar]
  3. Council, N.R. Guide for the Care and Use of Laboratory Animals, 8th ed.; The National Academies Press: Washington, DC, USA, 2011. [Google Scholar] [CrossRef]
  4. Costanza, R.; Voinov, A. Modeling ecological and economic systems with STELLA: Part III. Ecol. Model. 2001, 143, 1–7. [Google Scholar] [CrossRef]
  5. Borghardt, J.M.; Weber, B.; Staab, A.; Kloft, C. Pharmacometric Models for Characterizing the Pharmacokinetics of Orally Inhaled Drugs. AAPS J. 2015, 14, 853–870. [Google Scholar] [CrossRef] [PubMed]
  6. Dempster, J. Strathclyde Pharmacology Simulations. 2022. Available online: http://spider.science.strath.ac.uk/sipbs/page.php?page=software_sims (accessed on 24 August 2024).
  7. Ara, T.; Kitamura, H. Development of a Predictive Statistical Pharmacological Model for Local Anesthetic Agent Effects with Bayesian Hierarchical Model Parameter Estimation. Medicines 2023, 10, 61. [Google Scholar] [CrossRef] [PubMed]
  8. Chua, H.C.; Tam, V.H. Optimizing Clinical Outcomes through Rational Dosing Strategies: Roles of Pharmacokinetic/Pharmacodynamic Modeling Tools. Open Forum Infect. Dis. 2022, 9, ofac626. [Google Scholar] [CrossRef] [PubMed]
  9. Wang, H.; Chen, C.; Chen, X.; Zhang, J.; Liu, Y.; Li, X. PK/PD Modeling to Assess Rifaximin Clinical Dosage in a Mouse Model of Staphylococcus aureus-Induced Mastitis. Front. Vet. Sci. 2021, 8, 651369. [Google Scholar] [CrossRef] [PubMed]
  10. Fukumoto, S.; Ohbayashi, M.; Okada, A.; Kohyama, N.; Tamatsukuri, T.; Inoue, H.; Kato, A.; Kotani, T.; Sagara, H.; Dohi, K.; et al. Population Pharmacokinetic Model and Dosing Simulation of Meropenem Using Measured Creatinine Clearance for Patients with Sepsis. Ther. Drug Monit. 2023, 45, 392–399. [Google Scholar] [CrossRef] [PubMed]
  11. Kusumoto, M.; Motegi, T.; Uno, H.; Yokono, M.; Harada, K. Pharmacokinetic-pharmacodynamic analysis of cefmetazole against extended-spectrum β-lactamase-producing Enterobacteriaceae in dogs using Monte Carlo Simulation. Front. Vet. Sci. 2023, 10, 1270137. [Google Scholar] [CrossRef] [PubMed]
  12. Drusano, G.L.; D’Argenio, D.Z.; Preston, S.L.; Barone, C.; Symonds, W.; LaFon, S.; Rogers, M.; Prince, W.; Bye, A.; Bilello, J.A. Use of Drug Effect Interaction Modeling with Monte Carlo Simulation to Examine the Impact of Dosing Interval on the Projected Antiviral Activity of the Combination of Abacavir and Amprenavir. Antimicrob. Agents Chemother. 2000, 44, 1655–1659. [Google Scholar] [CrossRef] [PubMed]
  13. Sale, M.; Sadler, B.M.; Stein, D.S. Pharmacokinetic Modeling and Simulations of Interaction of Amprenavir and Ritonavir. Antimicrob. Agents Chemother. 2002, 46, 746–754. [Google Scholar] [CrossRef] [PubMed]
  14. Francis, J.; Barnes, K.I.; Workman, L.; Kredo, T.; Vestergaard, L.S.; Hoglund, R.M.; Byakika-Kibwika, P.; Lamorde, M.; Walimbwa, S.I.; Chijioke-Nwauche, I.; et al. An Individual Participant Data Population Pharmacokinetic Meta-analysis of Drug-Drug Interactions between Lumefantrine and Commonly Used Antiretroviral Treatment. Antimicrob. Agents Chemother. 2020, 64, e02394-19. [Google Scholar] [CrossRef] [PubMed]
  15. Gallo, J.M.; Vicini, P.; Orlansky, A.; Li, S.; Zhou, F.; Ma, J.; Pulfer, S.; Bookman, M.A.; Guo, P. Pharmacokinetic Model-Predicted Anticancer Drug Concentrations in Human Tumors. Clin. Cancer Res. 2004, 10, 8048–8058. [Google Scholar] [CrossRef] [PubMed]
  16. Chetty, M.; Kenworthy, J.J.; Langham, S.; Walker, A.; Dunlop, W.C.N. A systematic review of health economic models of opioid agonist therapies in maintenance treatment of non-prescription opioid dependence. Addict. Sci. Clin. Pract. 2017, 12, 6. [Google Scholar] [CrossRef] [PubMed]
  17. Cazaubon, Y.; Mauprivez, C.; Feliu, C.; Binet, L.; Oget, O.; Gozalo, C.; Djerada, Z. Population pharmacokinetics of articaine with 1:200,000 epinephrine during third molar surgery and simulation of high-dose regimens. Eur. J. Pharm. Sci. 2018, 114, 38–45. [Google Scholar] [CrossRef] [PubMed]
  18. Zeberg, H.; Nilsson, J.; Århem, P. The Importance of the Dissociation Rate in Ion Channel Blocking. Front. Cell. Neurosci. 2018, 12, 33. [Google Scholar] [CrossRef] [PubMed]
  19. Karoly, R.; Lenkey, N.; Juhasz, A.O.; Vizi, E.S.; Mike, A. Fast- or Slow-inactivated State Preference of Na+ Channel Inhibitors: A Simulation and Experimental Study. PLoS Comput. Biol. 2010, 6, e1000818. [Google Scholar] [CrossRef] [PubMed]
  20. R Core Team. R: A Language and Environment for Statistical Computing; R Foundation for Statistical Computing: Vienna, Austria, 2024. [Google Scholar]
  21. Genz, A.; Bretz, F. Computation of Multivariate Normal and t Probabilities; Lecture Notes in Statistics; Springer: Heidelberg, Germany, 2009. [Google Scholar]
  22. Therneau, T.M. A Package for Survival Analysis in R; R Package Version 3.7-0; R Foundation for Statistical Computing: Vienna, Austria, 2024. [Google Scholar]
  23. Kuznetsova, A.; Brockhoff, P.B.; Christensen, R.H.B. lmerTest Package: Tests in Linear Mixed Effects Models. J. Stat. Softw. 2017, 82, 1–26. [Google Scholar] [CrossRef]
  24. Bates, D.; Mächler, M.; Bolker, B.; Walker, S. Fitting Linear Mixed-Effects Models Using lme4. J. Stat. Softw. 2015, 67, 1–48. [Google Scholar] [CrossRef]
Figure 1. Correlation of parameters between μ and log σ in animal experiments. (A) scatter plot of μ and log σ in each drug, and (B) predicted probability curve in each drug and individual.
Biomedinformatics 04 00114 g001
Figure 2. Correlation of parameters and duration among drugs in animal experiments. (A) Parallel coordinates of standardized score of parameters ( μ and log σ ). Each line indicates the data of each individual. (B,C) Scatter plot and Pearson’s correlation coefficients of μ (B) and log σ (C). × indicates individuals with the absolute value of standardized score greater than 2. (D) Scatter plot of duration. Density plot of parameters and duration are also shown in (BD).
Biomedinformatics 04 00114 g002
Figure 3. Effects of correlations of parameters between μ and log σ on duration of Lid in simulations. (A) Probability prediction curve based on generated parameters ( μ and log σ ) for various r μ log σ values. (B,C) Mean (B) and SD (C) of duration generated using computer simulations for various r μ log σ values.
Biomedinformatics 04 00114 g003aBiomedinformatics 04 00114 g003b
Figure 4. Effects of correlation between ( r μ and r log σ ) between Pro and Lid on duration in simulations. (A) Relation of durations between Pro and Lid. (B) Correlation coefficients of duration for several parameters. In these experiments, r μ log σ was set to 0.
Biomedinformatics 04 00114 g004
Figure 5. Effects of correlations between parameters among drugs on duration in simulations. The values of r μ log σ , r μ and r log σ are shown in Table 4.
Biomedinformatics 04 00114 g005
Table 1. Correlation coefficients between μ and log σ ( r μ log σ ).
DrugAll Data ( n = 51 )Without Outliers ( n = 49 )
Pro−0.308−0.219
Lid−0.415−0.301
Mep0.0120.014
Bup−0.154−0.160
Table 2. Correlation coefficients of μ ( r μ ) and log σ ( r log σ ) among drugs.
All Data ( n = 51 )Without Outliers ( n = 49 )
Combination r μ r log σ r μ r log σ
Pro–Lid0.5900.4830.5680.416
Pro–Mep0.3580.3610.4670.336
Pro–Bup0.3920.2810.4980.257
Lid–Mep0.5990.4510.5260.414
Lid–Bup0.5660.4860.5270.466
Mep–Bup0.5010.5850.4200.559
Table 3. Parameters used in the following simulations.
Drug μ 0 s μ 0 log σ 0 s log σ 0 r μ log σ Combination r μ r log σ
Pro68102.20.4−0.22Pro–Lid0.570.42
Lid6172.40.4−0.30Pro–Mep0.470.34
Mep5072.40.4−0.01Pro–Bup0.500.26
Bup30132.50.5−0.16Lid–Mep0.530.41
Lid–Bup0.530.47
Mep–Bup0.420.56
Table 4. Effects of correlation coefficients of parameters on drug durations. (Upper rows) r μ log σ , r μ , and r log σ are the values set for the simulation. (Lower rows) Correlation coefficients of durations among the drugs in Figure 5.
Condition 1Condition 2Condition 3Condition 4
r μ log σ 0*0*
r μ and r log σ 00**
Pro–Lid0.2230.2570.5830.470
Pro–Mep−0.009−0.0340.2260.310
Pro–Bup0.0920.0880.4600.384
Lid–Mep−0.0460.0090.2730.216
Lid–Bup−0.0420.0390.4620.407
Mep–Bup−0.013−0.1220.3700.327
* Parameters in Table 3 were used.
Table 5. Comparison of duration of local anesthetic agents under each condition.
DrugConditionnEventsMedian [95% CI]
ProRaw data514855.0 [50.0, 65.0]
Condition 110010057.5 [55.0, 60.0]
Condition 210010055.0 [55.0, 60.0]
Condition 310010055.0 [55.0, 60.0]
Condition 410010055.0 [55.0, 60.0]
LidRaw data514760.0 [55.0, 70.0]
Condition 110010065.0 [65.0, 70.0]
Condition 210010065.0 [65.0, 70.0]
Condition 310010070.0 [65.0, 70.0]
Condition 410010065.0 [65.0, 70.0]
MepRaw data514585.0 [75.0, 90.0]
Condition 110010080.0 [80.0, 80.0]
Condition 210010080.0 [75.0, 85.0]
Condition 310010080.0 [80.0, 85.0]
Condition 410010080.0 [75.0, 85.0]
BupRaw data5125– [90.0, –]
Condition 1100100105.0 [100.0, 105.0]
Condition 2100100100.0 [100.0, 105.0]
Condition 3100100100.0 [100.0, 110.0]
Condition 4100100102.5 [100.0, 105.0]
Lid + AdrRaw data518– [–, –]
Condition 110035– [–, –]
Condition 210038– [–, –]
Condition 310038– [–, –]
Condition 410042– [180.0, –]
Table 6. Comparison of parameter ( μ ) and duration between Pro and Lid.
ComparisonRaw DataCondition 1Condition 2Condition 3Condition 4
ParameterPro > Lid31 (60.8%)69 (69.0%)73 (73.0%)79 (79.0%)80 (80.0%)
Pro < Lid20 (39.2%)31 (31.0%)27 (27.0%)21 (21.0%)20 (20.0%)
DurationPro < Lid29 (56.9%)68 (68.0%)67 (67.0%)75 (75.0%)70 (70.0%)
Pro = Lid6 (11.8%)5 (5.0%)4 (4.0%)9 (9.0%)11 (11.0%)
Pro > Lid15 (29.4%)27 (27.0%)29 (29.0%)16 (16.0%)19 (19.0%)
both censored1 (2.0%)
Disclaimer/Publisher’s Note: The statements, opinions and data contained in all publications are solely those of the individual author(s) and contributor(s) and not of MDPI and/or the editor(s). MDPI and/or the editor(s) disclaim responsibility for any injury to people or property resulting from any ideas, methods, instructions or products referred to in the content.