Article

ViBEx: A Visualization Tool for Gene Expression Analysis

by
Michael H. Terrefortes-Rosado
,
Andrea V. Nieves-Rivera
,
Humberto Ortiz-Zuazaga
and
Marie Lluberes-Contreras
*
Department of Computer Science, University of Puerto Rico, San Juan, PR 00925, USA
*
Author to whom correspondence should be addressed.
BioMedInformatics 2025, 5(1), 13; https://doi.org/10.3390/biomedinformatics5010013
Submission received: 6 January 2025 / Revised: 31 January 2025 / Accepted: 11 February 2025 / Published: 7 March 2025
(This article belongs to the Special Issue Editor's Choices Series for Methods in Biomedical Informatics Section)

Abstract

:
Background: Variations in the states of Gene Regulatory Networks significantly influence disease outcomes and drug development. Boolean Networks serve as a tool to conceptualize and understand the complex relationships between genes. Threshold computation methods are used for the binarization of gene expression and the Boolean representation of its Gene Regulatory Network. This study aims to provide a platform that facilitates the exploration of the impact of different threshold computation methods on the binarization of gene expression and the subsequent Boolean representation of Gene Regulatory Networks. Methods: Threshold computation methods are implemented for binarizing gene expression, enabling the Boolean representation of the Gene Regulatory Networks. Variations in gene expression discretization and threshold computation methods often lead to differing Boolean representations, which may affect the subsequent analysis. Lluberes proposed a framework for analyzing gene expression when binarization varies based on these factors. This theoretical framework was implemented using the Python Dash framework. Results: A visualization tool has been developed to implement this framework. The tool allows users to upload gene expression datasets and interact with a dashboard to explore gene expression binarization and the inferred Boolean Networks. Conclusions: The developed visualization tool provides a platform that facilitates the exploration of how different binarization methods impact the interpretation of Gene Regulatory Networks, offering insights for disease research and drug development.

1. Introduction

Gene expression activity can be measured through the quantification of mRNA. Variations in the concentration of gene expression can be stored in a time series vector or array of real numbers. We can map these continuous measurements into discrete values 0 and 1, representing not expressed and expressed, respectively. Each binary state can tell us if the gene is present at a different time in the series of measurements. We call this process binarization of the gene expression states.
The binarizations are obtained using threshold computation methods (TCMs). In this project, we use four methods to analyze and binarize gene expression; these methods compute the threshold value differently. K-Means [1] is a clustering algorithm that assigns each data point to K centroids using the Euclidean distance. We use 2-means to classify each time expression value. Hopfensitz [2] proposed Binarization Across Multiple Scales, BASC A, which is a step function and discontinuity-based binarization. Sahoo [3] introduced Stepminer, which minimizes the square error in a binary regression. Lastly, Shmulevich [4] proposed a method that searches for the largest step function to binarize gene expression.
Regardless of the efficacy of each individual method, the resulting threshold values are usually different. This is illustrated in Figure 1a; the red line represents the gene expression time series and the horizontal lines are the threshold values returned by each method. Because different thresholds may produce different binarization, this introduces uncertainty in binarization due to model selection [5].
Changes in the size of the time series may also introduce uncertainty. Each interpolation may return a different threshold value, regardless of the computation method. This is referred to as discretization uncertainty [5] and is illustrated in Figure 1b. The increase in the sample size of the gene expression has an impact on the threshold values. As the figure shows, the threshold values, represented as horizontal lines, change with different sample sizes under the same estimation method. Table A1 shows the gene expression used for gene DDR1.
Interpolating gene expression allows for observation of the different threshold values produced by a method. These shifts in threshold values can be referred to as displacements of the threshold. These displacements may be integrated into the computation of binary states for gene expression, labeling the states that fall inside the displacement area as undecided. Then, a voting mechanism is used for value imputation of these undecided states [7].

1.1. Probabilistic Framework for Gene Expression Analysis

The framework introduced by Lluberes [8] uses a gene expression matrix and a set of threshold methods as an input. Then, two algorithms are used to extract information from gene expression. In the first algorithm, the states of each binarization of gene expression are computed using the set of methods. Then, the elected states are obtained using a majority vote. In case of a tie or conflict with the dogma, the state is marked as undecided and labeled with a question mark “?”. The second algorithm in the framework creates a probabilistic approach to analyze the binarization states for gene expression. Finally, post-processing integrates the binarizations and statistical data. For details pertaining to the framework on which this tool is built upon, including an analysis and thorough explanation of the TCM, algorithms, voting mechanism, and probabilistic analysis, the reader is referred to [7]. The goal of this tool is the implementation of this framework for the analysis of gene expression as a visualization application. In addition to the analysis of gene expression, the application is meant to provide scientists with an eagle-eye view of the resulting Boolean Networks.

1.2. Boolean Networks and Gene Regulatory Networks

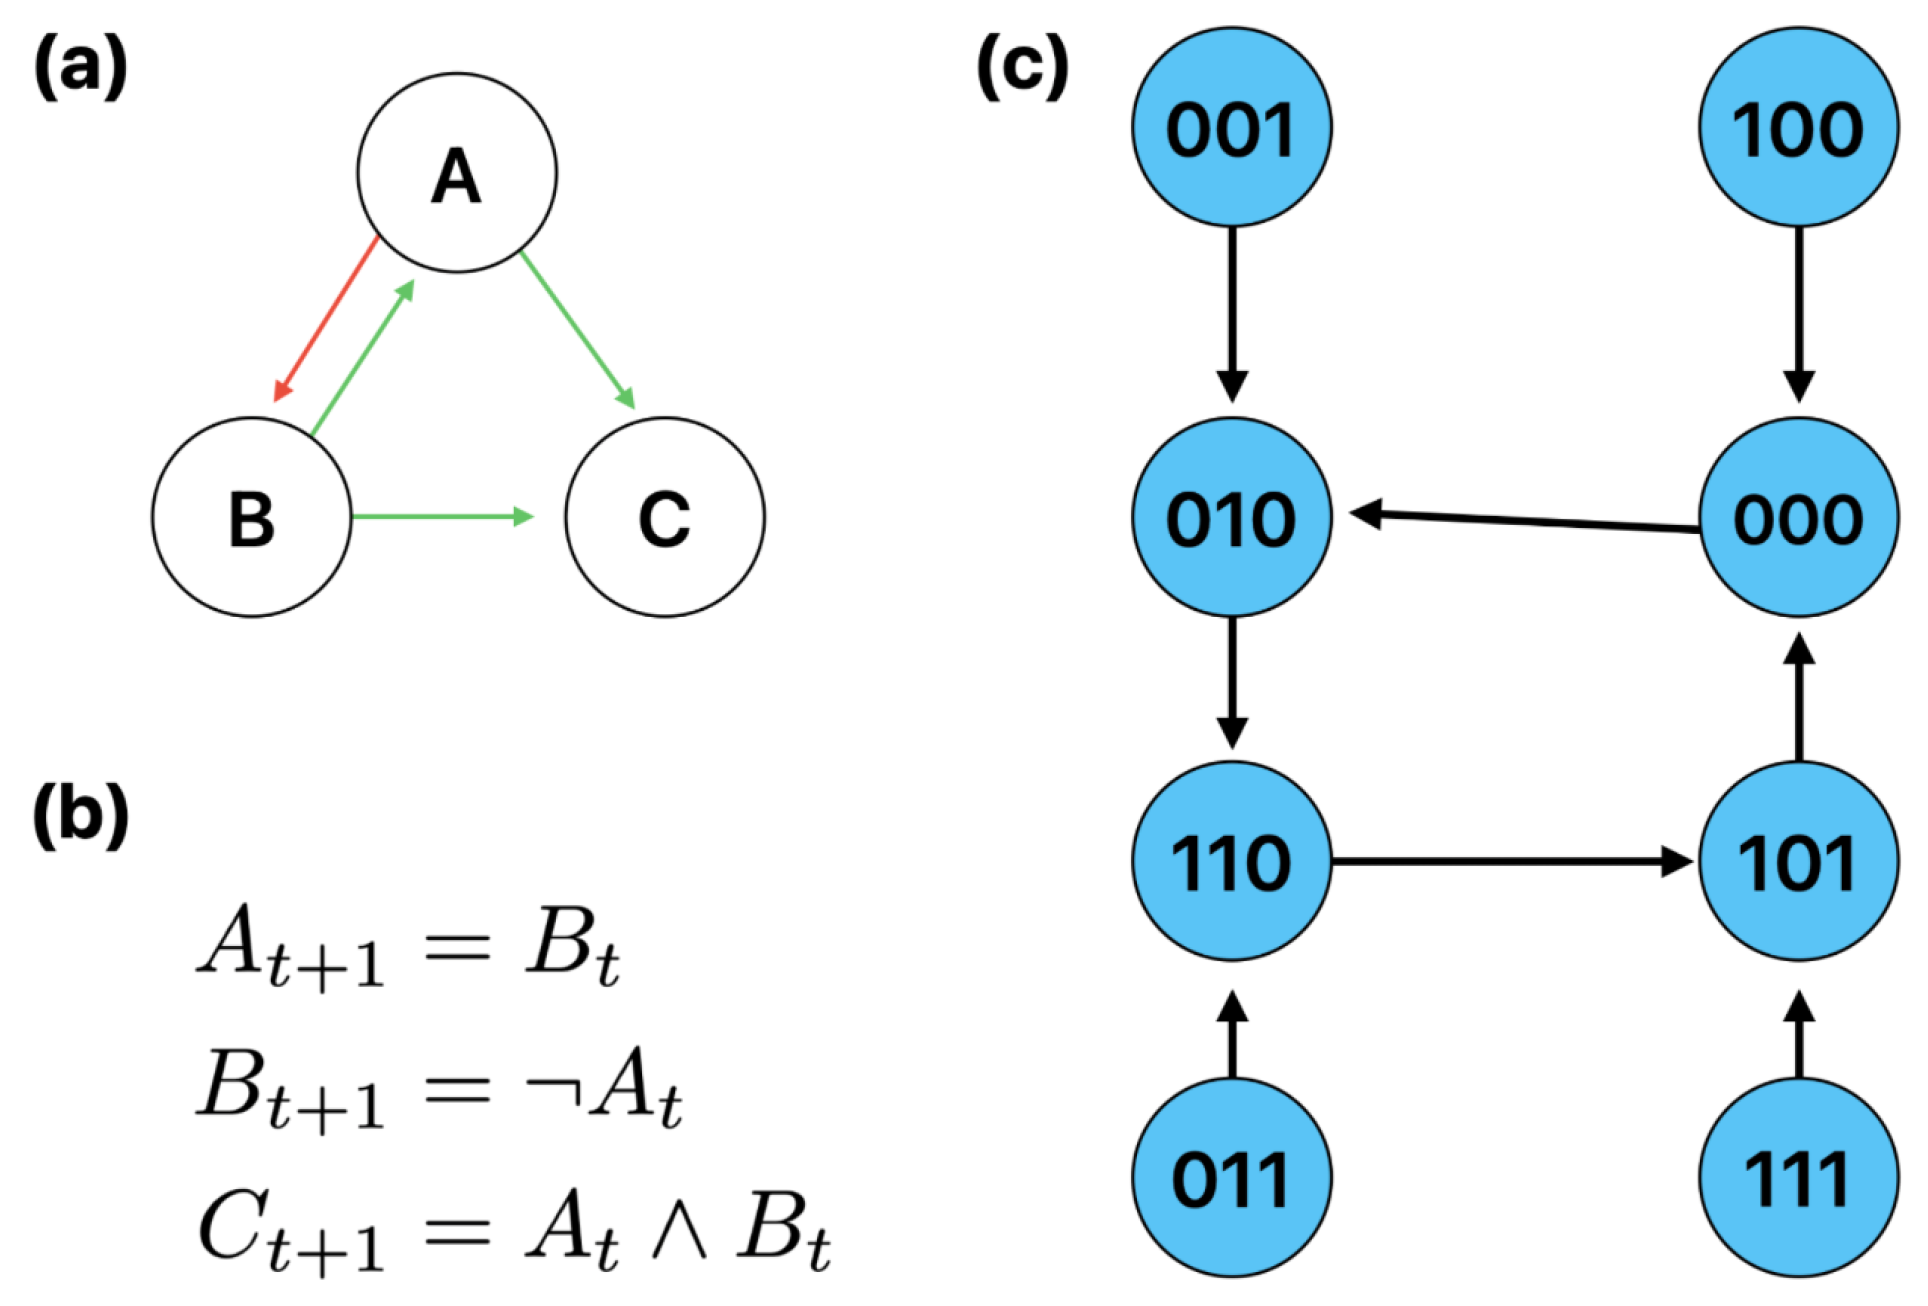
Boolean Networks (BNs) are defined as G(V,F), where V is a set of nodes and F a set of functions between them. Shmulevich [9] explains that in the context of Gene Regulatory Networks (GRNs), V is a set of genes and F the relationships between them that result in expression or suppression. Each gene is represented by a binary variable whose value at a certain time explains the current state of the gene, either expressed (1) or not expressed (0). Boolean functions can be inferred from the GRN; these functions explain the behavior and interactions between genes in the GRN. Using these Boolean functions, the next state of each gene can be determined, providing a BN representation of the GRN. Given n number of genes, the Boolean Network has 2 n nodes, where each node represents the states of all genes at a given time. This can be seen in Figure 2.

2. Materials and Methods

2.1. Dash Framework and Application Structure

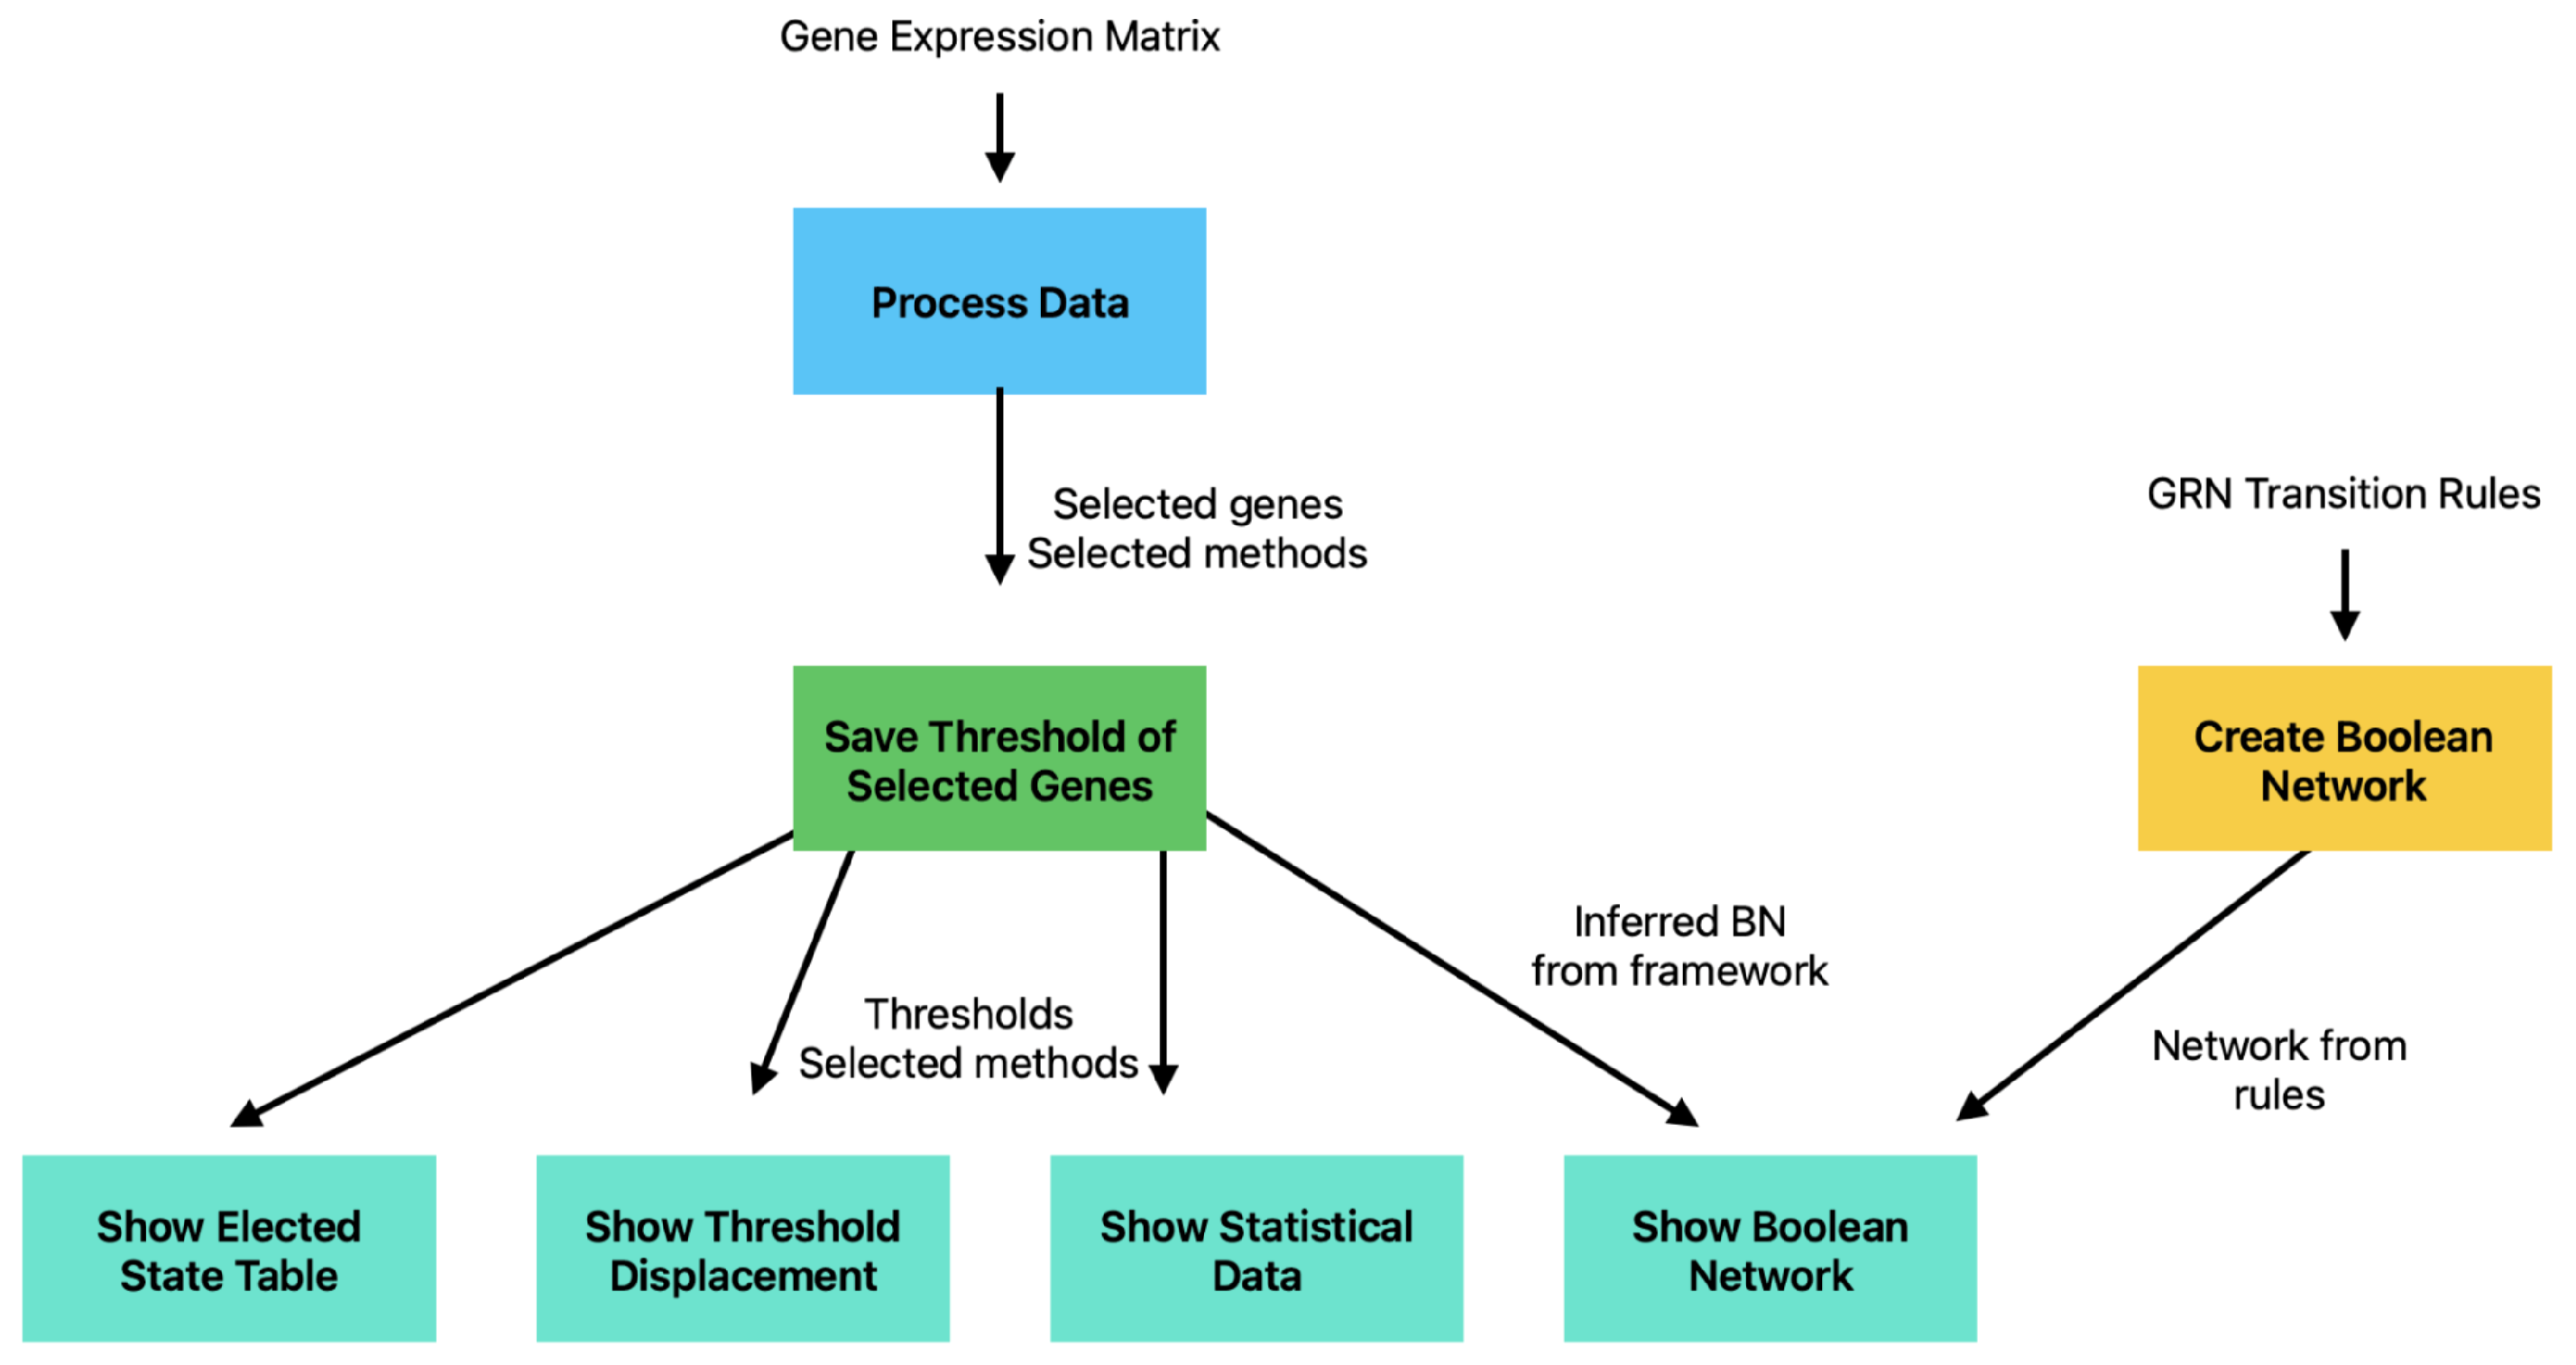
Using Dash framework [10], we created an interactive dashboard to interact with gene expression and its binarizations. Figure 3 summarizes the steps in the tool; the input is a gene expression matrix as a CSV file and the data are normalized and stored locally during the application session. Then, the user may select a set of genes and threshold methods, and new components on the application appear. These are as follows: the results of the binarizations and the voting mechanism; threshold displacements for each method; statistical data showing probabilistic elected states; and the inferred BN for each TCM selected and for elected states. We added an option to create a Boolean Network for the selected genes based on Boolean logic. With this, the transition rules of the Gene Regulatory Network, represented as Boolean functions stored in a CSV file, can be uploaded to generate and draw its corresponding Boolean Network.
The tool has a callback function that is a fundamental part of the framework. This function acts like a listener on the dashboard. The callback has an input and an output parameter; given several inputs, the callback generates and returns the output component. This proved to be very useful because it allows the user to obtain plots and other results based on specific inputs. For example, in Algorithm 1, the voting table can be generated only when the callback receives the inputs from the components, dropdown methods, selected gene, and stored threshold values, after the dataset has been uploaded.
Algorithm 1 Callback for voting table generation
Require: 
Inputs:
  1:
selected-rows
  2:
selected-methods
  3:
stored-data
  4:
thr_b.data, thr_k.data, thr_s.data, thr_o.data
  5:
Prevent initial call: True
Ensure: 
Output: voting-output
  6:
function vote_table(rows, selected_method, data, thr_b, thr_k, thr_s, thr_o)
  7:
      /* Code to create and return voting table */
  8:
end function

2.2. Implementation

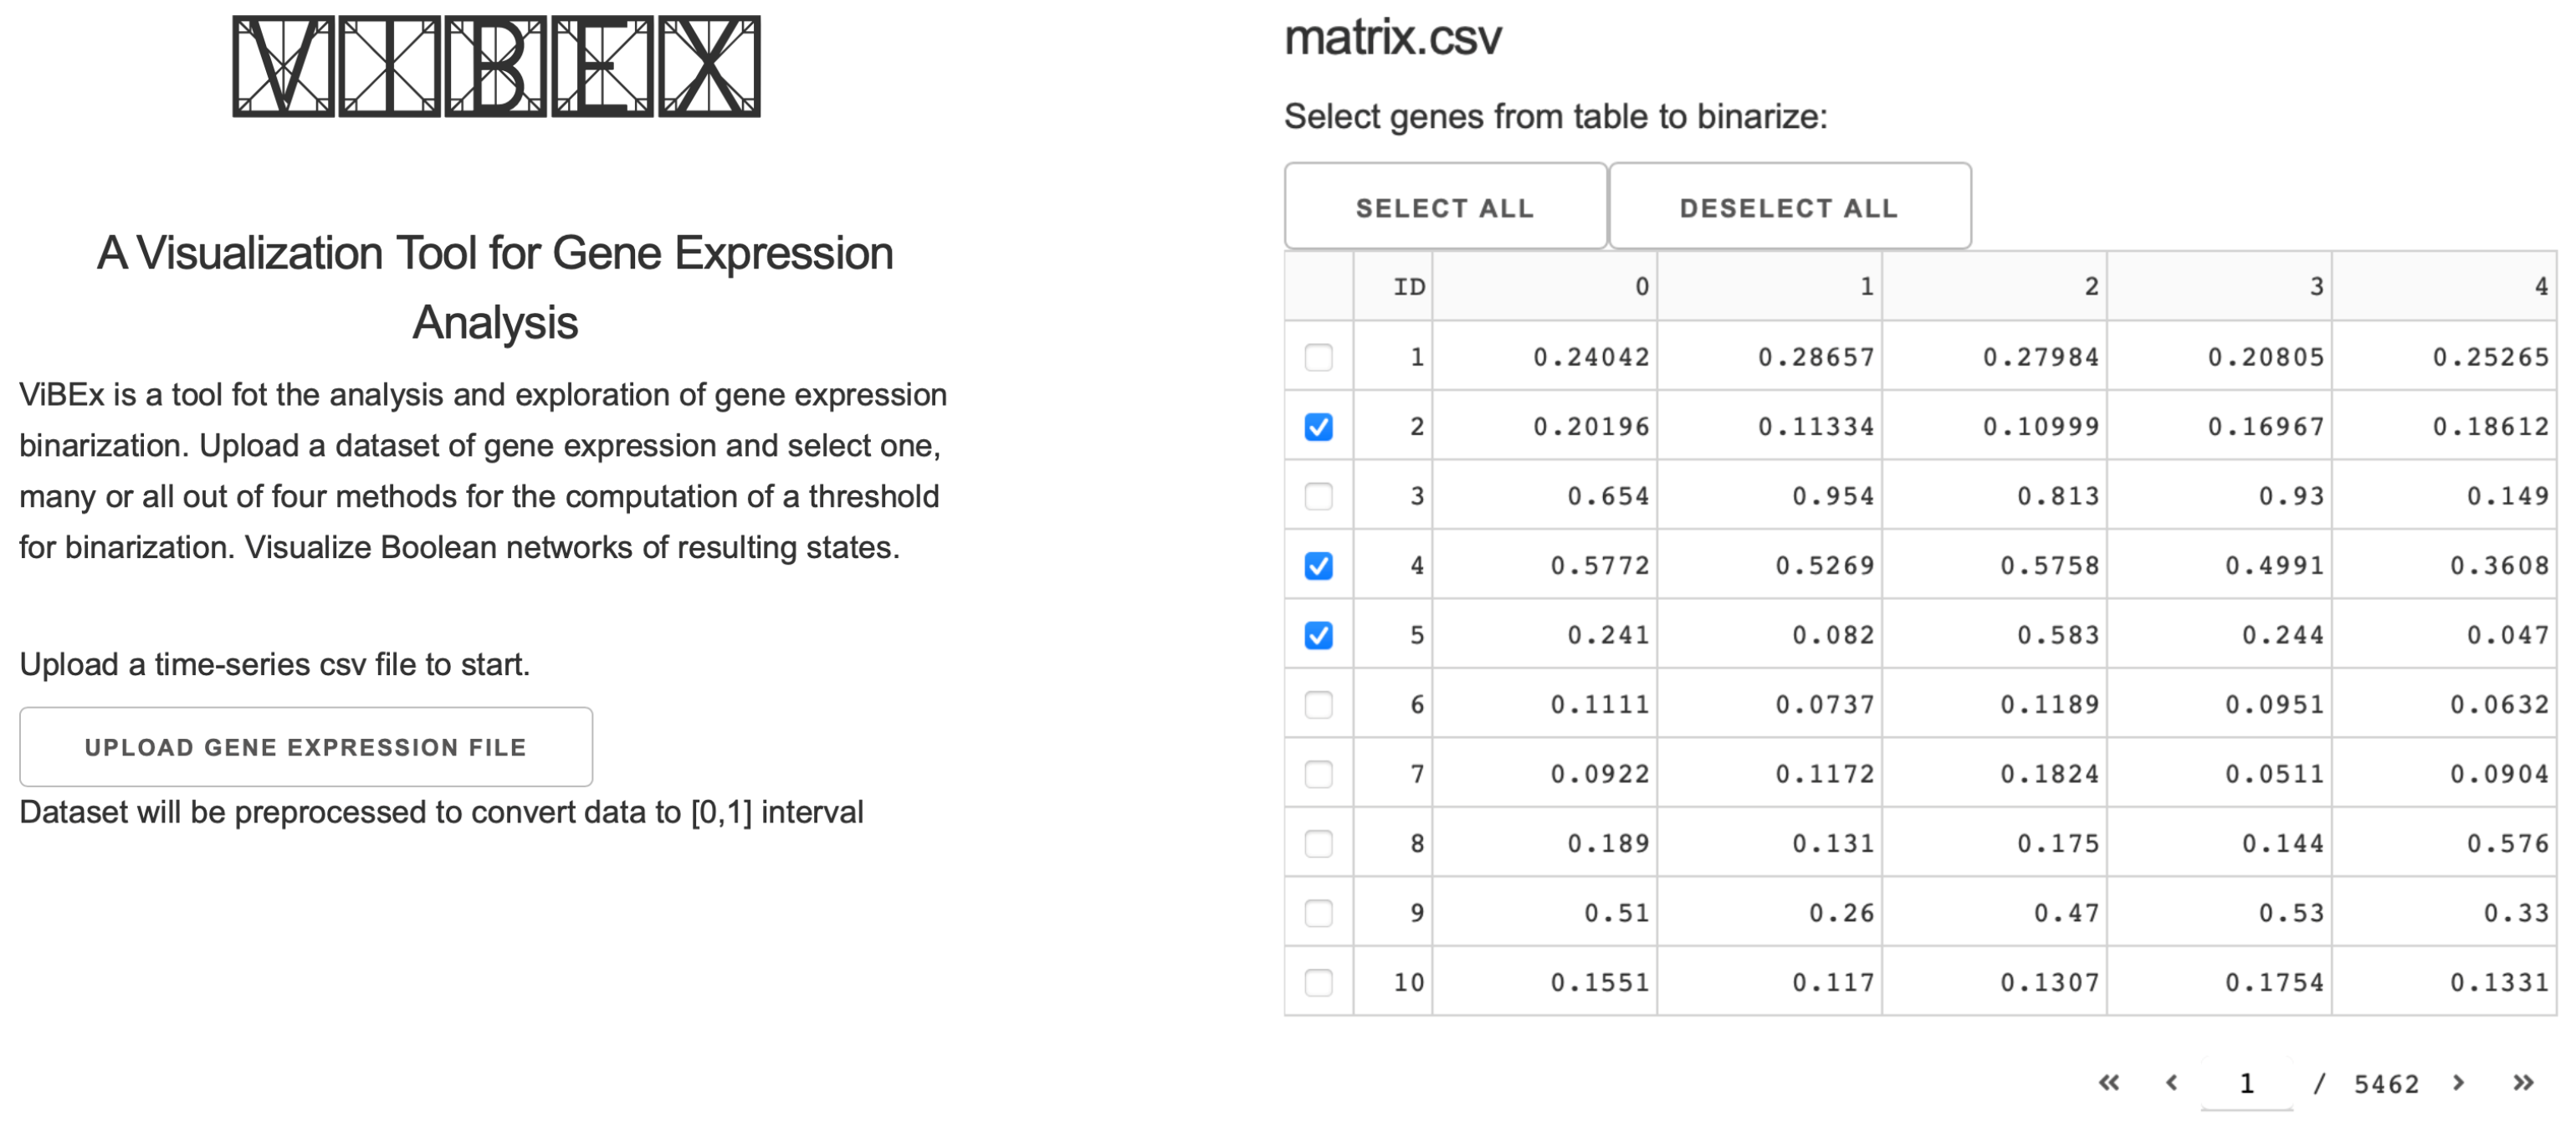
We implemented our tool as a dashboard using the Dash framework in Python. This framework allows us to create and develop interactive web applications quickly and efficiently. The tool is called ViBEx, Visualization of Binary Expression. Figure 4 shows the landing page of the dashboard. Here, a carousel of images appears to show the user the possibilities for the use of the application. These include selecting genes, binarizing, and computing displacements and networks. An accompanying brief description of the application is displayed. A button is rendered that allows the user to upload their gene expression dataset in the form of a CSV file of a matrix of N genes and M samples (time points). The user first needs to remove any header columns or other metadata that may accompany the original file. Once the dataset is uploaded, each gene expression is normalized and set in an interval of [0,1]. This pre-processing stage does not take care of noise by, for instance, removing outliers. Therefore, the user should upload a cleaned matrix of values. This is mainly due to the different structures and formats in which gene expression profiles are found on different databases. The gene expression dataset used to demonstrate the dashboard features is in Table A1.
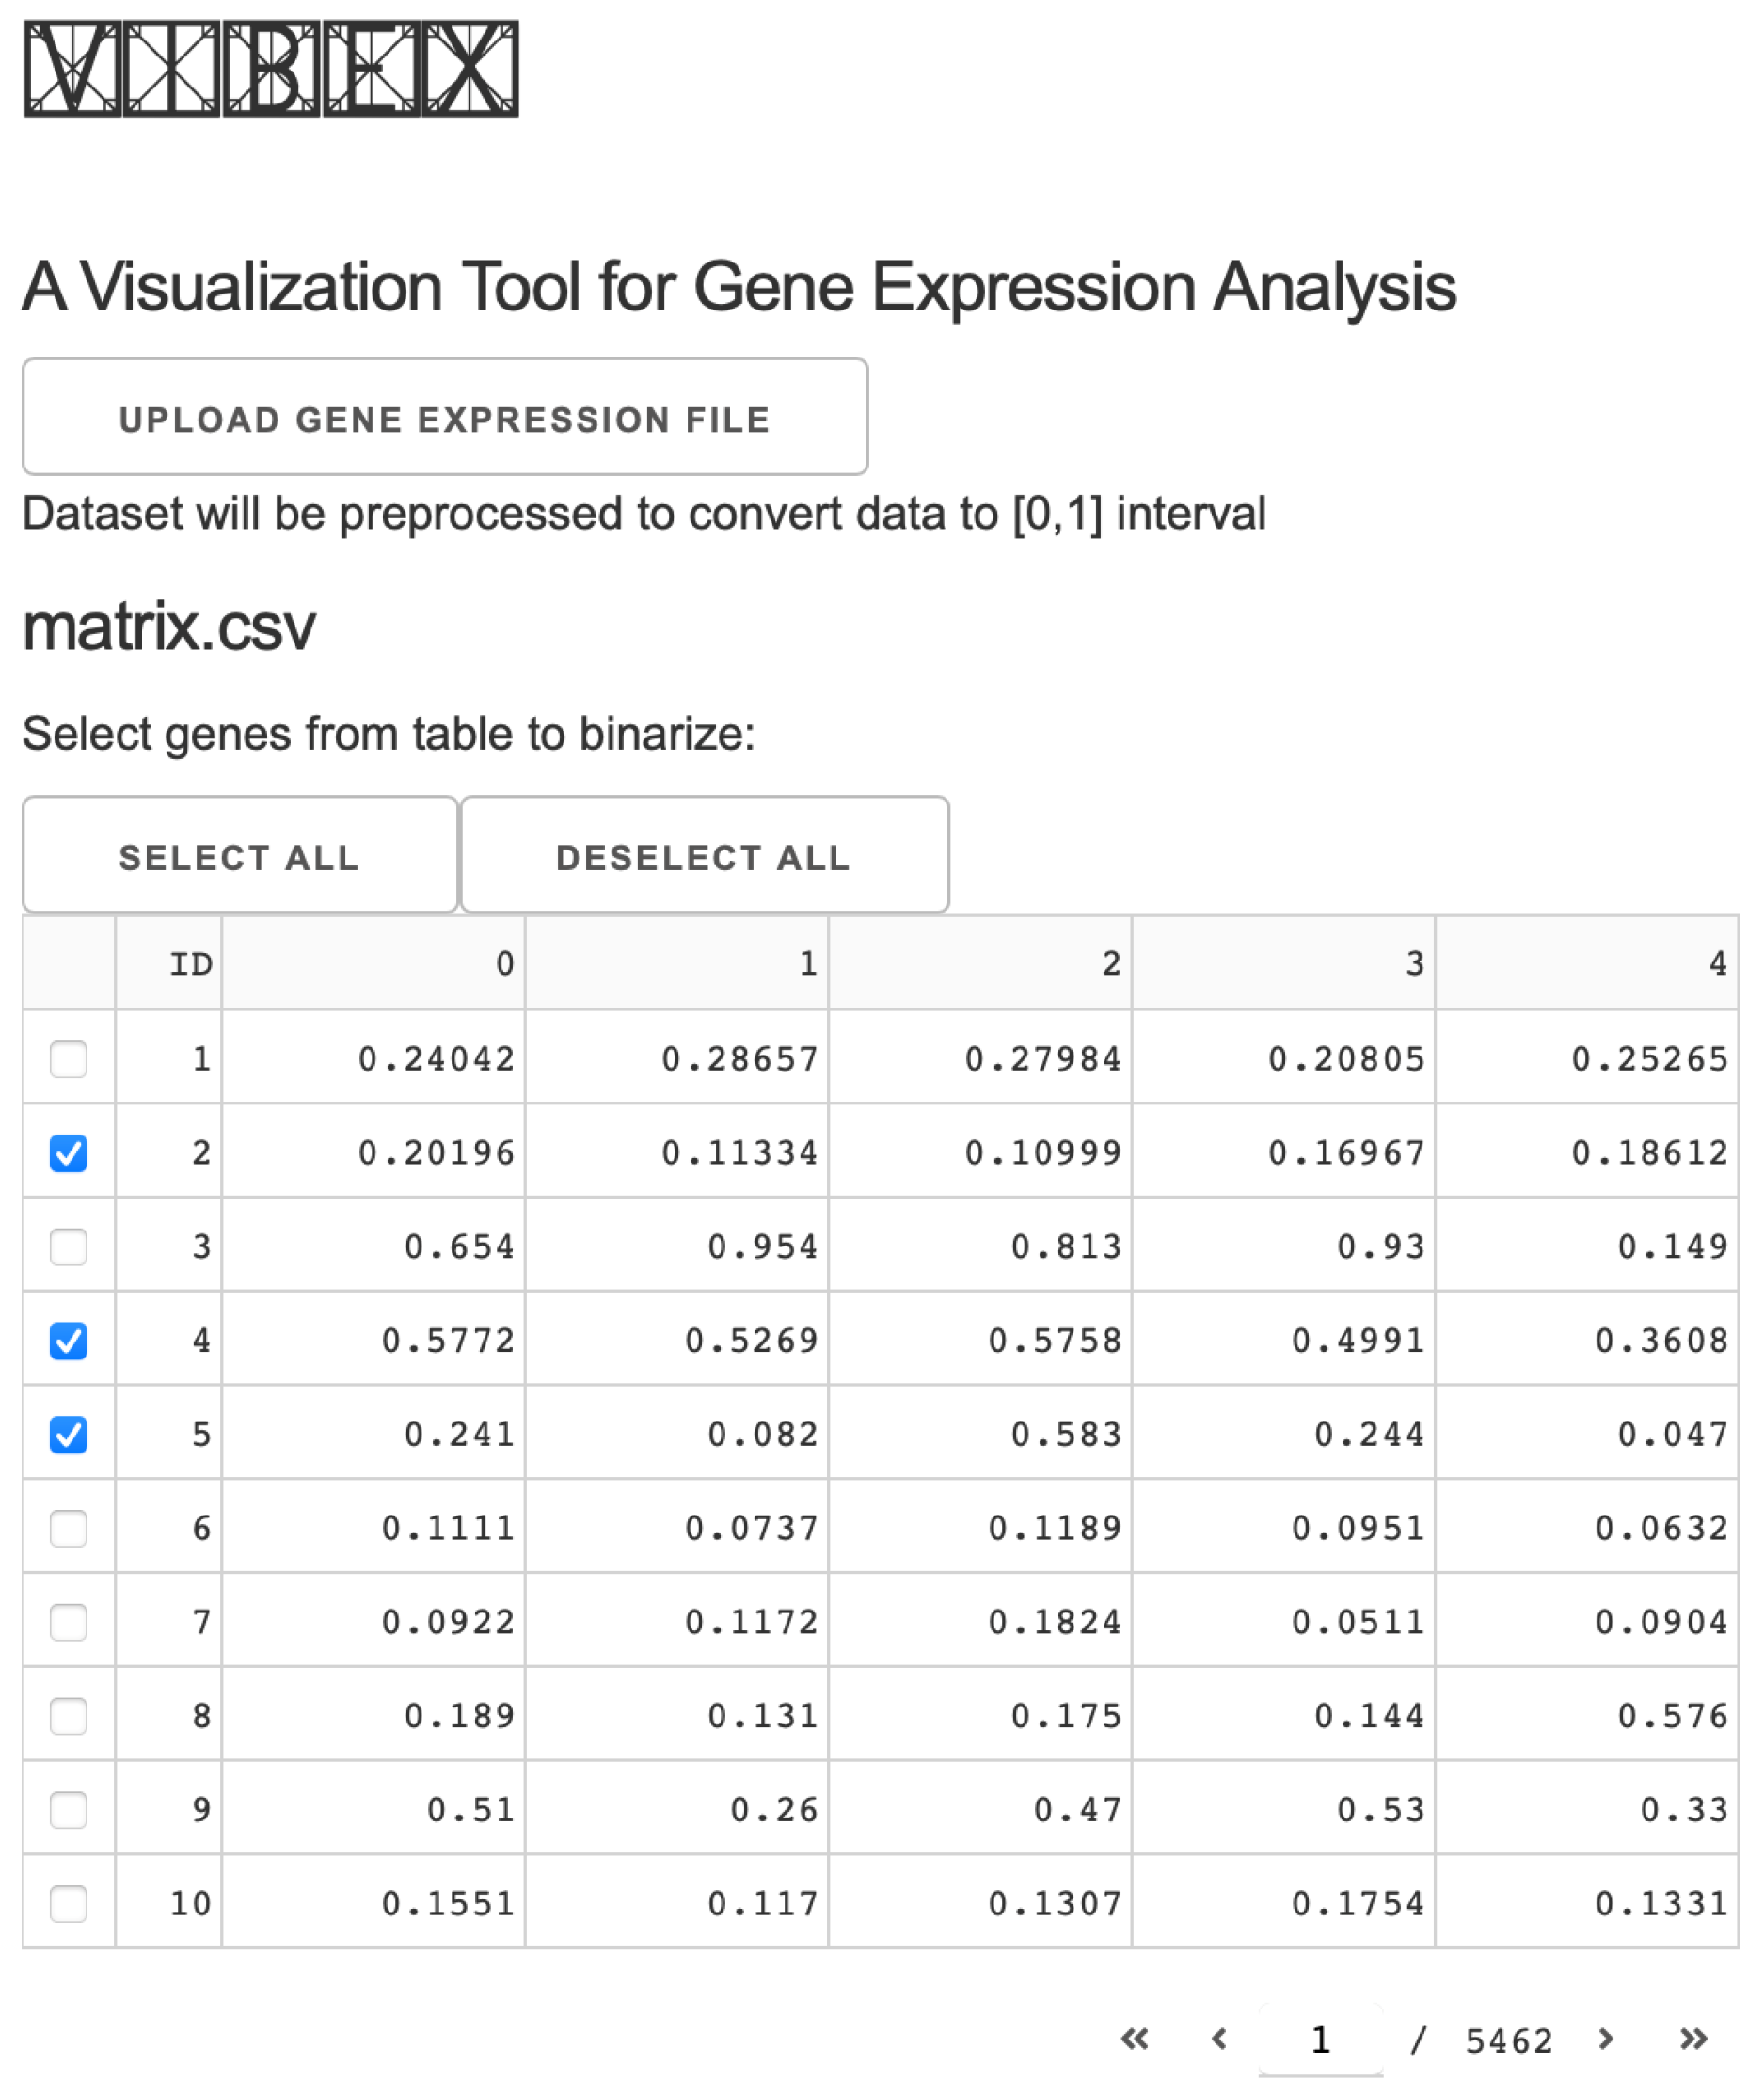
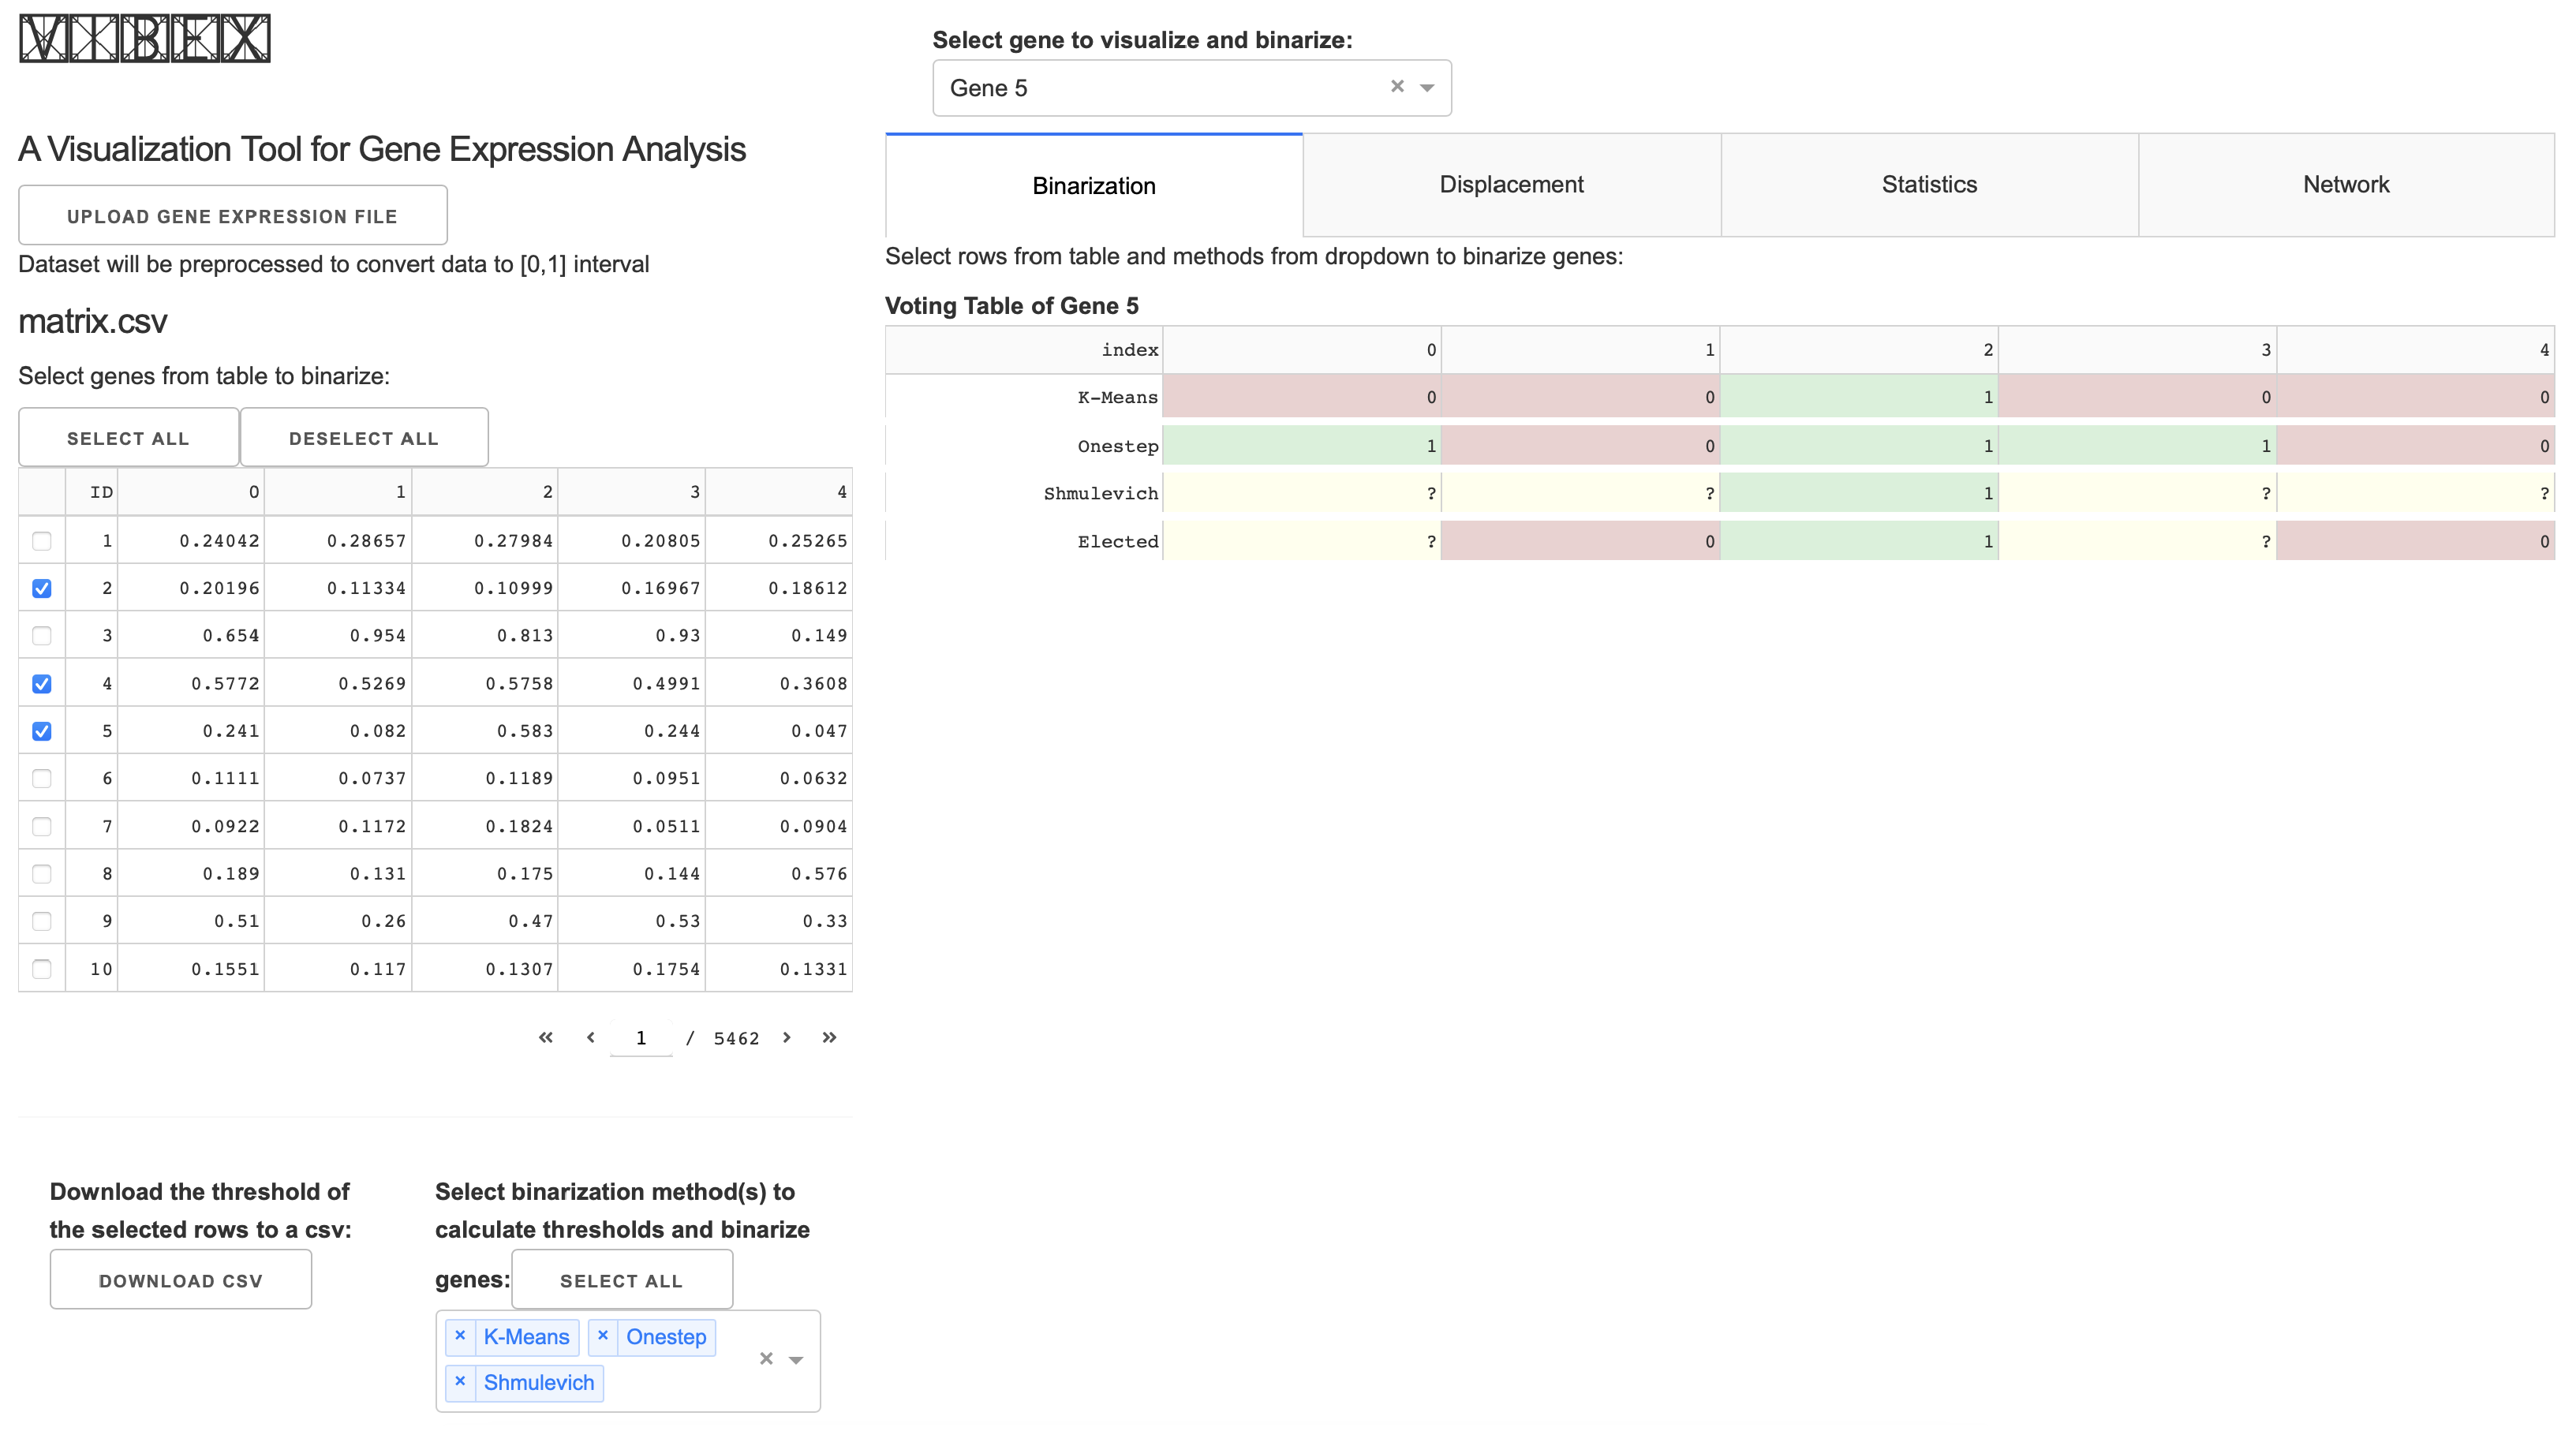
Once the user has uploaded their dataset, the dashboard updates. A new page appears displaying the dataset that the user has uploaded. In Figure 5, we can see this data table. The table is interactive, allowing the user to select which genes they want to analyze. Once the user has selected rows, two new components appear: a button to download the threshold values of the selected genes, and a dropdown menu to select which algorithms to use to estimate the threshold of the genes and binarize them.
The dropdown contains four selections: K-Means, BASC A, OneStep, and Shmulevich. The user can choose one or multiple methods to binarize gene expression. After choosing, the dashboard updates the remaining components. Another dropdown menu follows, where the user can select which gene they want the results displayed for. This is shown in Figure 6, where three methods are selected. The Binarization tab shows the results for the first gene selected, using the chosen TCMs.
The dashboard contains four main tabs: Binarization, Displacement, Statistics, and Network, as shown in Figure 6.
The first tab of the application, called Binarization, displays all the binarizations of a selected gene expression in a table. Each row represents the results for a selected TCM. The last row of this table displays the elected states. This can be seen in Figure 7. The binarization occurs by taking each gene expression and a given threshold, and assigning not expressed (0) to gene expression levels lower than the threshold minus any displacement that the discretization may create. In the case where the gene expression level is higher than or equal to the threshold, plus the displacement, it is assigned an expressed (1) value. Using a majority voting mechanism, each data point is assigned an elected state.
Another tab, called Displacement, shows the selected gene expression and its respective thresholds by each estimation method. In addition, as seen in Figure 8, a spline approximation of the original gene expression is also plotted. In this tab (Figure 9), another method is available to see the threshold displacement by each method. This provides the user with information on how each method binarizes gene expression. The states that are inside the displacement line are undecided values, marked as ?.

2.2.1. Statistics

The third tab of the dashboard is called Statistics, as seen in Figure 10, and provides a probabilistic overview of the binarization of the gene according to the selected algorithms. All gene expression states must be 0 or 1. However, because of the uncertainties described in previous sections, some states are assigned a ? for undecided. The main purpose of the Statistics tab is to assist in the imputation of values of undecided states. This tab provides a probability estimate of the binarized string generated by the algorithm being the actual binarization. The probability estimation is a frequency analysis [11] from a preset generation of 1000 vectors of 10 random real values between 0 and 1, creating a cumulative distribution function with the thresholds calculated by the selected algorithms for distribution ranges of 0.1, 0.2, …, 1.0.
The utilized cumulative distribution function is selected according to the distance between the lowest value and the highest value of a vector, rounded up to the closest single decimal point number. Individual gene expressions are evaluated to obtain the probability that the stated number is a 1, 0, or ? based on the cumulative distribution function corresponding to the range of the gene, which is used to obtain the probability that a value is below or above the threshold [12]. The final probability of a given binarization is the multiplication of the probability of each individual value’s binarization. The standard deviation is calculated with the same dataset as the probability. The mean is calculated with 1 3 n , where n is the number of elements in a row of the provided gene file, and there are three binarization possibilities of an element (1, 0, and “?”). The value res signifies the number of elements in the binarization that are not unknown by the threshold given by the algorithm over the amount of elements in the vector. The column dif is the difference between the mean and the probability of the selected binary string. Finally, the z column signifies the z-score of the probability in relation to the mean [5].
A second table is provided, where the string of computed or selected states and its probability are compared with the string of states with the highest probability. This may help with the value imputation of undecided states.

2.2.2. Networks

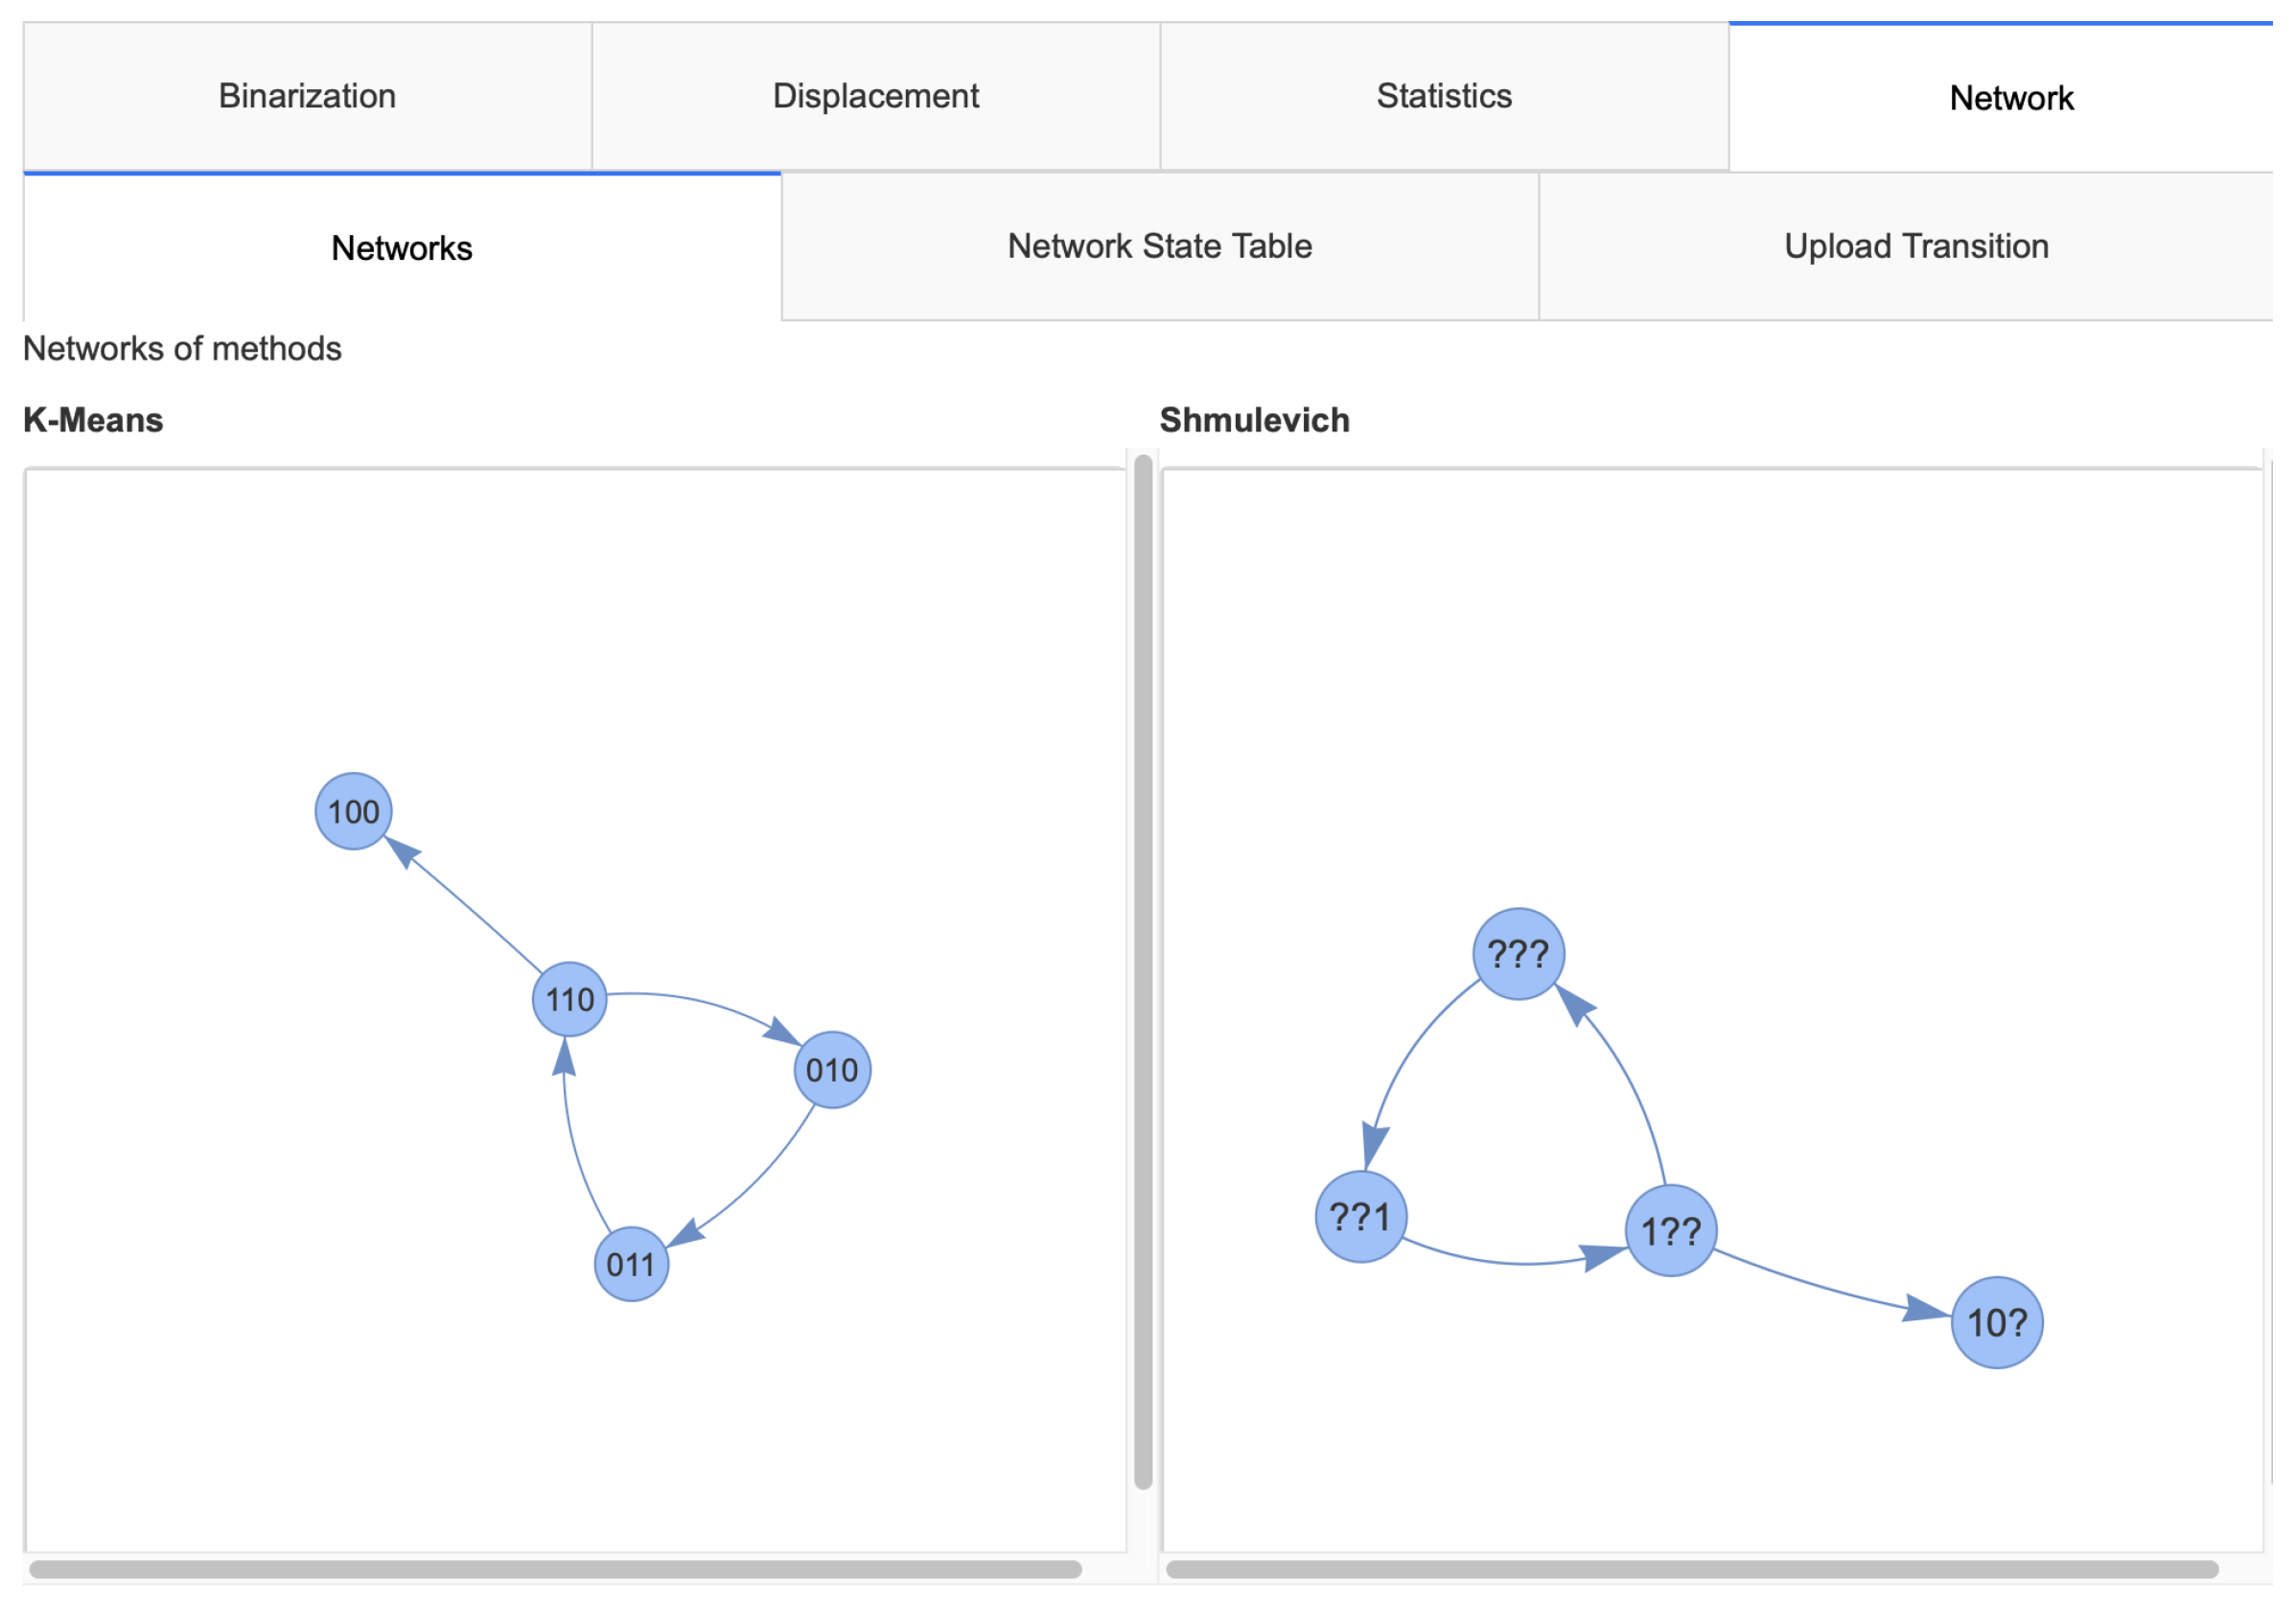
The fourth and final tab of the dashboard, Network, displays the resulting network for the selected binarized genes under the different TCMs. In this tab, the user will find Networks, Network State Table, and Upload Transition tabs. In Networks, different BNs are plotted using the binarization of the selected gene expression. These networks are interactive, allowing users to move nodes. The string formed by the states of all genes in the network at a given time is a state of the network, representing the network’s dynamics. Figure 11 illustrates example networks generated by the two methods for three genes. In the BN under K-Means binarization, there is a state represented by 100; there are three genes in the network and each digit is the state of one gene: expressed, not expressed, and not expressed. Using these graphs, we can appreciate the discrepancy between binarization methods. This approach aids in a detailed analysis of each method. A BN based on the elected states is also plotted for comparison.
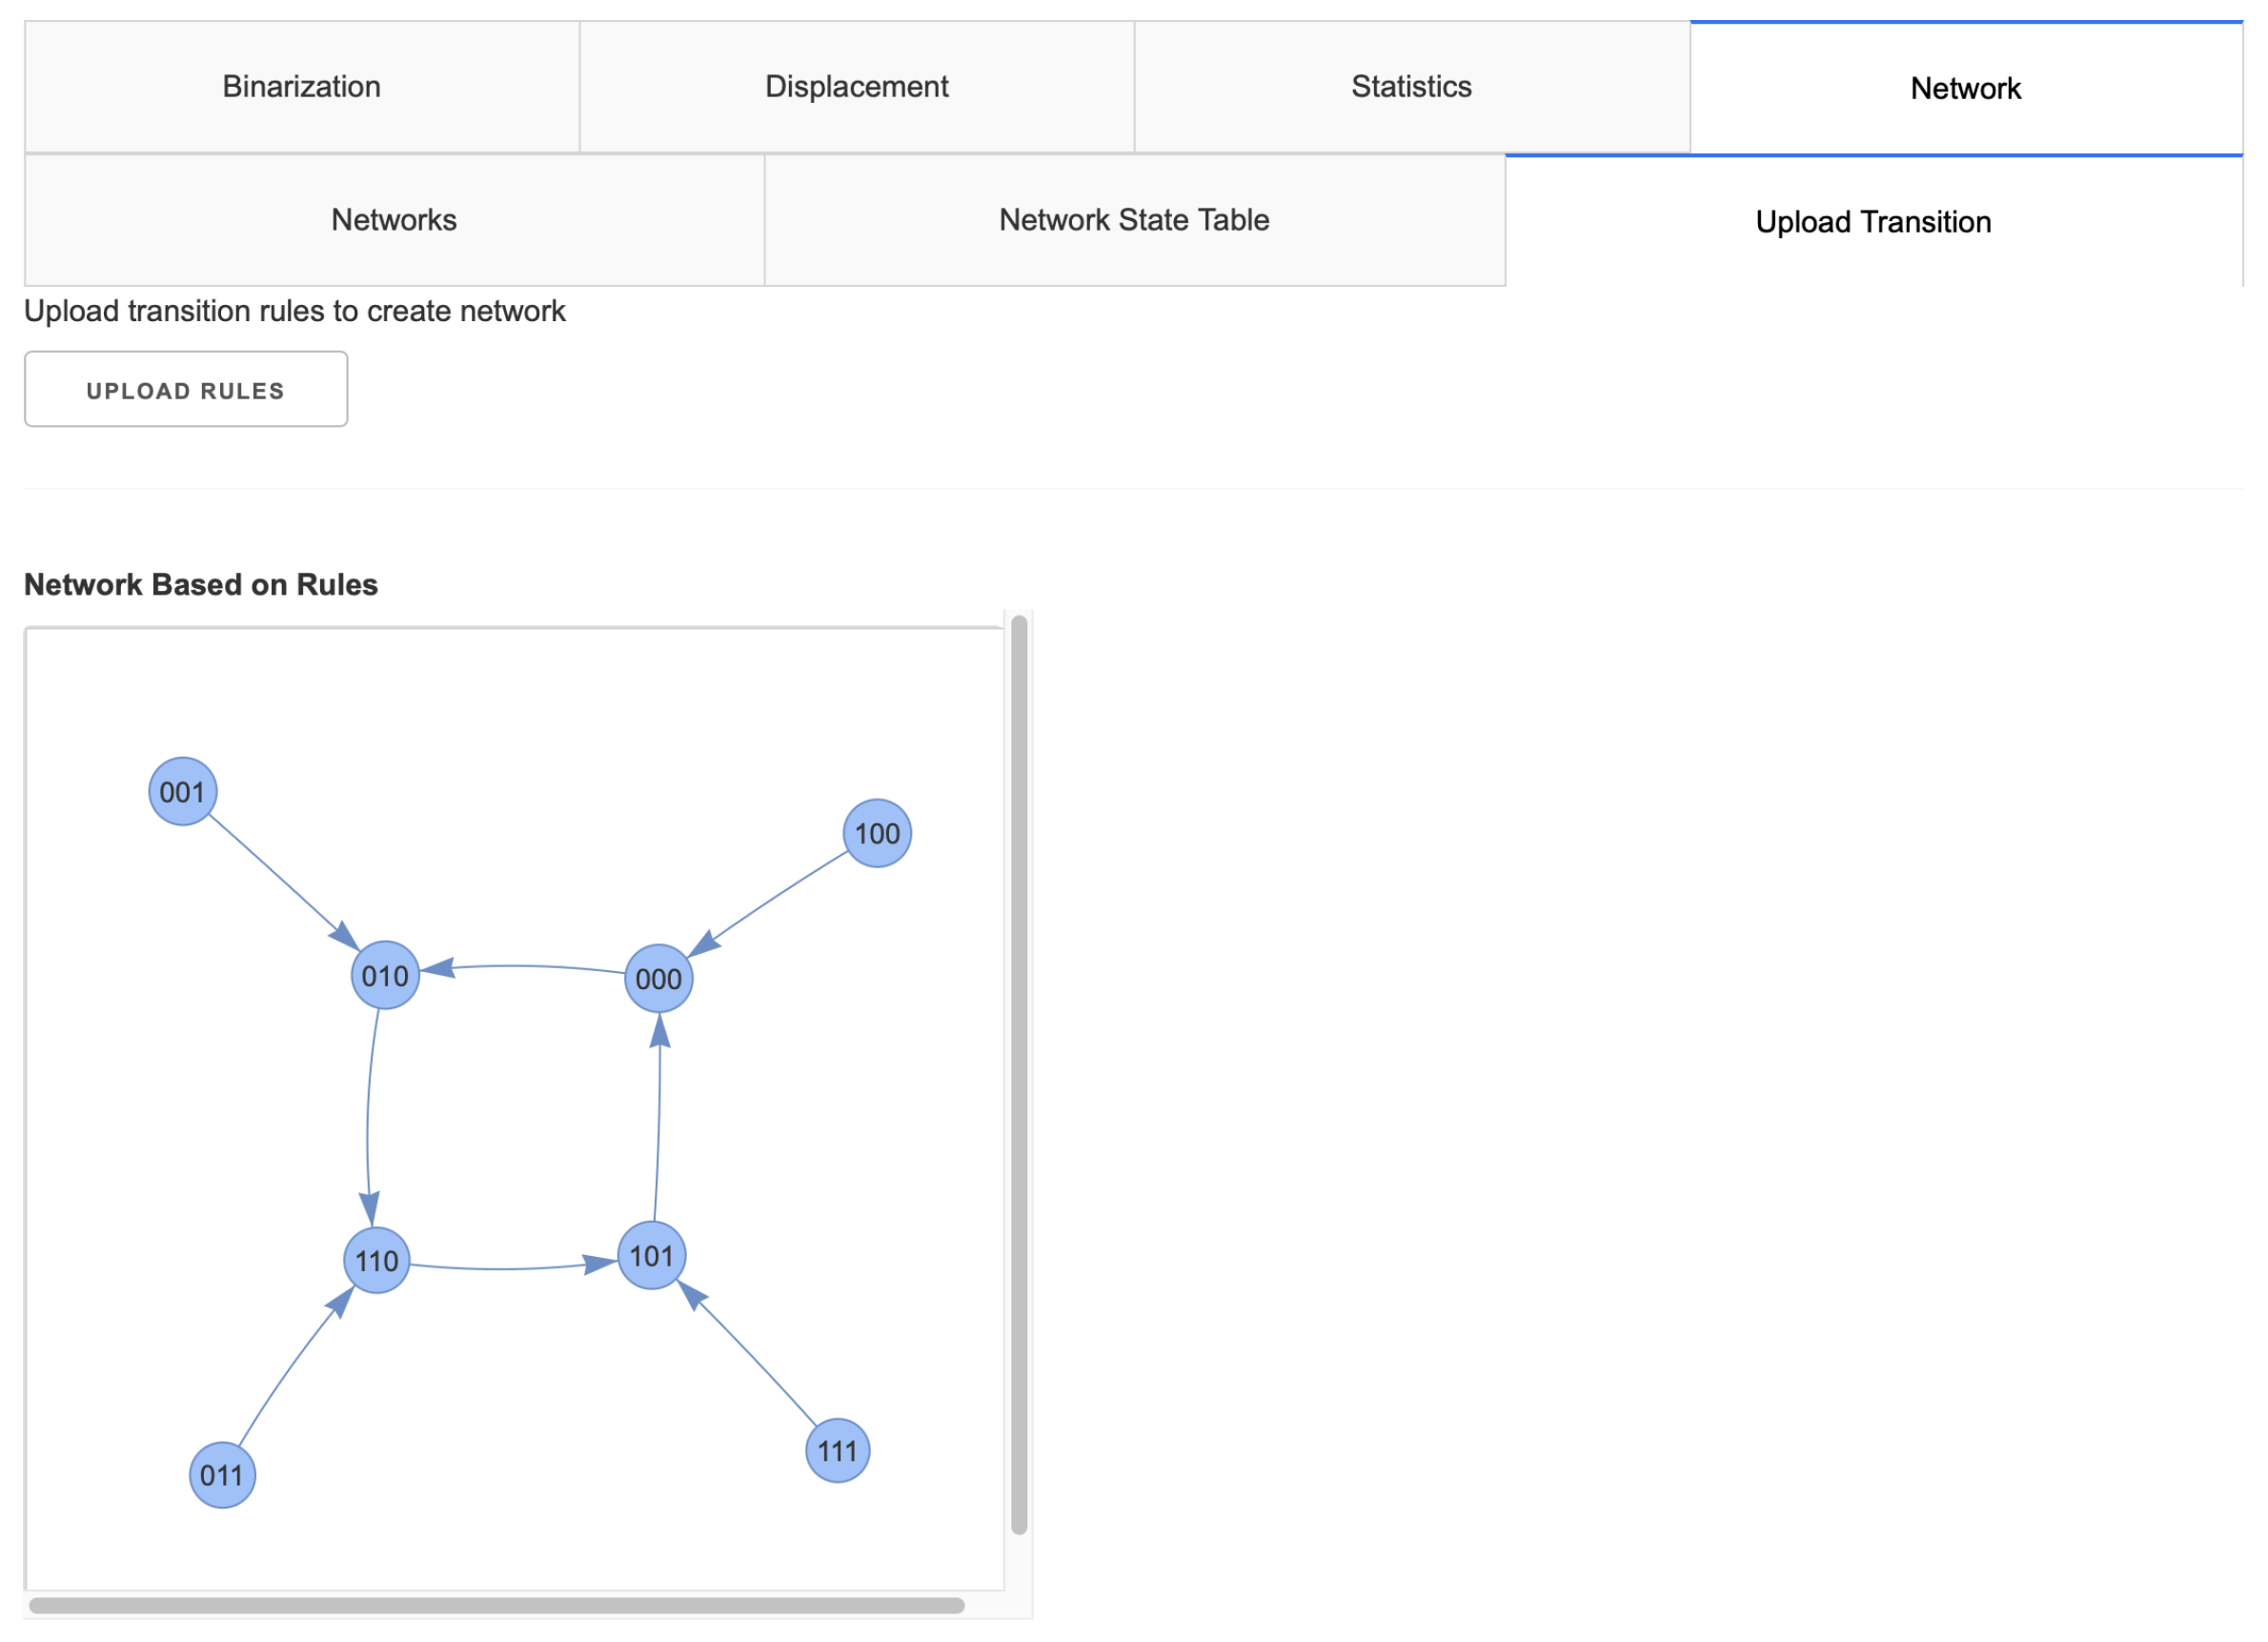
The tab Network State Table shows tables where each row has the binary state values of all genes in the BN at a given time. In Figure 12, the table representation of K-Means is displayed. This tells us that the first state of the network is 110, the second state is 010, the third state is 011, and so on. The tab called Upload Transition allows the user to upload a CSV file with Boolean functions that represent the transition rules of a GRN. This section of the application generates all possible binary states for the set of genes and applies the rules. Using this, it creates a BN representation of the GRN. This can be seen in Figure 13. The transition rules used can be found in Table A2.
Additionally, undecided states marked as ? can be replaced here by [0,1], updating the resulting network. For example, Figure 14a illustrates the first state of the Shmulevich state table, where Gene 5 is placed in edit mode to modify the undecided state. In Figure 14b, this value is updated, assigning Gene 5 as “not expressed” (0).

3. Discussion

Using the Dash framework, we developed an interactive and responsive dashboard to implement the framework proposed by [8], whose goal is to analyze binary representations of gene expression and the resulting BN. The tool provides a visual interface that facilitates the analysis of the uncertainties introduced by the different binarization methods and their comparison, while providing statistical analysis to aid with the value imputation of states that cannot be clearly binarized. The tool receives input in form of a CSV file that has been pre-processed to address noise. This limitation is mainly due to the different formats in which gene expression is extracted from different databases. However, the addition of a pre-processing module applying denoising mechanisms would result in a more reliable binarization and is considered for future versions. In order to improve the tool’s performance, TCM Basc-A and OneStep were implemented in parallel. The current implementation of the program can handle a few dozens of genes. Until these performance issues can be addressed, our recommendation is to filter genes with known statistical significance, and/or limit the number of genes by known biological function, as we did with the sea urchin development data. It is important to note that, while BNs are created to further the analysis, this section is still under development. The most recent developments include the ability to replace undecided values with binary values (which may be selected under the guidance of the provided statistical analysis) and observe the resulting network.

Future Work

In addition to OneStep and Basc-A, future work will provide parallel implementations of 2-means and Shmulevich, and a comparison of their performance vs. the serial versions. The network analysis will also include a scoring mechanism for the resulting BNs, based on the number of undecided states and also on their proximity to either a known BN representation or the final state of the GRN. Using gene expression profiles of known representations of the GRN, we will build its BN and seek biological validation of the framework.

Author Contributions

Conceptualization, M.L.-C.; methodology, M.L.-C.; software, M.H.T.-R. and A.V.N.-R.; validation, M.L.-C. and H.O.-Z.; formal analysis, M.L.-C.; investigation, M.H.T.-R. and A.V.N.-R.; resources, M.L.-C. and H.O.-Z.; data curation, M.H.T.-R. and A.V.N.-R.; writing—original draft preparation, M.H.T.-R., A.V.N.-R. and M.L.-C.; writing—review and editing, H.O.-Z. and M.L.-C.; visualization, M.H.T.-R. and A.V.N.-R.; supervision, M.L.-C. and H.O.-Z.; project administration, M.L.-C.; funding acquisition, M.L.-C. and H.O.-Z. All authors have read and agreed to the published version of the manuscript.

Funding

M.H.T.-R. and A.V.N.-R. were supported in part by the Formative Academic Experiences Program (PEAF) of University of Puerto Rico at Rio Piedras (UPRRP). This material is based upon work supported by the National Science Foundation under Grant No. 2030188. Any opinions, findings, and conclusions or recommendations expressed in this material are those of the author(s) and do not necessarily reflect the views of the National Science Foundation. H.O.-Z. was supported in part by an Institutional Development Award (IDeA) INBRE grant P20 GM103475 from the National Institute for General Medical Sciences (NIGMS), a component of the National Institutes of Health (NIH). M.L.-C. was supported in part by the Distance Education Grants Program in Insular Areas, project award no. 2023-70008-41027, from the U.S. Department of Agriculture’s National Institute of Food and Agriculture.

Data Availability Statement

Datasets for this article can be found at https://github.com/lablluberes/ViBEx (accessed on 27 January 2025).

Conflicts of Interest

The authors declare no conflicts of interest. The funders had no role in the design of the study; in the collection, analyses, or interpretation of data; in the writing of the manuscript; or in the decision to publish the results.

Abbreviations

The following abbreviations are used in this manuscript:
MDPIMultidisciplinary Digital Publishing Institute
GRNGene Regulatory Network
BNBoolean Network
TCMThreshold computation method

Appendix A

Appendix A.1. Dataset Gene Expression

The next table shows genes from the dataset used. The dataset can be found in D’Antonio [6]. This dataset was used as an example in the dashboard application and to show model and discretization uncertainty, Figure 1a,b.
Table A1. Gene Expression.
Genet:0t:1t:2t:3t:4
DDR12404.22865.72798.42080.52526.5
RFC22019.61133.41099.91696.71861.2
PAX8577.2526.9575.8499.1360.8
GUCA1A24.18.258.324.44.7
CCL55.12.64.75.33.3

Appendix A.2. Dataset Transition Rules

The next table shows the transition rules dataset used. The transition rules need to be CSV files with columns Gene (Gene names), and Rule (for the corresponding transition rule for that gene). These boolean functions were used to show an example in the application, Figure 13, about Boolean Network creation based on transition rules.
Table A2. Transition Rules.
GeneRule
AB
Bnot A
CA and B

References

  1. MacQueen, J. Some methods for classification and analysis of multivariate observations. In Proceedings of the Fifth Berkeley Symposium on Mathematical Statistics and Probability, Oakland, CA, USA, 21 June–18 July 1965; Volume 1, pp. 281–297. [Google Scholar]
  2. Hopfensitz, M.; Mussel, C.; Wawra, C.; Maucher, M.; Kuhl, M.; Neumann, H.; Kestler, H.A. Multiscale binarization of gene expression data for reconstructing Boolean networks. IEEE/ACM Trans. Comput. Biol. Bioinform. 2011, 9, 487–498. [Google Scholar] [CrossRef] [PubMed]
  3. Sahoo, D.; Dill, D.L.; Tibshirani, R.; Plevritis, S.K. Extracting binary signals from microarray time-course data. Nucleic Acids Res. 2007, 35, 3705–3712. [Google Scholar] [CrossRef] [PubMed]
  4. Shmulevich, I.; Zhang, W. Binary analysis and optimization-based normalization of gene expression data. Bioinformatics 2002, 18, 555–565. [Google Scholar] [CrossRef] [PubMed]
  5. Seguel, J.; Lluberes, M. Semantics and Accuracy of Gene Expression Threshold Computations. In Proceedings of the 2013 International Conference on Advanced Engineering Computing and Applications in Sciences, IARIA, Porto, Portugal, 29 September–3 October 2013; pp. 1–6. [Google Scholar]
  6. D’Antonio, J.M.; Ma, C.; Monzon, F.A.; Pflug, B.R. Longitudinal Analysis of Androgen Deprivation of Prostate Cancer Cells Identifies Pathways to Androgen Independence. 2008. Tech. Rep. PRJNA101933. Available online: https://www.ncbi.nlm.nih.gov/bioproject/PRJNA101933 (accessed on 19 December 2024).
  7. Seguel, J.; Lluberes, M. A unified approach to the computation and analysis of strings of gene expression states. In Proceedings of the 2015 IEEE International Conference on Bioinformatics and Biomedicine (BIBM), Washington, DC, USA, 9–12 November 2015; pp. 1687–1693. [Google Scholar]
  8. Lluberes, M. A Probabilistic Approach to Gene Expression Analysis. Ph.D. Thesis, University of Puerto Rico, Mayagüez Campus, Mayagüez, PR, USA, 2017. [Google Scholar]
  9. Shmulevich, I.; Dougherty, E.R.; Zhang, W. From Boolean to probabilistic Boolean networks as models of genetic regulatory networks. Proc. IEEE 2002, 90, 1778–1792. [Google Scholar] [CrossRef]
  10. Dabbas, E. Interactive Dashboards and Data Apps with Plotly and Dash: Harness the Power of a Fully Fledged Frontend Web Framework in Python–No JavaScript Required; Packt Publishing Ltd.: Birmingham, UK, 2021. [Google Scholar]
  11. Oosterbaan, R. Frequency and regression analysis of hydrologic data. Drain. Princ. Appl. Publ. 1994, 16, 175–223. [Google Scholar]
  12. Park, K.I.; Park, M. Fundamentals of Probability and Stochastic Processes with Applications to Communications; Springer: Berlin/Heidelberg, Germany, 2018. [Google Scholar]
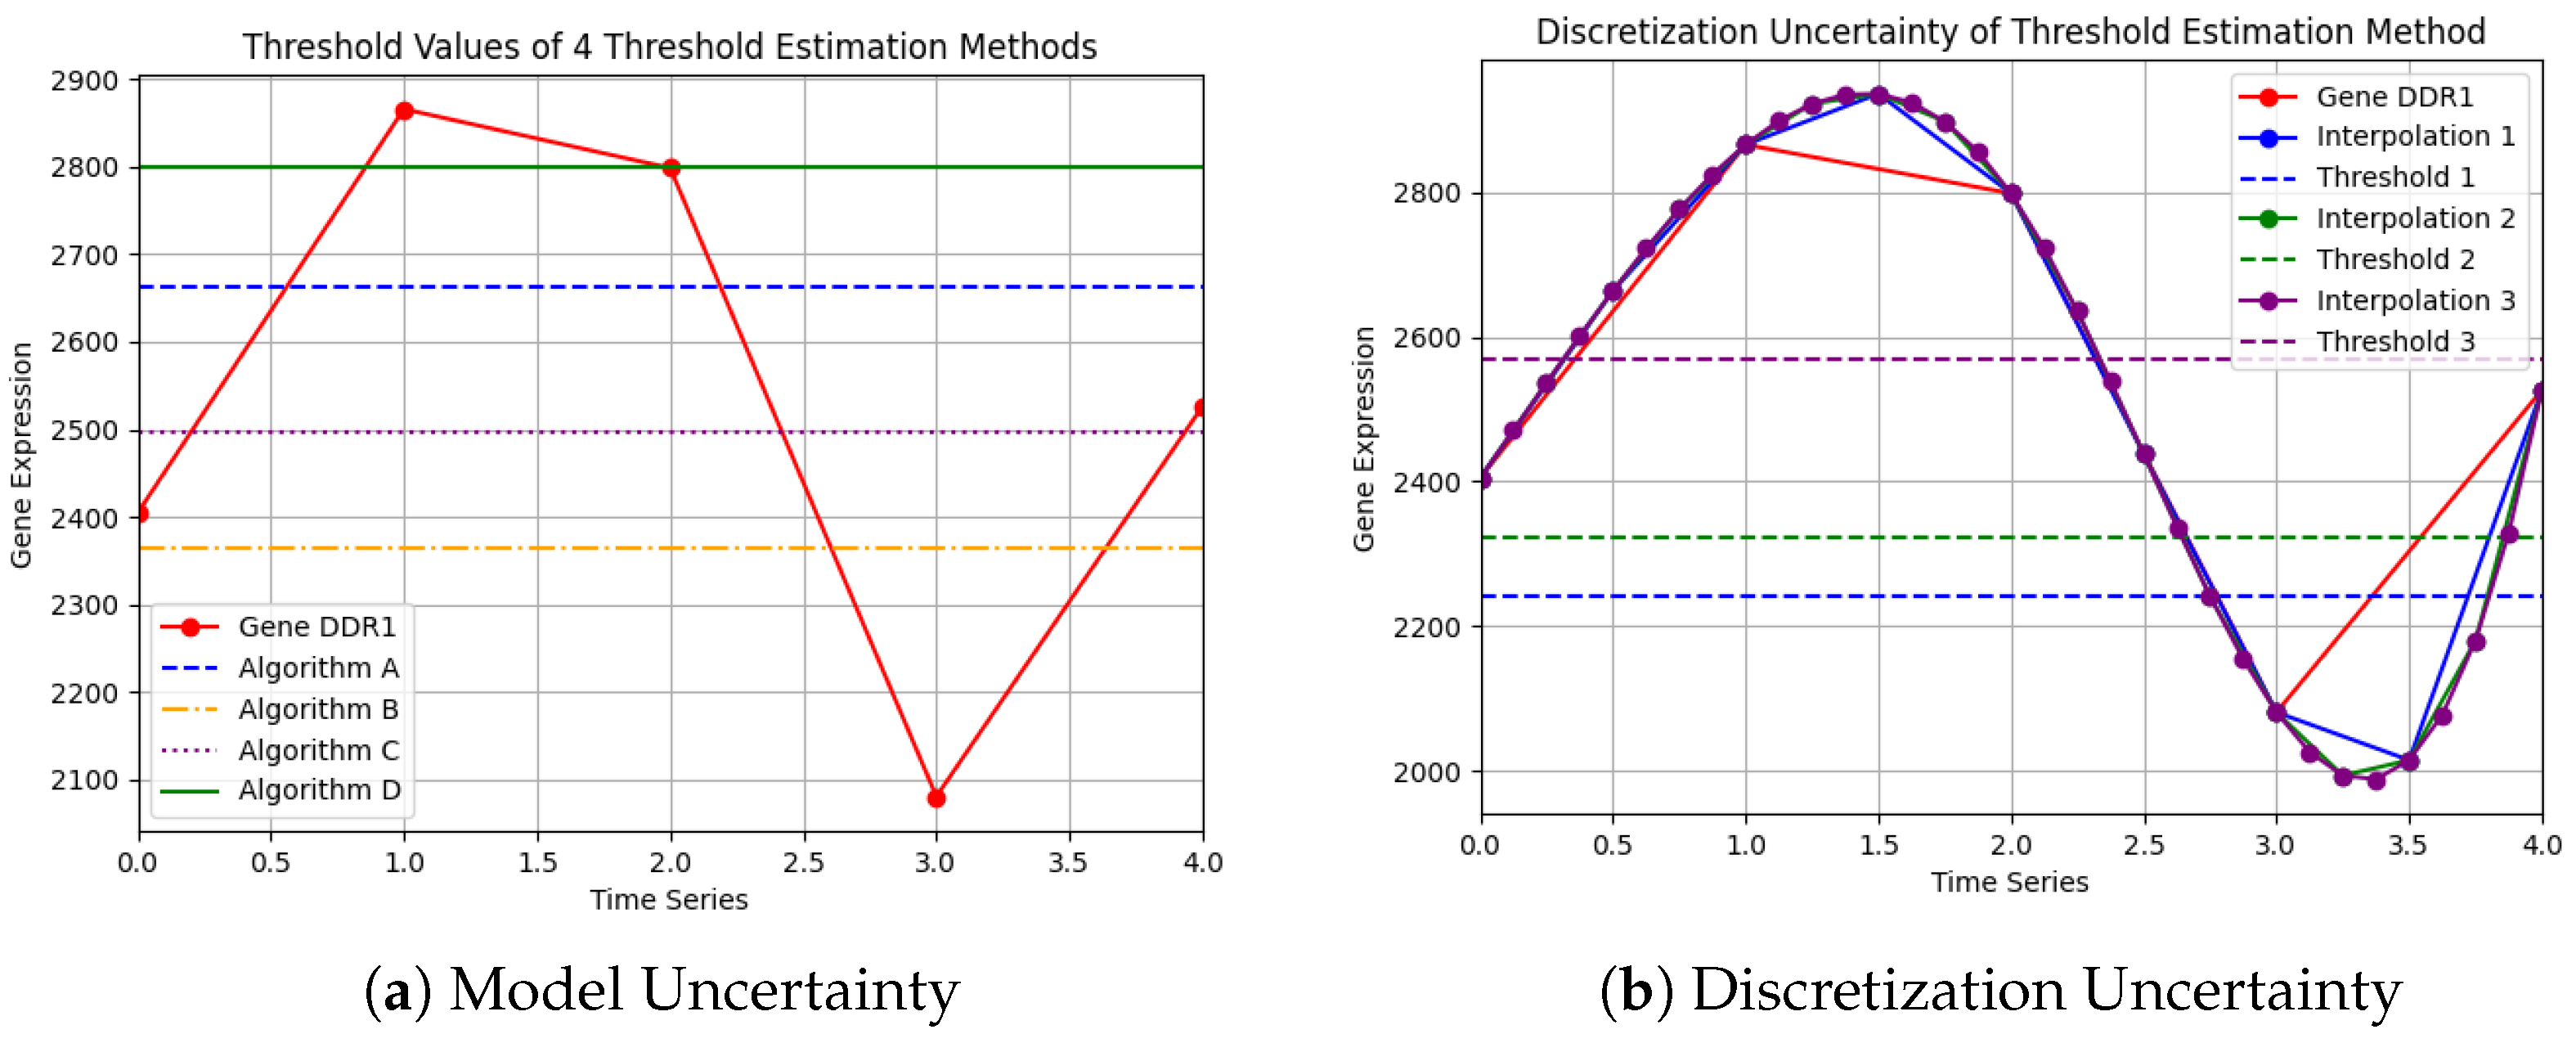
Figure 1. (a) Model uncertainty and (b) discretization uncertainty using gene DDR1. See Table A1 and dataset in [6].
Biomedinformatics 05 00013 g001
Figure 2. (a) Regulatory Network. (b) Boolean functions. (c) Boolean Network.
Biomedinformatics 05 00013 g002
Figure 3. Application framework and structure.
Biomedinformatics 05 00013 g003
Figure 4. Landing page.
Biomedinformatics 05 00013 g004
Figure 5. Interactive data table. Selected rows are genes RFC2, PAX8, and GUCA1A. See Table A1 and dataset in [6].
Biomedinformatics 05 00013 g005
Figure 6. Selecting methods and binarizing using genes RFC2, PAX8, and GUCA1A. See Table A1 and dataset in [6].
Biomedinformatics 05 00013 g006
Figure 7. Binarization tab using genes RFC2, PAX8, and GUCA1A. See Table A1 and dataset in [6].
Biomedinformatics 05 00013 g007
Figure 8. Thresholds and gene expression for gene GUCA1A. See Table A1 and dataset in [6].
Biomedinformatics 05 00013 g008
Figure 9. Threshold displacement for gene GUCA1A. See Table A1 and dataset in [6].
Biomedinformatics 05 00013 g009
Figure 10. Statistics tab gene CCL5, see Table A1 and dataset in [6].
Biomedinformatics 05 00013 g010
Figure 11. Boolean Network graph genes RFC2, PAX8, and GUCA1A used, found in Table A1 and in dataset [6].
Biomedinformatics 05 00013 g011
Figure 12. Network state tables for genes RFC2, PAX8, and GUCA1A. See Table A1 and dataset in [6].
Biomedinformatics 05 00013 g012
Figure 13. Boolean Network from transition rules (Table A2).
Biomedinformatics 05 00013 g013
Figure 14. (a) Editing a value and (b) value changed and network updated genes RFC2, PAX8, and GUCA1A, see Table A1 and dataset in [6].
Biomedinformatics 05 00013 g014
Disclaimer/Publisher’s Note: The statements, opinions and data contained in all publications are solely those of the individual author(s) and contributor(s) and not of MDPI and/or the editor(s). MDPI and/or the editor(s) disclaim responsibility for any injury to people or property resulting from any ideas, methods, instructions or products referred to in the content.