
ViBEx: A Visualization Tool for Gene Expression Analysis

 , and
, and
Abstract
:1. Introduction
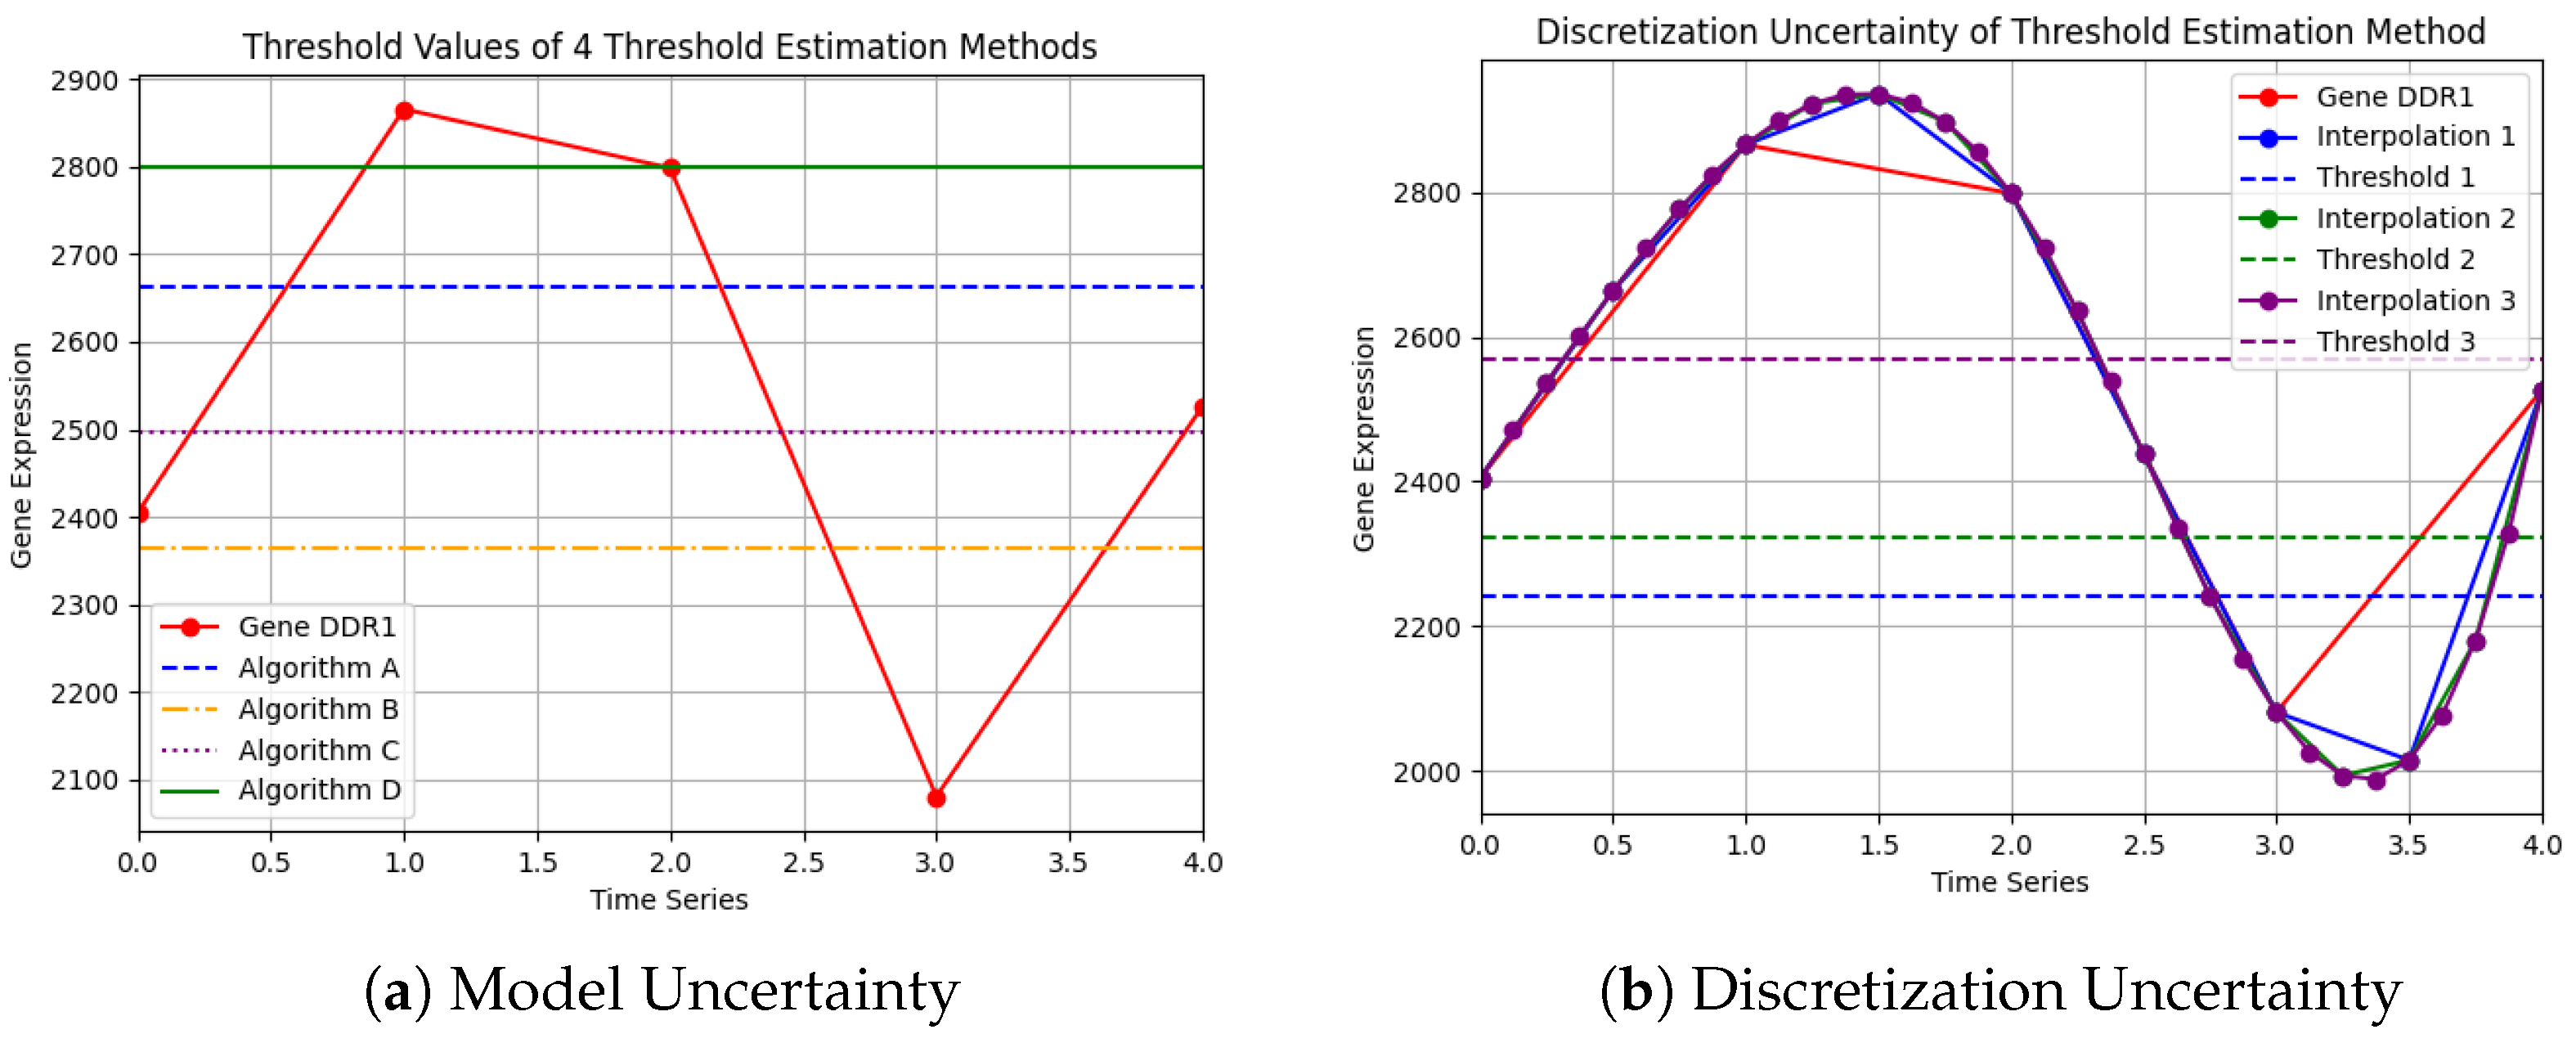
1.1. Probabilistic Framework for Gene Expression Analysis
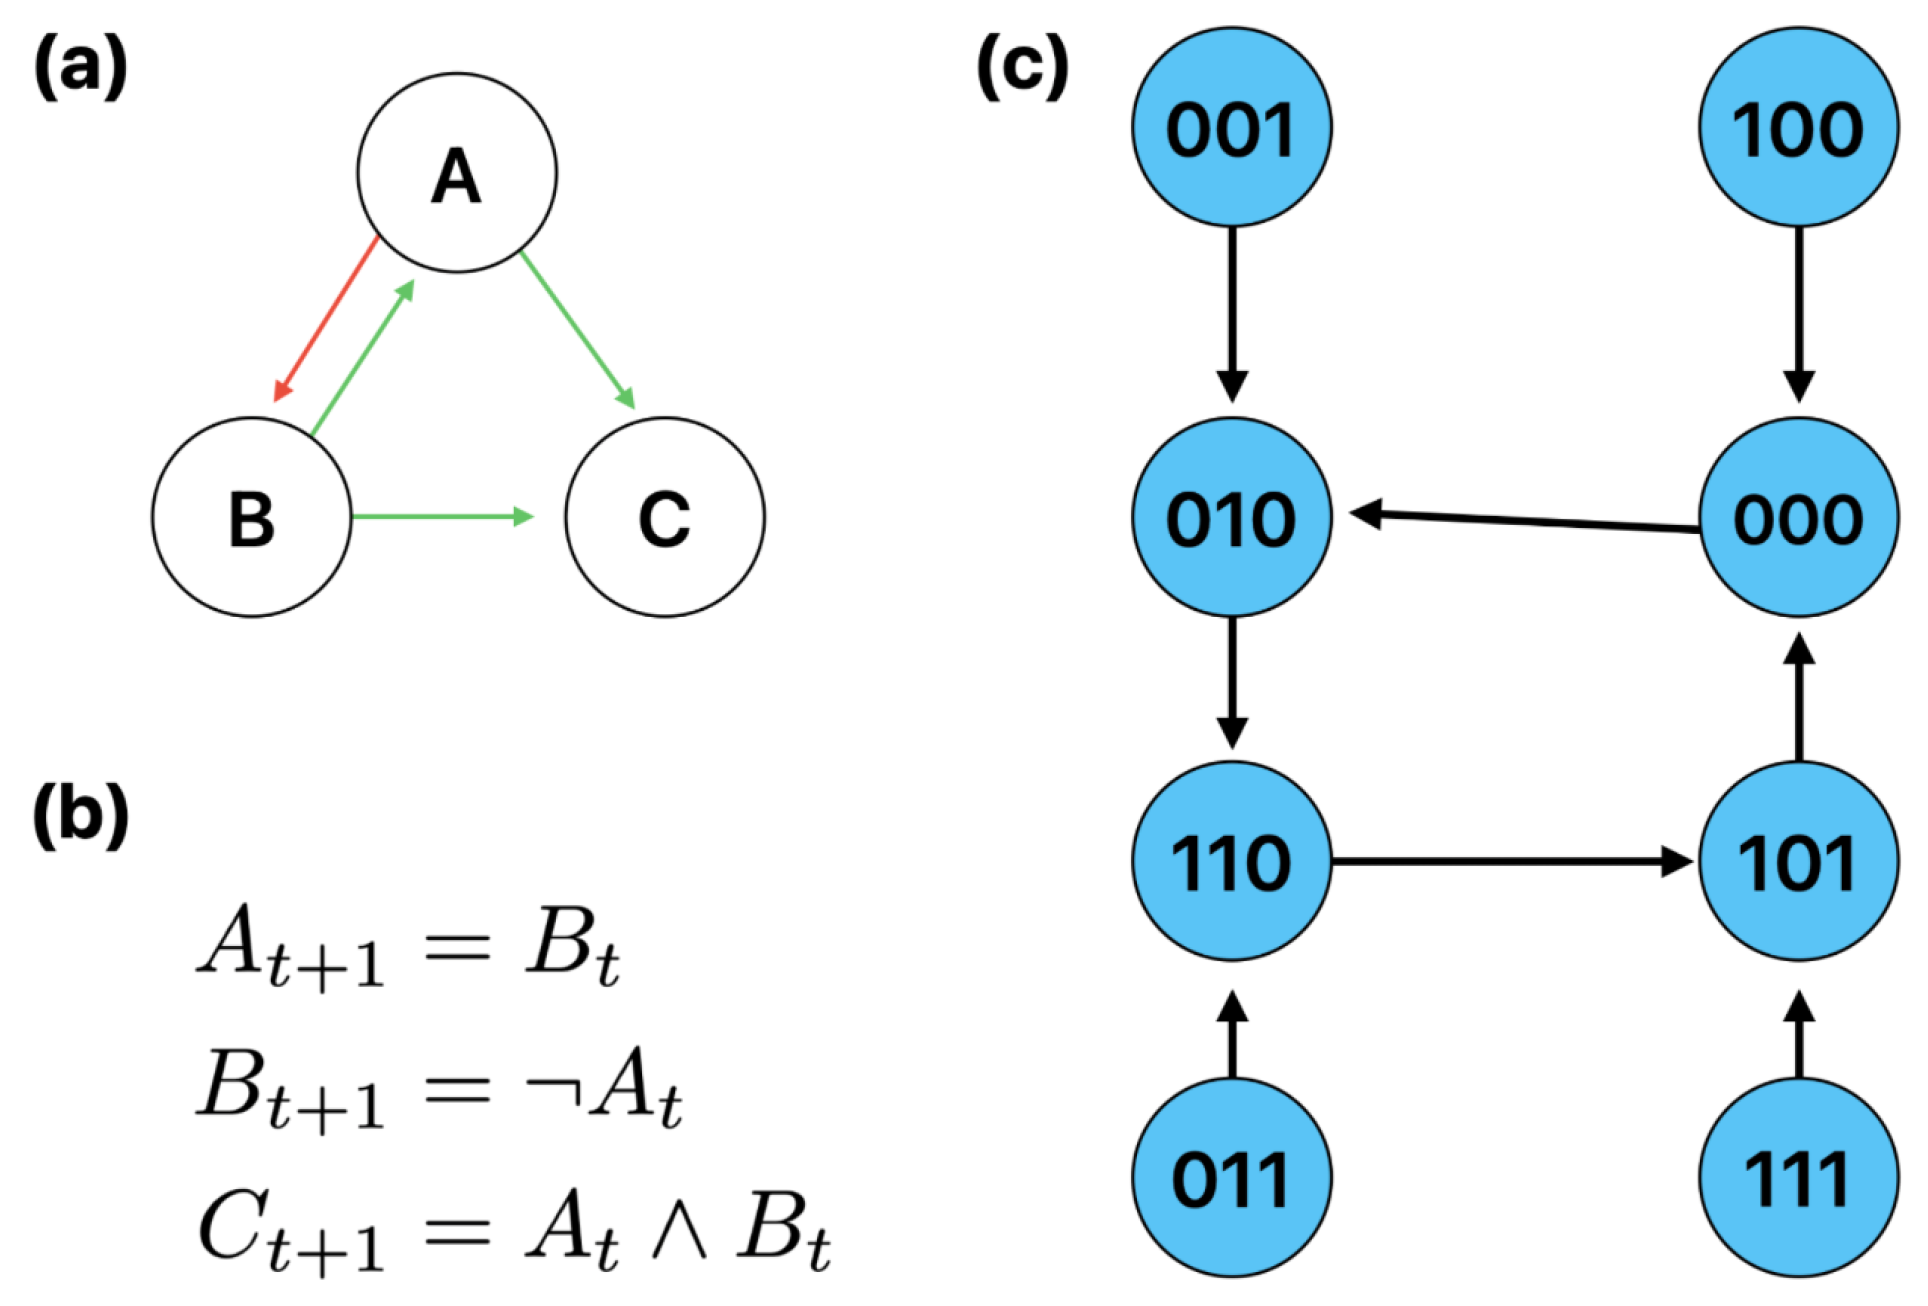
1.2. Boolean Networks and Gene Regulatory Networks
2. Materials and Methods
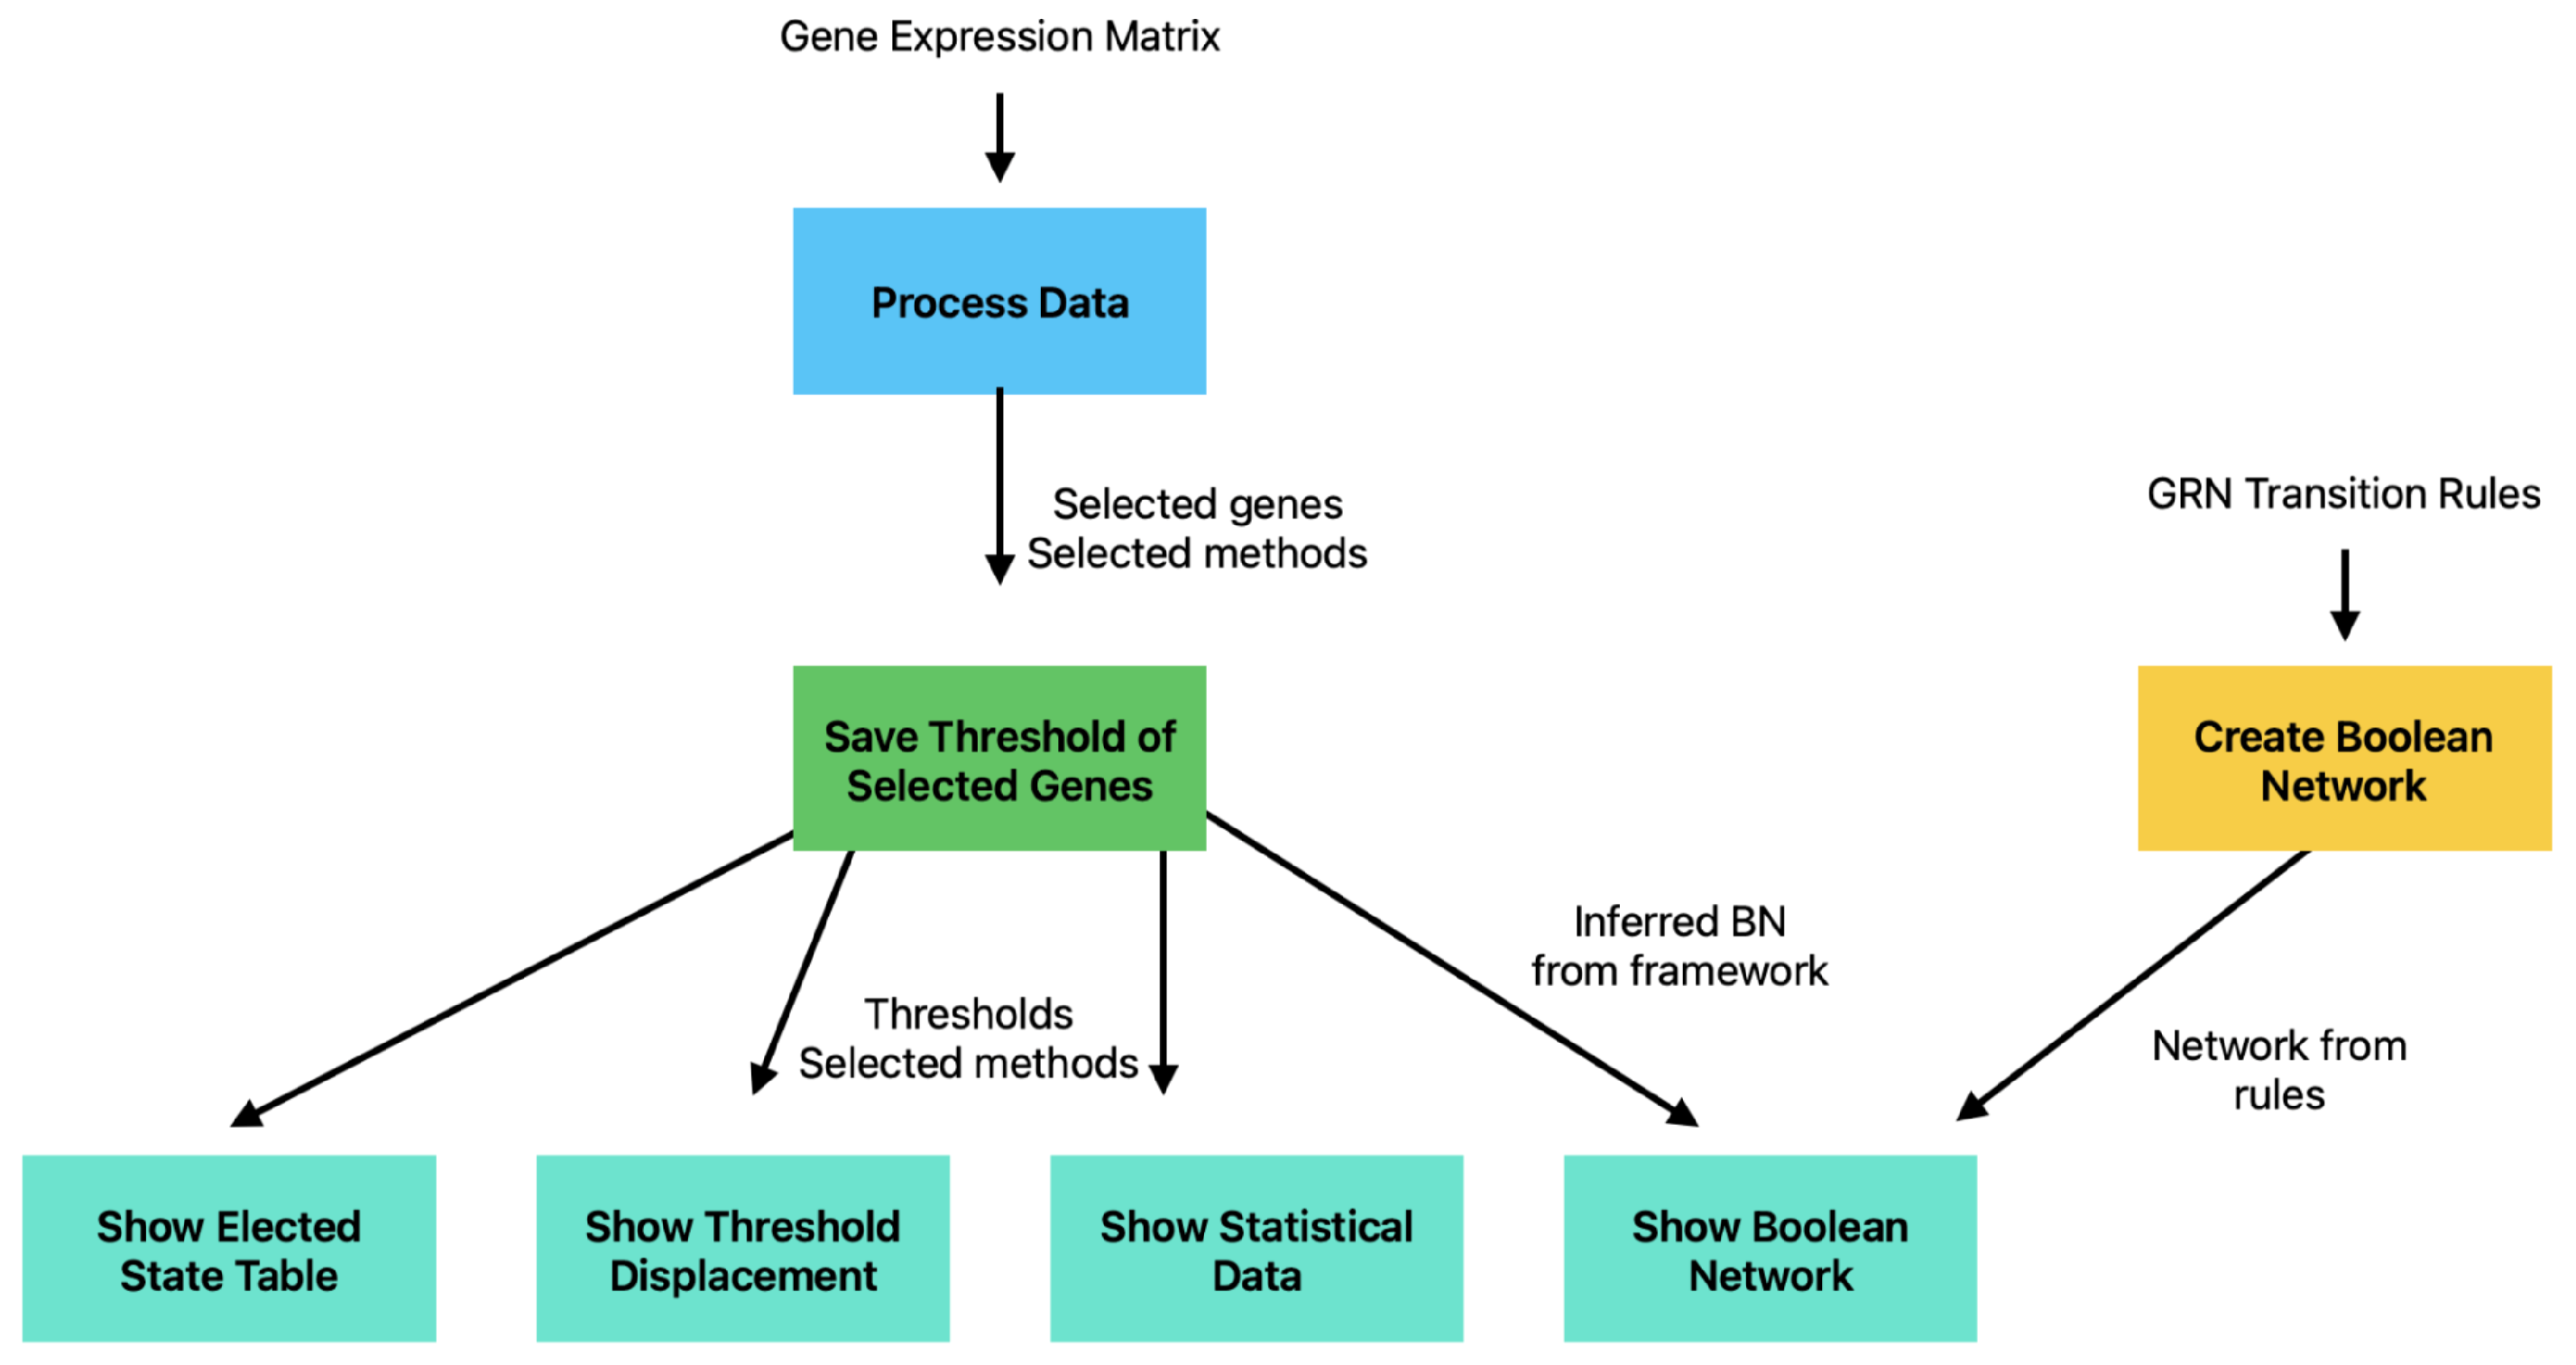
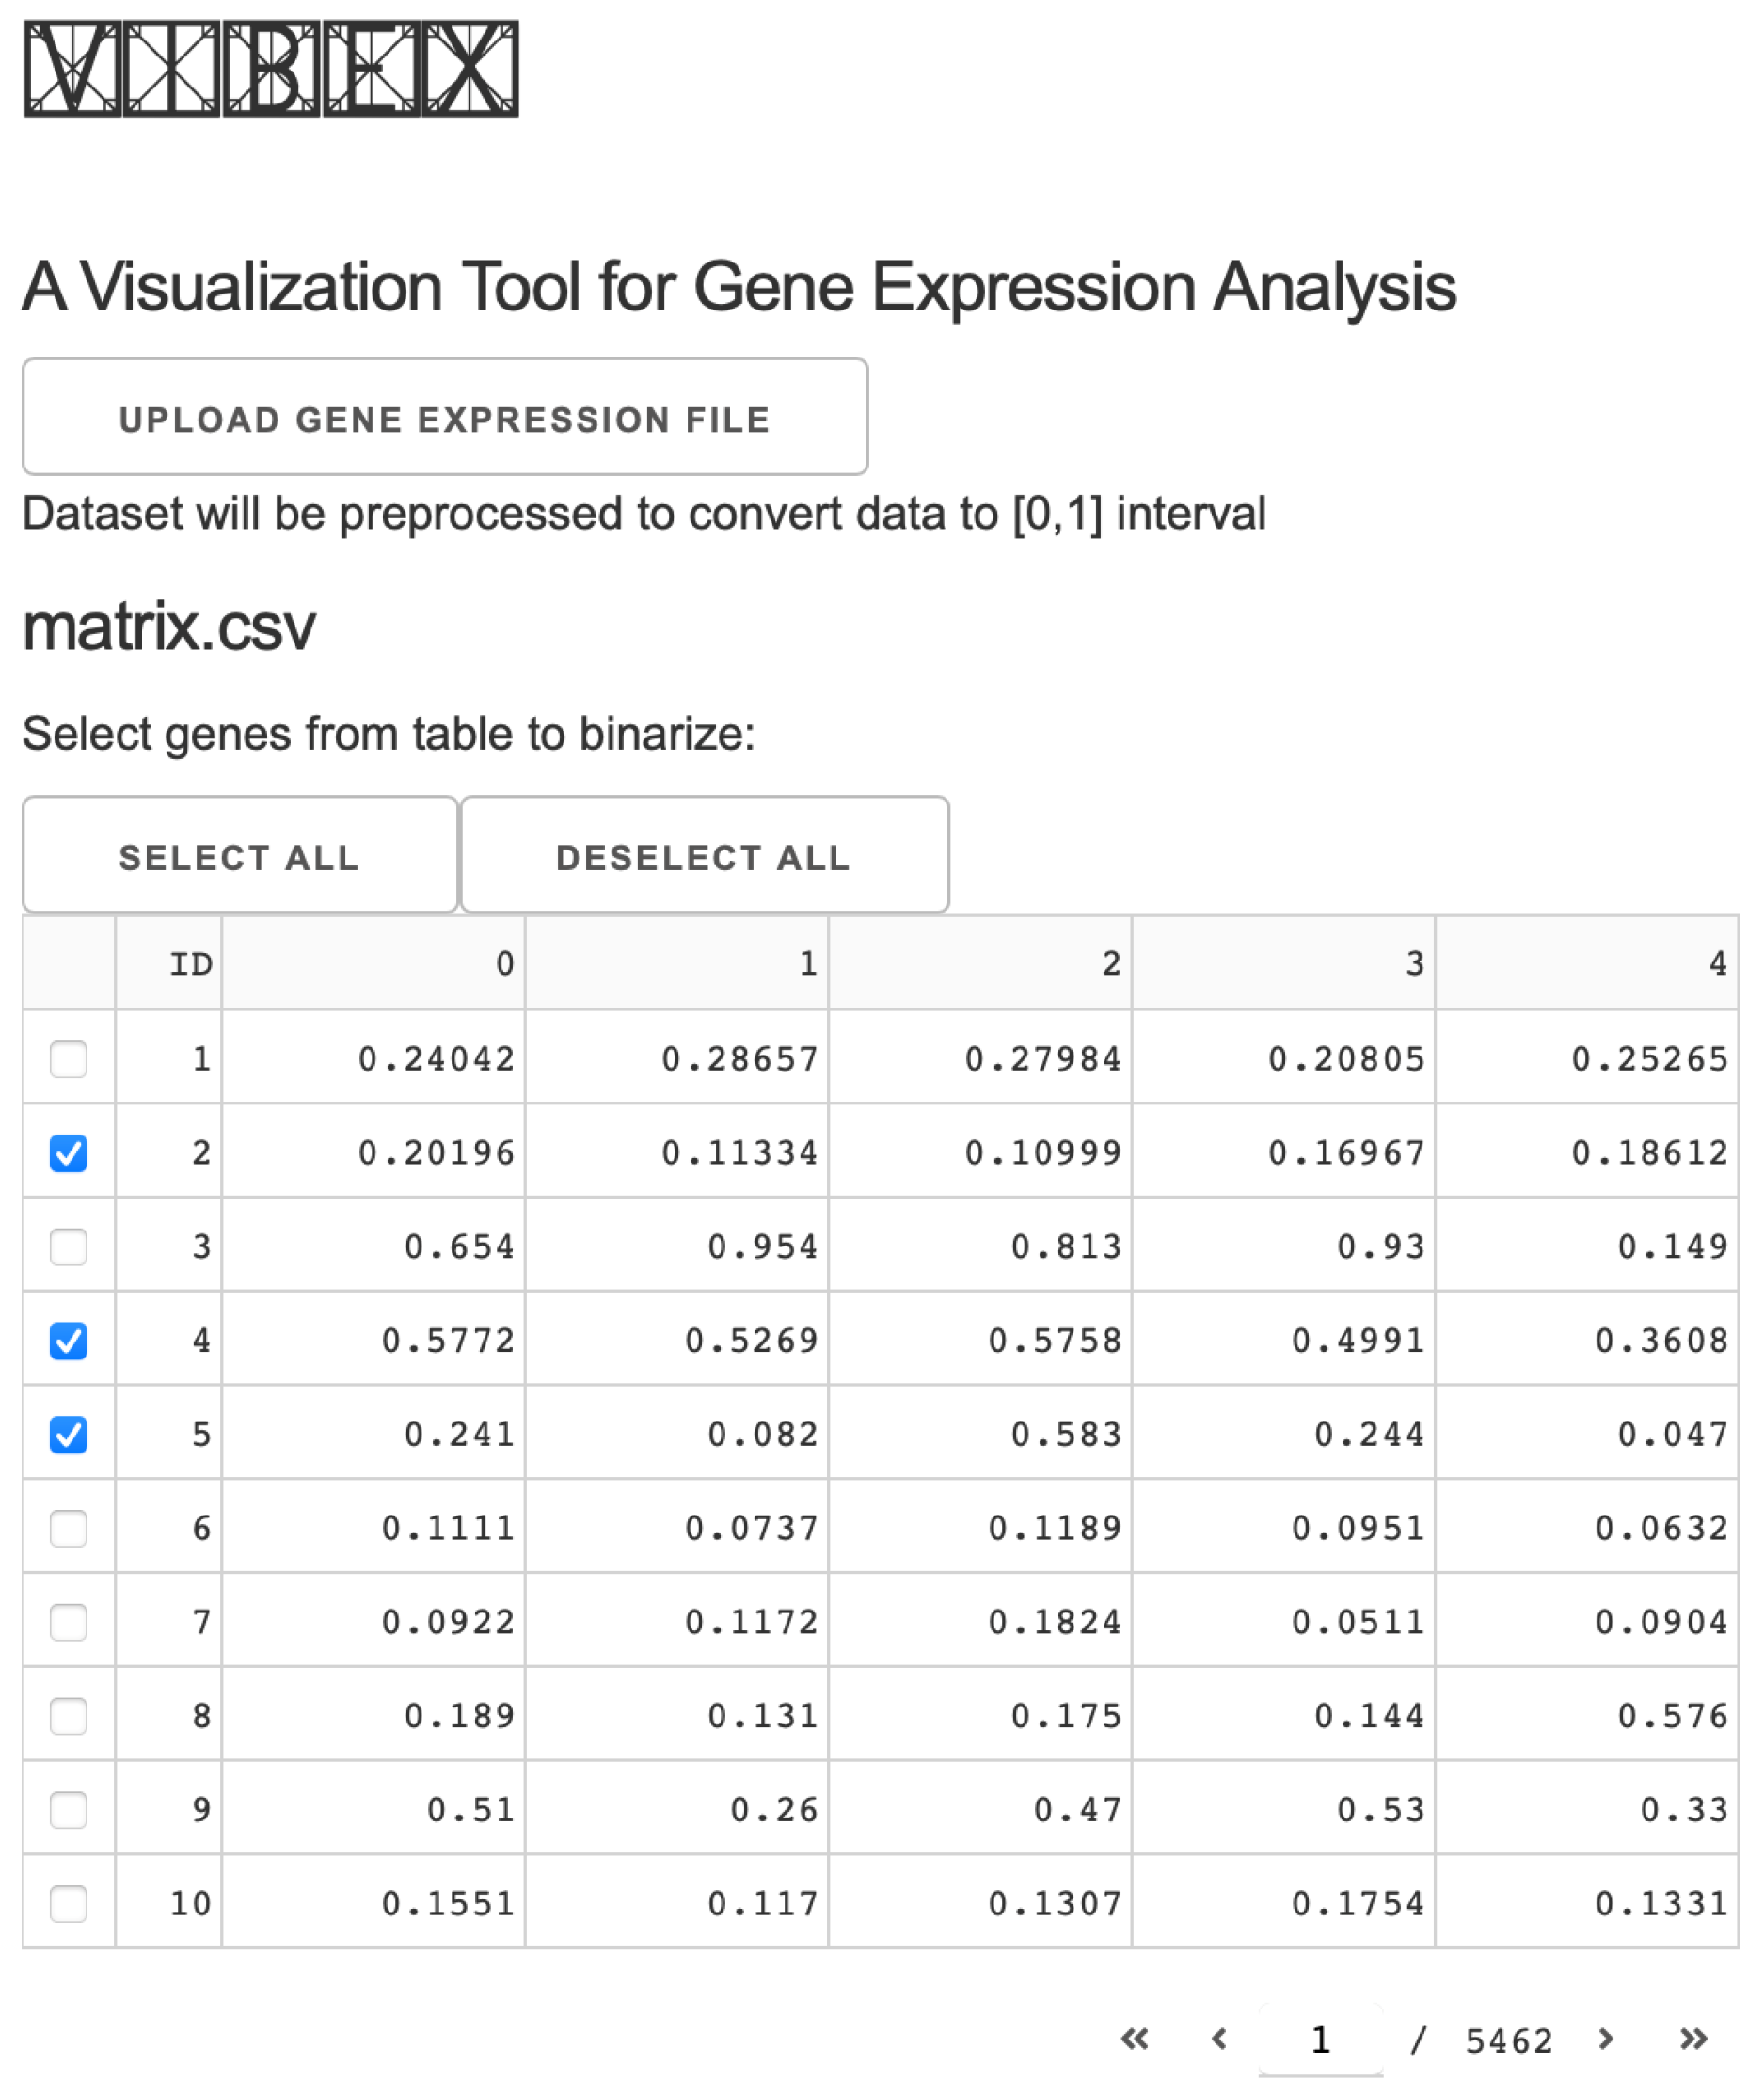
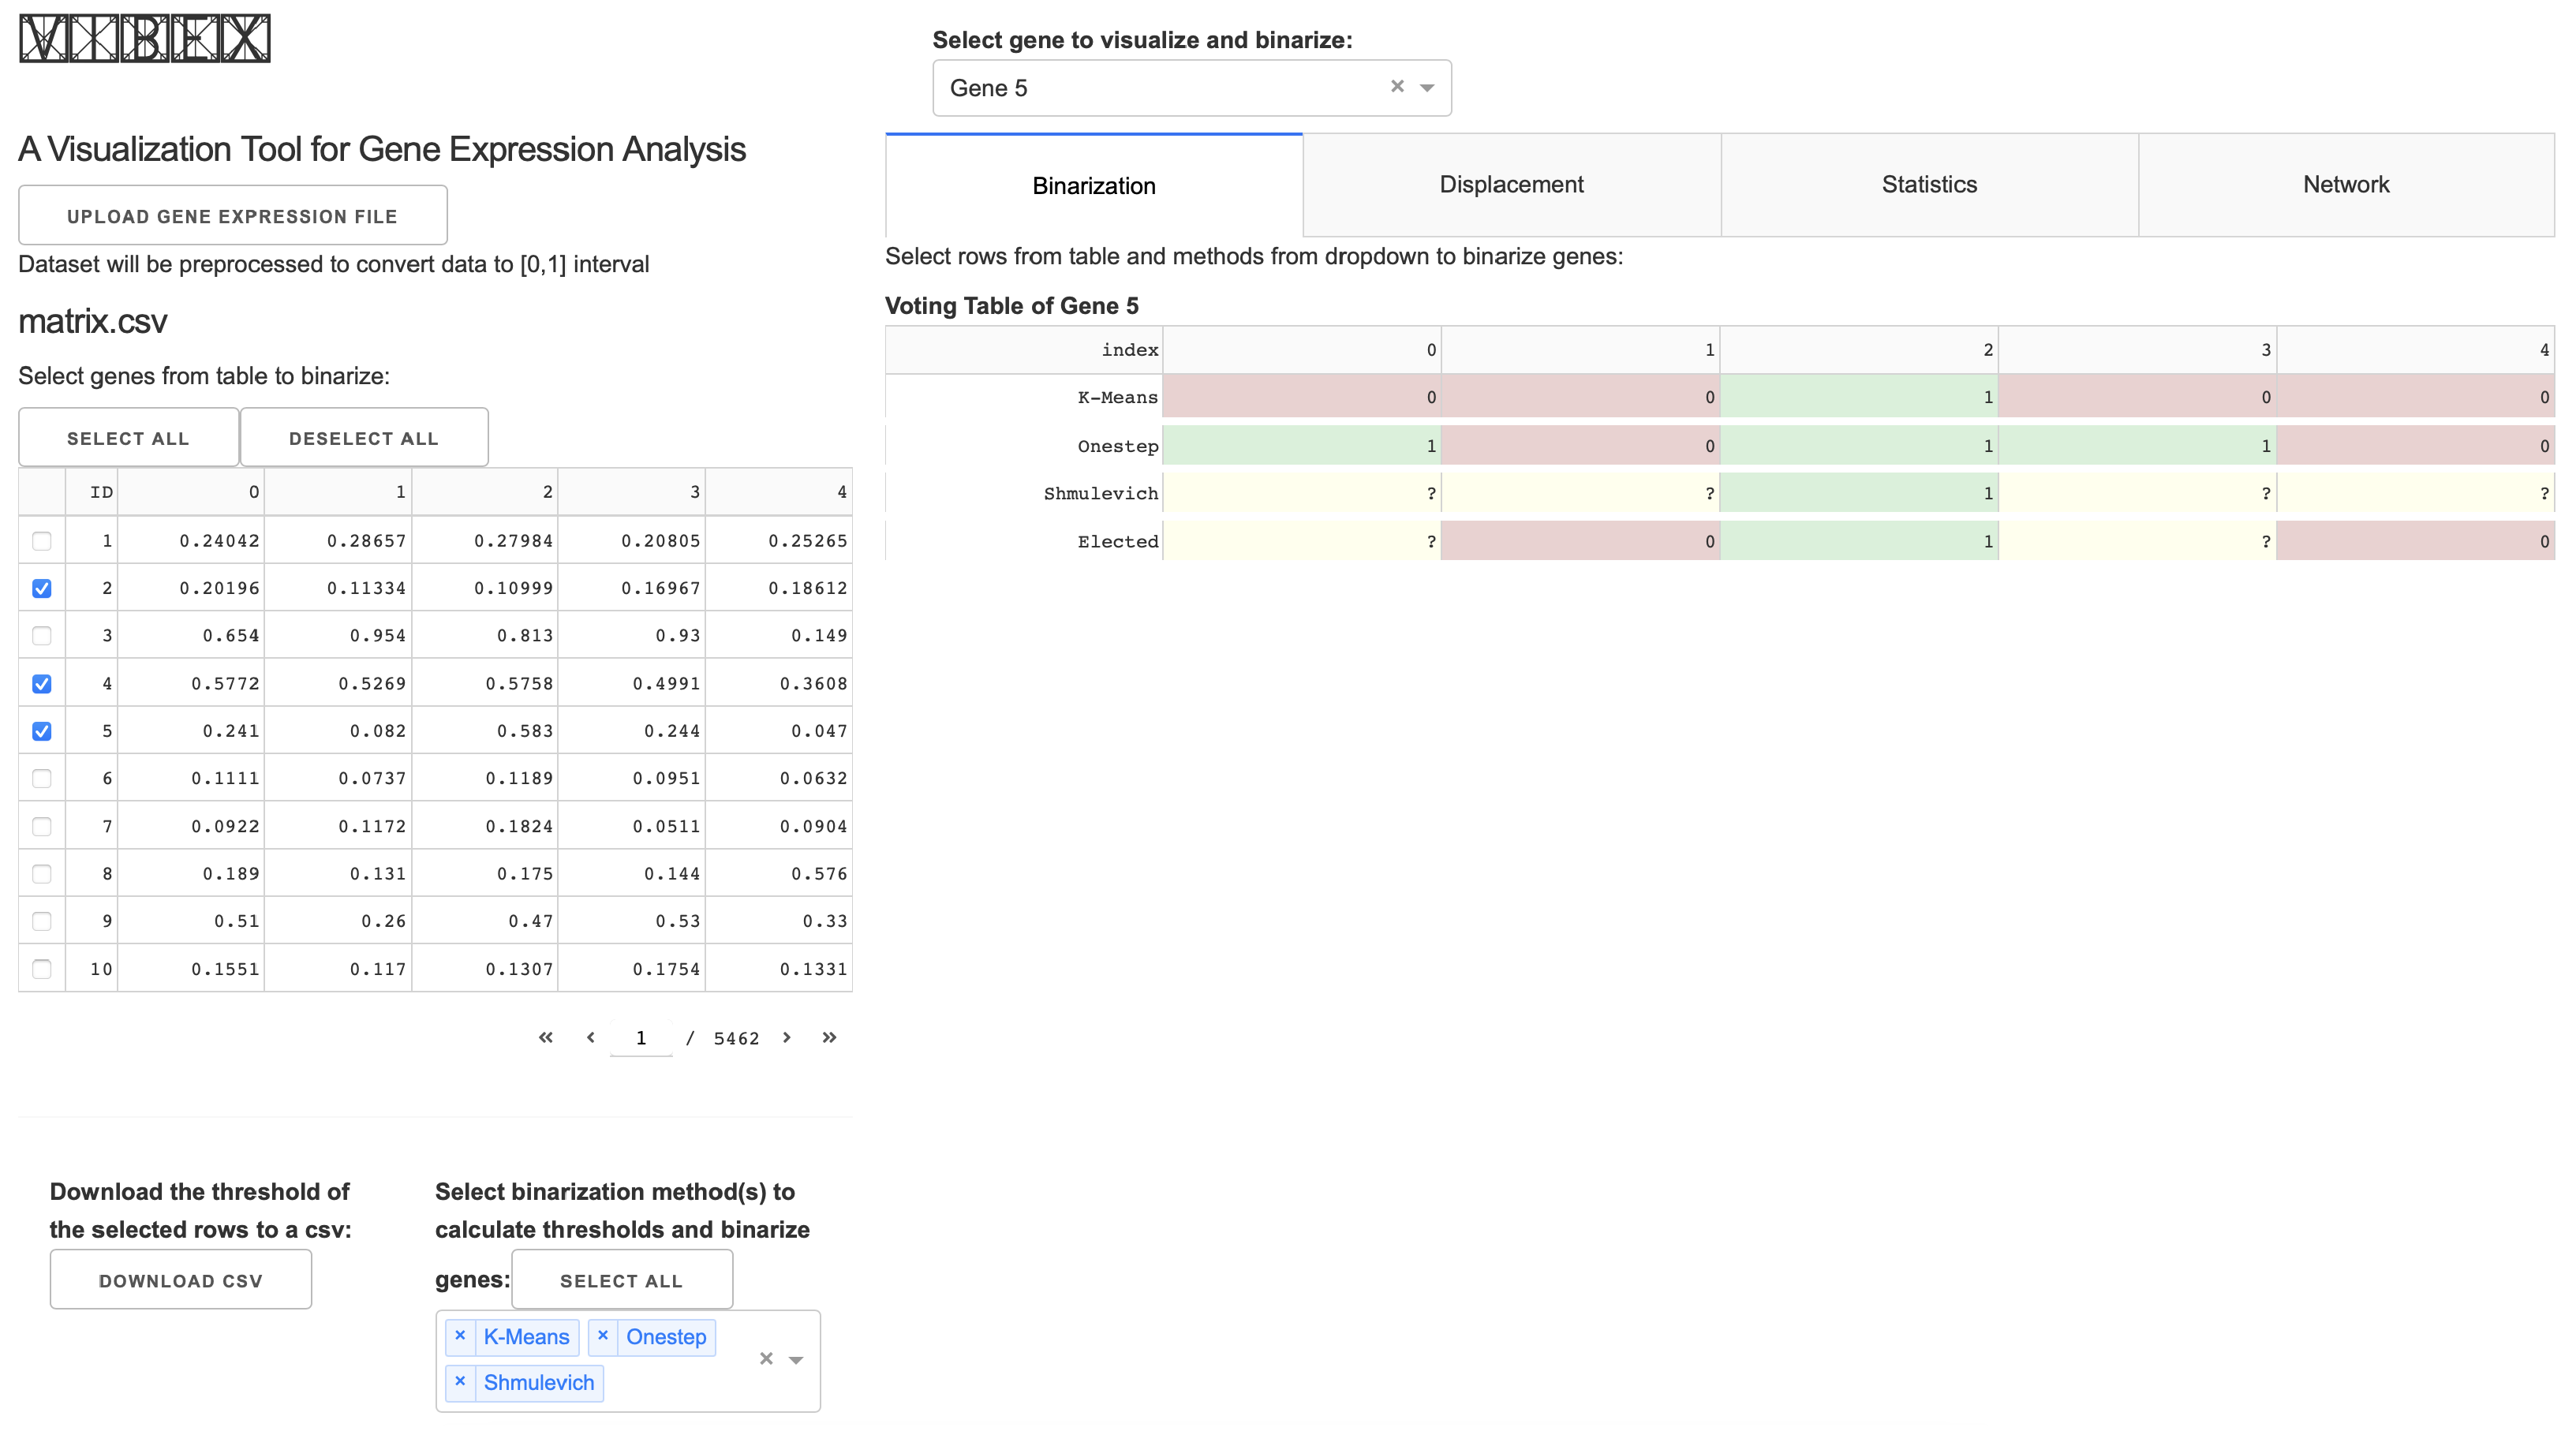
2.1. Dash Framework and Application Structure
| Algorithm 1 Callback for voting table generation |
|
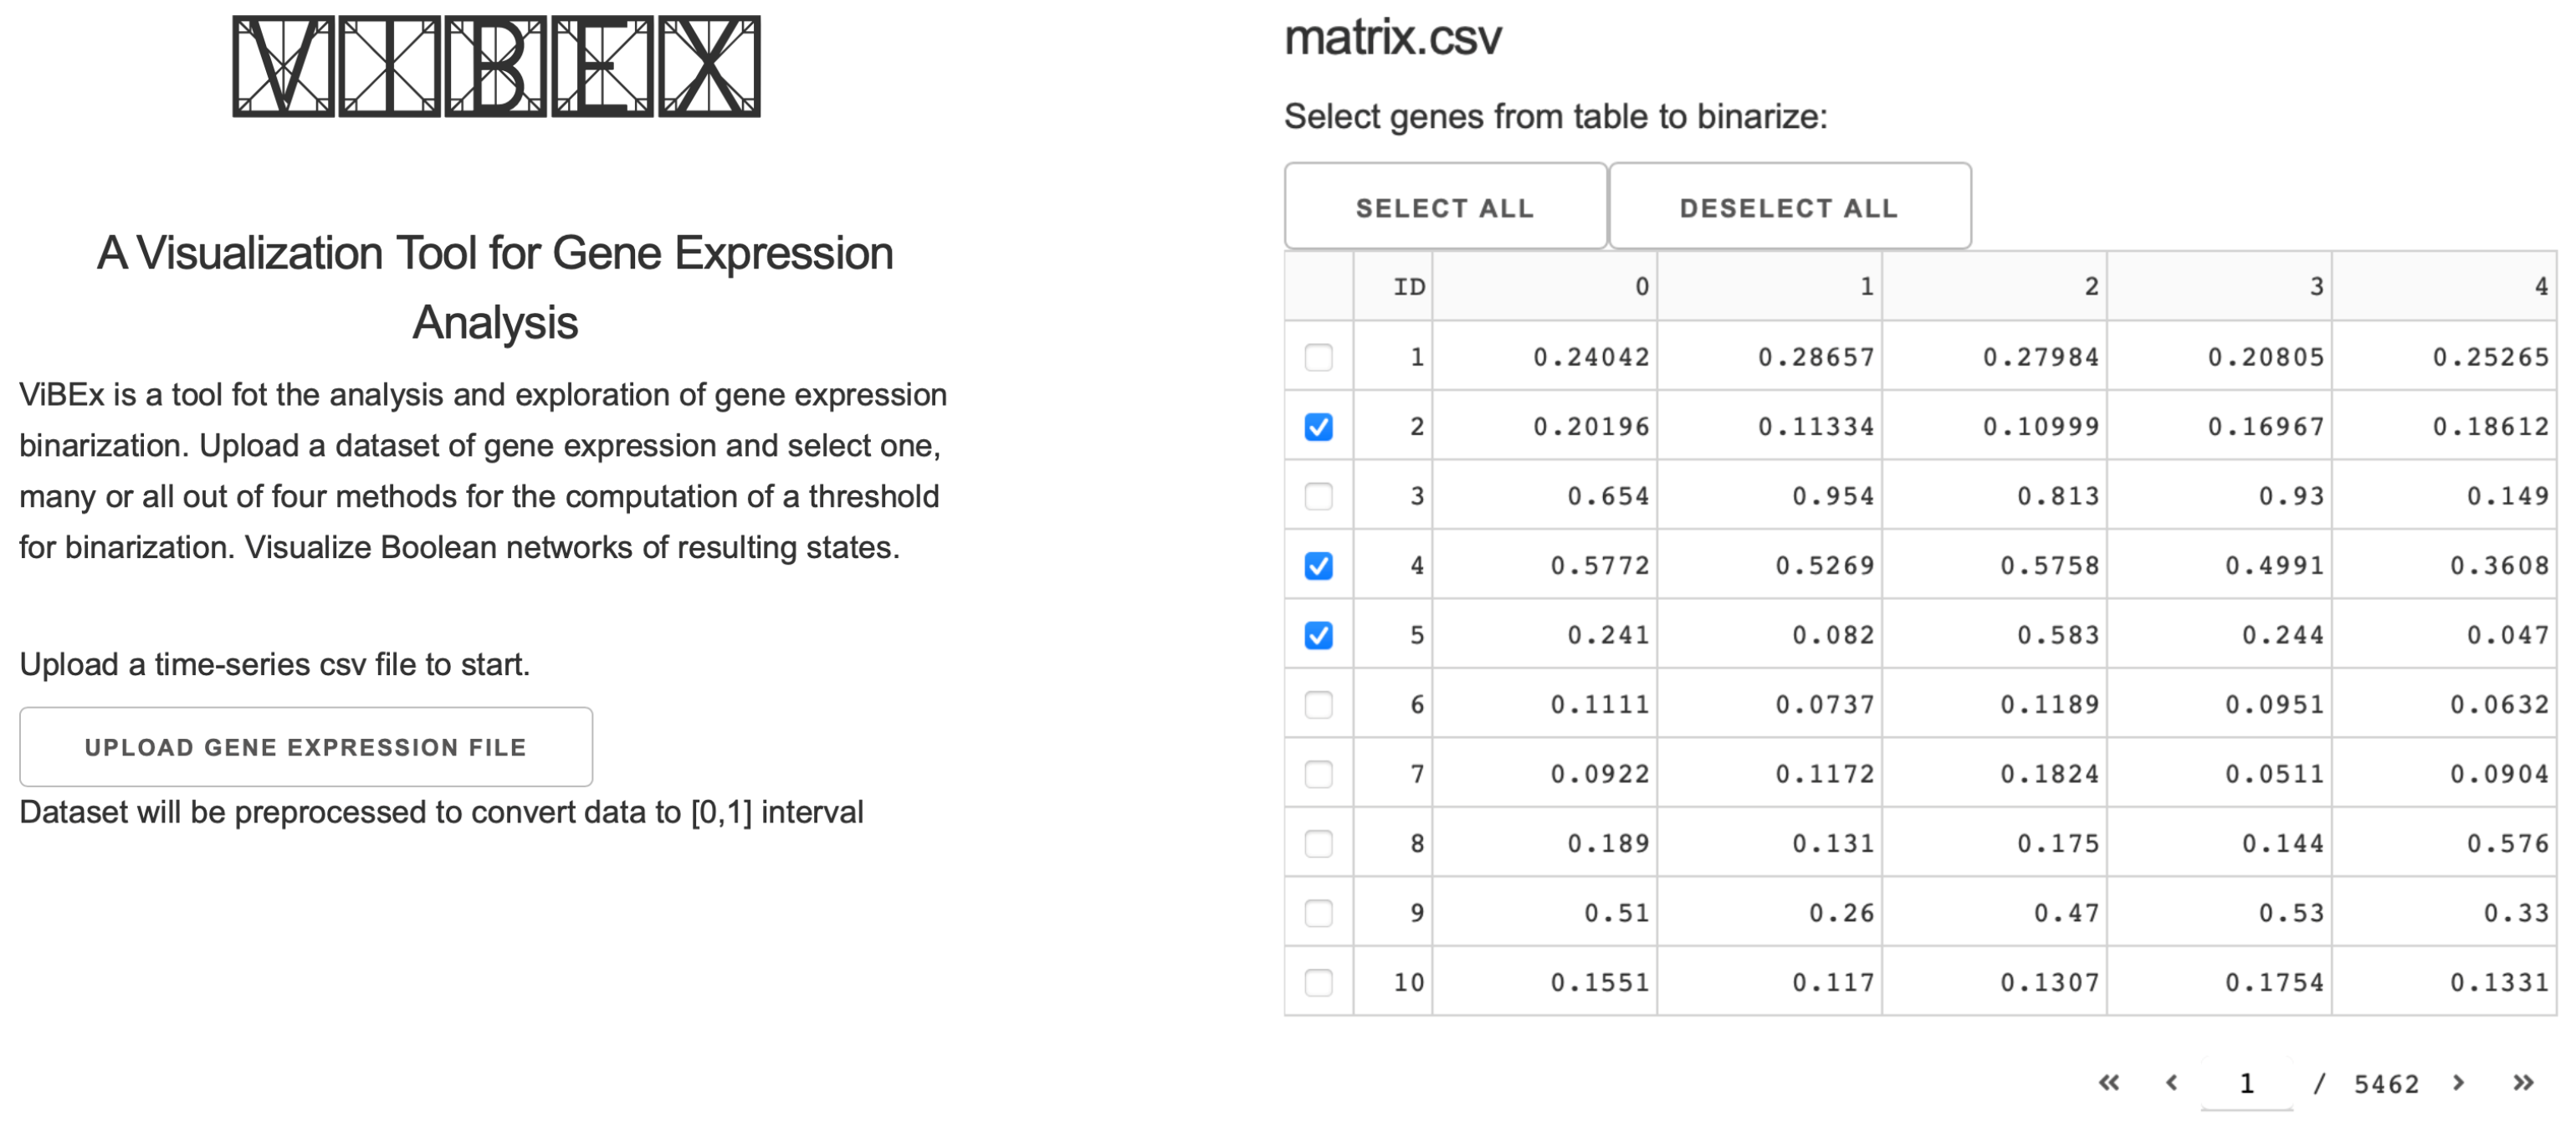
2.2. Implementation
2.2.1. Statistics
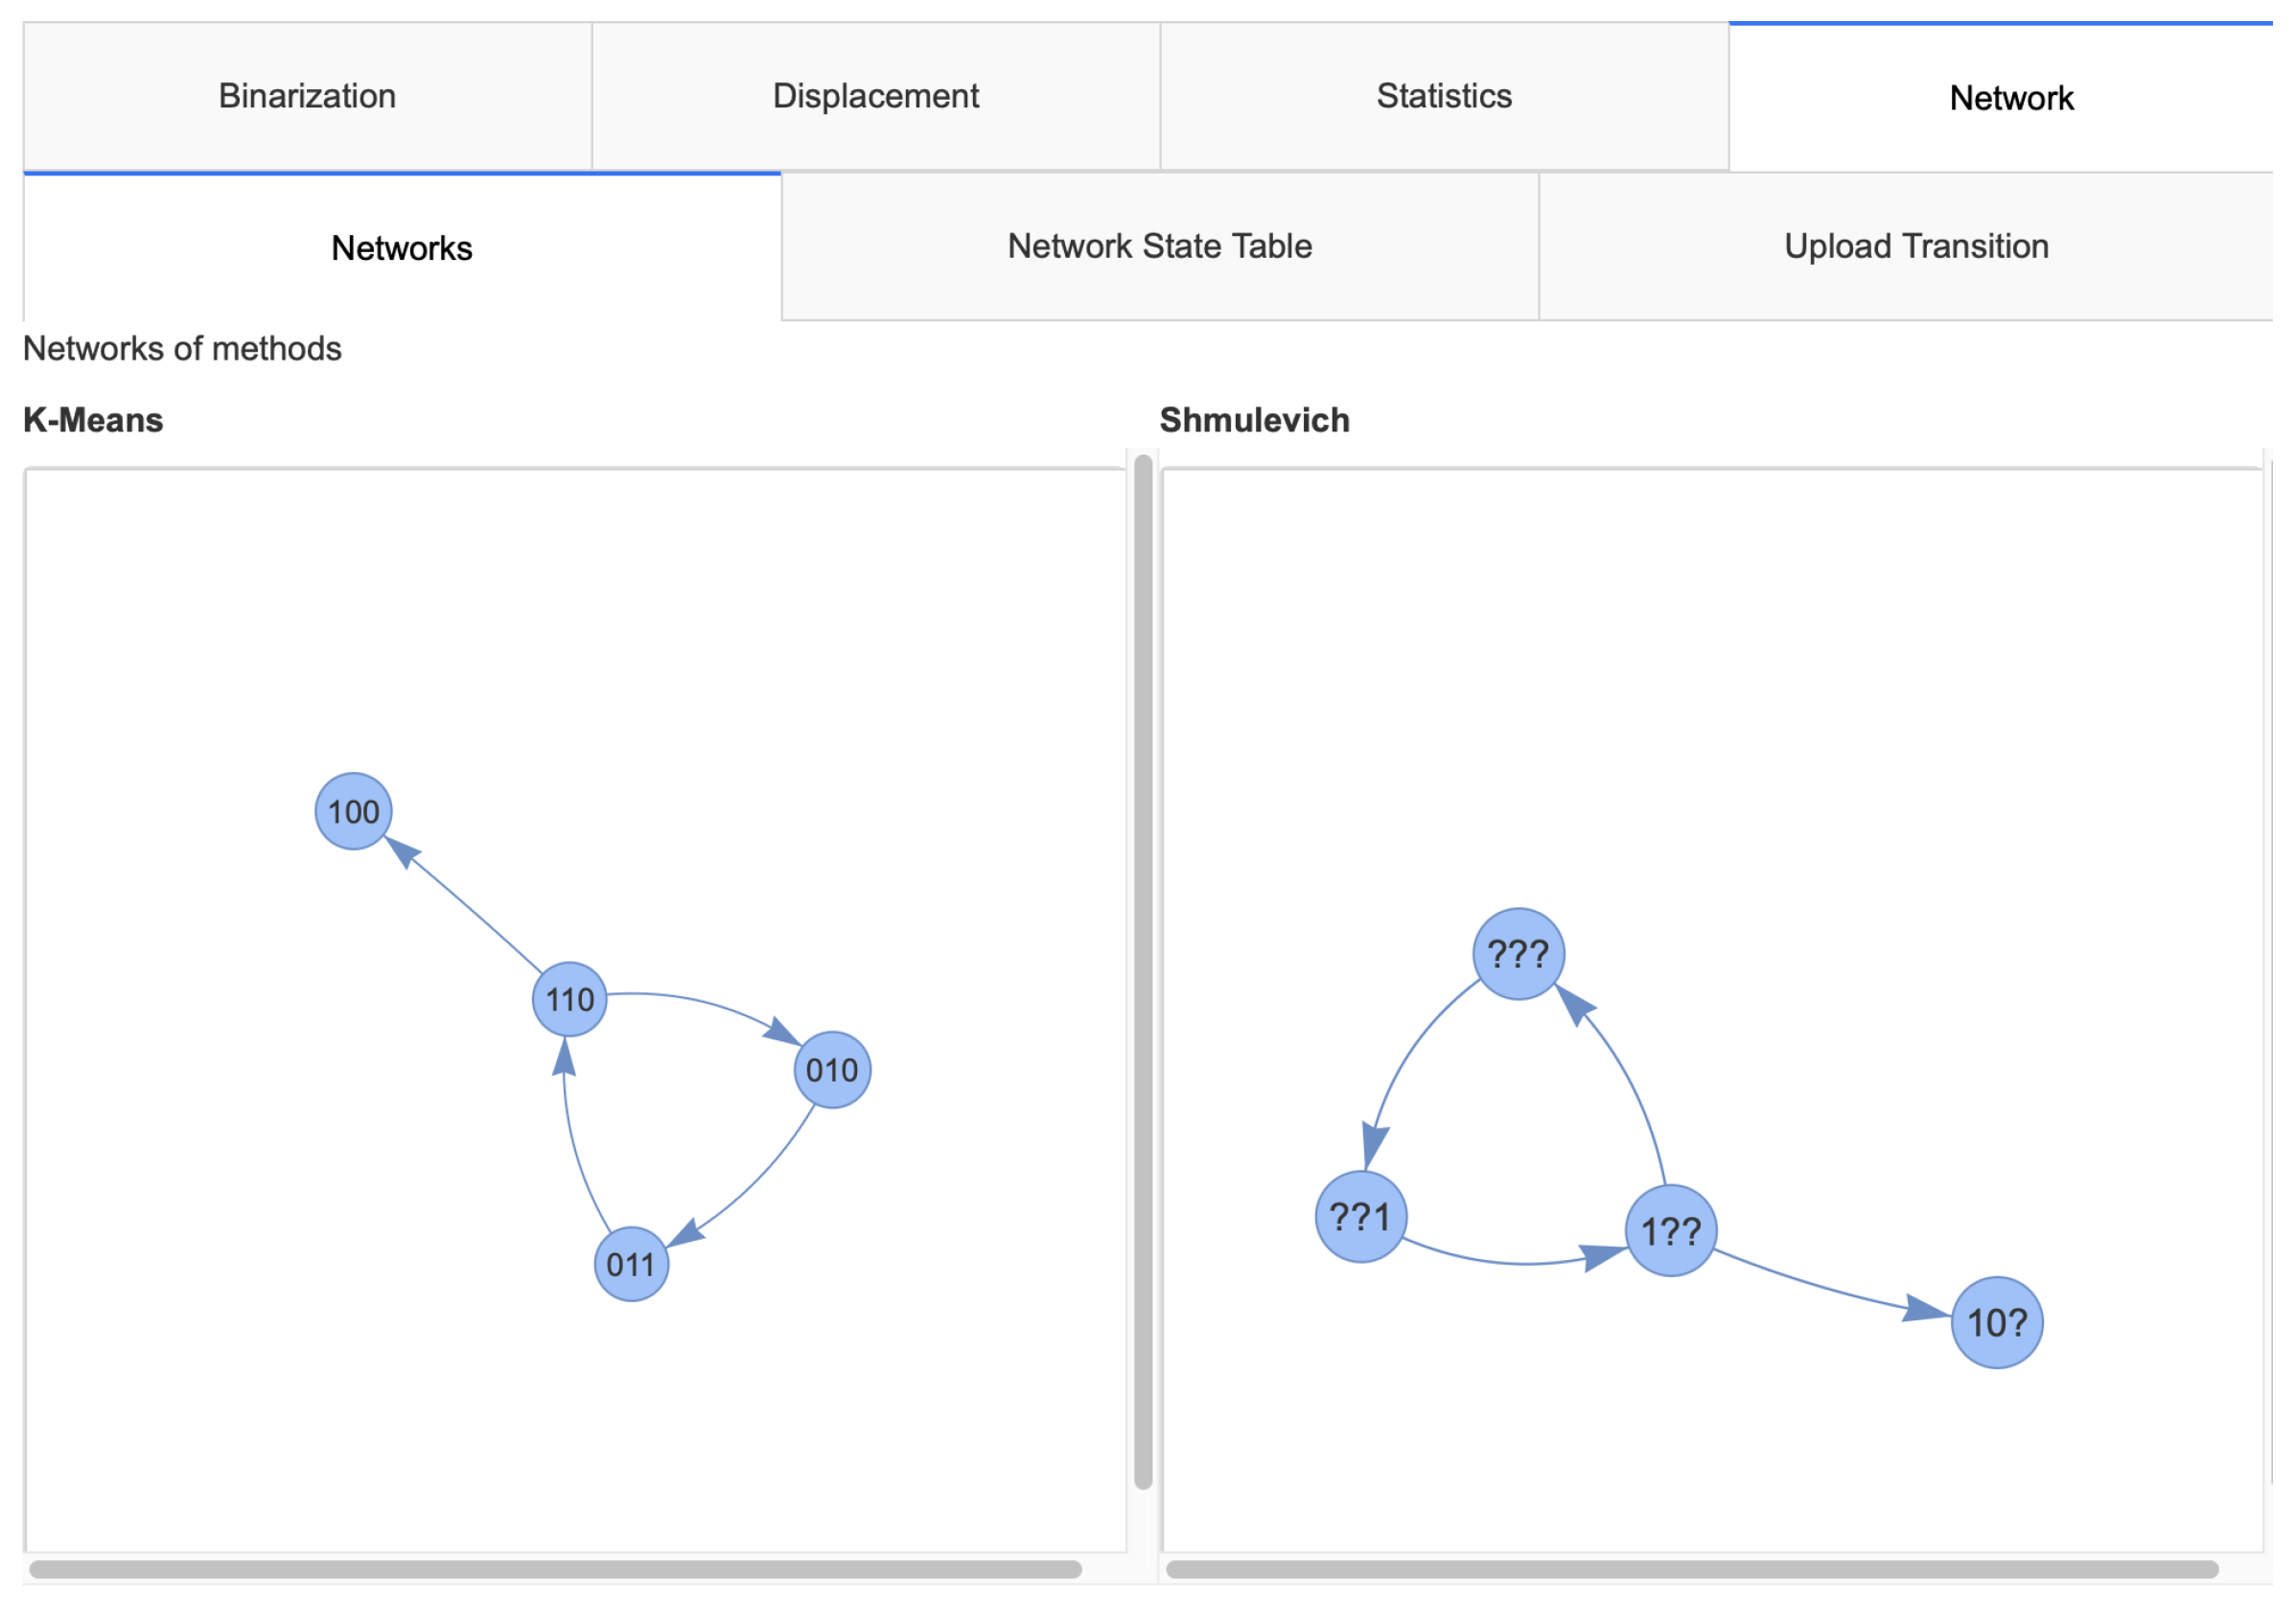
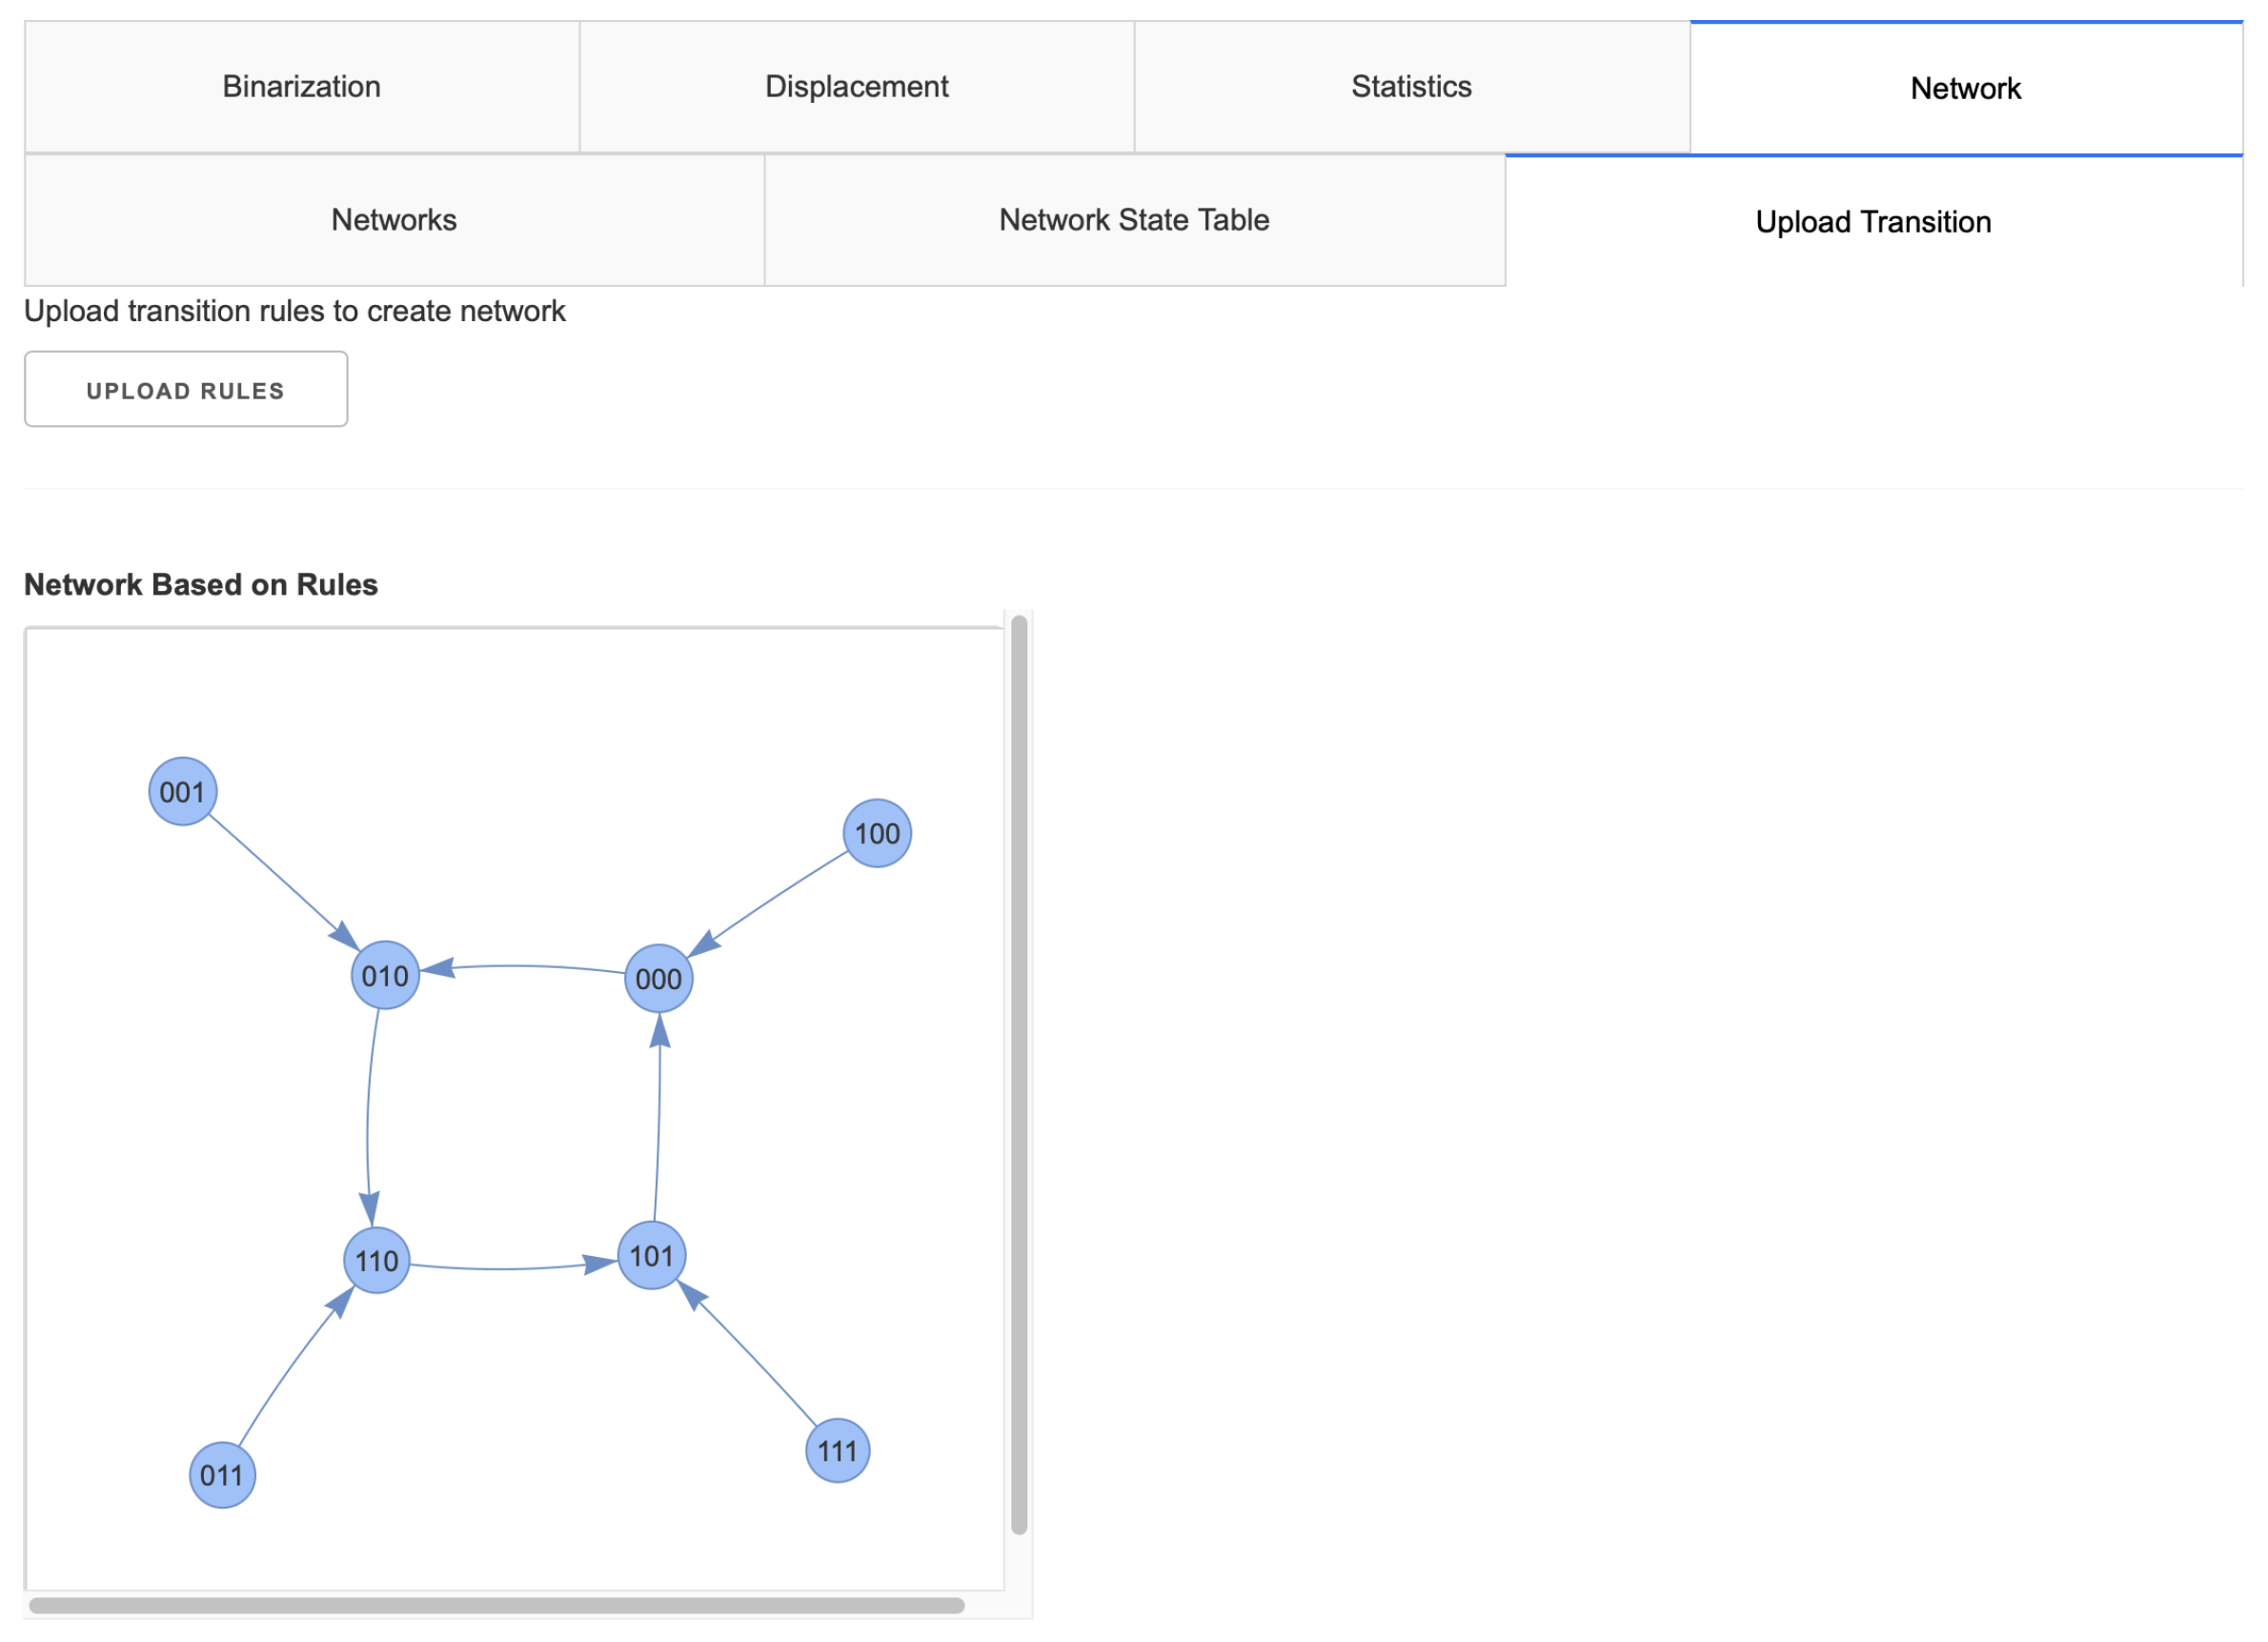
2.2.2. Networks
3. Discussion
Future Work
Author Contributions
Funding
Data Availability Statement
Conflicts of Interest
Abbreviations
| MDPI | Multidisciplinary Digital Publishing Institute |
| GRN | Gene Regulatory Network |
| BN | Boolean Network |
| TCM | Threshold computation method |
Appendix A
Appendix A.1. Dataset Gene Expression

| Gene | t:0 | t:1 | t:2 | t:3 | t:4 |
|---|---|---|---|---|---|
| DDR1 | 2404.2 | 2865.7 | 2798.4 | 2080.5 | 2526.5 |
| RFC2 | 2019.6 | 1133.4 | 1099.9 | 1696.7 | 1861.2 |
| PAX8 | 577.2 | 526.9 | 575.8 | 499.1 | 360.8 |
| GUCA1A | 24.1 | 8.2 | 58.3 | 24.4 | 4.7 |
| CCL5 | 5.1 | 2.6 | 4.7 | 5.3 | 3.3 |
Appendix A.2. Dataset Transition Rules
| Gene | Rule |
|---|---|
| A | B |
| B | not A |
| C | A and B |
References
- MacQueen, J. Some methods for classification and analysis of multivariate observations. In Proceedings of the Fifth Berkeley Symposium on Mathematical Statistics and Probability, Oakland, CA, USA, 21 June–18 July 1965; Volume 1, pp. 281–297. [Google Scholar]
- Hopfensitz, M.; Mussel, C.; Wawra, C.; Maucher, M.; Kuhl, M.; Neumann, H.; Kestler, H.A. Multiscale binarization of gene expression data for reconstructing Boolean networks. IEEE/ACM Trans. Comput. Biol. Bioinform. 2011, 9, 487–498. [Google Scholar] [CrossRef] [PubMed]
- Sahoo, D.; Dill, D.L.; Tibshirani, R.; Plevritis, S.K. Extracting binary signals from microarray time-course data. Nucleic Acids Res. 2007, 35, 3705–3712. [Google Scholar] [CrossRef] [PubMed]
- Shmulevich, I.; Zhang, W. Binary analysis and optimization-based normalization of gene expression data. Bioinformatics 2002, 18, 555–565. [Google Scholar] [CrossRef] [PubMed]
- Seguel, J.; Lluberes, M. Semantics and Accuracy of Gene Expression Threshold Computations. In Proceedings of the 2013 International Conference on Advanced Engineering Computing and Applications in Sciences, IARIA, Porto, Portugal, 29 September–3 October 2013; pp. 1–6. [Google Scholar]
- D’Antonio, J.M.; Ma, C.; Monzon, F.A.; Pflug, B.R. Longitudinal Analysis of Androgen Deprivation of Prostate Cancer Cells Identifies Pathways to Androgen Independence. 2008. Tech. Rep. PRJNA101933. Available online: https://www.ncbi.nlm.nih.gov/bioproject/PRJNA101933 (accessed on 19 December 2024).
- Seguel, J.; Lluberes, M. A unified approach to the computation and analysis of strings of gene expression states. In Proceedings of the 2015 IEEE International Conference on Bioinformatics and Biomedicine (BIBM), Washington, DC, USA, 9–12 November 2015; pp. 1687–1693. [Google Scholar]
- Lluberes, M. A Probabilistic Approach to Gene Expression Analysis. Ph.D. Thesis, University of Puerto Rico, Mayagüez Campus, Mayagüez, PR, USA, 2017. [Google Scholar]
- Shmulevich, I.; Dougherty, E.R.; Zhang, W. From Boolean to probabilistic Boolean networks as models of genetic regulatory networks. Proc. IEEE 2002, 90, 1778–1792. [Google Scholar] [CrossRef]
- Dabbas, E. Interactive Dashboards and Data Apps with Plotly and Dash: Harness the Power of a Fully Fledged Frontend Web Framework in Python–No JavaScript Required; Packt Publishing Ltd.: Birmingham, UK, 2021. [Google Scholar]
- Oosterbaan, R. Frequency and regression analysis of hydrologic data. Drain. Princ. Appl. Publ. 1994, 16, 175–223. [Google Scholar]
- Park, K.I.; Park, M. Fundamentals of Probability and Stochastic Processes with Applications to Communications; Springer: Berlin/Heidelberg, Germany, 2018. [Google Scholar]


Disclaimer/Publisher’s Note: The statements, opinions and data contained in all publications are solely those of the individual author(s) and contributor(s) and not of MDPI and/or the editor(s). MDPI and/or the editor(s) disclaim responsibility for any injury to people or property resulting from any ideas, methods, instructions or products referred to in the content. |
© 2025 by the authors. Licensee MDPI, Basel, Switzerland. This article is an open access article distributed under the terms and conditions of the Creative Commons Attribution (CC BY) license (https://creativecommons.org/licenses/by/4.0/).
Share and Cite
Terrefortes-Rosado, M.H.; Nieves-Rivera, A.V.; Ortiz-Zuazaga, H.; Lluberes-Contreras, M. ViBEx: A Visualization Tool for Gene Expression Analysis. BioMedInformatics 2025, 5, 13. https://doi.org/10.3390/biomedinformatics5010013
Terrefortes-Rosado MH, Nieves-Rivera AV, Ortiz-Zuazaga H, Lluberes-Contreras M. ViBEx: A Visualization Tool for Gene Expression Analysis. BioMedInformatics. 2025; 5(1):13. https://doi.org/10.3390/biomedinformatics5010013
Chicago/Turabian StyleTerrefortes-Rosado, Michael H., Andrea V. Nieves-Rivera, Humberto Ortiz-Zuazaga, and Marie Lluberes-Contreras. 2025. "ViBEx: A Visualization Tool for Gene Expression Analysis" BioMedInformatics 5, no. 1: 13. https://doi.org/10.3390/biomedinformatics5010013
APA StyleTerrefortes-Rosado, M. H., Nieves-Rivera, A. V., Ortiz-Zuazaga, H., & Lluberes-Contreras, M. (2025). ViBEx: A Visualization Tool for Gene Expression Analysis. BioMedInformatics, 5(1), 13. https://doi.org/10.3390/biomedinformatics5010013