Systematic Review

Navigating the Complexity of Psychotic Disorders: A Systematic Review of EEG Microstates and Machine Learning

1
Faculty of Philosophy, Vita-Salute San Raffaele University, 20132 Milan, Italy
2
Schizophrenia Research and Clinical Unit, IRCCS San Raffaele Hospital, 20127 Milan, Italy
3
School of Medicine, Vita-Salute San Raffaele University, 20132 Milan, Italy
4
Department of Food and Drug, University of Parma, 43121 Parma, Italy
5
Department of Humanities and Life Sciences, University School for Advanced Studies IUSS, 27100 Pavia, Italy
*
Author to whom correspondence should be addressed.
BioMedInformatics 2025, 5(1), 8; https://doi.org/10.3390/biomedinformatics5010008
Submission received: 23 December 2024 / Revised: 31 January 2025 / Accepted: 3 February 2025 / Published: 5 February 2025

Abstract

:
EEG microstates are brief, stable topographical configurations of brain activity that provide insights into alterations in brain function and connectivity. Anomalies in microstates are associated with different neuropsychiatric conditions, especially schizophrenia. Recent advances in both EEG techniques and machine learning point to the potential role of microstates as diagnostic markers for psychotic disorders. This systematic review aims to gather current knowledge on machine learning applied to EEG microstate analysis in psychotic disorders. Following PRISMA guidelines, we searched Scopus, PubMed, and Scholar databases, including 10 studies. Overall results show that EEG microstates can be used to accurately classify diagnoses within the psychosis spectrum, across all stages, outperforming models based on conventional EEG measures, with a prominent role of microstate D. One study also suggests that microstate anomalies may be directly linked to symptom severity. Integrating EEG microstates with machine learning shows promise in improving our understanding of psychotic disorders and developing more precise diagnostic tools.

1. Introduction

Psychoses, including schizophrenia, represent a range of psychiatric disorders characterized by significant disturbances in perception, thinking, and behavior [1,2]. These conditions can manifest through symptoms such as delusions, hallucinations, and disorganized thinking, profoundly affecting individuals’ ability to understand and engage with the world around them [3].
Among the psychotic disorders, schizophrenia affects approximately 1% of the population and has a profound impact on individual functionality and social integration. The disorder is associated with substantial impairments in social and occupational skills, alongside a considerable emotional and economic burden on caregivers and healthcare systems [4]. Furthermore, individuals with schizophrenia often experience a reduced quality of life, emphasizing the necessity for effective understanding and targeted interventions [5,6,7].
The pathophysiology of schizophrenia is a multifaceted and intricate domain of study, involving diverse mechanisms and pathways [8,9,10]. A consistent finding within this framework is the disruption of neuronal interactions. Recent advancements in neuroimaging have highlighted the “disconnection hypothesis”, which posits that schizophrenia may result from impaired communication between distinct brain regions [11,12,13]. Functional neuroimaging studies have revealed alterations in critical brain networks in schizophrenia, including the default mode network (DMN) and the fronto-parietal network (FPN), which are essential for higher cognitive functions such as attention, working memory, and self-awareness. These disruptions in connectivity may underlie the characteristic disorganization of thought and other core symptoms of the disorder [13,14,15,16,17].
Electroencephalography (EEG) serves as a valuable tool for investigating the neurophysiological underpinnings of psychoses due to its high temporal resolution and ability to capture brain dynamics in real time [18]. Among the EEG methodologies, microstates—short, stable topographical configurations of electrical brain activity lasting approximately 60–120 milliseconds—are particularly informative. These microstates are thought to reflect transient functional states of large-scale brain networks, offering insights into functional connectivity and representing the building blocks of mental activity. They are canonically categorized into four main clusters (A, B, C, and D) based on their topology, each associated with distinct functions. For instance, the A cluster is linked to auditory processing, the B to visual information processing, the C to default mode network (DMN), and the D to attentional processes [19,20].
Research has identified significant alterations in the duration, frequency, and transitions of microstates in individuals with schizophrenia, with microstates C and D emerging as central to the disorder. These findings suggest disruptions in the temporal coordination of neural networks, supporting the hypothesis of disconnection and impaired integration of different brain functional networks involved in cognitive processes and responses to internal and external stimuli. Originally described by Lehmann et al. in studies between 1971 and 1987 [21,22], the study of microstates has gained renewed interest in recent years, driven by advances in high-density EEG techniques and computational analysis, allowing for a deeper exploration of these critical neural dynamics [18,23,24].

1.1. EEG Microstates and Machine Learning

In recent years, machine learning has increasingly been recognized as a valuable tool in neuroscience, offering advanced capabilities for analyzing complex datasets. These sets of computational techniques allow systems to identify patterns and make predictions based on data without requiring explicit programming [25,26]. Machine learning methods have already been applied within EEG microstate analysis to support the identification of electrical templates of brain activity. Frequently utilized techniques include clustering algorithms, such as k-means and hierarchical clustering, which categorize topographical data into distinct microstate classes. Hidden Markov Models (HMMs) are also applied to model the temporal dynamics of microstates, capturing transitions between states in a probabilistic manner.
The output of microstate analysis is typically characterized by parameters such as duration (the average time a microstate remains stable), coverage (the proportion of recording time occupied by each microstate), occurrence (the frequency of appearance per second), and transition probabilities between microstates. These parameters are essential for comparing brain activity across individuals and conditions, providing insights into functional connectivity and cognitive processes. Nonetheless, classical parameters and statistical approaches might miss the identification of slight differences or composite patterns in microstate sequences [19,20,27].
Machine learning models can further exploit these neurophysiological data, combining them with clinical information for a range of applications. These models are particularly useful as classifiers in diagnostic processes or as predictors of clinical outcomes. The intricate sequences of microstates, reflecting the underlying dynamics of large-scale brain networks, offer a compelling field for machine learning techniques capable of identifying subtle and complex patterns. For instance, supervised classification or unsupervised clustering might uncover relationships between microstate features and clinical or behavioral variables. These approaches could reveal associations with specific pathophysiological processes or predict outcomes such as symptom severity or treatment response. While such applications remain an area of active exploration, they hold the potential to significantly enhance our understanding of brain function and dysfunction in psychoses [25,26]. Table 1 presents a summary of the most employed machine learning models [28,29,30].
Given these premises, we have decided to conduct a systematic review examining the available literature on EEG microstates in psychoses. This review will synthesize current findings and explore how machine learning has been applied to advance this field.

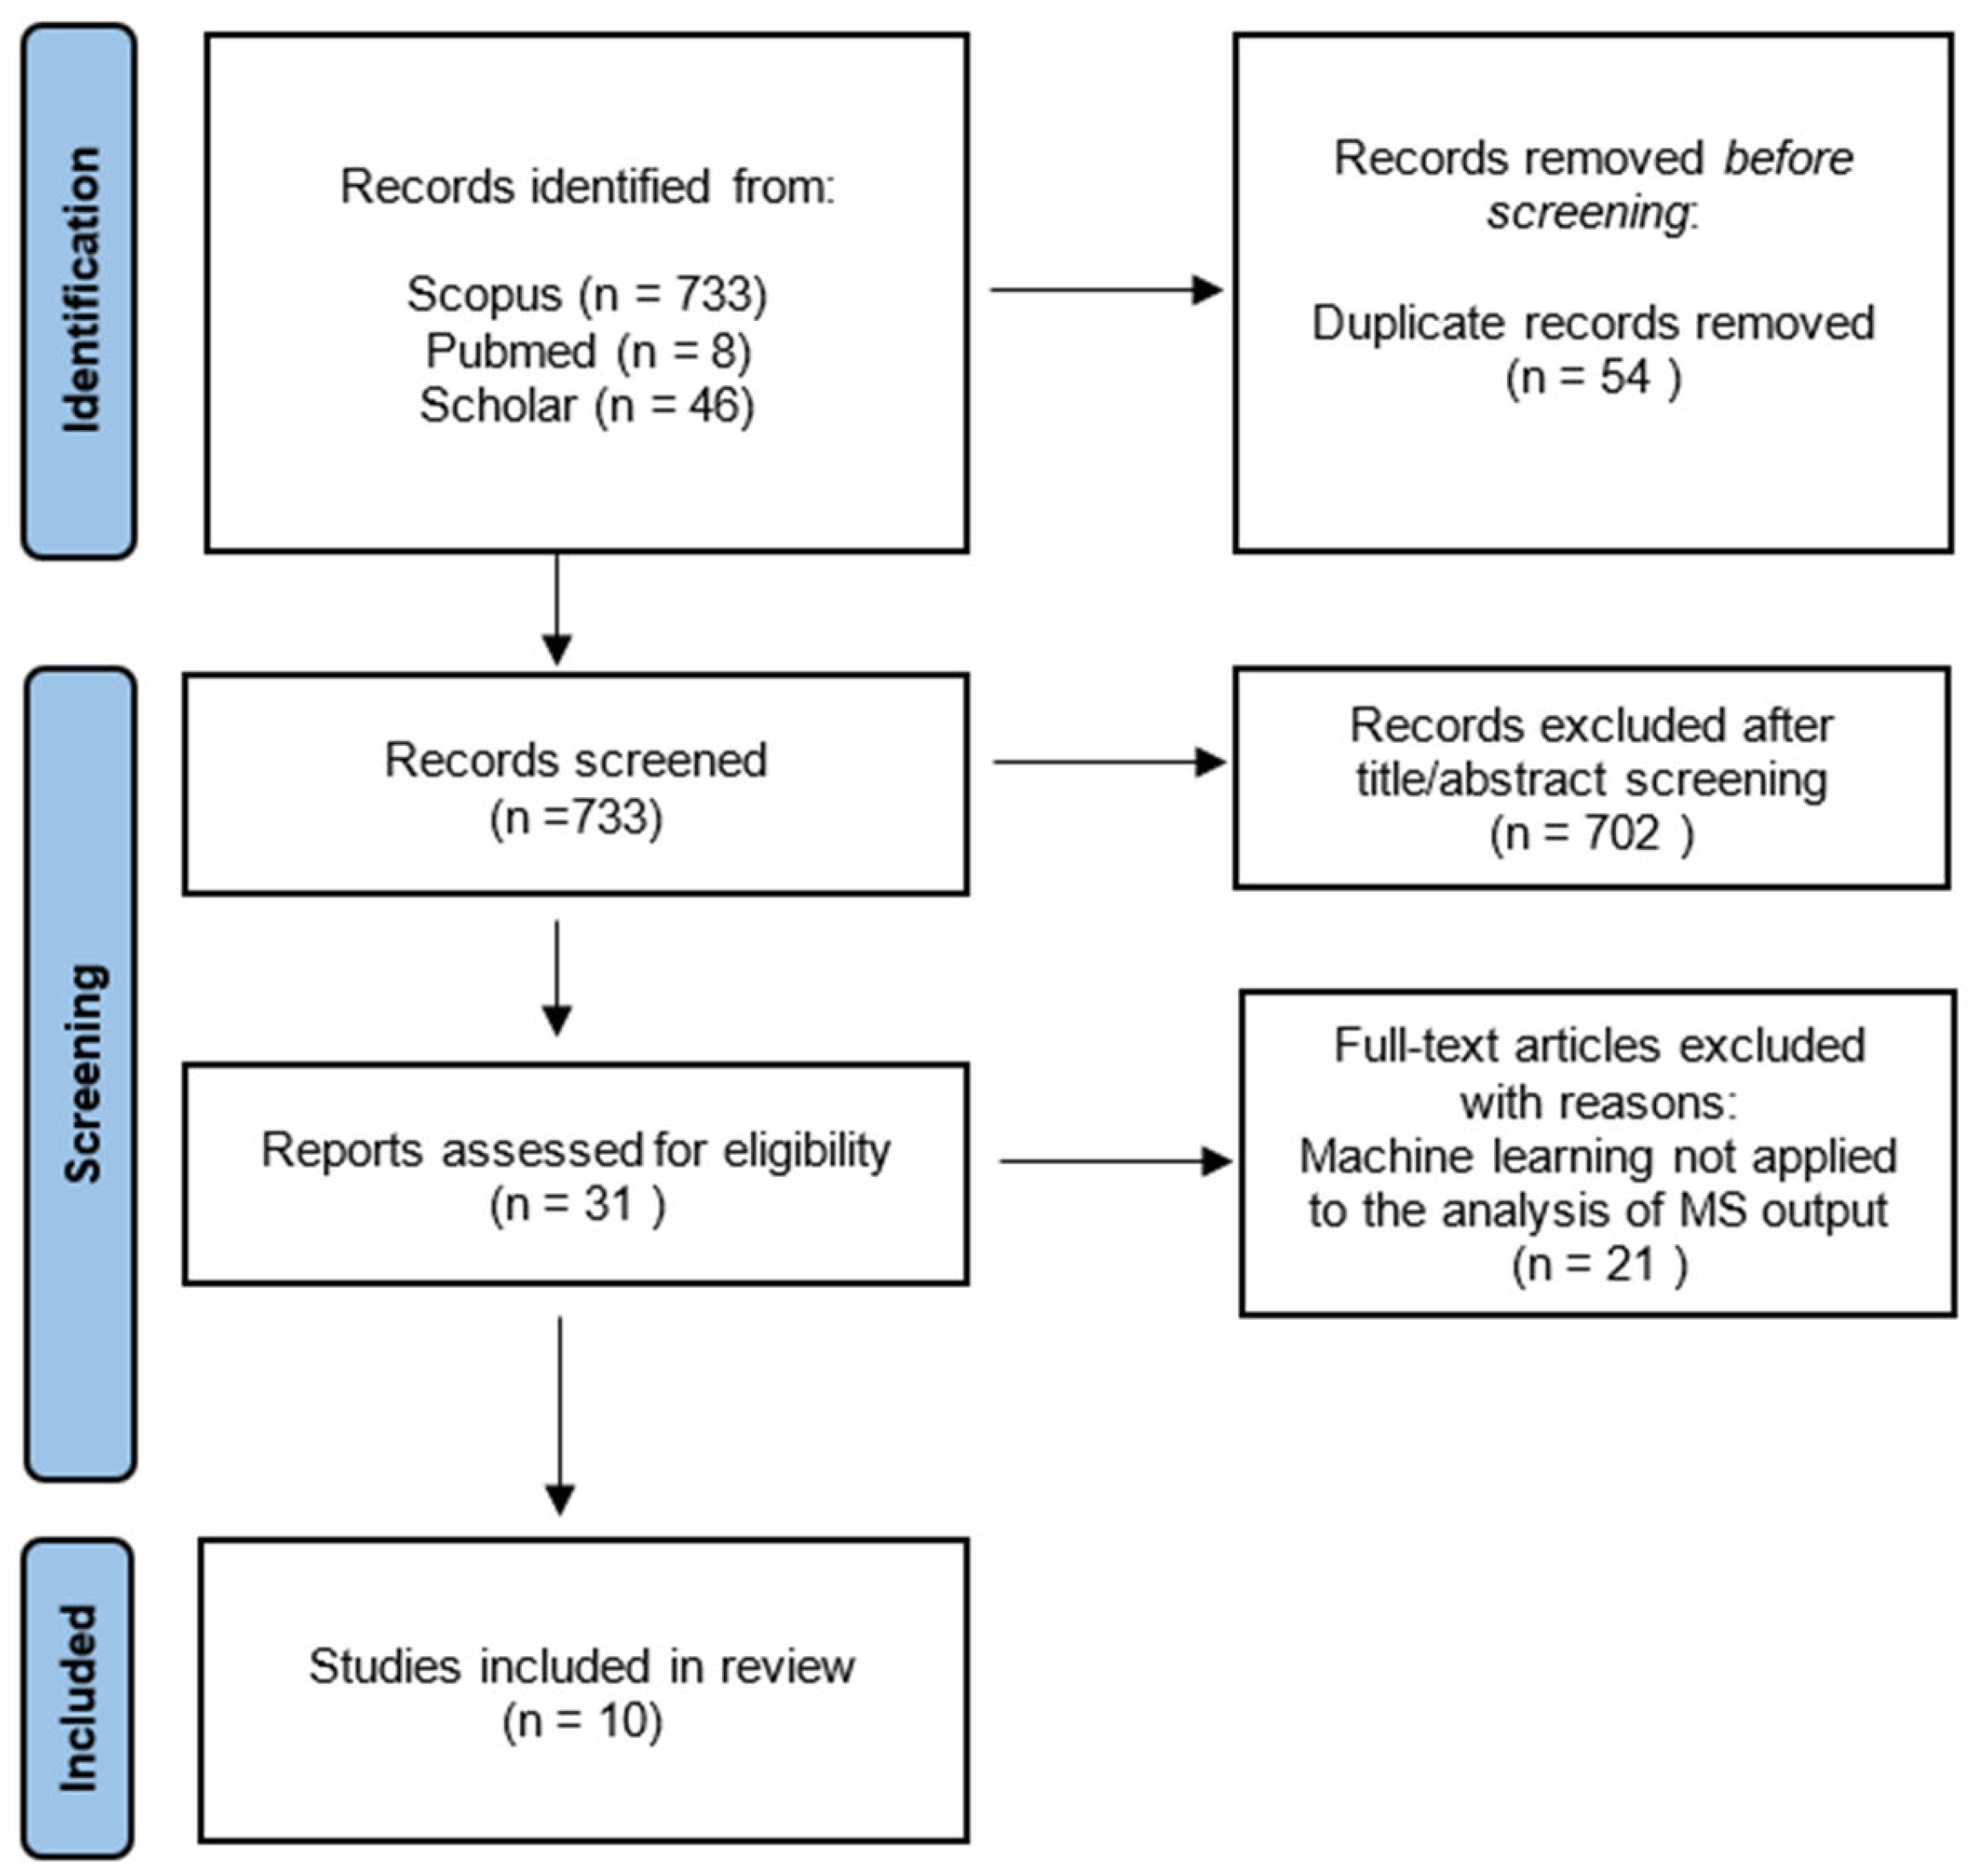
2. Materials and Methods

2.1. Eligibility Criteria

The methods for the systematic review were structured in accordance with the PRISMA Statement [31]. No restrictions were imposed regarding language, publication date, or machine learning techniques. Studies were eligible for inclusion if they (A) investigated populations diagnosed with psychotic disorders, (B) applied EEG microstate analysis, and (C) employed machine learning methods to analyze the outputs derived from EEG microstates. As mentioned in the introduction (see Section 1.1), machine learning techniques can be employed during the preprocessing phases and for identifying microstate templates. However, this review focuses on evaluating how machine learning can be applied to the analysis of outputs derived from microstate analysis. Therefore, studies were excluded if machine learning was applied solely during the preprocessing or template identification phases of EEG data, without any direct application to the analysis of the outputs derived from microstate analysis.

2.2. Information Sources and Search Strategy

Studies were selected from three online databases: Scholar, Scopus, and PubMed. We used the following search string, targeting title, abstract, and keywords: (“EEG microstate*” OR “microstate*”) AND (“psychos*” OR “schizophren*” OR “psychotic disorder*”) AND (“machine learning” OR “deep learning” OR “artificial intelligence”), resulting in a total of 787 bibliographic records (Scopus = 733, PubMed = 8, Scholar = 46). References listed in the included papers were also examined to identify additional studies meeting our inclusion and exclusion criteria. The search was last performed in November 2024.
Initially, duplicate records were removed, reducing the total to 733 unique studies. These records were screened by examining titles and abstracts to exclude those not meeting the eligibility criteria, leading to the exclusion of 702 records. Ultimately, 31 full-text articles were evaluated for eligibility, and 21 were excluded because machine learning was not applied to the analysis of EEG microstate outputs.
This process resulted in the inclusion of 10 studies in the systematic review. Two investigators performed the literature screening independently. In cases of disagreement, a third reviewer was consulted to reach a consensus. The PRISMA flowchart, in Figure 1, summarizes the selection process in the systematic review. PRISMA checklist is available in Supplementary materials.

2.3. Quality Assessment

The quality of the studies included in the systematic review was assessed using the Critical Appraisal Skills Programme (CASP) checklist for descriptive and cross-sectional studies [32]. This tool provides a structured framework for systematically evaluating studies based on 11 key questions. Two reviewers (F.P. and G.G.) conducted independent assessments of each study and any disagreements were resolved through consultation with a third reviewer (M.B.). Each question was scored with 1 point for a “Yes” answer and 0 for a “No” or “Can’t Tell” answer, with a maximum possible score of 11 points.
The evaluation considered the following aspects: (1) whether the study addressed a clearly focused issue; (2) whether the authors used an appropriate method to answer their question; (3) whether the subjects were recruited in an acceptable way; (4) whether the measures were accurately applied to reduce bias; (5) whether the data collection methods effectively addressed the research issue; (6) whether the study included enough participants to minimize the influence of chance; (7) how the results were presented and the main findings; (8) the rigor of the data analysis; (9) whether the findings were clearly stated; (10) whether the results could be applied to the local population; and (11) the overall value of the research.
The minimum score of 8/11 was chosen as a quality cut-off for inclusion in this review. The average quality score for the studies was 9.4, with no study scoring below 8. Consequently, all studies met the quality threshold and were included in the systematic review. Results are represented in Table 2.

3. Results

The following section describes the key findings from the studies included in this review, focusing on the use of EEG microstate analysis combined with machine learning techniques. For each study, information on methods and main results is summarized in Table 3, while details on microstate findings are provided in Table 4.
Before proceeding, it is important to note that none of the following studies reported the presence of significant differences between subgroups (such as gender or hand dominance).
A portion of the studies focused on evaluating the diagnostic accuracy of schizophrenia using the standard set of microstate parameters (e.g., A, B, C, D; coverage, duration, occurrence) derived from resting-state EEG as input for machine learning models, aiming to distinguish schizophrenia (SZ) patients from healthy controls (HCs). For instance, Baradits et al. [33] identified increased occurrence and coverage of microstates A and D, alongside reduced parameters for microstate B in schizophrenia, suggesting that these changes reflect disrupted network transitions. Using a Support Vector Machine (SVM), a type of supervised learning algorithm that identifies decision boundaries in data, with optimized hyperparameters and microstate features as input, they achieved an accuracy of 82.7%, sensitivity of 82.67%, and specificity of 81.43%, demonstrating the diagnostic potential of EEG microstates.
Keihani et al. [36] highlighted differences in microstates C and D, reporting reduced occurrence and coverage for microstate C and increased occurrence, coverage, and duration for microstate D in SZ. They identified microstate C as the most predictive feature, followed by D and B. Their Bayesian optimization model, based on 20 parameters, achieved an accuracy of 90.93%, sensitivity of 91.37%, and specificity of 90.48%, underscoring the utility of microstates for classification between healthy subjects and patients. Notably, the model demonstrated robust reliability even when the parameter set was reduced to just six features.
Kim et al. [37] demonstrated the value of microstate features in distinguishing SZ from HC, identifying significant differences in microstates B, C, and D, with microstate B showing increased global field power (GFP). Using a Support Vector Machine (SVM) classifier, they achieved an accuracy of 75.64% with microstate features alone. When traditional EEG metrics were added, the accuracy increased only slightly to 76.85%, emphasizing that microstate features accounted for most of the diagnostic information.
Several studies have introduced novel approaches to enhance the diagnostic capabilities of microstate analysis. Yan et al. [41] first identified reduced microstate A parameters and increased microstate C parameters in First-Episode Schizophrenia (FESZ) and Ultra-High-Risk (UHR) groups using traditional microstate metrics. They then applied an autoregressive model AR(1), which predicts current brain activity based on its immediate past state, to construct functional connectivity networks based on microstates. These networks were analyzed using graph theory to assess their topological properties. The study found significant correlations between microstate-based functional connectivity (msFC) measures and clinical variables, including symptom severity and cognitive deficits. The msFC classification model demonstrated strong performance, achieving an AUC (Area Under the Curve) of 92.50%, 97.22%, and 88.63% in distinguishing FESZ, UHR, and High Risk (HR) from HC, respectively, highlighting the potential of msFCs in capturing disease progression-related changes.
Zhou et al. [42] employed Chaos Game Representation (CGR), a method that transforms complex temporal patterns into visual fractal-like sequences, to investigate oscillatory microstate dynamics, constructing two time series (D and Z) based on microstate spacing distance and coordinates in CGR. The D time series represents the Euclidean distance between consecutive microstates, capturing the spatial spacing between them, while the Z time series encodes the coordinates of each microstate within the CGR space, reflecting their position and temporal evolution. Their analyses revealed that microstates A and D had longer durations and more transitions in HC, while microstates B and C occurred more frequently in First-Episode Psychosis (FEP). Their SVM classifier, leveraging CGR-derived oscillatory features, achieved an AUC of 0.61, outperforming traditional microstate metrics, and highlighted the potential of CGR in microstate analysis for early detection.
Li et al. [38] first identified an increased frequency of microstate C and a decreased frequency of microstate D in SZ. They also defined and investigated a semantic modeling approach, which decomposed microstate sequences into subsequences to extract meaningful temporal patterns. For the machine learning models, both traditional microstate parameters and semantic features were included as input. Three classification algorithms—Support Vector Machine (SVM), Multilayer Perceptron (MLP), and K-Nearest Neighbor (KNN)—were tested, with the KNN model achieving the highest accuracy of 97.2%, highlighting the diagnostic value of incorporating semantic features alongside traditional measures.
Lillo et al. [39] combined microstate dynamics with a convolutional neural network (CNN), a deep learning model designed for pattern recognition, and a random walk model, a stochastic process used to analyze temporal dependencies, to capture long-term patterns. This innovative approach achieved a classification accuracy of 93% in distinguishing patients with schizophrenia from healthy controls, underlining the potential of automated microstate analysis for portable diagnostic applications.
A subset of studies focused specifically on early stages of schizophrenia, including FESZ, HR, or UHR groups, often integrating additional clinical or cognitive variables. Luo et al. [40] examined microstate alterations across stages of schizophrenia and observed shorter durations and reduced occurrence of microstate D in FESZ and UHR compared to HC. They compared several machine learning models, including Random Forest, Support Vector Machines (SVM), and Long Short-Term Memory (LSTM). Among these, the Random Forest model, which incorporated microstate parameters along with clinical and behavioral data, achieved the best performance, with an accuracy of 92%, sensitivity of 91.8%, and specificity of 90.8%, demonstrating the potential of stage-specific diagnostic models. Zhou et al. [42] also focused on early stages of psychosis, as previously described.
Chang et al. [34] explored microstate alterations in an Event-Related Potential (ERP)-specific context by analyzing sensory gating deficits during the P50 auditory response. They observed significant differences in microstate MS7 and MS8 (alternative topographic maps not attributable to the canonical microstates A, B, C, and D) between groups and altered connectivity in temporal and frontal regions of FESZ patients. Using a Decision Tree classifier incorporating demographic, cognitive, ERP, and microstate features, they achieved 76.92% accuracy in distinguishing FESZ, UHR, and HC, emphasizing the potential of P50-related microstates for early diagnosis.
Only one study examined the longitudinal aspects of microstates. Giuliani et al. [35] conducted a four-year longitudinal investigation of EEG features, including microstates, in both resting-state and task-related activity, exploring their relationship with clinical and functional outcomes in schizophrenia. Specifically, the authors investigated potential anomalies in frequency bands, microstates, the N100-P300 task, an auditory task measuring early sensory processing and attentional responses, and the MMN-P3a task, an auditory task assessing automatic detection of changes and attentional shift. Although microstates demonstrated limited predictive power for long-term outcomes such as depression and cognitive impairments, baseline EEG features showed significant correlations with clinical outcomes at follow-up. Their global model, which integrated multiple classifiers (utilizing frequency bands, microstates, N100-P300 tasks, and MMN-P3a tasks), achieved a maximum accuracy of 75.4% in distinguishing patients with schizophrenia from healthy controls.
Lastly, three studies directly examined the relationship between microstate parameters and clinical or functional outcomes. Giuliani et al. [35] explored correlations between baseline EEG features and follow-up outcomes, as noted above. Yan et al. [41] investigated correlations between microstate parameters and clinical measures, finding that reductions in microstate A and increases in microstate C were associated with cognitive deficits and symptom severity. Zhou et al. [42] found that in FEP patients, microstate D (duration, coverage, root of variance frequency) was negatively correlated with total Brief Psychiatric Rating Scale (BPRS) scores (a clinical scale used to assess the severity of psychiatric symptoms such as anxiety, depression, psychosis, and thought disorganization), while parameters from time series Z and D (Central Frequency, root mean square frequency, mean power, and root mean square) showed positive correlations.

4. Discussion

This review includes studies that combined machine learning with EEG microstate analysis. EEG microstates are tools that describe brain temporal dynamics through brief, quasi-stable electrical maps that transition over time. The limited number of these maps allows for comparison across multiple spatial, temporal, and electrical characteristics. The extensive range of metrics extracted from microstate analysis may contain specific patterns of electrical activity associated with clinical and functional psychotic features. Machine learning-based models could provide a valuable tool for identifying these patterns [19,20,43,44,45].
All of the studies included in this review evaluated the capacity of machine learning (ML) models based on EEG microstates to predict diagnoses within the psychosis spectrum across various stages of the illness. Collectively, the evidence supports the hypothesis that microstate analysis can discriminate between patients and controls, even in the early stages of the disease and in individuals at high risk. Only two studies assessed the additional improvement that traditional EEG microstate parameters bring to classification models compared to other EEG measures. These studies yielded discordant results: Kim et al. [37] found that conventional EEG microstate parameters improved models more than other EEG measures, whereas Giuliani et al. [35] reported that microstate analysis contributed less to model improvement than other EEG metrics. On the other hand, including microstate measures in models that already contained clinical or behavioral variables improved performance, as shown in studies by Chang et al. [34] and Luo et al. [40].
Several studies, including those by Yan et al. [41], Zhou et al. [42], Li et al. [38], and Lillo et al. [39], have proposed novel approaches to microstate analysis, highlighting their superiority over traditional metrics. These include semantic modeling [38], fractal-like representations [42], and dynamic modeling approaches [41], which demonstrate improved diagnostic accuracy and deeper insights into brain dynamics.
Furthermore, two studies that evaluated associations between microstate patterns and clinical measures provide evidence that microstates are related to symptom severity. Yan et al. [41] found that reductions in microstate A and increases in microstate C correlated with cognitive deficits and symptom severity, while Zhou et al. [42] observed correlations between microstate dynamics and psychotic symptom ratings.
Innovatively, with respect to the two previously available systematic reviews and one meta-analysis investigating EEG microstates in schizophrenia, this work specifically addresses the use of ML to predict clinical phenotypes through EEG microstates. Results thus provide novel insights into the growing field of ML applied to psychiatry, as well as offer the opportunity to discuss comparisons with data drawn from other traditional approaches.
Focusing on traditional microstate parameters, EEG microstates in schizophrenia display heterogeneous findings across the 10 studies, in contrast to the greater homogeneity observed in the previous systematic reviews and meta-analyses by authors such as Da Cruz et al. [46], Rieger et al. [43], and Khanna et al. [20]. Microstate A exhibits parameters that are reported as both increased [33], consistent with Khanna et al., and decreased [37]. As already highlighted in the previous reviews [20,43,46], microstate B shows reductions in duration, coverage, and occurrence [34,39]. For microstates C and D, contrasting results also emerge. Authors like Kim et al. [37], Yan et al. [41], and Lillo et al. [39] report an increase in microstate C and a reduction in D, consistent with the meta-analysis by Rieger et al. [43] and findings by Da Cruz et al. [46]. However, other studies report different patterns: Keihani et al. [36] observed a reduction in microstate C and an increase in D in chronic schizophrenia, while Baradits et al. [33] found no significant changes in microstate C.
These results should be interpreted with caution due to methodological variability. The ML techniques employed differ in terms of models and variables, creating a heterogeneous landscape that complicates direct comparisons. Furthermore, the relatively small and heterogeneous sample sizes in some studies limit the generalizability and robustness of the findings. Lastly, most of the included studies are cross-sectional, with only one adopting a longitudinal design [35], a key feature for conditions that evolve over time.
Nevertheless, despite the heterogeneity in traditional microstate parameters, incorporating these data into machine learning models has generally produced effective classifiers, highlighting their potential utility in this context. This finding suggests that EEG microstates provide information that may not be fully captured through conventional analyses of microstate parameters. Moreover, the temporal sequence characteristics, whether in resting-state or ERP studies, effectively describe the temporal dynamics of brain networks with high temporal resolution and have proven to be a reliable classification measure [38,39,42].
The hypothesis is that machine learning models can leverage the informative potential of EEG data by integrating a larger number of variables and combining them into a multidimensional analysis, identifying functions, complex patterns, and feature combinations that may better represent the heterogeneous manifestations of psychotic conditions [47,48]. These models could, in essence, identify compositions of electrophysiological anomalies that, in their entirety, might reflect the underlying pathophysiological heterogeneity, which underpins the observed phenomenological and clinical diversity of psychotic disorders [35,49]. However, as the complexity and non-linearity of these models increases, their interpretability becomes more challenging, which must be considered in their application [50,51].

5. Conclusions

In conclusion, combining EEG and machine learning proves effective in capturing the heterogeneity and multifactorial nature of psychotic disorders. Rather than stemming from a single electrophysiological alteration, psychoses are characterized by complex patterns of brain activity that underlie their pathophysiology [52,53,54,55]. The exploration of temporal dynamics and the analysis of complex sequences offer a promising and innovative avenue for research. Further refinement of methodologies that leverage EEG’s high temporal resolution, integrated with advanced machine learning, holds great potential for clinical practice, offering a feasible, non-invasive and low-cost tool to optimize diagnosis and clinical monitoring, as well as guide personalized interventions.

6. Future Directions

From the evidence presented so far, EEG microstates have been confirmed as valuable tool, and their utility in the field of psychoses could be significantly enhanced by integrating them with machine learning techniques. This combination leverages the high temporal resolution inherent to EEG as a medium to capture brain dynamics, enabling a more comprehensive understanding of the multifaceted biological and clinical nature of psychoses.
Given the early stage of research in this field, many knowledge gaps persist, requiring further studies to deepen our understanding. Comparing the features of EEG microstates across different psychiatric conditions, beyond psychoses alone, could provide valuable insights into the nature of brain dynamics in mental disorders. This approach may help to clarify whether these dynamics stem from distinct biological alterations specific to each condition, or, as emerging evidence may suggest, if a shared disruption exists across disorders and translates into distinct phenotypic variations [56,57].
Future research should also prioritize the prediction of clinical, cognitive, and functional outcomes over purely diagnostic applications. Integrating machine learning models with clinical variables is essential to improve performance and deepen our understanding of the factors influencing these outcomes. Longitudinal studies are also needed to evaluate whether EEG microstates can reliably predict outcomes or integrate clinical monitoring over time.
Machine learning approaches could benefit from the use of interpretable algorithms (e.g., regression models, decision lists), which can explicitly quantify the contribution of individual variables. As highlighted in the Introduction, several machine learning models are commonly used and it would be essential to find a balance between complexity and explainability. This may provide valuable insights into the most relevant parameters, potentially identifying targets for intervention and facilitating integration into clinical practice [50].
By allowing clinicians to better understand the parameters underlying model outputs, such approaches could help to ensure that computational tools support and enhance clinical expertise, fostering more informed decision-making.

Supplementary Materials

The following supporting information can be downloaded at https://www.mdpi.com/article/10.3390/biomedinformatics5010008/s1: PRISMA 2020 Checklist.

Author Contributions

Conceptualization, F.P. and M.B.; methodology, M.B.; investigation, F.P. and G.G.; writing—original draft preparation, F.P. and G.G.; writing—review and editing, F.P., M.B., M.C., G.G., G.A., J.S., F.R., M.D., M.S. and R.C. All authors have read and agreed to the published version of the manuscript.

Funding

This research received no external funding.

Conflicts of Interest

The authors declare no conflicts of interest.

References

  1. American Psychiatric Association. Diagnostic and Statistical Manual of Mental Disorders: Fifth Edition Text Revision DSM-5-TRTM, 5th ed.; text rev; American Psychiatric Association: Washington, DC, USA, 2022. [Google Scholar] [CrossRef]
  2. Kapur, S. Psychosis as a state of aberrant salience: A framework linking biology, phenomenology, and pharmacology in schizophrenia. Am. J. Psychiatry 2003, 160, 13–23. [Google Scholar] [CrossRef] [PubMed]
  3. Arciniegas, D.B. Psychosis. Contin. Lifelong Learn. Neurol. 2015, 21, 715. [Google Scholar] [CrossRef]
  4. Awad, P.A.G.; Voruganti, L. The Burden of Schizophrenia on Caregivers. PharmacoEconomics 2012, 26, 149–162. [Google Scholar] [CrossRef] [PubMed]
  5. Millier, A.; Schmidt, U.; Angermeyer, M.; Chauhan, D.; Murthy, V.; Toumi, M.; Cadi-Soussi, N. Humanistic burden in schizophrenia: A literature review. J. Psychiatr. Res. 2014, 54, 85–93. [Google Scholar] [CrossRef]
  6. Hasson-Ohayon, I.; Kravetz, S.; Roe, D.; David, A.S.; Weiser, M. Insight into psychosis and quality of life. Compr. Psychiatry 2006, 47, 265–269. [Google Scholar] [CrossRef]
  7. Malla, A.; Payne, J. First-Episode Psychosis: Psychopathology, Quality of Life, and Functional Outcome. Schizophr. Bull. 2005, 31, 650–671. [Google Scholar] [CrossRef] [PubMed]
  8. Tandon, R.; Keshavan, M.S.; Nasrallah, H.A. Schizophrenia, “Just the Facts” What we know in 2008. 2. Epidemiology and etiology. Schizophr. Res. 2008, 102, 1–18. [Google Scholar] [CrossRef] [PubMed]
  9. Gejman, P.V.; Sanders, A.R.; Duan, J. The Role of Genetics in the Etiology of Schizophrenia. Psychiatr. Clin. N. Am. 2010, 33, 35–66. [Google Scholar] [CrossRef] [PubMed]
  10. Walker, E.; Kestler, L.; Bollini, A.; Hochman, K.M. Schizophrenia: Etiology and Course. Annu. Rev. Psychol. 2004, 55, 401–430. [Google Scholar] [CrossRef] [PubMed]
  11. Friston, K.J. Schizophrenia and the disconnection hypothesis. Acta Psychiatr. Scand. 1999, 99, 68–79. [Google Scholar] [CrossRef]
  12. Friston, K.J. The disconnection hypothesis. Schizophr. Res. 1998, 30, 115–125. [Google Scholar] [CrossRef] [PubMed]
  13. Sapienza, J.; Bosia, M.; Spangaro, M.; Martini, F.; Agostoni, G.; Cuoco, F.; Cocchi, F.; Cavallaro, R. Schizophrenia and psychedelic state: Dysconnection versus hyper-connection. A perspective on two different models of psychosis stemming from dysfunctional integration processes. Mol. Psychiatry 2023, 28, 59–67. [Google Scholar] [CrossRef]
  14. Addington, J.; Addington, D. Social and cognitive functioning in psychosis. Schizophr. Res. 2008, 99, 176–181. [Google Scholar] [CrossRef]
  15. Karbasforoushan, H.; Woodward, N.D. Resting-State Networks in Schizophrenia. Curr. Top. Med. Chem. 2012, 12, 2404–2414. [Google Scholar] [CrossRef] [PubMed]
  16. Camchong, J.; MacDonald, A.W., III; Bell, C.; Mueller, B.A.; Lim, K.O. Altered Functional and Anatomical Connectivity in Schizophrenia. Schizophr. Bull. 2011, 37, 640–650. [Google Scholar] [CrossRef] [PubMed]
  17. Hu, M.-L.; Zong, X.-F.; Mann, J.J.; Zheng, J.-J.; Liao, Y.-H.; Li, Z.-C.; He, Y.; Chen, X.-G.; Tang, J.-S. A Review of the Functional and Anatomical Default Mode Network in Schizophrenia. Neurosci. Bull. 2017, 33, 73–84. [Google Scholar] [CrossRef]
  18. Sapienza, J.; Pacchioni, F.; Spangaro, M.; Bosia, M. Dysconnection in schizophrenia: Filling the dots from old to new evidence. Clin. Neurophysiol. 2024, 162, 226–228. [Google Scholar] [CrossRef]
  19. Michel, C.M.; Koenig, T. EEG microstates as a tool for studying the temporal dynamics of whole-brain neuronal networks: A review. NeuroImage 2018, 180, 577–593. [Google Scholar] [CrossRef]
  20. Khanna, A.; Pascual-Leone, A.; Michel, C.M.; Farzan, F. Microstates in resting-state EEG: Current status and future directions. Neurosci. Biobehav. Rev. 2015, 49, 105–113. [Google Scholar] [CrossRef] [PubMed]
  21. Lehmann, D. Multichannel topography of human alpha EEG fields. Electroencephalogr. Clin. Neurophysiol. 1971, 31, 439–449. [Google Scholar] [CrossRef]
  22. Lehmann, D.; Ozaki, H.; Pal, I. EEG alpha map series: Brain micro-states by space-oriented adaptive segmentation. Electroencephalogr. Clin. Neurophysiol. 1987, 67, 271–288. [Google Scholar] [CrossRef]
  23. Michel, C.M.; Murray, M.M. Towards the utilization of EEG as a brain imaging tool. NeuroImage 2012, 61, 371–385. [Google Scholar] [CrossRef] [PubMed]
  24. Biasiucci, A.; Franceschiello, B.; Murray, M.M. Electroencephalography. Curr. Biol. 2019, 29, R80–R85. [Google Scholar] [CrossRef] [PubMed]
  25. Chen, Z.S.; Kulkarni, P.; Galatzer-Levy, I.R.; Bigio, B.; Nasca, C.; Zhang, Y. Modern Views of Machine Learning for Precision Psychiatry. Available online: https://www.cell.com/patterns/abstract/S2666-3899(22)00227-6 (accessed on 25 January 2025).
  26. de Bardeci, M.; Ip, C.T.; Olbrich, S. Deep learning applied to electroencephalogram data in mental disorders: A systematic review. Biol. Psychol. 2021, 162, 108117. [Google Scholar] [CrossRef] [PubMed]
  27. von Wegner, F.; Knaut, P.; Laufs, H. EEG Microstate Sequences from Different Clustering Algorithms Are Information-Theoretically Invariant. Front. Comput. Neurosci. 2018, 12, 70. [Google Scholar] [CrossRef] [PubMed]
  28. Sarker, I.H. Machine Learning: Algorithms, Real-World Applications and Research Directions. SN Comput. Sci. 2021, 2, 160. [Google Scholar] [CrossRef] [PubMed]
  29. Bonaccorso, G. Machine Learning Algorithms: Popular Algorithms for Data Science and Machine Learning, 2nd ed.; Packt Publishing: Birmingham, UK, 2018; 514p. [Google Scholar]
  30. What Is a Machine Learning Algorithm? Available online: https://www.ibm.com/think/topics/machine-learning-algorithms (accessed on 25 January 2025).
  31. Tugwell, P.; Tovey, D. PRISMA 2020. J. Clin. Epidemiol. 2021, 134, A5–A6. [Google Scholar] [CrossRef] [PubMed]
  32. CASP—Critical Appraisal Skills Programme. CASP Checklists—Critical Appraisal Skills Programme. Available online: https://casp-uk.net/casp-tools-checklists/ (accessed on 1 November 2024).
  33. Baradits, M.; Bitter, I.; Czobor, P. Multivariate patterns of EEG microstate parameters and their role in the discrimination of patients with schizophrenia from healthy controls. Psychiatry Res. 2020, 288, 112938. [Google Scholar] [CrossRef] [PubMed]
  34. Chang, Q.; Li, C.; Zhang, J.; Wang, C. Dynamic brain functional network based on EEG microstate during sensory gating in schizophrenia. J. Neural Eng. 2022, 19, 026007. [Google Scholar] [CrossRef]
  35. Giuliani, L.; Koutsouleris, N.; Giordano, G.M.; Koenig, T.; Mucci, A.; Perrottelli, A.; Reuf, A.; Altamura, M.; Bellomo, A.; Brugnoli, R.; et al. A multivariate approach to investigate the associations of electrophysiological indices with schizophrenia clinical and functional outcome. Eur. Psychiatry 2023, 66, e46. [Google Scholar] [CrossRef]
  36. Keihani, A.; Sajadi, S.S.; Hasani, M.; Ferrarelli, F. Bayesian Optimization of Machine Learning Classification of Resting-State EEG Microstates in Schizophrenia: A Proof-of-Concept Preliminary Study Based on Secondary Analysis. Brain Sci. 2022, 12, 1497. [Google Scholar] [CrossRef]
  37. Kim, K.; Duc, N.T.; Choi, M.; Lee, B. EEG microstate features for schizophrenia classification. PLoS ONE 2021, 16, e0251842. [Google Scholar] [CrossRef]
  38. Li, H.; Wang, C.; Ma, L.; Xu, C.; Li, H. EEG analysis in patients with schizophrenia based on microstate semantic modeling method. Front. Hum. Neurosci. 2024, 18, 1372985. [Google Scholar] [CrossRef]
  39. Lillo, E.; Mora, M.; Lucero, B. Automated diagnosis of schizophrenia using EEG microstates and Deep Convolutional Neural Network. Expert Syst. Appl. 2022, 209, 118236. [Google Scholar] [CrossRef]
  40. Luo, Y.; Tian, Q.; Wang, C.; Zhang, K.; Wang, C.; Zhang, J. Biomarkers for prediction of schizophrenia: Insights from resting-state EEG microstates. IEEE Access 2020, 8, 213078–213093. [Google Scholar] [CrossRef]
  41. Yan, T.; Wang, G.; Liu, T.; Li, G.; Wang, C.; Funahashi, S.; Suo, D.; Pei, G. Effects of Microstate Dynamic Brain Network Disruption in Different Stages of Schizophrenia. IEEE Trans. Neural Syst. Rehabil. Eng. 2023, 31, 2688–2697. [Google Scholar] [CrossRef] [PubMed]
  42. Zhou, D.-D.; Li, H.-Z.; Wang, W.; Kuang, L. Changes in oscillatory patterns of microstate sequence in patients with first-episode psychosis. Sci. Data 2024, 11, 38. [Google Scholar] [CrossRef] [PubMed]
  43. Rieger, K.; Hernandez, L.D.; Baenninger, A.; Koenig, T. 15 Years of microstate research in schizophrenia—Where are we? A meta-analysis. Front. Psychiatry 2016, 7, 22. [Google Scholar] [CrossRef]
  44. Saeidi, M.; Karwowski, W.; Farahani, F.V.; Fiok, K.; Taiar, R.; Hancock, P.A.; Al-Juaid, A. Neural Decoding of EEG Signals with Machine Learning: A Systematic Review. Brain Sci. 2021, 11, 1525. [Google Scholar] [CrossRef] [PubMed]
  45. Sharma, M.; Acharya, U.R. Automated detection of schizophrenia using optimal wavelet-based norm features extracted from single-channel EEG. Cogn. Neurodyn. 2021, 15, 661–674. [Google Scholar] [CrossRef] [PubMed]
  46. Da Cruz, J.R.; Favrod, O.; Roinishvili, M.; Chkonia, E.; Brand, A.; Mohr, C.; Figueiredo, P.; Herzog, M.H. EEG microstates are a candidate endophenotype for schizophrenia. Nat. Commun. 2020, 11, 3089. [Google Scholar] [CrossRef]
  47. Brugger, S.P.; Howes, O.D. Heterogeneity and Homogeneity of Regional Brain Structure in Schizophrenia: A Meta-analysis. JAMA Psychiatry 2017, 74, 1104–1111. [Google Scholar] [CrossRef] [PubMed]
  48. Kremen, W.S.; Seidman, L.J.; Faraone, S.V.; Toomey, R.; Tsuang, M.T. Heterogeneity of schizophrenia: A study of individual neuropsychological profiles. Schizophr. Res. 2004, 71, 307–321. [Google Scholar] [CrossRef] [PubMed]
  49. Gordillo, D.; da Cruz, J.R.; Chkonia, E.; Lin, W.H.; Favrod, O.; Brand, A.; Figueiredo, P.; Roinishvili, M.; Herzog, M.H. The EEG multiverse of schizophrenia. Cereb Cortex 2023, 33, 3816–3826. [Google Scholar] [CrossRef]
  50. Rudin, C. Stop explaining black box machine learning models for high stakes decisions and use interpretable models instead. Nat. Mach. Intell. 2019, 1, 206–215. [Google Scholar] [CrossRef]
  51. Castelvecchi, D. Can we open the black box of AI? Nat. News 2016, 538, 20. [Google Scholar] [CrossRef] [PubMed]
  52. Light, G.A.; Swerdlow, N.R. Future clinical uses of neurophysiological biomarkers to predict and monitor treatment response for schizophrenia. Ann. N. Y. Acad. Sci. 2015, 1344, 105–119. [Google Scholar] [CrossRef] [PubMed]
  53. Onitsuka, T.; Oribe, N.; Nakamura, I.; Kanba, S. Review of neurophysiological findings in patients with schizophrenia. Psychiatry Clin. Neurosci. 2013, 67, 461–470. [Google Scholar] [CrossRef]
  54. Rissling, A.J.; Makeig, S.; Braff, D.L.; Light, G.A. Neurophysiologic Markers of Abnormal Brain Activity in Schizophrenia. Curr. Psychiatry Rep. 2010, 12, 572–578. [Google Scholar] [CrossRef] [PubMed]
  55. de Miras, J.R.; Ibáñez-Molina, A.; Soriano, M.; Iglesias-Parro, S. Schizophrenia classification using machine learning on resting state EEG signal. Biomed. Signal Process. Control. 2023, 79, 104233. [Google Scholar] [CrossRef]
  56. Broyd, S.J.; Demanuele, C.; Debener, S.; Helps, S.K.; James, C.J.; Sonuga-Barke, E.J. Default-mode brain dysfunction in mental disorders: A systematic review. Neurosci. Biobehav. Rev. 2009, 33, 279–296. [Google Scholar] [CrossRef]
  57. Fornito, A.; Zalesky, A.; Breakspear, M. The connectomics of brain disorders. Nat. Rev. Neurosci. 2015, 16, 159–172. [Google Scholar] [CrossRef]
Figure 1. PRISMA flowchart summarizes the study selection process, from identification to final inclusion.
Biomedinformatics 05 00008 g001
Table 1. Overview of common machine learning models.
ModelDescriptionCharacteristics
Linear Regression (Simple and Multiple)A supervised model that predicts a target variable based on one (simple) or multiple (multiple) input features with a linear relationship.Simple, interpretable, and effective for linear relationships, but struggles with non-linear patterns and multicollinearity in multiple regression.
Logistic RegressionA supervised model for binary classification tasks that estimates probabilities using a sigmoid function.Simple, interpretable, and effective for binary classification, but assumes a linear relationship between features and the log-odds.
K-Means ClusteringAn unsupervised method that partitions data into K clusters based on similarity.Efficient and easy to implement, but sensitive to the choice of K and initial cluster centroids.
Hierarchical clusteringGroups data into a hierarchy or tree of clusters based on similarity measures.Provides a visual hierarchy (dendrogram); computationally expensive for large datasets.
Decision TreeA supervised model that uses a tree-like structure to make decisions based on feature splits.Interpretable and easy to visualize; prone to overfitting without pruning.
Random ForestAn ensemble method that combines multiple Decision Trees to improve performance.Reduces overfitting compared to a single tree; more computationally expensive.
Support Vector Machines (SVMs)A supervised method that finds the optimal hyperplane to classify data into distinct categories.Effective for high-dimensional spaces; computationally expensive with large datasets.
K-Nearest Neighbors (KNN)A simple algorithm that classifies data based on the majority class of its nearest neighbors.Easy to implement and small number of hyperparameters; computationally intensive for large datasets and less effective for high-dimensional data.
Multi-Layer Perceptron (MLP)A neural network model with one or more hidden layers for learning non-linear mappings.Suitable for a variety of tasks; requires significant data and computational resources.
Long Short-Term Memory (LSTM)A type of recurrent neural network (RNN) designed for sequence prediction and temporal data.Effective for long-term dependencies in sequential data; computationally intensive.
Convolutional neural network (CNN)A deep learning model optimized for image and spatial data processing.Highly effective for image-related tasks; automatic feature learning; requires large datasets and resources.
Table 2. Visual summary of the CASP assessment.
StudyQ1Q2Q3Q4Q5Q6Q7Q8Q9Q10Q11Total
Baradits et al. (2020) [33]Biomedinformatics 05 00008 i001Biomedinformatics 05 00008 i001Biomedinformatics 05 00008 i001Biomedinformatics 05 00008 i001Biomedinformatics 05 00008 i001Biomedinformatics 05 00008 i001Biomedinformatics 05 00008 i001Biomedinformatics 05 00008 i001Biomedinformatics 05 00008 i001Biomedinformatics 05 00008 i001Biomedinformatics 05 00008 i00111/11
Chang et al. (2022) [34]Biomedinformatics 05 00008 i001Biomedinformatics 05 00008 i001Biomedinformatics 05 00008 i001Biomedinformatics 05 00008 i001Biomedinformatics 05 00008 i001Biomedinformatics 05 00008 i001Biomedinformatics 05 00008 i001Biomedinformatics 05 00008 i001Biomedinformatics 05 00008 i001Biomedinformatics 05 00008 i001Biomedinformatics 05 00008 i00111/11
Giuliani et al. (2023) [35]Biomedinformatics 05 00008 i001Biomedinformatics 05 00008 i001Biomedinformatics 05 00008 i001Biomedinformatics 05 00008 i001Biomedinformatics 05 00008 i001Biomedinformatics 05 00008 i001Biomedinformatics 05 00008 i001Biomedinformatics 05 00008 i001Biomedinformatics 05 00008 i001Biomedinformatics 05 00008 i001Biomedinformatics 05 00008 i00111/11
Keihani et al. (2022) [36]Biomedinformatics 05 00008 i001Biomedinformatics 05 00008 i001Biomedinformatics 05 00008 i002Biomedinformatics 05 00008 i001Biomedinformatics 05 00008 i001Biomedinformatics 05 00008 i002Biomedinformatics 05 00008 i001Biomedinformatics 05 00008 i001Biomedinformatics 05 00008 i001Biomedinformatics 05 00008 i002Biomedinformatics 05 00008 i0018/11
Kim et al. (2021) [37]Biomedinformatics 05 00008 i001Biomedinformatics 05 00008 i001Biomedinformatics 05 00008 i002Biomedinformatics 05 00008 i001Biomedinformatics 05 00008 i001Biomedinformatics 05 00008 i002Biomedinformatics 05 00008 i001Biomedinformatics 05 00008 i001Biomedinformatics 05 00008 i001Biomedinformatics 05 00008 i002Biomedinformatics 05 00008 i0018/11
Li et al. (2024) [38]Biomedinformatics 05 00008 i001Biomedinformatics 05 00008 i001Biomedinformatics 05 00008 i002Biomedinformatics 05 00008 i001Biomedinformatics 05 00008 i001Biomedinformatics 05 00008 i002Biomedinformatics 05 00008 i001Biomedinformatics 05 00008 i001Biomedinformatics 05 00008 i001Biomedinformatics 05 00008 i002Biomedinformatics 05 00008 i0018/11
Lillo et al. (2022) [39]Biomedinformatics 05 00008 i001Biomedinformatics 05 00008 i001Biomedinformatics 05 00008 i002Biomedinformatics 05 00008 i001Biomedinformatics 05 00008 i001Biomedinformatics 05 00008 i002Biomedinformatics 05 00008 i001Biomedinformatics 05 00008 i001Biomedinformatics 05 00008 i001Biomedinformatics 05 00008 i002Biomedinformatics 05 00008 i0018/11
Luo et al. (2020) [40]Biomedinformatics 05 00008 i001Biomedinformatics 05 00008 i001Biomedinformatics 05 00008 i001Biomedinformatics 05 00008 i001Biomedinformatics 05 00008 i001Biomedinformatics 05 00008 i002Biomedinformatics 05 00008 i001Biomedinformatics 05 00008 i001Biomedinformatics 05 00008 i001Biomedinformatics 05 00008 i002Biomedinformatics 05 00008 i0019/11
Yan et al. (2023) [41]Biomedinformatics 05 00008 i001Biomedinformatics 05 00008 i001Biomedinformatics 05 00008 i001Biomedinformatics 05 00008 i001Biomedinformatics 05 00008 i001Biomedinformatics 05 00008 i002Biomedinformatics 05 00008 i001Biomedinformatics 05 00008 i001Biomedinformatics 05 00008 i001Biomedinformatics 05 00008 i002Biomedinformatics 05 00008 i0019/11
Zhou et al. (2024) [42]Biomedinformatics 05 00008 i001Biomedinformatics 05 00008 i001Biomedinformatics 05 00008 i001Biomedinformatics 05 00008 i001Biomedinformatics 05 00008 i001Biomedinformatics 05 00008 i001Biomedinformatics 05 00008 i001Biomedinformatics 05 00008 i001Biomedinformatics 05 00008 i001Biomedinformatics 05 00008 i002Biomedinformatics 05 00008 i00110/11
   Biomedinformatics 05 00008 i001: Yes Biomedinformatics 05 00008 i002: No/Cannot tell
Table 3. Overview of study objectives, design, features, and results.
StudyObjectiveDesign, Sample, and Eeg RecordingMl Methods and FeaturesResultsInterpretation and Research Implications
Baradits et al. (2020) [33]To classify SZ vs. HCCross–sectional;
70 SZ, 75 HC;
Resting–state EEG (256 channels).
SVM; hyperparameter tuning; factor analysis with varimax rotation; 10–fold CV (100 reps).
MS features (4 clusters—classical).
AUC 0.84; Acc 82.7%; Sens 82.67%; Spec 81.43%. Confirms the diagnostic potential of EEG microstate combined with machine learning fine-tuned models.
Chang et al. (2022) [34]To classify FESZ vs. UHR vs. HC;
To compare the model using demographic data, MCCB, and ERP with or without MS.
Cross–sectional;
35 FESZ, 30 UHR, 40 HC;
EEG during sensory gating task (P50 response to S1–S2 stimuli, 128 channels).
Decision Tree; 5–fold CV; dimensionality reduction (factor analysis).
Demographic data; MCCB; ERP P50 (S1/S2 amplitudes, S1–S2 difference, S2/S1 ratio); MS features (7 clusters—classical).
Acc 76.92%. Combining microstate features with clinical (cognitive) and demographic data enhances diagnostic accuracy. Highlights the value of MS7 and MS8 alterations in P50 responses.
Giuliani et al. (2023) [35]To classify SZ vs. HC;
To correlate EEG features with clinical and functional outcome;
To compare the model using MS vs. frequency bands vs. N100–P300 vs. MMN–P3a.
Cross–sectional and longitudinal (4–year follow–up);
148 SZ, 70 HC;
EEG only at baseline (resting–state and ERP, 29 channels).
One SVM model for each EEG feature (freq bands, MS, N100–P300, MMN–P3a).
Combined stacked Global classifier;
double cycle nested CV.
EEG features (freq bands, MS, N100–P300, MMN–P3a).
Acc up to 75.4% (global classifier).Combining microstates with other EEG metrics highlights correlations with clinical outcomes (depression, negative symptoms, cognitive deficits and functioning). EEG microstates had limited predictive value compared to other EEG futures.
Keihani et al. (2022) [36]To classify SZ vs. HC.Cross–sectional;
14 SZ, 14 HC;
Resting–state EEG (19 channels).
Bayesian optimized model and hyperparameter tuning; 5–fold CV;
MS features (4 clusters—classical).
Acc 90.93%; AUC 0.90; Sens 91.37%; Spec 90.48%.Microstate C is a key predictive feature; robust classification performance, even with only six parameters, demonstrates potential for minimal diagnostic tools.
Kim et al. (2021) [37]To classify SZ vs. HC;
To compare the model using MS vs. conventional EEG features.
Cross–sectional;
14 SZ, 14 HC;
Resting–state EEG (19 channels).
SVM; 10–fold CV;
MS features (4 clusters—classical), conventional EEG features.
Acc 75.64% (MS); combined features: Acc 76.85%.Microstate features account for most diagnostic information, outperforming traditional EEG metrics.
Li et al. (2024) [38]To classify SZ vs. HC.Cross–sectional;
14 SZ, 14 HC;
Resting–state EEG (19 channels).
SVM, KNN, and MLP; dual–template strategy; leave–one–out CV.
MS features (4 clusters—classical, semantic and quality).
Acc 97.2% (KNN); cross–subject Acc 96.4%.Integrating semantic and traditional features into classification models enhances diagnostic accuracy and suggests novel approaches for microstate analysis.
Lillo et al. (2022) [39]To classify SZ vs. HC.Cross–sectional;
14 SZ, 14 HC;
Resting–state EEG (19 channels).
CNN; leave–one–out CV;
MS features (4 clusters–random walk model for temporal and spatial dynamics), EEG features.
Acc 93%. CNN and random walk models effectively capture temporal dynamics; potential for portable and automated diagnostic applications.
Luo et al. (2020) [40]To classify FESZ vs. UHR vs. HR vs. HC;
To compare the model using PANSS, CDSS, and MCCB with or without MS features.
Cross–sectional;
20 FESZ, 19 UHR, 12 HR, 14 HC;
Resting–state EEG (128 channels).
RF, SVM, LSTM networks; 5–fold CV.
MS features (6 clusters—classical), PANSS, CDSS, MCCB.
Global Acc 92%; Sens 91.8%; Spec 90.8% (RF); MS–D predictive.Combining microstate and clinical data offers high diagnostic accuracy, which is particularly useful for classifying early stages of schizophrenia.
Yan et al. (2023) [41]To classify FESZ vs. UHR vs. HR vs. HC;
To correlate MS features with clinical and functional outcome.
Cross–sectional;
30 FESZ, 21 UHR, 17 HR, 31 HC;
Resting–state EEG (128 channels).
Autoregressive modeling ((AR(1) model); 10–fold CV.
MS features (4 clusters–classical, FC, global efficiency and clustering coefficient).
AUC: HC vs. FES 92.50%, UHR 97.22%, or HR 88.63%.
Altered MS–A/C.
Microstate–based functional connectivity (reduced global efficiency) correlates with cognitive deficits and symptom severity.
Zhou et al. (2024) [42]To classify FEP vs. HC;
To compare the model using classical MS features vs. CGR features.
Cross–sectional;
81 FEP, 61 HC;
Resting–state EEG (60 channels).
SVM; 5–fold CV.
MS features (4 clusters–classical, frequency matrix CGR, temporal series analysis D and Z).
AUC: 0.46 (classical MS features).
AUC: 0.49 (FCGR).
AUC: 0.61 (CGR derived oscillatory features).
Metrics.
CGR–derived oscillatory features outperform traditional microstate metrics, suggesting a novel and more sensitive approach to microstate analysis for early detection.
SZ (schizophrenia), HCs (healthy controls), FESZ (First-Episode Schizophrenia), UHR (Ultra-High Risk), FEP (First-Episode Psychosis), HR (High Risk), EEG (electroencephalography), MS (microstate), ERP (Event-Related Potential), P50 (sensory gating measure based on auditory stimuli responses), PANSS (Positive and Negative Syndrome Scale), CDSS (Calgary Depression Scale for Schizophrenia), MCCB (MATRICS Consensus Cognitive Battery), CNN (convolutional neural network), CV (cross-validation), NNMF (Non-Negative Matrix Factorization), SVM (Support Vector Machine), AUC (Area Under the Curve), Acc (Accuracy), Sens (Sensitivity), Spec (Specificity), CGR (Chaos Game Representation), FC (Functional Connectivity).
Table 4. Summary of EEG microstate findings across studies.
StudyMain Microstate Findings
Baradits et al. (2020) [33]Increased occurrence and coverage of microstate A; reduced duration, occurrence, and coverage of microstate B; increased occurrence and coverage of microstate D; no significant changes in microstate C; altered transition probabilities: reduced to B, increased to A and D.A ↑ (cov, occ); B ↓ (cov, occ, dur); D (occ, cov) ↑; C no change; transitions: B ↓, A/D ↑.
Chang et al. (2022) [34]In FESZ, MS7 (S1-P50): increased duration and coverage, reduced occurrence; MS8 (S1-S2-P50): increased coverage. FESZ lacked MS6→MS7 transitions and showed restricted MS5. Connectivity changes in temporal and frontal regions (Brodmann areas 21 and 11).FESZ: MS7 (dur/cov ↑, occ ↓); MS8 (cover ↑); MS6→MS7 transitions absent; MS5 restricted; connectivity: BA21, BA11.
Giuliani et al. (2023) [35]Highest-weighted microstate parameters (GFP peaks, sum of average occurrences, mean duration, delta between MSB and MSC, and between MSB and MSD) nonetheless showed a weak correlation with clinical and functional scores over 4 years.GFP peaks, sum of occurrence, mean duration, Δ(MSB-MSC), Δ(MSB-MSD) → weak correlations with depression, cognition, functional outcomes (4 years).
Keihani et al. (2022) [36]Occurrence and coverage of C reduced; D showed increased occurrence, coverage, and duration in SZ compared to HC. Microstate C the most predictive, followed by D and B.C ↓; D ↑ (dur/occ/cov); predictive: C > D > B.
Kim et al. (2021) [37]Increased occurrence, duration, and coverage of microstates B and C in SZ; microstate B also showed increased GFP. Reduced occurrence, duration, and coverage of microstate D in SZ; no differences in GFP. B ↑, C ↑ (dur/occ/cov); D ↓; A no change; GFP: B ↑.
Li et al. (2024) [38]Temporal, semantic, and quality-based microstate features extracted; microstate C increased frequency; D decreased in SCZ. SCZ-specific subsequences (e.g., BA, BC, ABA). Higher GEV in SCZ (88.5%) C ↑, D ↓ (freq/GEV); SCZ subsequences: BA, BC, ABA.
Lillo et al. (2022) [39]Microstates A and C increased in frequency and durations in SZ, while B and D had reduced durations and occurrence. Random walk analysis showed stable transitions in SZ. The trend component was the most informative for classification, with microstates B and D being critical for differentiation.A, C ↑ (freq/dur); B, D ↓ (freq/dur); transitions stable, B/D important for classification.
Luo et al. (2020) [40]Focus on microstate D; shorter duration and less frequent occurrence in FESZ and UHR compared to HC, with reduced coverage in FESZ, UHR, and HR groups. Alterations correlated with schizophrenia stage, showing the strongest effect in FESZ.D ↓ (dur/freq/cov) in FESZ/UHR; correlation: SZ progression.
Yan et al. (2023) [41]Reduced coverage, duration, and occurrence of microstate A in FES, UHR, and HR; increased coverage and duration of microstate C in FES; altered functional connectivity: reduced global efficiency in intra- and inter-msFCs; increased clustering coefficient in FES and UHR.A ↓ (dur/cov/occ); C ↑ (dur/cov); B/D no change; connectivity: efficiency ↓, clustering ↑.
Zhou et al. (2024) [42]Microstates A and D longer; more transitions A-D in HC; B-C occurred more frequently with increased transitions in FEP. Oscillatory features (CF, RMSF) higher in FEP. Microstate D’s duration and coverage negatively correlated with BPRS scores.A, D ↑ (dur/trans); B, C ↑ (freq/trans) in FEP; D (dur/cov) correlated with BPRS.
FESZ: First-Episode Schizophrenia; HCs: healthy controls; UHR: Ultra-High Risk; HR: High Risk; SCZ/SZ: schizophrenia; GEV: Global Explained Variance; CF: Central Frequency; RMSF: root mean square frequency; RVF: root of variance frequency; GFP: global field power; msFCs: Microstate Functional Connectivity States; BPRS: Brief Psychiatric Rating Scale; MS7, MS8: specific microstate labels; BA: Brodmann area; dur: duration; occ: occurrence; freq: frequency; cov: coverage; trans: transitions; ↑: increase, ↓: decrease.
Disclaimer/Publisher’s Note: The statements, opinions and data contained in all publications are solely those of the individual author(s) and contributor(s) and not of MDPI and/or the editor(s). MDPI and/or the editor(s) disclaim responsibility for any injury to people or property resulting from any ideas, methods, instructions or products referred to in the content.

