Simple Summary
A widely used test to establish if a person has T-cells that react against an infection or against a cancer is the enzyme-linked ImmunoSpot (ELISPOT assay). The person’s T-cells are mixed with short lengths of amino acids called peptides that span the protein targets (antigens) step-wise in an overlapping manner, in order to stimulate a measurable response in the form of countable spots on the membrane of the ELISPOT plate, which indicate cytokine secretion by individual T cells. Whilst research has shown that responsive peptides for certain individuals can be predicted by computer programs, we show that using large peptide pools representing several antigens reveal most effectively the majority of the T cell reactivity against viruses. Such an approach is also likely to be most effective in cancers.
Abstract
Synthetic peptides derived from antigen sequences are essential reagents for the detection of CD8+ cytotoxic T lymphocytes (CTLs), in assays such as ELISPOT/ImmunoSpot®. Indeed, the combination of peptides and ImmunoSpot® has been widely used for immune monitoring in numerous vaccine trials. Target antigens in pathogens or cancers may be large in size and multiple in number, often seemingly necessitating in silico peptide epitope predictions using algorithms and programs for certain HLA alleles to narrow down the numbers of required peptides. In this commentary, we discuss our data in the context of immune responses to viral and cancer antigens, concluding that systematic high-throughput immune monitoring of CD8+ T cells will provide more reliable insights on the host’s response to cancer than the reliance on select CD8+ T cell epitopes, no matter whether these are in silico predicted or even if they had been empirically established. We show the feasibility of large scale, high-throughput systematic CD8+ T cell epitope testing towards this goal.
1. Introduction
CD8+ cytotoxic T cells (CTLs) are central to the defense against virus-infected and cancer cells, but one of the major challenges for immune monitoring is that antigen-specific CTLs are rare or even very rare cells in circulation. Specific naive lymphocytes are essentially undetectable, and antigen-experienced lymphocytes, even at the peak of, for example, a viral infection, when the numbers peak, typically reach maximally 1% of all T cells, but are usually much more infrequent, often one in a thousand or even less [1], and those are just the strongest of anti-viral CTL responses. Therefore, antigen-specific CD8+ T cells typically occur at the detection limits of present technology, particularly if one defines present technology as flow cytometry. Although rare, these cells are potent, which we know from adoptive transfer experiments in animals, and from clinical trials in humans. Transferring a total one million antigen-specific T cells already dilutes the cells seven orders of magnitude amongst existing T cells in the human body and yet confers efficacy. Therefore, a limit of detection of one in a million of T cells would be adequate, but that is far below the detection limit of flow cytometry (which is around 1 in 10,000, or 0.01%). Our goal has been to reliably detect these rare cells. ImmunoSpot assays have a detection limit of one in a million [2], but even so, a major challenge has been to define the very antigens, and peptide epitopes that the CD8+ T cells target in any given individual. Without selecting the relevant peptides for CD8+ T cell immune monitoring, one is prone to get, at best, an incomplete or, as we will show, a false negative answer. For every single antigen, there are hundreds of possible antigenic determinants (epitopes), and these are, due to the extensive HLA diversity, different from individual to individual [3].
One can assume, for a number of reasons, that every antigen, and its peptide epitopes that have induced a CD8+ T cells response, contribute a valid target in the defense against the virus or the tumor. Unlike B-cells, T cells do not “care” about the antigen’s cellular location, or the antigen’s conformation, but all proteins synthesized in the cell are displayed as peptides on the target cell’s surface for CD8+ T cell recognition. Further complicating CD8+ T cells’ epitope recognition, these antigenic targets recognized do not seem fixed in their identity, but undergo a process named determinant spreading; thus, these can be expected to be moving targets [4]. In addition, with targets that persist for a long time, i.e., tumors, that withstand the immune attack, one can expect the CD8+ T cell populations that were engaged vigorously first, to undergo senescence, burning out and thus losing their potency [5].
We are, in particular, focusing on an assay called ImmunoSpot, which is a term that covers both enzyme-based ELISPOT and fluorescence-based FluoroSpot. Using the assay, we spent over 30 years trying to understand T cells ex vivo or in vivo because it is sensitive enough to pick up rare and even very rare antigen/peptide-specific CD8+ T cells. All the data that will be discussed here were derived from direct ex vivo measurements without “cheating” with ex vivo expansions. We will be looking at freshly isolated PBMC establishing the frequency of peptide-specific CD8+ T cells directly ex vivo, studying the cytokines they secrete upon antigen encounter. The ELISPOT assay schematic is shown in Figure S1a. The cells are sitting on the membrane, and if one aims for very low frequency measurement, one has to plate up to 1 million cells per well [2]; if there is a single peptide-specific CD8+ T cell among these 1 million PBMCs, then that cell will be revealed as a spot via its cytokine secretory footprint. In Figure S1b, for example, there are about 200 peptide-specific CD8+ T cells present within the one million PBMCs seeded into this well secreting interferon-gamma. The assay has no lower detection limit if one has enough cells to work with. For example, one can set up 100 replicate wells with 1 million PBMC/well with a detection limit of 1 in 1 million PBMC/well, testing in this case a total of 100 million PBMC. Every single peptide-specific CD8+ T cell within these 100 million PBMC will be detected as a pristine spot.
T cell ELISPOT assays have been around for a long time [6,7], but initially did not work well. Only after our introduction of the PVDF membrane-based assay [8] has it become the robust immune monitoring platform it is today. In Figure S1c, we show the type of assay results that were obtained before and then after we revolutionized the technique [8]. Nitrocellulose ester membranes were used in the original protocols (top wells). In the example shown, the T cell recall response to tetanus toxoid (TT) was tested on the right, with the media control shown on the left. The spots are not convincing for nitrocellulose. But, when the same assay is performed in parallel, testing the same cells, using the same IFN-gamma capture and detection antibodies, etc., but switching to a PVDF membrane one achieves a quantum leap in resolution. We now know that for the assay performed with a PVDF membrane, every single secretory footprint represents a single cell.
2. CD8+ T Cells and Their Specific Responses
CD8+ T cells recognize peptides derived from proteins that are actively biosynthesized in a cell, including virus proteins and tumor antigens. The proteins are shunted towards digestion in proteasomes and, via TAP molecules, eventually end up on MHC (HLA) class I molecules, on the surface of the cell bound to the MHC peptide binding groove and represent the ligand for the T cell receptor to recognize. Class I molecules are unique in as much as their peptide binding group is closed on both ends and, therefore, can accommodate only short peptides; anything longer than 12 amino acids does not even fit (yet, CD8+ T cell immune monitoring is mostly performed with 15-mer peptides). The peptides that CD8+ T cells recognize on the cell surface are usually nine amino acids long, being the primary reason why we have focused on nonamer peptides while studying CD8+ T cell recognition.
MHC/HLA molecules have evolved allelic diversity to make sure that different peptides (epitopes) of an antigen are being presented in a genetically outbred population [3]. Yet, most in the CD8+ T cell immune monitoring community focus on single alleles like HLA A2 simply because it is more frequent in the (Caucasian) population; it is easier to study a single allele. However, there are 2215 HLA class I alleles presently known, and even an A2-positive donor will rely on four (if A-2 homozygous), typically five other alleles to explore the antigenic universe. There is no reason to believe whatsoever that A2 is a more important restriction element than any of the other class I alleles expressed in an individual. Therefore, when studying antigen recognition by CD8+ T cells, one needs to, and we did, consider all the additional class I alleles.
Tremendous efforts have gone into predicting what the peptides will be which CD8+ T cells will recognize. There are overall two major approaches. One is the empirical one. Basically, there are libraries with peptides that have been experimentally defined as being recognized by CD8+ T cells, mostly also in the context of certain HLA restriction elements. There is also a long history of peptide elution from MHC class I molecules to study actually bound peptides [9]. Such empiric studies helped to establish knowledge about MHC–peptide binding motifs, based on which in silico predictions about epitope recognition are being made. If one is not thoroughly familiar with this field, one is likely to assume that the rules of antigen recognition have been firmly established by the former approaches. But then, there is the agnostic approach, a path we chose, testing individually every potential nonamer peptide of an antigen to study what peptides are actually recognized in individuals [8].
For such systematic agnostic studies [10], we picked a protein of human cytomegalovirus (HCMV), a protein called pp65 that is 561 amino acids (a.a.) long, and we built a nonamer peptide library that follows its sequence in single a.a. steps. This is a safe peptide length that binds class I molecules for CD8+ T cells to recognize, and the single a.a. overlaps (Figure S2a) account for the closed peptide binding site on the class I molecules, i.e., making sure that frame shifts in binding motifs do not lead to loss of binding. Results of such a systematic epitope mapping test are shown in Figure S3; in each well, a new peptide is being tested, with 553 peptides in total (Figure S3a). Clearly positive and clearly negative wells are seen. While this looks like a tremendous exercise, actually (with a bit of logistics) it is a quite a feasible one [11]. Here, for example, we needed 24 million PBMC to test the 553 peptides in 96-well ELISPOT plates. The test can also be performed with 8 million PBMC in 384-well plates whereby, by plating less cells per well, we proportionally lose resolution, however. Just to highlight how feasible these experiments are, testing 10 donors for the 553 peptides took a single investigator two days (including a 24-h incubation), including analysis time. One person and a strategy: a 96 well pipettor was used to transfer the peptides from master plates into the actual test plate whereby color coding with neutral dyes was used to ascertain peptide identity [11] (Figure S2b).
To make these types of studies systematic, we selected ten HLA A2 donors [10]. The shared HLA A2 allele was ideal for comparing actually-recognized CD8+ T cell epitopes in these donors with those that had been established in the literature before, and those that are predicted to be recognized based on in silico algorithms. Figure S3a shows the type of raw data that we obtained testing PBMC ex vivo, without prior in vitro expansion involved. A 96-well test plate is shown with media, positive control, and then the peptide series, well by well, as specified. The enlarged wells highlight a strong response targeted against two adjacent peptides representing a single epitope with a common core. This highly dominant peptide was unpredicted empirically and in silico. We have, for each donor, 18 negative controls for establishing the background (Figure S3b). Spot counts that exceed this background by more than three standard deviations were considered positive, using a criterion that defines with a 99.7% confidence that it is indeed a response [11,12,13]. Dominant peptides are more than 10 standard deviations (Figure S3c and Figure 1), and the subdominant ones are five standard deviations above the spot size in the medium control wells. Of primary interest, however, are the super-dominant peptides that induced >100 spots per well, highlighted in red (Figure 1).
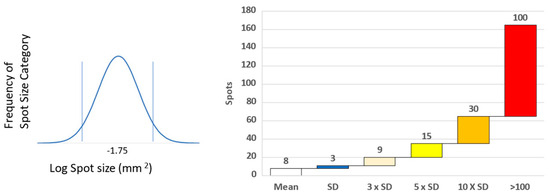
Figure 1.
Determining spot size and level of T cell response. Spot size of positive and counted spots was determined by distribution around the mean spot size determined over many experiments [12]. Level of response was related to the background unstimulated response. Cryptic epitope responses were ≥3 × SD above background, sub-dominant ≥5 × SD, dominant ≥10, whilst super-dominant were 100 spots and over (13).
Of the 533 peptides tested on each of these 10 A-2-positive subjects, only 56 recalled a positive CD8+ T cell response (Figure S4a) [14]. Therefore, only about 10% of these peptides were immunogenic in these 10 subjects. Out of all these peptides, only peptide 495 of pp65 was recognized in several of the A2-positve donors. It is the most celebrated immune dominant determinant for human CD8+ T cell immune monitoring. It should be pointed out right away that this peptide is unique because it is a universal HLA class I allele binder. Running it in silico, we found it to give a high binding score for most HLA alleles. This single peptide reflected correctly on the HCMV-primed status of 50% of the test subjects. In donor 3, however, this peptide did not induce a positive response at all, while this A2-positive subject mounted four dominant responses to other HCMV pp65 peptides. In this donor 3, therefore, testing for reactivity to the 495 peptide provided clearly false negative information of his HCMV-immune status. The same applied to donor 9. In donors 1, 4, and 5, while there was a relatively weak response to peptide 495, super-dominant responses were recalled by other HCMV peptides. Therefore, relying on the magnitude of the CD8+ T cell response to the 495 peptide as an indicator of the total HCMV-specific CD8+ memory T cells present in those individuals, the total effector cell population would be largely under-represented. Just looking at what is celebrated as the archetypic HLA-A2-restricted peptide, partial, incomplete, and frequently even false information will be gained on CD8+ T cell immunity to HCMV. Overall, as seen in Figure S4a, the super-dominant (red) peptides are scattered all over the HCMV pp65 molecule. No common pattern can be seen in spite of the fact that all these test subjects share the HLA-A2 allele. The same apparently random pattern is seen looking at the dominant recall responses (in orange), and the sub-dominant (in ocre) or cryptic (yellow) ones, as well. These results suggest that actual epitope recognition hierarchies are random, i.e., aleatory in individuals (“alea” means dice in Latin). While the ability of a peptide to bind to the HLA alleles expressed in an individual will define the entire potential epitope array that potentially could trigger a CD8+ T cell response in an individual (being different in every individual according to their HLA-makeup), other so far undefined factors define which of these peptides will actually induce a CD8+ T cell response, and define its ensuing magnitude [10]. The resulting expressed CD8+ T cell repertoire will be a fraction of the presented peptide repertoire, and different from individual to individual based on their HLA allele composition, and aleatory, in addition.
The notion of aleatory CD8+ T cell responses seems to be confirmed when one looks at determinants that were previously experimentally defined. When systematically tested, none of 32 previously defined epitopes recalled CD8+ T cells in the predicted way, but instead, the extent to which they triggered CD8+ T cells was highly variable and many times negative among the supposedly positive individuals [14]. This finding also held up for our systematic HCMV testing, where we found few of the previously published epitopes to recall dominant CD8+ T cell responses. Figure S4b shows the in silico predicted binding score of these HCMV peptides for HLA-A2. Except for the “unicorn” 495 peptide, none of the top ranked A2 binder peptides recalled a dominant CD8+ T cell response in these A2-positive subjects. The next super-dominant epitope for one of these subjects ranked at position 27 in predicted binding hierarchy. According to these findings, the predicted binding strength does not reflect on the magnitude of the CD8+ T cell response actually elicited, further confirming that other factors than mere peptide-HLA binding define whether a CD8+ T cell response becomes engaged, and how strong that response will be in any individual. Monitoring CD8+ T cell immunity in these A2-positive subjects based on in silico binding predictions would have produced data that do not accurately (more precisely, do not at all) reflect on the magnitude and fine specificity of the actual CD8+ T cell repertoire expressed in these individuals. The cumulative data are shown in Figure S4c.
We previously reported on similar findings made measuring CD8+ T cell responses to other viral antigens as well. Thus, while performing systematic epitope mapping for Hepatitis C core protein, we found that none of the many in silico predicted peptides were immune dominant, and the actually super-dominant peptides were unpredicted [10]. In a systematic review of the literature, it was reported that very few of the previously published epitopes actually match in silico epitope predictions. Evaluating the prediction performance of in silico epitope prediction, running 21,101 experimentally verified epitopes across 19 HLA-I allotypes, these authors concluded: “Importantly, it should be noted that a peptide predicted with a higher binding score for a specific HLA allotype does not necessarily imply it will be immunogenic.”
Our systematic mapping also revealed that the CD8+ T cells focus primarily on a few super-dominant (individually highly variable) epitopes in every subject. The ELISPOT approach we used permits one to establish at a single cell resolution the number of T cells that target super-dominant peptides vs peptides recognized in lower frequencies by CD8+ T cells. As seen in Figure S4c, in donor 1, for example, between 71% of all of the HCMV pp65-specific CD8+ T cells focused on only three super-dominant peptides. Such epitope dominance also applied to all the other subjects tested. These super-dominant peptides being unpredictably scattered among the donors, by missing out a single one of them, one might largely, if not entirely, underestimate the magnitude of the CD8+ T cell response in any given individual.
Collectively, all of the above findings point in one direction: perhaps we need to abandon the wishful idea that epitope recognition for an individual can predict the actually engaged CD8+ T cell repertoire. Rather than focusing on individual predicted peptides, comprehensive CD8+ T cell immune monitoring is required to assess and monitor the underlying immune response. It even appears we may need to give up the hope that monitoring the CD8+ T cell response to a single antigen, even on the simplest targets of host defense, like a virus, will suffice for revealing the magnitude of the defense reaction. In the case of HCMV, we narrowed in on pp65, but that protein is only one of many antigens of HCMV. Therefore, the question arises of how acceptable it is even to focus just on one antigen as opposed to testing them all. We addressed this question by testing for most of the HCMV antigens, those commercially available as peptide libraries. While such peptide pools consist of 15mers (a suboptimal length for class I binding) and walk protein sequences in steps of 4 amino acids (thus may skip super-dominant epitopes) and are, therefore not ideal for CD8+ cell monitoring, they still provided very clear results (Figure S4d). Focusing on pp65, one can see that most of the donors indeed target this protein. However, the magnitude of the anti-pp65 response is not representative of the extent to which other proteins of HCMV are targeted. For example, in donor 7, there was a weaker response to pp65 but approximately a 10 times higher number of T cells responded to four other antigens of the virus. This finding also applies to all other donors tested. Focusing on a single protein even, therefore, does not seem to reflect upon how many CD8+ T cells the body mobilized against the virus. As CD8+ T cells target all proteins biosynthesized in an infected cell there is no reason to believe that CD8+ T cells recognizing one of these antigens is more important than that of any other one. To test whether this observation applies for other viruses as well, we examined EBV (Figure S4e). Here too, none of the EBV antigens were found to be immune dominant. A similar picture arose studying the much simpler SARS-CoV-2 virus (Figure S4f) [10,15]: only the size of the antigen (that is, the number of potential epitopes) seemed to predict the frequency of CD8+ T cells that targeted it. These data collectively suggest that even just focusing on a single antigen of the immune target can misrepresent the magnitude of the CD8+ T cell effector potential the body has mobilized against its the entire target. The exquisite sensitivity of the ELISPOT assay combined with peptides has been demonstrated extensively across multiple studies, particularly from our lab, illustrated by responses of naïve mice [8] or naïve humans [14] compared to those immunized.
3. Quality of CD8+ Cell Responses
So far, we have assessed the magnitude of CD8+ T cell immunity by measuring the prototypic cytokine CD8+ T cells secrete upon antigen encounter, however, without consideration of its quality. Figure S5a illustrates how, by dissecting different cytokine expression patterns in a four color FluroSpot assay, you can study the type of memory CD8+ T cells engaged [16,17]: expression/co-expression of interferon gamma, TNF-alpha, IL-2, and granzyme B permits one to distinguish between resting CD8+ T memory cells (that after antigen-re-encounter produce interferon-gamma only) and polyfunctional CD8+ T cells that co-express all of these. Effector CD8+ T cells express interferon gamma, TNF-alpha, and granzyme B, but little to no IL-2. Stem cell-like CD8+ T cells primarily secrete IL-2. As CD8+ T cells become exhausted in situations of ongoing antigen stimulations, they become dysfunctional and their cytokine productivity decreases with granzyme B production being the last effector molecule expressed to disappear [5]. With further continuous stimulation, CD8+ T cells undergo senescence, and instead of secreting those which target attacking effector molecules, they start to secrete cytokines that are immune suppressive or inflammatory, e.g., IL-10, IL-6, and IL-8. Such changes in cytokine expression profiles can be identified by four color ImmunoSpot® analysis. In the example shown in Figure S6, we looked in healthy individuals at co-expression patterns of these cytokines by CD8+ T cells specific for the melanoma antigen tyrosinase [18]. In healthy donors, the tyrosinase-specific CD8+ T cell repertoire consisted of effector-, polyfunctional-, and stem cell-like CD8+ T cells. The composition of the CEF-peptide-reactive CD8+ T cell repertoire was similar. These data are presented here only to illustrate that, instead of deploying single color IFN-gamma ImmunoSpot assays for systematic high-throughput epitope mapping, such tests can be performed with four colors as well, additionally revealing deeper insights into the underlying CD8+ T cell response.
4. Conclusions
In all viral settings we have studied so far, we did not find evidence for one or few predictable immune dominant peptides’ prevalence, which suggests that relying on a few peptides is likely to produce unreliable results for immune monitoring. Apparently, there are not even immune-dominant antigens of viruses (Figure 2). To the contrary, the actually prevalent peptides are so unpredictable that in order to assess the magnitude and quality of the CD8+ T cell response, the systematic coverage of all possible epitopes of that target organism is required. For practical purposes, this can be accomplished only by using mega-peptide pools [19,20,21]. These contain up to hundreds of overlapping peptide sequences in a pool. It will be important to understand how many peptides can be pooled before they interfere with each other. Whether 15mer peptides, that walk along the antigen’s sequence in steps of four amino acids are sufficient, or whether shorter peptides walking animo acid by amino acid are needed, needs still to be established. Therefore, even in the field of viral immunity there are many open questions. We believe the complexity of the picture emerging for, in terms of the underlying immunobiology, the relatively simple anti-viral responses, will not only be found to apply to anti-tumor CD8+ T cell responses as well, but will turn out to be even way more complex due to the multitude of tumor-associated antigens present in cancer cells, the various levels to which self-tolerance or spontaneous immunity establishes itself in the host before the tumor surfaces [22], epitope spreading reactions that initially amplify the attack on the cancer cells and lead to shifting targets, and eventually, the exhaustion of the anti-tumor CD8+ T cell response as the tumor persists. Importantly, this exhaustion is likely to affect those CD8 T cells first that drive the first waves of anti-tumor responses, shifting the effector cell pool towards those that target subdominant and cryptic determinants of the tumor. If we are unable to predict epitope recognition in simple viral settings, how reliable might such predictions be for tumors?
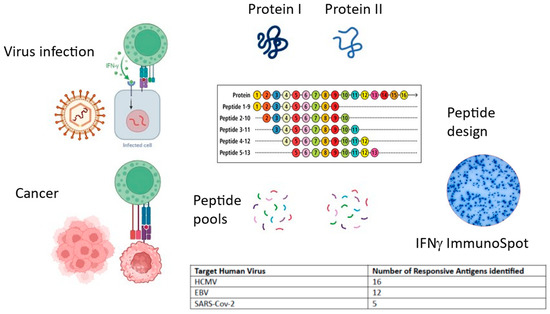
Figure 2.
Summary of commentary. Both virally infected cells and tumor cells present antigens on MHC class I to cytotoxic CD8+ T cells, instigating cytokine secretion and cytotoxic mechanisms. Peptide pools can be designed and synthesized spanning individual antigens and tested in IFNγ ImmunoSpot. T cell responses are distributed across several antigens. (Image generated using BioRender).
Supplementary Materials
The following supporting information can be downloaded at: https://www.mdpi.com/article/10.3390/onco4020006/s1, Figure S1. Principle of the T cell ImmunoSpot® assay, Figure S2. Strategy for comprehensive epitope mapping, Figure S3. Analysis of raw data, Figure S4. IFNγ ELISPOT response mapping data for 3 viruses, Figure S5. Quality of T cell responses, Figure S6. Anti-melanoma T cell qualitative data.
Author Contributions
A.A.L., P.V.L. and S.T. conceptualized, wrote, and reviewed the paper. All authors have read and agreed to the published version of the manuscript.
Funding
This research received no external funding.
Institutional Review Board Statement
The studies referred to in this paper received review board approval as indicated within each paper.
Informed Consent Statement
The studies referred to in this paper received informed consent as indicated within each paper.
Data Availability Statement
Refer to individual papers described.
Conflicts of Interest
P.V.L. is Founder, President, and CEO of Cellular Technology Limited (CTL), a company that specializes in immune monitoring by ELISPOT. A.A.L. is an employee of CTL. S.T. does consultancy work for CTL.
References
- Anikeeva, N.; Grosso, D.; Flomenberg, N.; Sykulev, Y. Evaluating frequency and quality of pathogen-specific T cells. Nat. Commun. 2016, 7, 13264. [Google Scholar] [CrossRef] [PubMed][Green Version]
- Hesse, M.D.; Karulin, A.Y.; Boehm, B.O.; Lehmann, P.V.; Tary-Lehmann, M. A T cell clone’s avidity is a function of its activation state. J. Immunol. 2001, 167, 1353–1361. [Google Scholar] [CrossRef] [PubMed]
- McMichael, A.J. HLA restriction of human cytotoxic T cells. Springer Semin. Immunopathol. 1980, 3, 3–22. [Google Scholar] [CrossRef] [PubMed]
- Lehmann, P.V.; Forsthuber, T.; Miller, A.; Sercarz, E.E. Spreading of T-cell autoimmunity to cryptic determinants of an autoantigen. Nature 1992, 358, 155–157. [Google Scholar] [CrossRef] [PubMed]
- Bevan, M.J. Understand Memory, Design Better Vaccines. Nat. Immunol. 2011, 12, 463–465. [Google Scholar] [CrossRef] [PubMed]
- Czerkinsky, C.C.; Nilsson, L.A.; Nygren, H.; Ouchterlony, O.; Tarkowski, A. A solid-phase enzyme-linked immunospot (ELISPOT) assay for enumeration of specific antibody-secreting cells. J. Immunol. Methods 1983, 65, 109–122. [Google Scholar] [CrossRef] [PubMed]
- Taguchi, T.; McGhee, J.R.; Coffman, R.L.; Beagley, K.W.; Eldridge, J.H.; Takatsu, K.; Kiyono, H. Detection of individual mouse splenic T cells producing IFN-gamma and IL-5 using the enzyme-linked immunospot (ELISPOT) assay. J. Immunol. Methods 1990, 128, 65–73. [Google Scholar] [CrossRef]
- Forsthuber, T.; Yip, H.C.; Lehmann, P.V. Induction of TH1 and TH2 immunity in neonatal mice. Science 1996, 271, 1728–1730. [Google Scholar] [CrossRef] [PubMed]
- Nicholas, B.; Skipp, P. What do cancer-specific CD8+ T cells see? The contribution of immunopeptidomics. Essays Biochem. 2023, 67, 957–965. [Google Scholar]
- Lehmann, P.V.; Suwansaard, M.; Zhang, T.; Roen, D.R.; Kirchenbaum, G.A.; Karulin, A.Y.; Lehmann, A.; Reche, P.A. Comprehensive Evaluation of the Expressed CD8+ T Cell Epitope Space Using High-Throughput Epitope Mapping. Front. Immunol. 2019, 10, 655. [Google Scholar] [CrossRef]
- Lehmann, A.; Megyesi, Z.; Przybyla, A.; Lehmann, P.V. Reagent Tracker Dyes Permit Quality Control for Verifying Plating Accuracy in ELISPOT Tests. Cells 2018, 7, 3. [Google Scholar] [CrossRef]
- Karulin, A.Y.; Karacsony, K.; Zhang, W.; Targoni, O.S.; Moldovan, I.; Dittrich, M.; Sundararaman, S.; Lehmann, P.V. ELISPOTs Produced by CD8 and CD4 Cells Follow Log Normal Size Distribution Permitting Objective Counting. Cells 2015, 4, 56–70. [Google Scholar] [CrossRef]
- Karulin, A.Y.; Caspell, R.; Dittrich, M.; Lehmann, P.V. Normal Distribution of CD8+ T-Cell-Derived ELISPOT Counts within Replicates Justifies the Reliance on Parametric Statistics for Identifying Positive Responses. Cells 2015, 4, 96–111. [Google Scholar] [CrossRef] [PubMed]
- Lehmann, A.A.; Zhang, T.; Reche, P.A.; Lehmann, P.V. Discordance Between the Predicted Versus the Actually Recognized CD8+ T Cell Epitopes of HCMV pp65 Antigen and Aleatory Epitope Dominance. Front. Immunol. 2021, 11, 618428. [Google Scholar] [CrossRef] [PubMed]
- Lehmann, A.A.; Kirchenbaum, G.A.; Zhang, T.; Reche, P.A.; Lehmann, P.V. Deconvoluting the T Cell Response to SARS-CoV-2: Specificity Versus Chance and Cognate Cross-Reactivity. Front. Immunol. 2021, 12, 635942. [Google Scholar] [CrossRef]
- Apetoh, L.; Smyth, M.J.; Drake, C.G.; Abastado, J.P.; Apte, R.N.; Ayyoub, M.; Blay, J.Y.; Bonneville, M.; Butterfield, L.H.; Caignard, A.; et al. Consensus nomenclature for CD8+ T cell phenotypes in cancer. Oncoimmunology 2015, 4, e99853. [Google Scholar] [CrossRef]
- Hanson, J.; Roen, D.R.; Lehmann, P.V. Four Color ImmunoSpot® Assays for Identification of Effector T-Cell Lineages. Methods Mol. Biol. 2018, 1808, 51–62. [Google Scholar]
- Przybyla, A.; Zhang, T.; Li, R.; Roen, D.R.; Mackiewicz, A.; Lehmann, P.V. Natural T cell autoreactivity to melanoma antigens: Clonally expanded melanoma-antigen specific CD8 + memory T cells can be detected in healthy humans. Cancer Immunol. Immunother. 2019, 68, 709–720. [Google Scholar] [CrossRef] [PubMed]
- da Silva Antunes, R.; Weiskopf, D.; Sidney, J.; Rubiro, P.; Peters, B.; Lindestam Arlehamn, C.S.; Grifoni, A.; Sette, A. The MegaPool Approach to Characterize Adaptive CD4+ and CD8+ T Cell Responses. Curr. Protoc. 2023, 3, e934. [Google Scholar] [CrossRef]
- Michelo, C.M.; Dalel, J.A.; Hayes, P.; Fernandez, N.; Fiore-Gartland, A.; Kilembe, W.; Tang, J.; Streatfield, C.; Gilmour, J.; Hunter, E.J. Comprehensive epitope mapping using polyclonally expanded human CD8 T cells and a two-step ELISpot assay for testing large peptide libraries. Immunol. Methods 2021, 491, 112970. [Google Scholar] [CrossRef]
- Chevalier, M.F.; Bobisse, S.; Costa-Nunes, C.; Cesson, V.; Jichlinski, P.; Speiser, D.E.; Harari, A.; Coukos, G.; Romero, P.; Nardelli-Haefliger, D.; et al. High-throughput monitoring of human tumor-specific T-cell responses with large peptide pools. Oncoimmunology 2015, 4, e1029702. [Google Scholar] [CrossRef] [PubMed]
- Bloy, N.; Garcia, P.; Laumont, C.M.; Pitt, J.M.; Sistigu, A.; Stoll, G.; Yamazaki, T.; Bonneil, E.; Buqué, A.; Humeau, J.; et al. Immunogenic stress and death of cancer cells: Contribution of antigenicity vs adjuvanticity to immunosurveillance. Immunol Rev. 2017, 280, 165–174. [Google Scholar] [CrossRef] [PubMed]


Disclaimer/Publisher’s Note: The statements, opinions and data contained in all publications are solely those of the individual author(s) and contributor(s) and not of MDPI and/or the editor(s). MDPI and/or the editor(s) disclaim responsibility for any injury to people or property resulting from any ideas, methods, instructions or products referred to in the content. |
© 2024 by the authors. Licensee MDPI, Basel, Switzerland. This article is an open access article distributed under the terms and conditions of the Creative Commons Attribution (CC BY) license (https://creativecommons.org/licenses/by/4.0/).