
A Systems Biology Analysis of Chronic Lymphocytic Leukemia

 ,
,  and
and 
Abstract
Simple Summary
Abstract
1. Introduction
- Deletions on the long arm of chromosome 13 (del(13q)): In patients with this aberration, the disease progresses slowly.
- Deletions on the long arm of chromosome 11 (del(11q)): This usually occurs among young males and tends to manifest with bulky lymph nodes. It is associated with rapid disease progression and short survival. The 11q chromosome contains the Ataxia–Telangiectasia-mutated gene (ATM), and ATM kinase is responsible for inhibited cell cycle progression in the case of DNA damage. Furthermore, ATM kinase acts on p53 by phosphorylating it in order to induce apoptosis. Therefore, when 11q is deleted, this phosphorylation does not occur, and the cell damage cannot be repaired [6].
- Deletion on the short arm of chromosome 17 (del(17p)): This results in the loss of TP53, which is the most important prognostic marker in CLL. It is associated with rapid disease progression and resistance to fludarabine chemoimmunotherapy. In addition to the role of TP53 as a prognostic marker in CLL, it is also fundamentally a predictive marker for chemo-immunotherapy, guiding treatment decisions and potentially influencing the response to specific therapies, such as fludarabine chemoimmunotherapy [7].
- Immunoglobulin heavy-chain variable region gene (IGHV) mutational status: For prognosis and therapy choice, it is important to detect IGHV mutational status since the unmutated state is correlated with low survival.
- Other markers, which are present in a low percentage of newly diagnosed CLL patients, but whose incidence increases in patients who are refractory to fludarabine chemotherapy, are mutations of NOTCH1, SF3B1, and BIRC3. Finally, combining genetics, clinical parameters, and biochemistry, the CLL International Prognostic Index (CLL-IPI) is a tool to predict the status of the disease [8].
2. Current Treatment Options and Experimental Drug Candidates
- Bruton tyrosine kinase inhibitors (ibrutinib and acalabrutinib),
- BCL-2 inhibitor (venetoclax),
- Purine analogs (fludarabine and pentostatin),
- Alkylating agents (cyclophosphamide, chlorambucil, and bendamustine),
- Monoclonal antibodies (rituximab, ofatumumab, and obinutuzumab),
- PI3K inhibitor (idelalisib).
- Fludarabine: a purine analogue and an antineoplastic agent.
- Cyclophosphamide: an alkylating agent.
- Rituximab: a monoclonal antibody which targets the B-lymphocyte antigen CD20 expressed on the surface of B cells.
- These three together (FCR) constitute a chemoimmunotherapy treatment:
- Bendamustine: an alkylating agent used along with Rituximab (BR) to form another combination chemoimmunotherapy treatment.
- Chlorambucil: an alkylating agent.
- Ibrutinib is a Bruton tyrosine kinase (BTK) inhibitor. BTK, an enzyme which works for B-cell survival and growth, helps delay the progression of cancer. It inhibits CLL cell migration, proliferation, and survival [10]. Unfortunately, it presents some side effects, such as pneumonia, upper respiratory tract infection, atrial fibrillation, sinusitis, headaches, nausea, and many more [10].
- PI3K (Phosphatidylinositol-3-kinase) inhibitors such as Idelalisib [11], which was FDA-approved in 2014 for use in combination with rituximab for treating relapsed CLL [12]. However, Idelalisib is also toxic with nearly 40% of patients having had to interrupt the therapy due to rash or 3–4-grade transaminitis, and pulmonary infections. A PI3Kδ inhibitor called TGR 1202 has better selectivity compared to idelalisib. It was approved for medical use in the USA in February 2021. TGR 1202 reduces the phosphorylation of AKT in lymphoma and leukemia cells.
- Venetoclax binds and inhibits the antiapoptotic protein B-cell lymphoma 2 (BCL-2) [9]. In CLL, the inhibition of this pathway has been considered an optimal therapeutic strategy [13]. The use of Venetoclax was approved by the FDA in 2016 [13]. Its side effects usually include low levels of white and red blood cells, respiratory infections, diarrhea, nausea, tiredness, and tumor lysis syndrome (TLS).
- Sotorasib (AMG510) is a highly selective and irreversible inhibitor which binds at an allosteric pocket, leading to the trapping of KRAS (Kirsten rat sarcoma virus) in an inactive GDP-bound state. Note that KRAS transmits signals for growth, division, and differentiation to the nucleus of the cell from the outside. KRAS mutations are among the most oncogenic events in carcinomas, including CLL, and a majority of them consist of missense mutation of the 12th codon (glycine). It was approved by the FDA in May 2021. Some of its side effects are diarrhea, nausea, and muscle or bone pain [14].
- Adagrasib (MRTX849) is an irreversible covalent inhibitor of G12C KRAS mutation that makes a covalent bond to cysteine and binds in the switch-II pocket of KRAS in its inactive GDP state. It demonstrated improved antitumor activity when in combination with vistusertib (an mTOR inhibitor). In clinical trials, some patients experienced pneumonitis and heart failure, which led to the interruption of the treatment. Others experienced nausea, fatigue, and anemia. This inhibitor is still in clinical trials, together with numerous other experimental drugs under development [14].
- Experimental drug candidates also include AKT pathway allosteric inhibitors: ARQ092/miransertib, BAY1125976, MK2206, and TAS-117 [15].
- ATP-competitive AKT inhibitors: Capivasertib and ipatasertib showed a favorable safety profile, along with signs of activity in phase I monotherapy trials [14]. Other AKT inhibitors include the following compounds: afuresertib (GSK2110183), uprosertib (GSK2141795 and GSK795), and ordidonin (NSC-250682) [16].
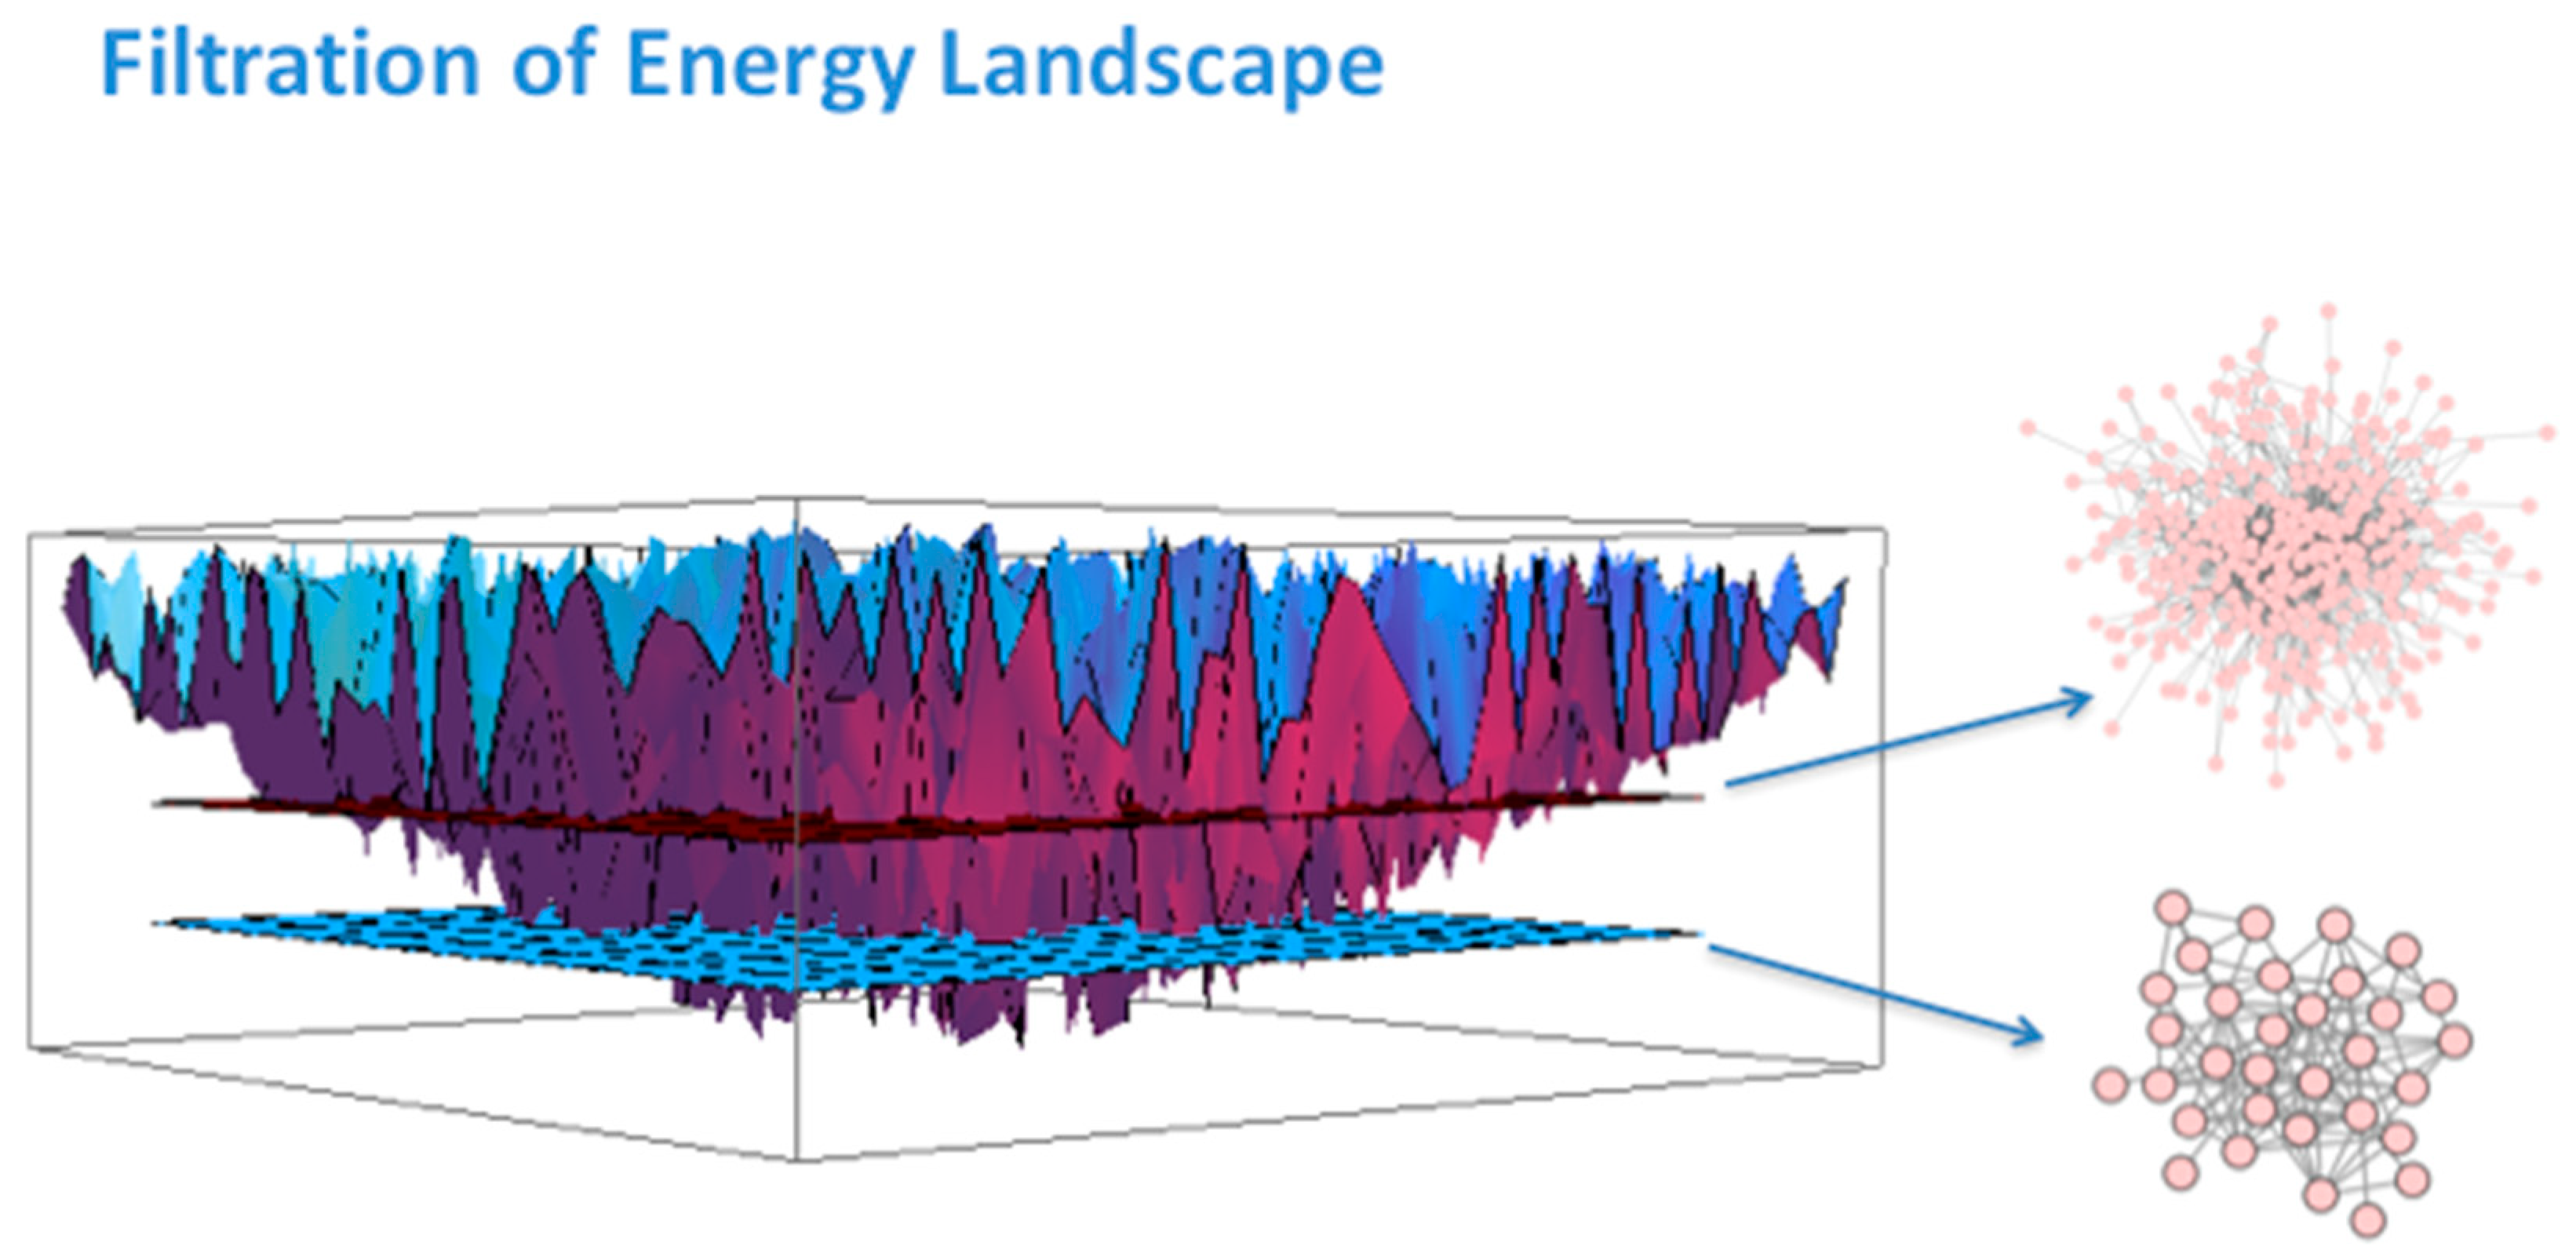
3. Systems Biology Background
4. Methodology and Datasets
5. Results
- i.
- Ref. [37] (GSE10137) “A genomic approach to improve prognosis and predict therapeutic response in chronic lymphocytic leukemia”, by Friedman et al., 2009. This was one of the papers with a large table in the Supplementary section. The table consisted of upregulated and downregulated probes indicative of progressive disease; upregulated and downregulated probes indicating chlorambucil resistance; upregulated and downregulated probes indicative of Pentostatin, Cyclophosphamide, and Rituximab signature. An important quote from the paper states that: “Others have previously noted the prognostic significance of cytoskeletal genes and the tumor necrosis factor in CLL. Notably, probes for ZAP-70 did not constitute this genomic signature, although mean expression for ZAP-70 probes in samples from patients with progressive disease was higher than those from patients with stable disease”. The table of genes was parsed from the PDF document and used in our subsequent analysis (discussed below).
- ii.
- Ref. [3] (GSE28654) “Gene expression profiling identifies ARSD as a new marker of disease progression and sphingolipid metabolism as a potential novel metabolism in chronic lymphocytic leukemia” (Trojani et al., 2012) [3]. A table in the manuscript lists about 65 genes that were selected as being differentially expressed in two cohorts of CLL patients. Of those genes, the authors selected 19 genes for PCR analysis because of their significance. Those genes are ZAP70, ARSD, LPL, ADAM29, AGPAT2, CRY1, MBOAT1, YPEL1, NRIP1, RIMKLB, P2RX1, EGR3, TGFBR3, APP, DCLK2, FGL2, ZNF667, CHPT1, and FUT8. An important quote from the paper is as follows: “In the literature, lists of differentially expressed genes obtained using high-throughput microarray by different laboratories and research centers have often limited overlap [38,39]. These differences are matters of important scientific discussions and are imputed, among other causes, to dataset dimensions: small number of subjects (some tens) with respect to the number of variables (tens of thousands of genomic probes in human). Notably and reassuringly the gene set list (65 genes) emerged from this study showed a substantial (but not quantitated) overlap with results from previously published microarray studies [40,41,42,43]”. The list of 65 genes was incorporated in our subsequent analysis.
- iii.
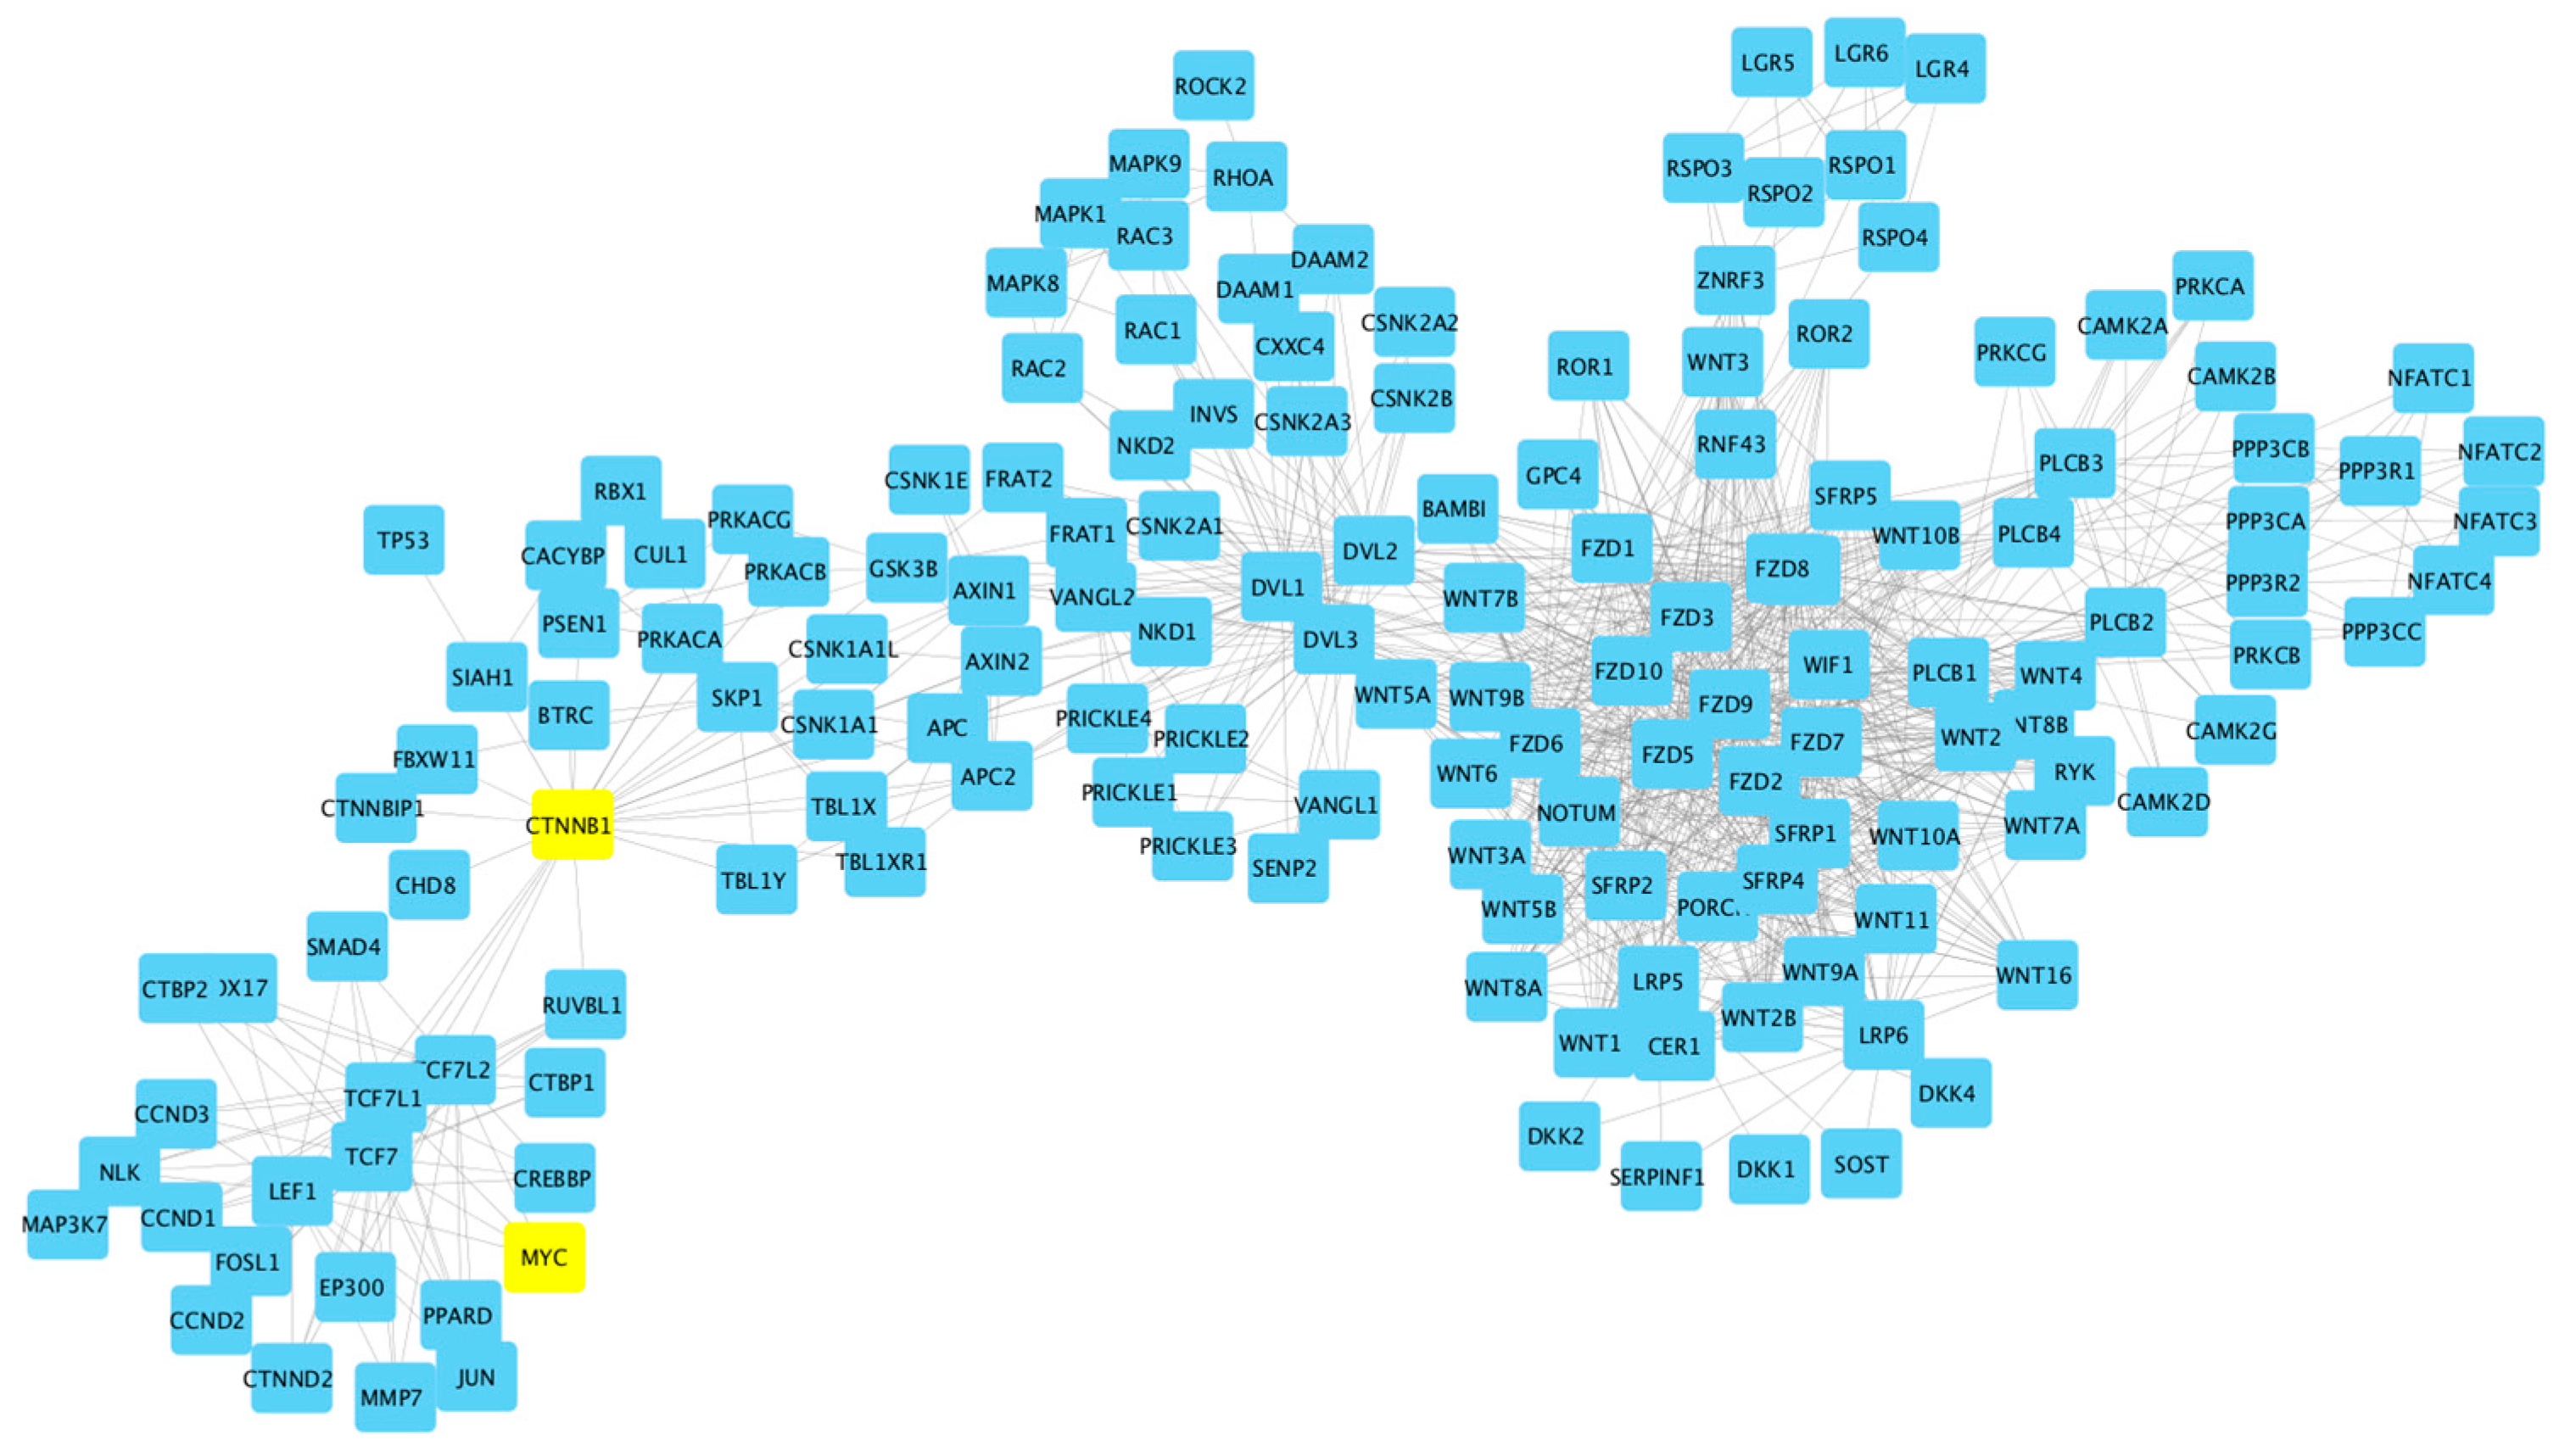
- Ref. [40] (GSE31048) “Somatic mutation as a mechanism of Wnt/-Catenin pathway activation in CLL” [40]. In the Supplementary Materials to this paper were two large tables listing genes. One table listed from their own study (Wnt pathway), and the other table listed Wnt genes from the literature and websites. Both tables were combined for the study. A quote from the paper: “… our data demonstrate that altered gene expression is indistinguishable between samples with and without mutations”.
- iv.
- Ref. [41] (GSE39671) “Subnetwork-based analysis of chronic lymphocytic leukemia identifies pathways that associate with disease progression” (Chuang et al., 2012) [41]. The Supplementary data included only figures and graphs. No table with a gene list. Of note is the following quote: “Furthermore, the marker sets identified by different research groups often share few genes in common. Two landmark studies, Rosenwald and colleagues [42] and Klein and colleagues [43] each identify approximately 100 genes that were expressed differentially by CLL cells that use mutated versus unmutated IGHV genes. However, only 4 marker genes were identified in common between these studies”.
- v.
- Ref. [44] (GSE49896) “miR-150 influences B-cell receptor signaling in chronic lymphocytic leukemia by regulating expression of GAB1 and FOXP1” (Mraz, et al., 2014) [44]. The following is quoted from their paper: “We identified miR-150 as being the most abundantly expressed miRNA in CLL. However, we observed significant heterogeneity in the expression levels of this miRNA among CLL cells of different patients. Low-level expression of miR-150 associated with unfavorable clinicobiological and prognostic markers, such as expression of ZAP-70 or use of unmutated IGHV (p < 0.005). Additionally, our data suggest that the levels of methylation of the upstream region of 1000 nt proximal to miR-150 associate with its expression. We demonstrated that GAB1 and FOXP1 genes represent newly defined direct targets of miR-150 in CLL cells. We also showed that high-level expression of GAB1 and FOXP1 associates with relatively high sensitivity of CLL cells to surface immunoglobulin ligation. High levels of GAB1/FOXP1 and low levels of miR-150 associate with a greater responsiveness to BCR ligation in CLL cells and more adverse clinical prognosis”.
- vi.
- GSE50006—no manuscript.
- vii.
- GSE69034—no manuscript.
6. Results and Discussion: Wnt Pathway
7. Conclusions
Author Contributions
Funding
Institutional Review Board Statement
Informed Consent Statement
Data Availability Statement
Conflicts of Interest
Appendix A
- chrX:101,349,447–101,390,796
- (GRCh38/hg38)
- Size:
- 41,350 bases
- Orientation:
- Minus strand
- chrX:100,604,435–100,641,212
- (GRCh37/hg19)
- Size:
- 36,778 bases
- Orientation:
- Minus strand
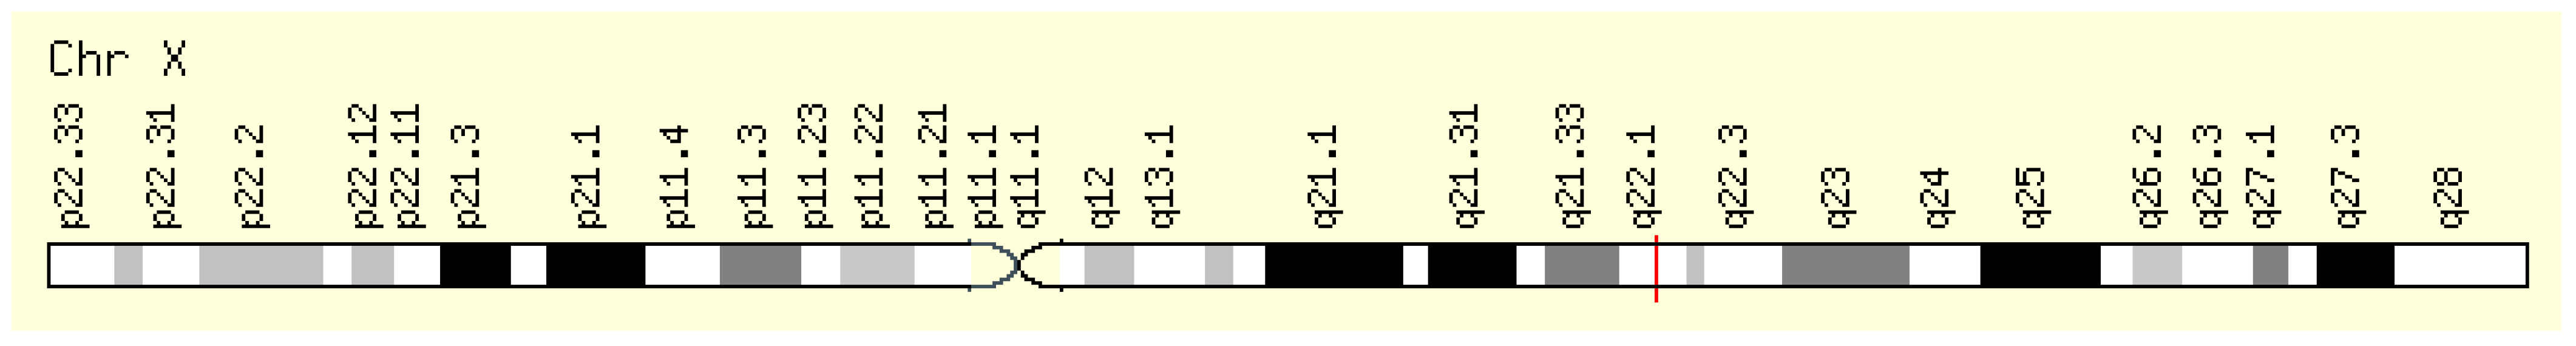
- Genes around BTK on UCSC Golden Path with GeneCards custom track.
- Xq22.1 by HGNC
- Xq22.1 by Entrez Gene
- Xq22.1 by Ensembl BTK Gene in genomic location: bands according to Ensembl, locations according to GeneLoc (and/or Entrez Gene and/or Ensembl if different)
- chr4:102,501,329–102,617,302
- (GRCh38/hg38)
- Size:
- 115,974 bases
- Orientation:
- Plus strand
- chr4:103,422,486–103,538,459
- (GRCh37/hg19)
- Size:
- 115,974 bases
- Orientation:
- Plus strand
- chr10:102,394,110–102,402,529
- (GRCh38/hg38)
- Size:
- 8420 bases
- Orientation:
- Plus strand
- chr10:104,153,867–104,162,281
- (GRCh37/hg19)
- Size:
- 8415 bases
- Orientation:
- Plus strand
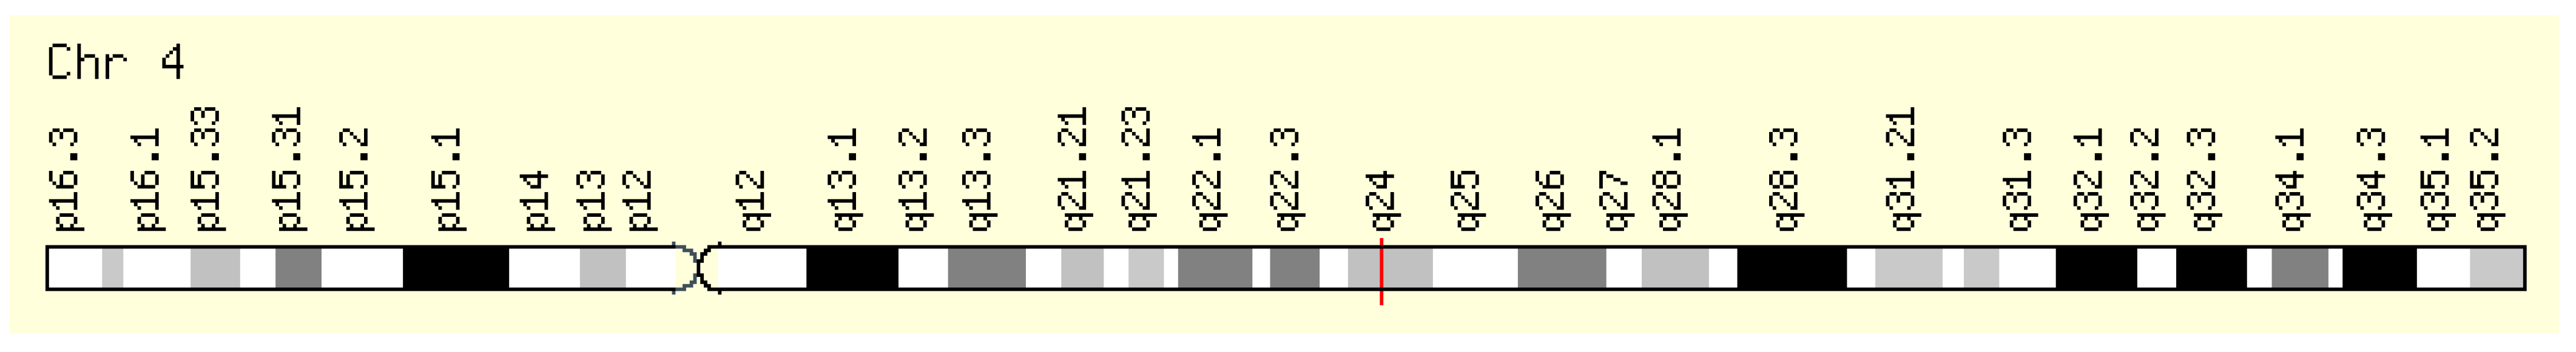
- Genes around NFKB2 on UCSC Golden Path with GeneCards custom track.
- chr1:64,833,223–65,067,754
- (GRCh38/hg38)
- Size:
- 234,532 bases
- Orientation:
- Minus strand
- chr1:65,298,906–65,432,187
- (GRCh37/hg19)
- Size:
- 133,282 bases
- Orientation:
- Minus strand
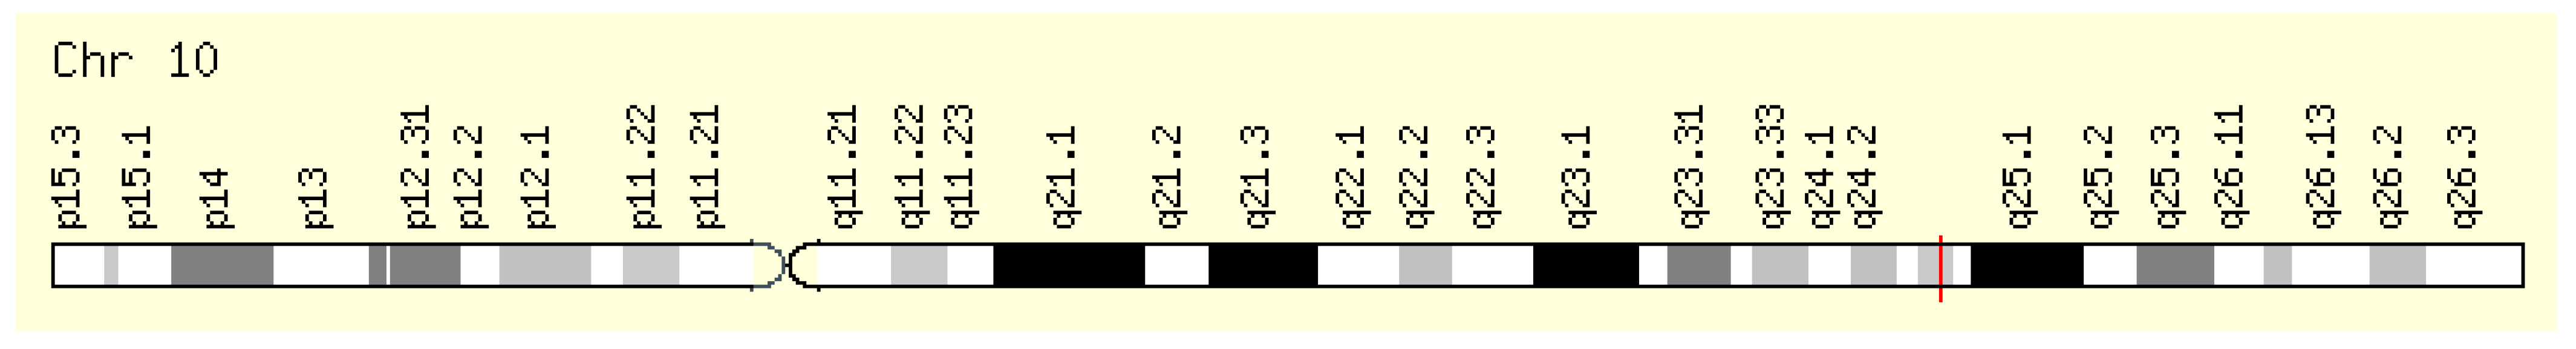
- Genes around JAK1 on UCSC Golden Path with GeneCards custom track.
- chr9:4,984,390–5,128,183
- (GRCh38/hg38)
- Size:
- 143,794 bases
- Orientation:
- Plus strand
- chr9:4,985,033–5,128,183
- (GRCh37/hg19)
- Size:
- 143,151 bases
- Orientation:
- Plus strand
- Genes around JAK2 on UCSC Golden Path with GeneCards custom track.

- Genomic Locations for JAK3 Gene
- chr19:17,824,780–17,848,071
- (GRCh38/hg38)
- Size:
- 23,292 bases
- Orientation:
- Minus strand
- chr19:17,935,589–17,958,880
- (GRCh37/hg19)
- Size:
- 23,292 bases
- Orientation:
- Minus strand
- Genes around JAK3 on UCSC Golden Path with GeneCards custom track.

- Genomic Locations for STAT1 Gene
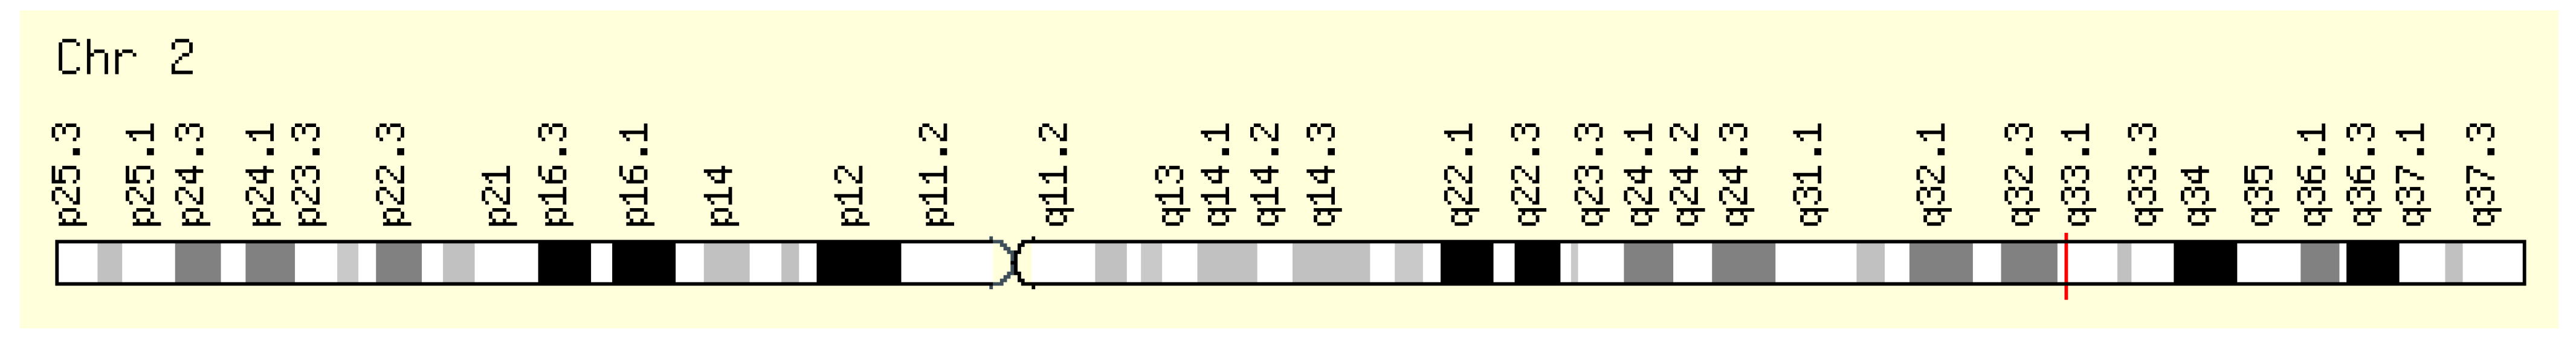
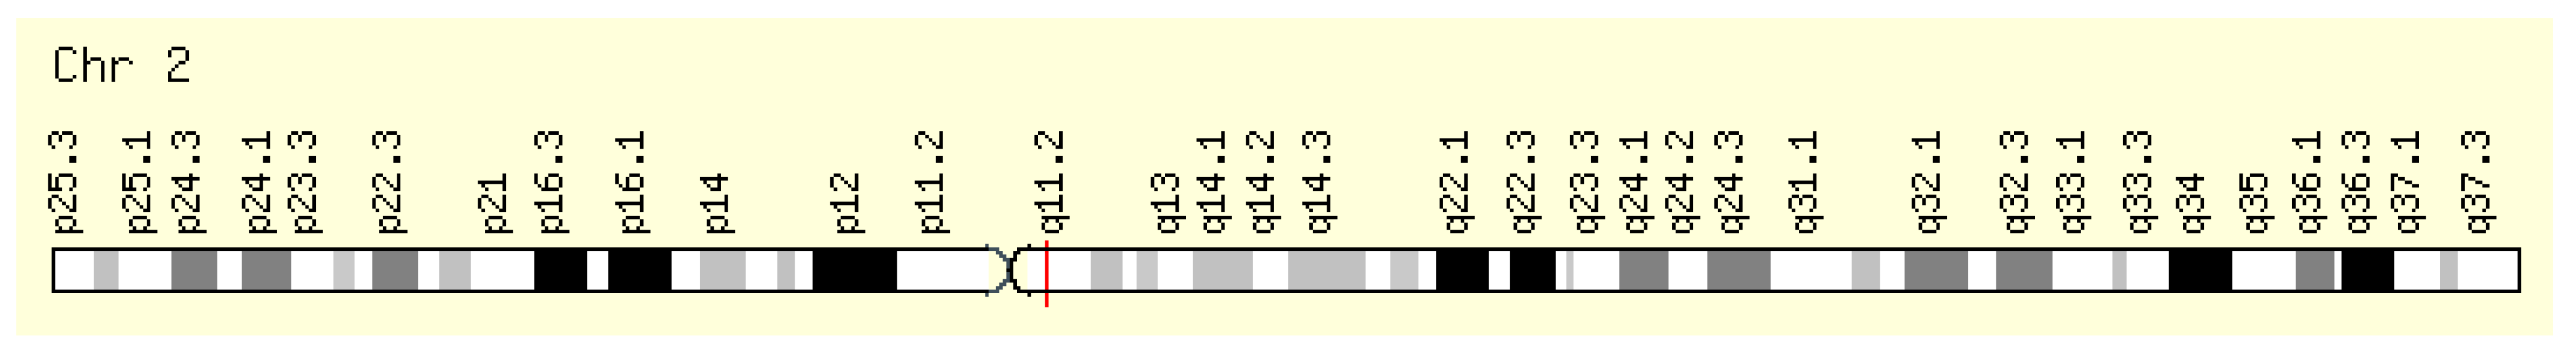
- chr2:190,964,358–191,020,960
- (GRCh38/hg38)
- Size:
- 56,603 bases
- Orientation:
- Minus strand
- chr2:191,829,084–191,885,686
- (GRCh37/hg19)
- Size:
- 56,603 bases
- Orientation:
- Minus strand
- Genes around STAT1 on UCSC Golden Path with GeneCards custom track.
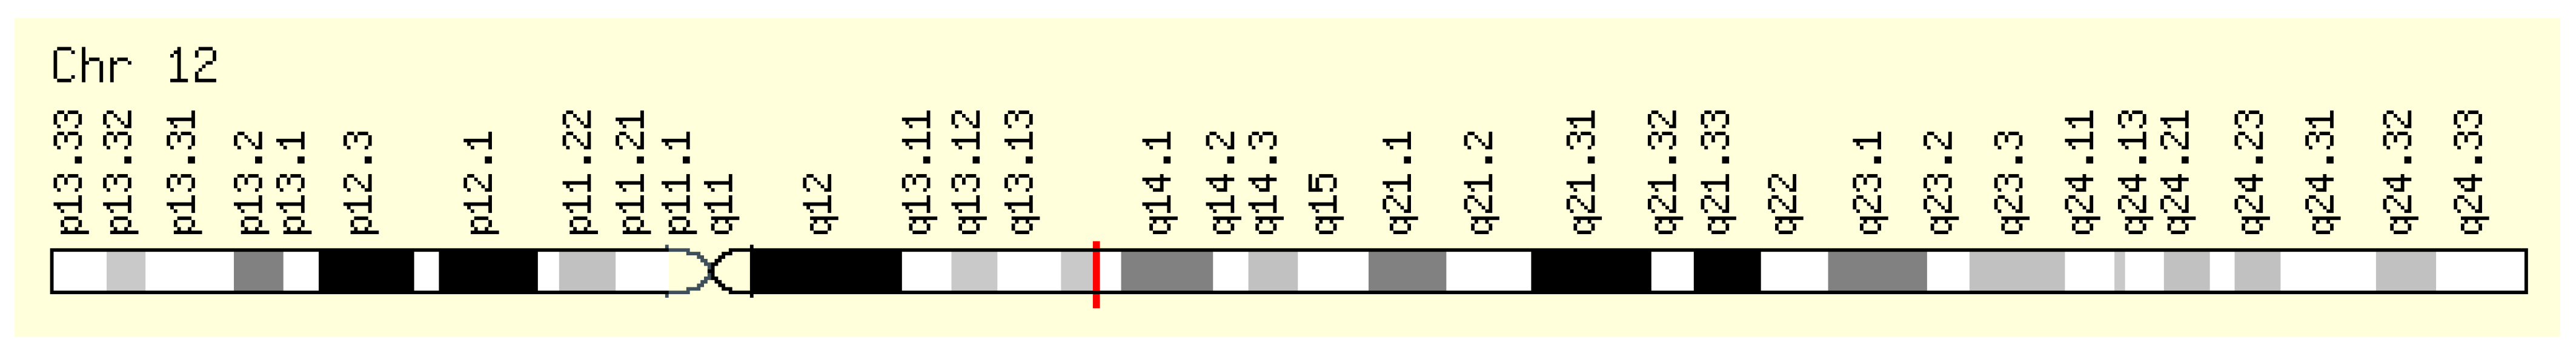
- Genomic Locations for STAT2 Gene
- chr12:56,341,597–56,360,253
- (GRCh38/hg38)
- Size:
- 18,657 bases
- Orientation:
- Minus strand
- chr12:56,735,381–56,754,037
- (GRCh37/hg19)
- Size:
- 18,657 bases
- Orientation:
- Minus strand
- Genes around STAT2 on UCSC Golden Path with GeneCards custom track.
- Genomic Locations for STAT3 Gene
- chr17:42,313,324–42,388,568
- (GRCh38/hg38)
- Size:
- 75,245 bases
- Orientation:
- Minus strand
- chr17:40,465,342–40,540,586
- (GRCh37/hg19)
- Size:
- 75,245 bases
- Orientation:
- Minus strand
- Genes around STAT3 on UCSC Golden Path with GeneCards custom track.

- Genomic Locations for NOTCH1 Gene
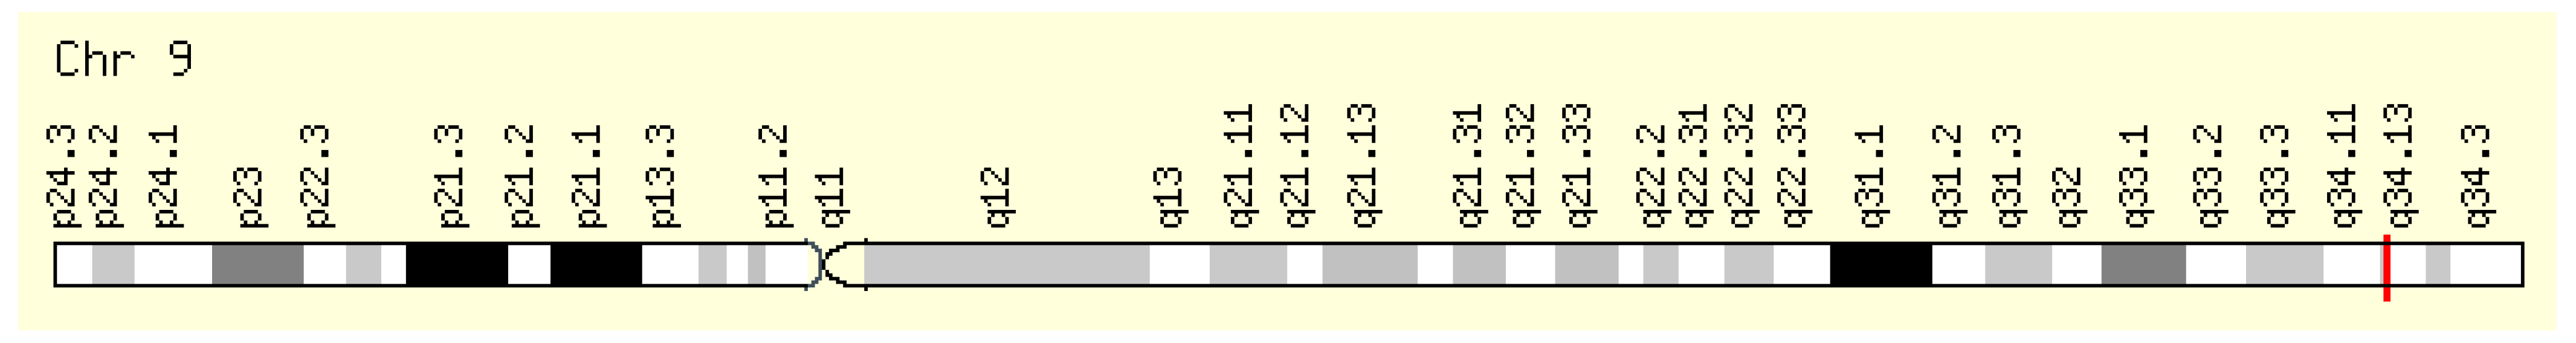
- chr9:136,494,433–136,546,048
- (GRCh38/hg38)
- Size:
- 51,616 bases
- Orientation:
- Minus strand
- chr9:139,388,896–139,440,314
- (GRCh37/hg19)
- Size:
- 51,419 bases
- Orientation:
- Minus strand
- Genes around NOTCH1 on UCSC Golden Path with GeneCards custom track.

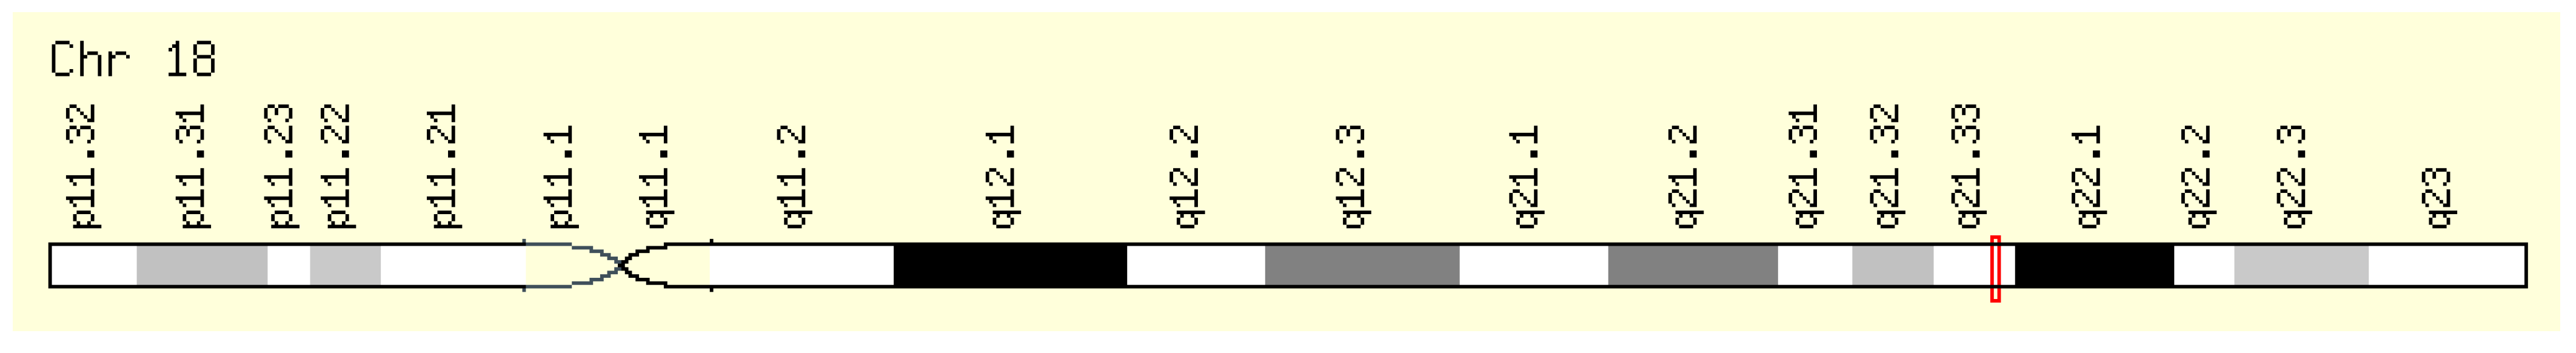
- Genomic Locations for BCL2 Gene
- chr18:63,123,346–63,320,128
- (GRCh38/hg38)
- Size:
- 196,783 bases
- Orientation:
- Minus strand
- chr18:60,790,579–60,987,361
- (GRCh37/hg19)
- Size:
- 196,783 bases
- Orientation:
- Minus strand
- Genes around BCL2 on UCSC Golden Path with GeneCards custom track.
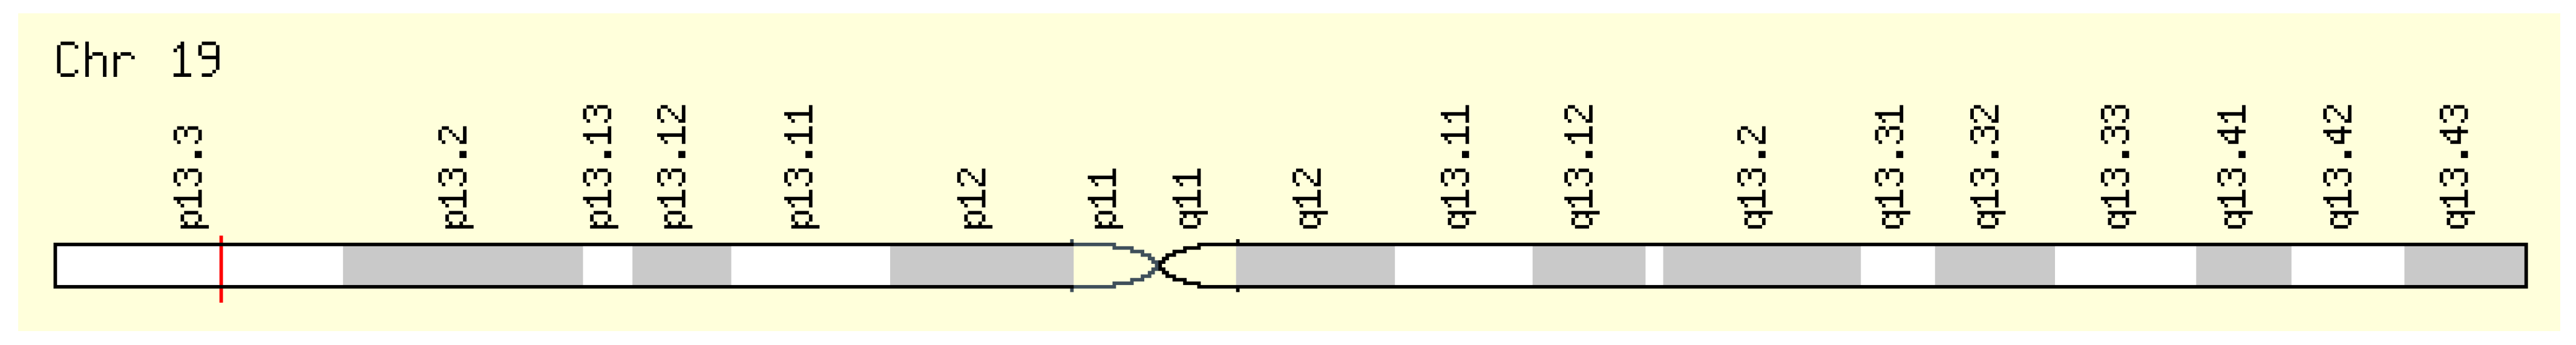
- Genomic Locations for EEF2 Gene
- chr19:3,976,056–3,985,463
- (GRCh38/hg38)
- Size:
- 9408 bases
- Orientation:
- Minus strand
- chr19:3,976,054–3,985,467
- (GRCh37/hg19)
- Size:
- 9414 bases
- Orientation:
- Minus strand
- Genes around EEF2 on UCSC Golden Path with GeneCards custom track.
- Genomic Locations for ABL1 Gene
- chr9:130,713,016–130,887,675
- (GRCh38/hg38)
- Size:
- 174,660 bases
- Orientation:
- Plus strand
- chr9:133,589,268–133,763,062
- (GRCh37/hg19)
- Size:
- 173,795 bases
- Orientation:
- Plus strand
- Genes around ABL1 on UCSC Golden Path with GeneCards custom track.
- Genomic Locations for BCRP3 Gene
- chr22:24,632,915–24,653,360
- (GRCh38/hg38)
- Size:
- 20,446 bases
- Orientation:
- Plus strand
- chr22:25,028,882–25,049,327
- (GRCh37/hg19)
- Size:
- 20,446 bases
- Orientation:
- Plus strand
- Genes around BCRP3 on UCSC Golden Path with GeneCards custom track.

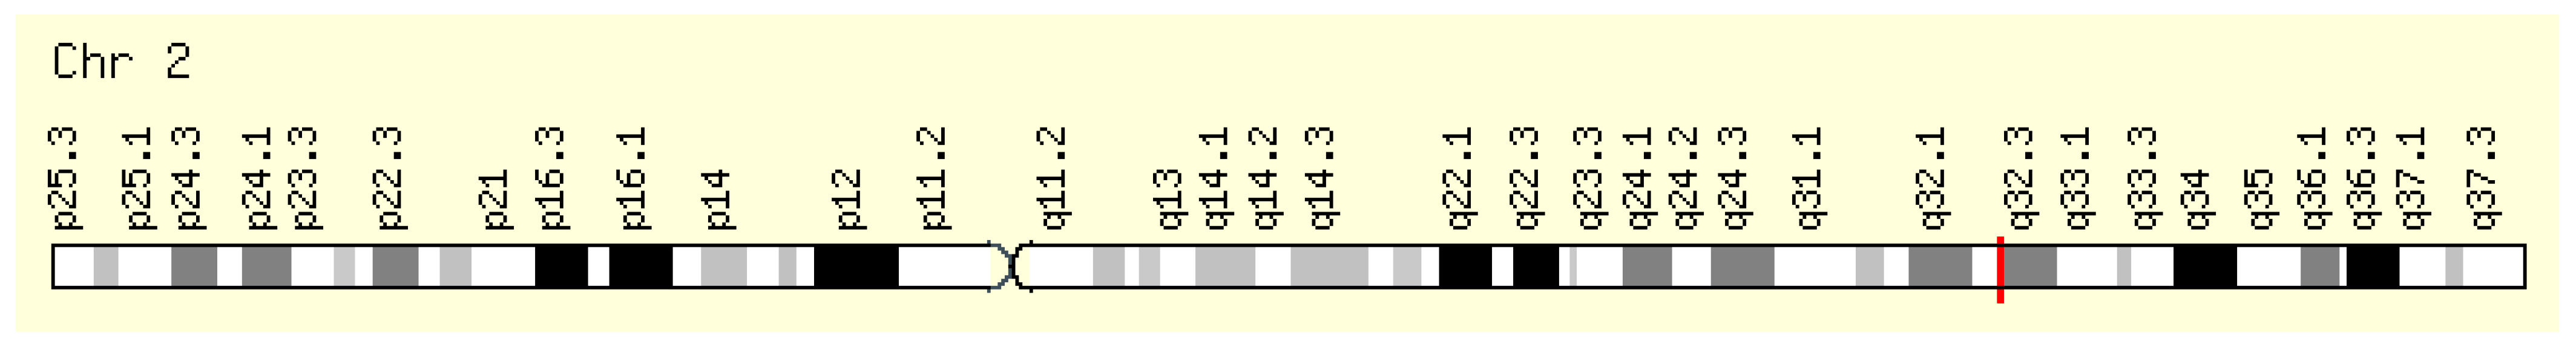
- Genomic Locations for SF3B1 Gene
- chr2:197,388,515–197,435,091
- (GRCh38/hg38)
- Size:
- 46,577 bases
- Orientation:
- Minus strand
- chr2:198,254,508–198,299,815
- (GRCh37/hg19)
- Size:
- 45,308 bases
- Orientation:
- Minus strand
- Genes around SF3B1 on UCSC Golden Path with GeneCards custom track.
- Genomic Locations for ZAP70 Gene
- chr2:97,713,560–97,744,327
- (GRCh38/hg38)
- Size:
- 30,768 bases
- Orientation:
- Plus strand
- chr2:98,330,023–98,356,325
- (GRCh37/hg19)
- Size:
- 26,303 bases
- Orientation:
- Plus strand
- Genes around ZAP70 on UCSC Golden Path with GeneCards custom track.
- Genomic Locations for MYC Gene
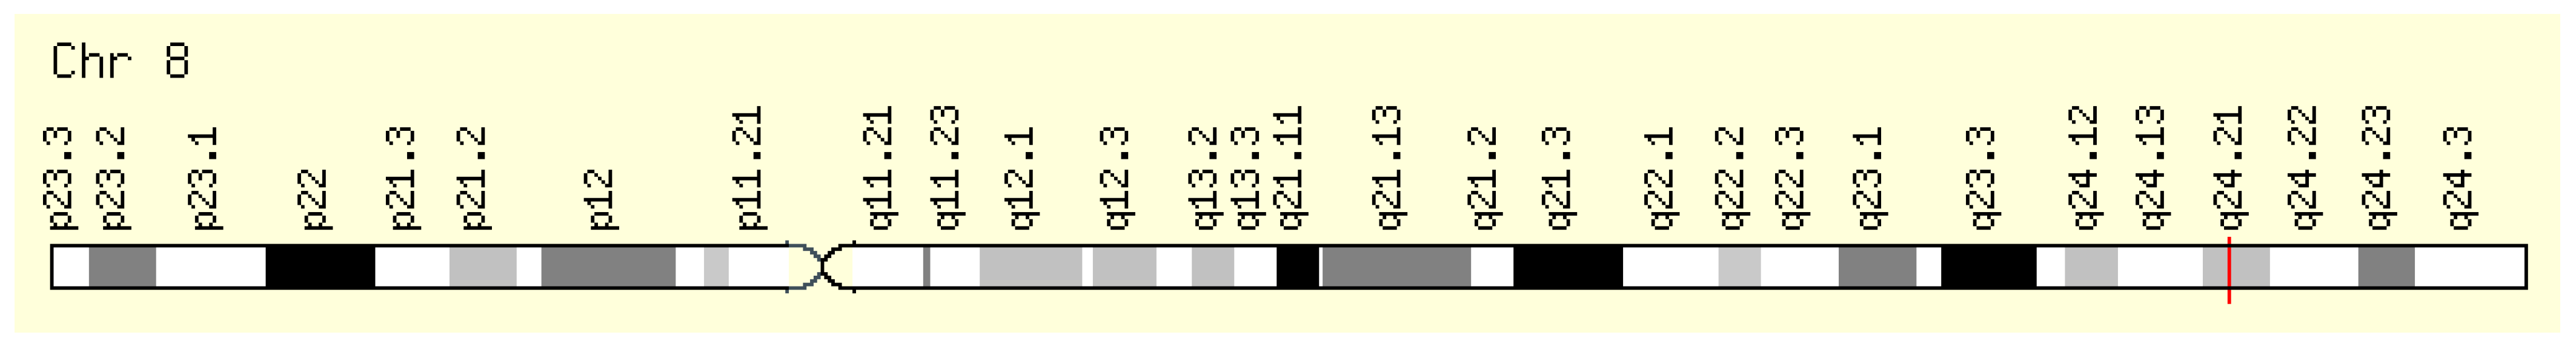
- chr8:127,735,434–127,742,951
- (GRCh38/hg38)
- Size:
- 7518 bases
- Orientation:
- Plus strand
- chr8:128,747,680–128,753,680
- (GRCh37/hg19)
- Size:
- 6001 bases
- Orientation:
- Plus strand
- Genes around MYC on UCSC Golden Path with GeneCards custom track.
Appendix B. Union of the Published Gene List Reviewed in This Study
| ABCA2 | CDC26 | FAM174B | KCNK1 | NPAS1 | REPS1 | TCF3 |
| ABCA7 | CDS1 | FAM24A | KIAA0984 | NPR1 | RFC5 | TCF4 |
| ABCE1 | CDT1 | FARP1 | KIAA1009 | NR2C2 | RHOD | TCF7 |
| ABI3 | CEBP8 | FBN1 | KIAA1529 | NR3C2 | RHOQ | TCF7L1 |
| ABRA | CEBPA | FBXW11 | KIAA1545 | NRIP1 | RHOU | TCF7L2 |
| ACVR1 | CEP68 | FBXW2 | KLF6 | NSD1 | RIMKLB | TGFB1I1 |
| ADAM17 | CER1 | FBXW4 | KLHL23 | NUDT1 | RIPK5 | TGFBR3 |
| ADAM19 | CHAF1A | FGF4 | KREMEN1 | NUP107 | RNFT2 | TLE1 |
| ADAM29 | CHD8 | FGL2 | KREMEN2 | NUP210 | ROR1 | TLE2 |
| ADAMTS7 | CHPT1 | FKBP4 | KRT18 | NUP62CL | ROR2 | TLE2 |
| AES | CLDN3 | FLJ10357 | KRT7 | ONECUT1 | RPP25 | TLE3 |
| AGPAT2 | CLDN7 | FLJ20125 | KRT8 | OR2F1 | RPRC1 | TMC5 |
| AGPAT4 | CLEC2B | FLJ20160 | L3MBTL4 | OR7E19P | RRAGC | TMEM126B |
| AKR1C2 | CNBD1 | FLJ20489 | LAMA5 | P2RX1 | RSPO4 | TMEM132A |
| AKT1 | CNOT1 | FLJ20674 | LDOC1 | PAICS | RUVBL1 | TNFRSF7 |
| ALDH1A2 | COL7A1 | FLJ23556 | LEF1 | PCDHGA1 | RUVBL2 | TNFSF11 |
| ALLC | CPM | FLJ40759 | LILRB3 | PCDHGA11 | RYK | TNFSF13 |
| ANAPC5 | CPNE7 | FRAT1 | LLGL2 | PCDHGA3 | SAP30 | TNS3 |
| ANKRD57 | CPT1A | FRAT2 | LPL | PCDHGC3 | SEC11A | TP73L |
| ANXA2 | CPZ | FRMD4A | LRCH4 | PCP4 | SEL1L | TPCN1 |
| ANXA3 | CREB3 | FRMPD1 | LRP12 | PDE11A | SEMA4B | TPST2 |
| APC | CREBBP | FRZB | LRP5 | PDE4DIP | SEMA4D | TRAK2 |
| APC2 | CRHR1 | FSCB | LRP5L | PEA15 | SEMA5A | TRAPPC6A |
| APOB | CRY1 | FUT8 | LRP6 | PEX5 | SENP2 | TRERF1 |
| APP | CRYBB2P1 | FZD1 | LRRFIP2 | PFTK1 | SEP10 | TRIM2 |
| APRT | CSF1 | FZD2 | LSM4 | PGLS | SEPP1 | TRIM43 |
| ARHGAP8 | CSNK1A1 | FZD3 | LTK | PHEX | SERPINB2 | TRIM9 |
| ARHGEF17 | CSNK1D | FZD4 | LUM | PIGC | SERPINF1 | TRSPAP1 |
| ARSD | CSNK1E | FZD5 | MAGED2 | PIGF | SEZ6L | UCHL1 |
| ASPA | CSNK1G1 | FZD6 | MAK | PIN1 | SFN | UGCG |
| ASPSCR1 | CSNK2A | FZD7 | MAN2B1 | PITX2 | SFRP1 | UHRF1 |
| ATOX1 | CSNK2A1 | FZD8 | MANEA | PKP2 | SFRP2 | UNC93B1 |
| ATP10B | CSPG6 | FZD9 | MAP3K5 | PKP3 | SFRP4 | USP7 |
| ATP13A1 | CTAG2 | GALNT2 | MAP3K7IP1 | PLAA | SFRP5 | VAMP5 |
| ATP2A3 | CTBP1 | GAST | MAP4K1 | PLCXD2 | SIGLEC8 | VASH1 |
| ATP6V0E | CTBP2 | GBF1 | MAP7 | PLD1 | SIRPG | VASP |
| AVP | CTCF | GEMIN4 | MARCKS | PLEKHG4 | SIX6 | VPS37B |
| AXIN1 | CTNNB1 | GGTLA4 | MBOAT1 | PNCK | SKP2 | WDFY4 |
| AXIN2 | CTNNBIP1 | GHRHR | MCM2 | POLE2 | SLA2 | WDR62 |
| B3GNT4 | CXXC4 | GINS2 | MCM3AP | POLR2G | SLC12A9 | WIF1 |
| B4GALT2 | CYB5R1 | GJB3 | MCOLN3 | PORCN | SLC25A20 | WIPI1 |
| B4GALT6 | DAAM1 | GNG8 | MCP | PPL | SLC25A23 | WISP1 |
| BANF2 | DCI | GNGT2 | MDFIC | PPM1A | SLC27A2 | WNT1 |
| BCAT1 | DCLK2 | GNPTAB | ME2 | PPM1L | SLC9A3R1 | WNT10A |
| BCL9 | DDX23 | GOT2 | MED9 | PPP2CA | SMAD2 | WNT11 |
| BRD7 | DEGS1 | GPLD1 | MGC9913 | PPP2R1A | SMAD3 | WNT16 |
| BTN3A3 | DENND1C | GPR177 | MICAL1 | PPP2R3A | SMAD4 | WNT2 |
| BTRC | DIP2C | GSK3A | MINK1 | PPP2R5B | SMARCA4 | WNT2B |
| C10orf75 | DIXDC1 | GSK3B | MKLN1 | PPP4R2 | SMPD1 | WNT3 |
| C10orf86 | DKK1 | Gene | MMP14 | PRELP | SNAI2 | WNT4 |
| C12orf10 | DKK2 | HBP1 | MMP2 | PRICKLE1 | SOSTDC1 | WNT5A |
| C16orf24 | DKK3 | HDAC1 | MRPL41 | PRKCA | SOX17 | WNT5B |
| C16orf33 | DKK4 | HEG1 | MRPS33 | PRKCB | SOX4 | WNT6 |
| C16orf45 | DLEC1 | HGF | MTM1 | PRKRIR | SPARC | WNT7A |
| C19orf21 | DMD | HIST1H1C | MUC5B | PRPF40B | SPATA1 | WNT7B |
| C1orf77 | DOCK9 | HLA-DQA1 | MYC | PRR4 | SPG20 | WNT8A |
| C20orf42 | DSC1 | HNF1A | MYO15B | PSD3 | SPHK1 | WNT9A |
| C20orf67 | DSP | HNRPLL | MYO5C | PSEN1 | SPINT2 | WSB2 |
| C20orf74 | DUS2L | HOM-TES-103 | MZF1 | PSMD8 | SRPK2 | YOEL1 |
| CALCOCO1 | DVL1 | HOMER3 | NAPB | PTCH1 | SRPX | ZAP70 |
| CALD1 | DVL2 | HOXD3 | NAV3 | PTGER3 | ST5 | ZBTB33 |
| CALU | DVL3 | HSP90B1 | NBEAL2 | PTGES3 | SUPT3H | ZCCHC11 |
| CAPG6 | DYNLL1 | ICA1L | NBPF8 | PTPLAD2 | SUSD3 | ZFHX1B |
| CARS2 | EDG5 | IGF1R | NDP | PTPN6 | SYCP1 | ZFP64 |
| CASKIN2 | EGR3 | IGF2R | NDUFC2 | PTPRG | SYDE1 | ZNF135 |
| CBWD2 | EHMT1 | IL13RA2 | NDUFV1 | PYGO1 | SYNC1 | ZNF451 |
| CBY1 | ELF1 | INVS | NEBL | PYGO2 | SYT5 | ZNF578 |
| CCDC24 | ENG | IRAK2 | NIPSNAP3B | RAB26 | TACSTD1 | ZNF667 |
| CCNB2 | EP300 | JAG2 | NKD1 | RAB7L1 | TBC1D1 | ZNF787 |
| CCT4 | EPHA3 | JTV1 | NKD2 | RARA | TBC1D22A | |
| CCT7 | EPS15L1 | JUP | NLK | RBM35B | TBC1D2B | |
| CCT8 | EXOSC1 | KALRN | NLRC3 | RCC1 | TBP | |
| CD58 | EXPH5 | KCNJ16 | NOP17 | RCN1 | TCEB3 |
Appendix C. Integrative Analysis of CLL by t-SNE Visualization

- Cluster A encapsulates a significant cohort focusing on the Wnt signaling pathway, a key player in CLL pathogenesis, with a total of 179 patients. Within this cluster, 21 are wild type, while 158 are CLL-patient samples, all derived from the GSE31048 dataset. This dataset offers a unique look at both normal and CLL-affected B cells, allowing for a direct comparison of Wnt pathway gene expression and Wnt-regulated gene expression. The marked difference in numbers between the normal (12 and 9, respectively) and sick (149 and 9, respectively) groups underscores the aberrant expression within CLL-affected B cells, highlighting the pathway’s prominence in these cellular states. The study’s in-depth focus on the Wnt pathway is well-founded, as it is pivotal in cellular processes that are often disrupted in CLL, thus potentially illuminating new therapeutic avenues.
- Cluster B includes a smaller, yet focused subset of 42 patients, of which 12 are wild-type and 30 are CLL patients. This cluster continues the examination of the Wnt pathway’s role in CLL as part of the GSE31048 study, indicative of a unique or divergent role of Wnt signaling in this subset. It is particularly noteworthy that this dataset includes expression data from CLL B cells with and without Wnt3a treatment, providing insights into the pathway’s functionality and potential for targeted therapies. The comparative analysis of Wnt gene expression between the normal and CLL B cells offers additional evidence for the pathway’s critical role in the disease process.
- Cluster C, with 136 patients, 24 normal and 112 sick, merges data from two distinct studies, GSE10139 and GSE50006, providing a broader scope by incorporating a genomic approach from GSE10139 to improve prognosis and therapeutic response predictions, and juxtaposes this with expression data from CLL tumors and healthy donor B cells from GSE50006. The inclusion of CLL-blood samples enriches the dataset, illustrating the heterogeneity within CLL and potentially reflecting different disease phases or subtypes. The blend of these datasets furnishes a more comprehensive understanding of the disease, highlighting the heterogeneity of CLL and reinforcing the necessity of personalized medicine approaches.
- Cluster D presents a cohort of 152 patients, predominantly sick (144) with a small representation of normal B cells (8), combining data from GSE10139 and GSE50006. This distribution, primarily composed of CLL and CLL-blood samples, continues to emphasize the genetic and expression-level diversity found in CLL, supporting the need for an in-depth analysis to discern the nuances of the disease’s progression and the potential response to treatments.
- Cluster E is a homogeneous group consisting entirely of 100 sick patients from the GSE49896 dataset. This study spotlights the microRNA-150’s influence on B-Cell Receptor signaling by modulating GAB1 and FOXP1 gene expressions, which are implicated in CLL. MicroRNAs are crucial post-transcriptional regulators, and their role in CLL adds an additional layer to our understanding of the disease’s complexity and potential intervention points.
- In Cluster F, 130 CLL patients from the GSE39671 dataset were studied, all of whom had undergone treatment. The data represent a temporal progression, with sampling times to first treatment recorded, allowing for an exploration of the disease’s evolution over time. The dataset’s analysis provides prognostic subnetworks which can help predict disease progression and highlight the converging pathways in CLL, opening new avenues for tailored treatments.
- Cluster G, comprising 75 CLL patients from the GSE69034 study, delves into the gene expression profiles linked with the MYD88 L265P mutations in conjunction with IGHV mutation status. The presence of the MYD88 L265P mutation, a notable variant found within the MYD88 gene that encodes a key adaptor protein in the Toll-like receptor and IL-1 receptor pathways, has been tied to specific prognostic outcomes in CLL. This mutation is known to activate downstream signaling pathways aberrantly, which can contribute to the uncontrolled proliferation of B cells characteristic of CLL. The dataset’s inclusion in the study facilitates a detailed investigation into the mutation’s role and its pathway associations in CLL, offering a potential explanation for the varying responses to treatment observed in patient populations. By analyzing the gene expression patterns influenced by the MYD88 L265P mutation, alongside the IGHV mutation status, a well-established prognostic marker in CLL, it unravels the complex interplay between genetic aberrations and their impact on the disease’s clinical course. The correlation between MYD88 L265P mutations and factors such as treatment resistance, disease progression, and overall survival can be assessed. This is particularly crucial, as the mutation’s impact on signaling pathways may suggest new therapeutic targets or strategies for intervention. Groundbreaking biomarkers are likely to be identified for early detection and prognosis by understanding the biological context in which these mutations operate, while also highlighting the therapeutic relevance of targeting the MYD88 pathway in certain subsets of CLL patients, thus implying the importance of precision medicine in the management of CLL. Based on the insights into the specific mutations driving the disease in individual patients, therapies can be customized to target these genetic abnormalities more effectively. In the case of MYD88 L265P, its presence could signify a need for targeted inhibitors that can mitigate its downstream effects, thereby introducing a new dimension to personalized CLL treatment paradigms.
- Cluster H is a cohort of 84 CLL patients from GSE28654, all carrying the IgVHMT mutation and exhibiting negative ZAP-70 expression. The absence of ZAP-70 expression, a kinase linked to CLL, together with the mutational profile, provides a critical connection for investigation. This relationship implicates the substantial impact of the mutation on CLL’s clinical progression and pinpoints the need for a detailed genetic analysis in crafting specialized treatments.
- In Cluster I, 28 sick patients from GSE28654 were categorized by the presence of the IgVHUM mutation and positive ZAP-70 expression, helping us to understand the disease’s heterogeneity, since ZAP-70 positivity is often linked with a more aggressive CLL form. The combination of mutational status and ZAP-70 expression levels provides valuable prognostic information.
- ○
- The expression of ZAP-70 in CLL and its relevance as a molecular marker is particularly illuminating. For Cluster H, the collective profile of CLL patients characterized by the IgVHMT mutation yet displaying an absence of ZAP-70 expression represents a subset where traditional prognostic markers may predict a more favorable clinical course. In the broader landscape of our findings, this cluster could suggest that ZAP-70’s negativity may reflect a less aggressive form of CLL, where the malignant B cells might not engage in the same signaling pathways that are characteristic of more virulent variants. Consequently, these insights bolster the argument for personalized therapeutic approaches, enabling clinicians to tailor treatments to the specific molecular makeup presented by individual CLL cases. Conversely, patients in Cluster I, characterized by the IgVHUM mutation concomitant with positive ZAP-70 expression, suggest a more aggressive manifestation of the disease. This association aligns with the understanding that ZAP-70 positivity mirrors the behavior of unmutated IgVH status, commonly linked to a robust disease progression and a less favorable response to conventional therapies. Here, ZAP-70 serves not just as a prognostic marker but potentially as a therapeutic target, whereby modulation of its expression or function could impact CLL cell survival. This reiterates the substantial role that ZAP-70 plays in CLL. It acts as a bifurcation point in the disease’s prognostic roadmap, where its expression could either denote a need for more aggressive treatment or suggest a less intensive therapeutic course. The interplay of ZAP-70 with IgVH mutation status, as demonstrated in our clusters, provides a clearer understanding of disease heterogeneity and patient stratification. The overall results of the study thus advocate for the integration of ZAP-70 status into prognostic models and therapeutic decision-making algorithms, emphasizing its contribution not only to prognostication but potentially to the development of targeted CLL therapies.
- Cluster J, mirroring Cluster G, includes another set of 75 CLL patients from the GSE69034 dataset, indicating the significant role of MYD88 L265P mutations in CLL, providing a robust dataset for the exploration of mutation-associated gene expression patterns and their prognostic significance.
References
- NHS. Overview—Chronic Lymphocytic Leukaemia. 7 February 2022. Available online: https://www.nhs.uk/conditions/chronic-lymphocytic-leukaemia/ (accessed on 30 July 2022).
- Zhang, S.; Kipps, T.J. The pathogenesis of chronic lymphocytic leukemia. Annu. Rev. Pathol. 2014, 9, 103–118. [Google Scholar] [CrossRef] [PubMed] [PubMed Central]
- Trojani, A.; Di Camillo, B.; Tedeschi, A.; Lodola, M.; Montesano, S.; Ricci, F.; Vismara, E.; Greco, A.; Veronese, S.; Orlacchio, A.; et al. Gene expression profiling identifies ARSD as a new marker of disease progression and the sphingolipid metabolism as a potential novel metabolism in chronic lymphocytic leukemia. Cancer Biomark. 2012, 11, 15–28. [Google Scholar] [CrossRef] [PubMed]
- Hallek, M.; Shanafelt, T.D.; Eichhorst, B. Chronic lymphocytic leukaemia. Lancet 2018, 391, 1524–1537. [Google Scholar] [CrossRef] [PubMed]
- Kamdar, M. “CLL Society”, Prognostic Factors in CLL. 27 September 2017. Available online: https://cllsociety.org/2017/09/prognostic-factors-cll/ (accessed on 31 July 2022).
- Mukkamalla, S.K.R.; Taneja, A.; Malipeddi, D.; Master, S.R. Chronic Lymphocytic Leukemia. In StatPearls; StatPearls Publishing: Treasure Island, FL, USA, 2023; Updated 15 January 2023. Available online: https://www.ncbi.nlm.nih.gov/books/NBK470433/ (accessed on 15 March 2023).
- Cohen, J.A.; Bomben, R.; Pozzo, F.; Tissino, E.; Härzschel, A.; Hartmann, T.N.; Zucchetto, A.; Gattei, V. An Updated Perspective on Current Prognostic and Predictive Biomarkers in Chronic Lymphocytic Leukemia in the Context of Chemoimmunotherapy and Novel Targeted Therapy. Cancers 2020, 12, 894. [Google Scholar] [CrossRef] [PubMed] [PubMed Central]
- Redaelli, A.; Laskin, B.L.; Stephens, J.M.; Botteman, M.F.; Pashos, C.L. The clinical and epidemiological burden of chronic lymphocytic leukaemia. Eur. J. Cancer Care 2004, 13, 279–287. [Google Scholar] [CrossRef] [PubMed]
- Janovská, P.; Bryja, V. Wnt signalling pathways in chronic lymphocytic leukaemia and B-cell lymphomas. Br. J. Pharmacol. 2017, 174, 4701–4715. [Google Scholar] [CrossRef] [PubMed]
- Bewarder, M.; Stilgenbauer, S.; Thurner, L.; Kaddu-Mulindwa, D. Current Treatment Options in CLL. Cancers 2021, 13, 2468. [Google Scholar] [CrossRef] [PubMed]
- Yang, J.; Nie, J.; Ma, X.; Wei, Y.; Peng, Y.; Wei, X. Targeting PI3K in cancer: Mechanisms and advances in clinical trials. Mol. Cancer 2019, 18, 26. [Google Scholar] [CrossRef] [PubMed]
- Brown, J.R. The PI3K pathway: Clinical inhibition in chronic lymphocytic leukemia. Semin. Oncol. 2016, 43, 260–264. [Google Scholar] [CrossRef]
- Gentile, M.; Petrungaro, A.; Uccello, G.; Vigna, E.; Recchia, A.G.; Caruso, N.; Bossio, S.; De Stefano, L.; Palummo, A.; Storino, F.; et al. Venetoclax for the treatment of chronic lymphocytic leukemia. Expert. Opin. Investig. Drugs 2017, 26, 1307–1316. [Google Scholar] [CrossRef]
- Nagasaka, M.; Potugari, B.; Nguyen, A.; Sukari, A.; Azmi, A.S.; Ou, S.I. KRAS Inhibitors- yes but what next? Direct targeting of KRAS- vaccines, adoptive T cell therapy and beyond. Cancer Treat. Rev. 2021, 101, 102309. [Google Scholar] [CrossRef] [PubMed]
- Martorana, F.; Motta, G.; Pavone, G.; Motta, L.; Stella, S.; Vitale, S.R.; Manzella, L.; Vigneri, P. AKT Inhibitors: New Weapons in the Fight Against Breast Cancer? Front. Pharmacol. 2021, 12, 662232. [Google Scholar] [CrossRef] [PubMed]
- Bay1125976, Akt1 Inhibitor—Selleckchem.com. Available online: https://www.selleckchem.com/products/bay1125976.html (accessed on 30 July 2022).
- Martínez-Martín, S.; Soucek, L. MYC inhibitors in multiple myeloma. Cancer Drug Resist. 2021, 4, 842–865. [Google Scholar] [CrossRef] [PubMed]
- MYCI361 (NUCC-0196361). Available online: https://www.medchemexpress.com/myci361.html (accessed on 20 April 2024).
- MICi975 (NUCC-0200975). Available online: https://www.probechem.com/products_MYCi975.html (accessed on 20 April 2024).
- Whitfield, J.R.; Soucek, L. The long journey to bring a Myc inhibitor to the clinic. J. Cell Biol. 2021, 220, e202103090. [Google Scholar] [CrossRef] [PubMed]
- Rietman, E.A.; Scott, J.G.; Tuszynski, J.A.; Klement, G.L. Personalized anticancer therapy selection using molecular landscape topology and thermodynamics. Oncotarget 2017, 8, 18735–18745. [Google Scholar] [CrossRef] [PubMed]
- Rietman, E.A.; Platig, J.; Tuszynski, J.A.; Lakka Klement, G. Thermodynamic measures of cancer: Gibbs free energy and entropy of protein-protein interactions. J. Biol. Phys. 2016, 42, 339–350. [Google Scholar] [CrossRef]
- Benzekry, S.; Tuszynski, J.A.; Rietman, E.A.; Lakka Klement, G. Design principles for cancer therapy guided by changes in complexity of protein-protein interaction networks. Biol. Direct. 2015, 10, 32. [Google Scholar] [CrossRef] [PubMed]
- Hinow, P.; Rietman, E.A.; Omar, S.I.; Tuszyński, J.A. Algebraic and topological indices of molecular pathway networks in human cancers. Math. Biosci. Eng. 2015, 12, 1289–1302. [Google Scholar] [CrossRef] [PubMed]
- Breitkreutz, D.; Hlatky, L.; Rietman, E.; Tuszynski, J.A. Molecular signaling network complexity is correlated with cancer patient survivability. Proc. Natl. Acad. Sci. USA 2012, 109, 9209–9212. [Google Scholar] [CrossRef]
- Brant, E.J.; Rietman, E.A.; Klement, G.L.; Cavaglia, M.; Tuszynski, J.A. Personalized therapy design for systemic lupus erythematosus based on the analysis of protein-protein interaction networks. PLoS ONE 2020, 15, e0226883. [Google Scholar] [CrossRef]
- Huang, S. On the intrinsic inevitability of cancer: From foetal to fatal attraction. Semin. Cancer Biol. 2011, 21, 183–199. [Google Scholar] [CrossRef] [PubMed]
- Moris, N.; Pina, C.; Arias, A.M. Transition states and cell fate decisions in epigenetic landscapes. Nat. Rev. Genet. 2016, 17, 693–703. [Google Scholar] [CrossRef] [PubMed]
- Kim, M.S.; Pinto, S.M.; Getnet, D.; Nirujogi, R.S.; Manda, S.S.; Chaerkady, R.; Madugundu, A.K.; Kelkar, D.S.; Isserlin, R.; Jain, S.; et al. A draft map of the human proteome. Nature 2014, 509, 575–581. [Google Scholar] [CrossRef] [PubMed]
- Wilhelm, M.; Schlegl, J.; Hahne, H.; Gholami, A.M.; Lieberenz, M.; Savitski, M.M.; Ziegler, E.; Butzmann, L.; Gessulat, S.; Marx, H.; et al. Mass-spectrometry-based draft of the human proteome. Nature 2014, 509, 582–587. [Google Scholar] [CrossRef] [PubMed]
- Guo, Y.; Sheng, Q.; Li, J.; Ye, F.; Samuels, D.C.; Shyr, Y. Large scale comparison of gene expression levels by microarrays and RNAseq using TCGA data. PLoS ONE 2013, 8, e71462. [Google Scholar] [CrossRef] [PubMed]
- Tomczak, K.; Czerwińska, P.; Wiznerowicz, M. The Cancer Genome Atlas (TCGA): An immeasurable source of knowledge. Contemp. Oncol. 2015, 19, A68–A77. [Google Scholar] [CrossRef] [PubMed]
- Stark, C.; Breitkreutz, B.J.; Reguly, T.; Boucher, L.; Breitkreutz, A.; Tyers, M. BioGRID: A general repository for interaction datasets. Nucleic Acids Res. 2006, 34, D535–D539. [Google Scholar] [CrossRef] [PubMed]
- Liberles, A. Introduction to Theoretical Organic Chemistry; Collier Macmillan: New York, NY, USA, 1968. [Google Scholar]
- Beard, D.A.; Qian, H. Chemical Biophysics: Quantitative Analysis of Cellular Systems. In Cambridge Texts in Biomedical Engineering; Cambridge University Press: Cambridge, UK, 2008; pp. 296–306. [Google Scholar] [CrossRef]
- Barrett, T.; Suzek, T.O.; Troup, D.B.; Wilhite, S.E.; Ngau, W.C.; Ledoux, P.; Rudnev, D.; Lash, A.E.; Fujibuchi, W.; Edgar, R. NCBI GEO: Mining millions of expression profiles–database and tools. Nucleic Acids Res. 2005, 33, D562–D566. [Google Scholar] [CrossRef]
- Friedman, D.R.; Weinberg, J.B.; Barry, W.T.; Goodman, B.K.; Volkheimer, A.D.; Bond, K.M.; Chen, Y.; Jiang, N.; Moore, J.O.; Gockerman, J.P.; et al. A genomic approach to improve prognosis and predict therapeutic response in chronic lymphocytic leukemia. Clin. Cancer Res. 2009, 15, 6947–6955. [Google Scholar] [CrossRef]
- Boulesteix, A.L.; Slawski, M. Stability and aggregation of ranked gene lists. Brief Bioinform. 2009, 10, 556–568. [Google Scholar] [CrossRef]
- Ein-Dor, L.; Kela, I.; Getz, G.; Givol, D.; Domany, E. Outcome signature genes in breast cancer: Is there a unique set? Bioinformatics 2005, 21, 171–178. [Google Scholar] [CrossRef] [PubMed]
- Wang, L.; Shalek, A.K.; Lawrence, M.; Ding, R.; Gaublomme, J.T.; Pochet, N.; Stojanov, P.; Sougnez, C.; Shukla, S.A.; Stevenson, K.E.; et al. Somatic mutation as a mechanism of Wnt/β-catenin pathway activation in CLL. Blood 2014, 124, 1089–1098. [Google Scholar] [CrossRef] [PubMed]
- Chuang, H.Y.; Rassenti, L.; Salcedo, M.; Licon, K.; Kohlmann, A.; Haferlach, T.; Foà, R.; Ideker, T.; Kipps, T.J. Subnetwork-based analysis of chronic lymphocytic leukemia identifies pathways that associate with disease progression. Blood 2012, 120, 2639–2649. [Google Scholar] [CrossRef] [PubMed]
- Rosenwald, A.; Alizadeh, A.A.; Widhopf, G.; Simon, R.; Davis, R.E.; Yu, X.; Yang, L.; Pickeral, O.K.; Rassenti, L.Z.; Powell, J.; et al. Relation of gene expression phenotype to immunoglobulin mutation genotype in B cell chronic lymphocytic leukemia. J. Exp. Med. 2001, 194, 1639–1647. [Google Scholar] [CrossRef] [PubMed]
- Klein, U.; Tu, Y.; Stolovitzky, G.A.; Mattioli, M.; Cattoretti, G.; Husson, H.; Freedman, A.; Inghirami, G.; Cro, L.; Baldini, L.; et al. Gene expression profiling of B cell chronic lymphocytic leukemia reveals a homogeneous phenotype related to memory B cells. J. Exp. Med. 2001, 194, 1625–1638. [Google Scholar] [CrossRef] [PubMed]
- Mraz, M.; Chen, L.; Rassenti, L.Z.; Ghia, E.M.; Li, H.; Jepsen, K.; Smith, E.N.; Messer, K.; Frazer, K.A.; Kipps, T.J. miR-150 influences B-cell receptor signaling in chronic lymphocytic leukemia by regulating expression of GAB1 and FOXP1. Blood 2014, 124, 84–95. [Google Scholar] [CrossRef] [PubMed]
- Sherman, B.T.; Hao, M.; Qiu, J.; Jiao, X.; Baseler, M.W.; Lane, H.C.; Imamichi, T.; Chang, W. DAVID: A web server for functional enrichment analysis and functional annotation of gene lists (2021 update). Nucleic Acids Res. 2022, 50, W216–W221. [Google Scholar] [CrossRef] [PubMed]
- Kanehisa, M.; Goto, S. KEGG: Kyoto encyclopedia of genes and genomes. Nucleic Acids Res. 2000, 28, 27–30. [Google Scholar] [CrossRef]
- Hamosh, A.; Scott, A.F.; Amberger, J.S.; Bocchini, C.A.; McKusick, V.A. Online Mendelian Inheritance in Man (OMIM), a knowledgebase of human genes and genetic disorders. Nucleic Acids Res. 2005, 33, D514–D517. [Google Scholar] [CrossRef]
- Liu, Y.; Patel, L.; Mills, G.B.; Lu, K.H.; Sood, A.K.; Ding, L.; Kucherlapati, R.; Mardis, E.R.; Levine, D.A.; Shmulevich, I.; et al. Clinical significance of CTNNB1 mutation and Wnt pathway activation in endometrioid endometrial carcinoma. J. Natl. Cancer Inst. 2014, 106, dju245. [Google Scholar] [CrossRef]
- Zhang, J.D.; Wiemann, S. “Bioconductor,” KEGGgraph: A graph approach to KEGG PATHWAY in R and Bioconductor. Bioinformatics 2009, 25, 1470–1471. [Google Scholar] [CrossRef]
- Shannon, P.; Markiel, A.; Ozier, O.; Baliga, N.S.; Wang, J.T.; Ramage, D.; Amin, N.; Schwikowski, B.; Ideker, T. Cytoscape: A software environment for integrated models of biomolecular interaction networks. Genome Res. 2003, 13, 2498–2504. [Google Scholar] [CrossRef] [PubMed]
- van Riggelen, J.; Yetil, A.; Felsher, D.W. MYC as a regulator of ribosome biogenesis and protein synthesis. Nat. Rev. Cancer. 2010, 10, 301–309. [Google Scholar] [CrossRef] [PubMed]
- Wu, C.H.; Sahoo, D.; Arvanitis, C.; Bradon, N.; Dill, D.L.; Felsher, D.W. Combined analysis of murine and human microarrays and ChIP analysis reveals genes associated with the ability of MYC to maintain tumorigenesis. PLoS Genet. 2008, 4, e1000090, Erratum in PLoS Genet. 2013, 9. [Google Scholar] [CrossRef]
- Ljungström, V.; Cortese, D.; Young, E.; Pandzic, T.; Mansouri, L.; Plevova, K.; Ntoufa, S.; Baliakas, P.; Clifford, R.; Sutton, L.A.; et al. Whole-exome sequencing in relapsing chronic lymphocytic leukemia: Clinical impact of recurrent RPS15 mutations. Blood 2016, 127, 1007–1016. [Google Scholar] [CrossRef]
- Speedy, H.E.; Beekman, R.; Chapaprieta, V.; Orlando, G.; Law, P.J.; Martín-García, D.; Gutiérrez-Abril, J.; Catovsky, D.; Beà, S.; Clot, G.; et al. Insight into genetic predisposition to chronic lymphocytic leukemia from integrative epigenomics. Nat. Commun. 2019, 10, 3615. [Google Scholar] [CrossRef]
- Beekman, R.; Chapaprieta, V.; Russiñol, N.; Vilarrasa-Blasi, R.; Verdaguer-Dot, N.; Martens, J.H.A.; Duran-Ferrer, M.; Kulis, M.; Serra, F.; Javierre, B.M.; et al. The reference epigenome and regulatory chromatin landscape of chronic lymphocytic leukemia. Nat. Med. 2018, 24, 868–880. [Google Scholar] [CrossRef] [PubMed]
- Puiggros, A.; Blanco, G.; Espinet, B. Genetic abnormalities in chronic lymphocytic leukemia: Where we are and where we go. Biomed. Res. Int. 2014, 2014, 435983. [Google Scholar] [CrossRef]
- Kiefer, Y.; Schulte, C.; Tiemann, M.; Bullerdiek, J. Chronic lymphocytic leukemia-associated chromosomal abnormalities and miRNA deregulation. Appl. Clin. Genet. 2012, 5, 21–28. [Google Scholar] [CrossRef]
- Rietman, E.A.; McDonald, J.T.; Hlatky, L. Organism mutation stability and cancer. In Hypothesis in Clinical Medicine; Shoja, M.M., Agutter, P.D., Eds.; Nova Science Publishers: Hauppauge, NY, USA, 2013; pp. 135–145. [Google Scholar]
- Dekker, J.; Belmont, A.S.; Guttman, M.; Leshyk, V.O.; Lis, J.T.; Lomvardas, S.; Mirny, L.A.; O’Shea, C.C.; Park, P.J.; Ren, B.; et al. The 4D nucleome project. Nature 2017, 549, 219–226, Erratum in Nature 2017, 552, 278. [Google Scholar] [CrossRef]
- Lee, B.H.; Wu, Z.; Rhie, S.K. Characterizing chromatin interactions of regulatory elements and nucleosome positions, using Hi-C, Micro-C, and promoter capture Micro-C. Epigenetics Chromatin 2022, 15, 41. [Google Scholar] [CrossRef] [PubMed]
- Sawh, A.N.; Mango, S.E. Chromosome organization in 4D: Insights from C. elegans development. Curr. Opin. Genet. Dev. 2022, 75, 101939. [Google Scholar] [CrossRef] [PubMed]
- Ouillette, P.; Collins, R.; Shakhan, S.; Li, J.; Li, C.; Shedden, K.; Malek, S.N. The prognostic significance of various 13q14 deletions in chronic lymphocytic leukemia. Clin. Cancer Res. 2011, 17, 6778–6790. [Google Scholar] [CrossRef] [PubMed]
- Aebersold, R.; Agar, J.N.; Amster, I.J.; Baker, M.S.; Bertozzi, C.R.; Boja, E.S.; Costello, C.E.; Cravatt, B.F.; Fenselau, C.; Garcia, B.A.; et al. How many human proteoforms are there? Nat. Chem. Biol. 2018, 14, 206–214. [Google Scholar] [CrossRef] [PubMed]
- Valencia-Serna, J.; Aliabadi, H.M.; Manfrin, A.; Mohseni, M.; Jiang, X.; Uludag, H. siRNA/lipopolymer nanoparticles to arrest growth of chronic myeloid leukemia cells in vitro and in vivo. Eur. J. Pharm. Biopharm. 2018, 130, 66–70. [Google Scholar] [CrossRef]


Disclaimer/Publisher’s Note: The statements, opinions and data contained in all publications are solely those of the individual author(s) and contributor(s) and not of MDPI and/or the editor(s). MDPI and/or the editor(s) disclaim responsibility for any injury to people or property resulting from any ideas, methods, instructions or products referred to in the content. |
© 2024 by the authors. Licensee MDPI, Basel, Switzerland. This article is an open access article distributed under the terms and conditions of the Creative Commons Attribution (CC BY) license (https://creativecommons.org/licenses/by/4.0/).
Share and Cite
Pozzati, G.; Zhou, J.; Hazan, H.; Klement, G.L.; Siegelmann, H.T.; Tuszynski, J.A.; Rietman, E.A. A Systems Biology Analysis of Chronic Lymphocytic Leukemia. Onco 2024, 4, 163-191. https://doi.org/10.3390/onco4030013
Pozzati G, Zhou J, Hazan H, Klement GL, Siegelmann HT, Tuszynski JA, Rietman EA. A Systems Biology Analysis of Chronic Lymphocytic Leukemia. Onco. 2024; 4(3):163-191. https://doi.org/10.3390/onco4030013
Chicago/Turabian StylePozzati, Giulia, Jinrui Zhou, Hananel Hazan, Giannoula Lakka Klement, Hava T. Siegelmann, Jack A. Tuszynski, and Edward A. Rietman. 2024. "A Systems Biology Analysis of Chronic Lymphocytic Leukemia" Onco 4, no. 3: 163-191. https://doi.org/10.3390/onco4030013
APA StylePozzati, G., Zhou, J., Hazan, H., Klement, G. L., Siegelmann, H. T., Tuszynski, J. A., & Rietman, E. A. (2024). A Systems Biology Analysis of Chronic Lymphocytic Leukemia. Onco, 4(3), 163-191. https://doi.org/10.3390/onco4030013