Article

Large Scale Evaluation of Normalized Hard-Braking Events Derived from Connected Vehicle Trajectory Data at Signalized Intersections, Roundabouts, and All-Way Stops

by
Vihaan Vajpayee
,
Enrique D. Saldivar-Carranza
*,
Rahul Suryakant Sakhare
and
Darcy M. Bullock
Joint Transportation Research Program, Lyles School of Civil and Construction Engineering, Purdue University, West Lafayette, IN 47907, USA
*
Author to whom correspondence should be addressed.
Future Transp. 2024, 4(3), 968-984; https://doi.org/10.3390/futuretransp4030046
Submission received: 7 August 2024 / Revised: 20 August 2024 / Accepted: 23 August 2024 / Published: 27 August 2024

Abstract

:
Intersection safety has been traditionally evaluated using three to five years of crash data. Recent literature suggests that connected vehicle (CV)-derived hard braking (HB) events can provide a surrogate for crashes with only a few weeks or months of data collection. This study used CV trajectories to derive HB events. Then, the HB events were normalized as the ratio of HB events to sampled CV trajectories. The normalized HB ratios were evaluated and compared at 435 signalized intersections, roundabouts, and all-way stops in Indiana. The analysis showed that signalized intersections and roundabouts had the highest counts of HB events, and all-way stops had the highest HB ratios. Through movements at signalized intersections showed the lowest HB ratios, whereas left turns at all-way stops had the highest ratios. A density analysis of the geospatial occurrence of HB events concluded that they tend to occur closest to the intersection center at all-way stops, but are more evenly distributed at signalized intersections. Additionally, a speed analysis indicated that HB events at signalized intersection through movements tend to occur at higher speeds, roughly between 26 and 36 MPH, perhaps due to the driver reaction during the onset of yellow. The findings presented in this study provide transportation agencies with insights on the occurrence of normalized HB ratios at three different intersection types. The data provided in this paper provide a framework for agencies to use HB ratios to screen different types of intersections for further evaluation.

1. Introduction

Transportation agencies have traditionally analyzed intersection safety using 3 to 5 years of crash data [1,2]. The infrequent nature of crash events creates the need for these long collection periods in order to derive statistically significant studies. However, this approach can lead to the delayed mitigation of challenging conditions while enough crash data are being collected.
During the past 60 years, various efforts have focused on supplementing or replacing crash counts with surrogate measures to reduce the data collection period needed for safety studies [3,4]. In general, a crash surrogate measure is defined as an event or condition related to crash risk that can be used to assess safety [3,4,5,6]. Instead of evaluating crashes, safety studies based on surrogate measures can help identify locations where traffic conditions are likely to increase the probability of a crash [3].
Some popular crash surrogate measures are traffic conflicts [7,8,9,10,11], time-to-collision (TTC) [12,13], post-encroachment time (PET) [14,15], speeding [4,16], red-light running [4,17], and deceleration-to-safety-time [4,18]. These events and conditions are usually measured manually in the field [19,20], by naturalistic driving datasets of vehicles equipped post-production with sensing technology [21,22,23], by sensing infrastructure deployed in the field [24,25,26,27], or through simulation [28,29]. However, these measuring techniques can be subjective, labor-intensive, cost-prohibitive, and difficult to scale [4]. An alternative to estimate crash surrogate measures is with commercially available connected vehicle (CV) data.

1.1. Motivation and Objective

Recently, high-resolution CV data have emerged as a useful dataset to evaluate surface transportation mobility. CV datasets contain journey information from vehicles that are factory-equipped with sampling and communication technology, and provide nationwide coverage with market penetration rates (MPRs) around 5% [30,31]. These characteristics make CV data a suitable, objective, and scalable alternative to evaluating roadway safety.
Hard-braking (HB) has previously been associated with surrogate safety measures [32,33], and CV-derived HB events have already been used to assess roadway safety. Desai et al. correlated the occurrence of CV HB events with crash occurrences on interstate construction projects [34]. Hunter et al. found a strong correlation between HB events and rear-end crashes at eight signalized intersections [35]. However, no previous study has evaluated the characteristics and spatial distribution of HB events at different types of intersections at scale.
Previous literature has demonstrated that in general, the implementation of roundabouts can improve overall crash and injury rates for all previous forms of traffic control, with the exception of all-way stops [36]. This is accomplished mainly by the reduction in conflict points and the existence of low speeds near the intersection [36]. However, roundabouts can serve less traffic than signalized intersections and are more expensive to build than all-way stops.
The objective of this paper was to evaluate and compare movement-level HB events and their normalized ratio to sampled CV trajectories at 435 signalized intersections, roundabouts, and all-way stops in Indiana. An analysis of the distribution of normalized HB events can provide practitioners insights on the different deceleration characteristics at the assessed locations. Additionally, transportation agencies can use this information to identify different types of intersections with high HB ratios for further evaluation.

1.2. Paper Structure

To achieve the outlined objectives, the manuscript is organized as follows:
  • First, a detailed description of the CV trajectory data is provided.
  • Then, the Methods section provides information on how to derive HB events and calculate the proportion of HB events to sampled CV trajectories. This value is referred to as HB ratio or normalized HB.
  • Next, the Results section provides a statistical comparison of the normalized HB events by intersection and turn type. Additionally, an HB density evaluation is presented that discusses the geospatial and speed distribution when these events occur.
  • Finally, the insights presented in the paper are summarized in the Discussion and Conclusions section.

2. CV Trajectory Data

May 2023 weekday commercial CV trajectory data during the 07:00–09:00 and 16:00–18:00 periods, with an estimated MPR of 4.8% [31], was used in this study. The dataset consists of a set of waypoints that represent the trips of vehicles that were factory-equipped with the necessary sampling and communication technology. Each waypoint usually has a three-second reporting interval with a three-meter spatial accuracy, and contains the following information: latitude, longitude, speed, heading, and an anonymous trajectory identifier.
By chronologically linking individual waypoints with the same trajectory identifier, the estimated trip of an equipped vehicle can be obtained. Therefore, a CV trajectory T is defined as the set of its waypoints W i , with i = 1, 2, …, k, where i = 1 is the first and i = k is the last sampled waypoints of the vehicle. That is:
T = W i i = 1 k
W i = { i d e n t i f i e r , l o n g i t u d e i , l a t i t u d e i , t i m e s t a m p i , s p e e d i , h e a d i n g i }
Furthermore, a CV trajectory can be assigned an intersection movement for its direction of travel (i.e., northbound, eastbound, southbound, westbound) and its turn type (i.e., right, through, and left) by evaluating its entry and exit headings when traversing the intersection [30].

3. Methods

This section delves into the studied locations, data usage, and key concepts to derive raw HB events from CV trajectory waypoint data. The importance of normalizing HBs relative to trajectory counts is further demonstrated as a means to control for sampled traffic volume.

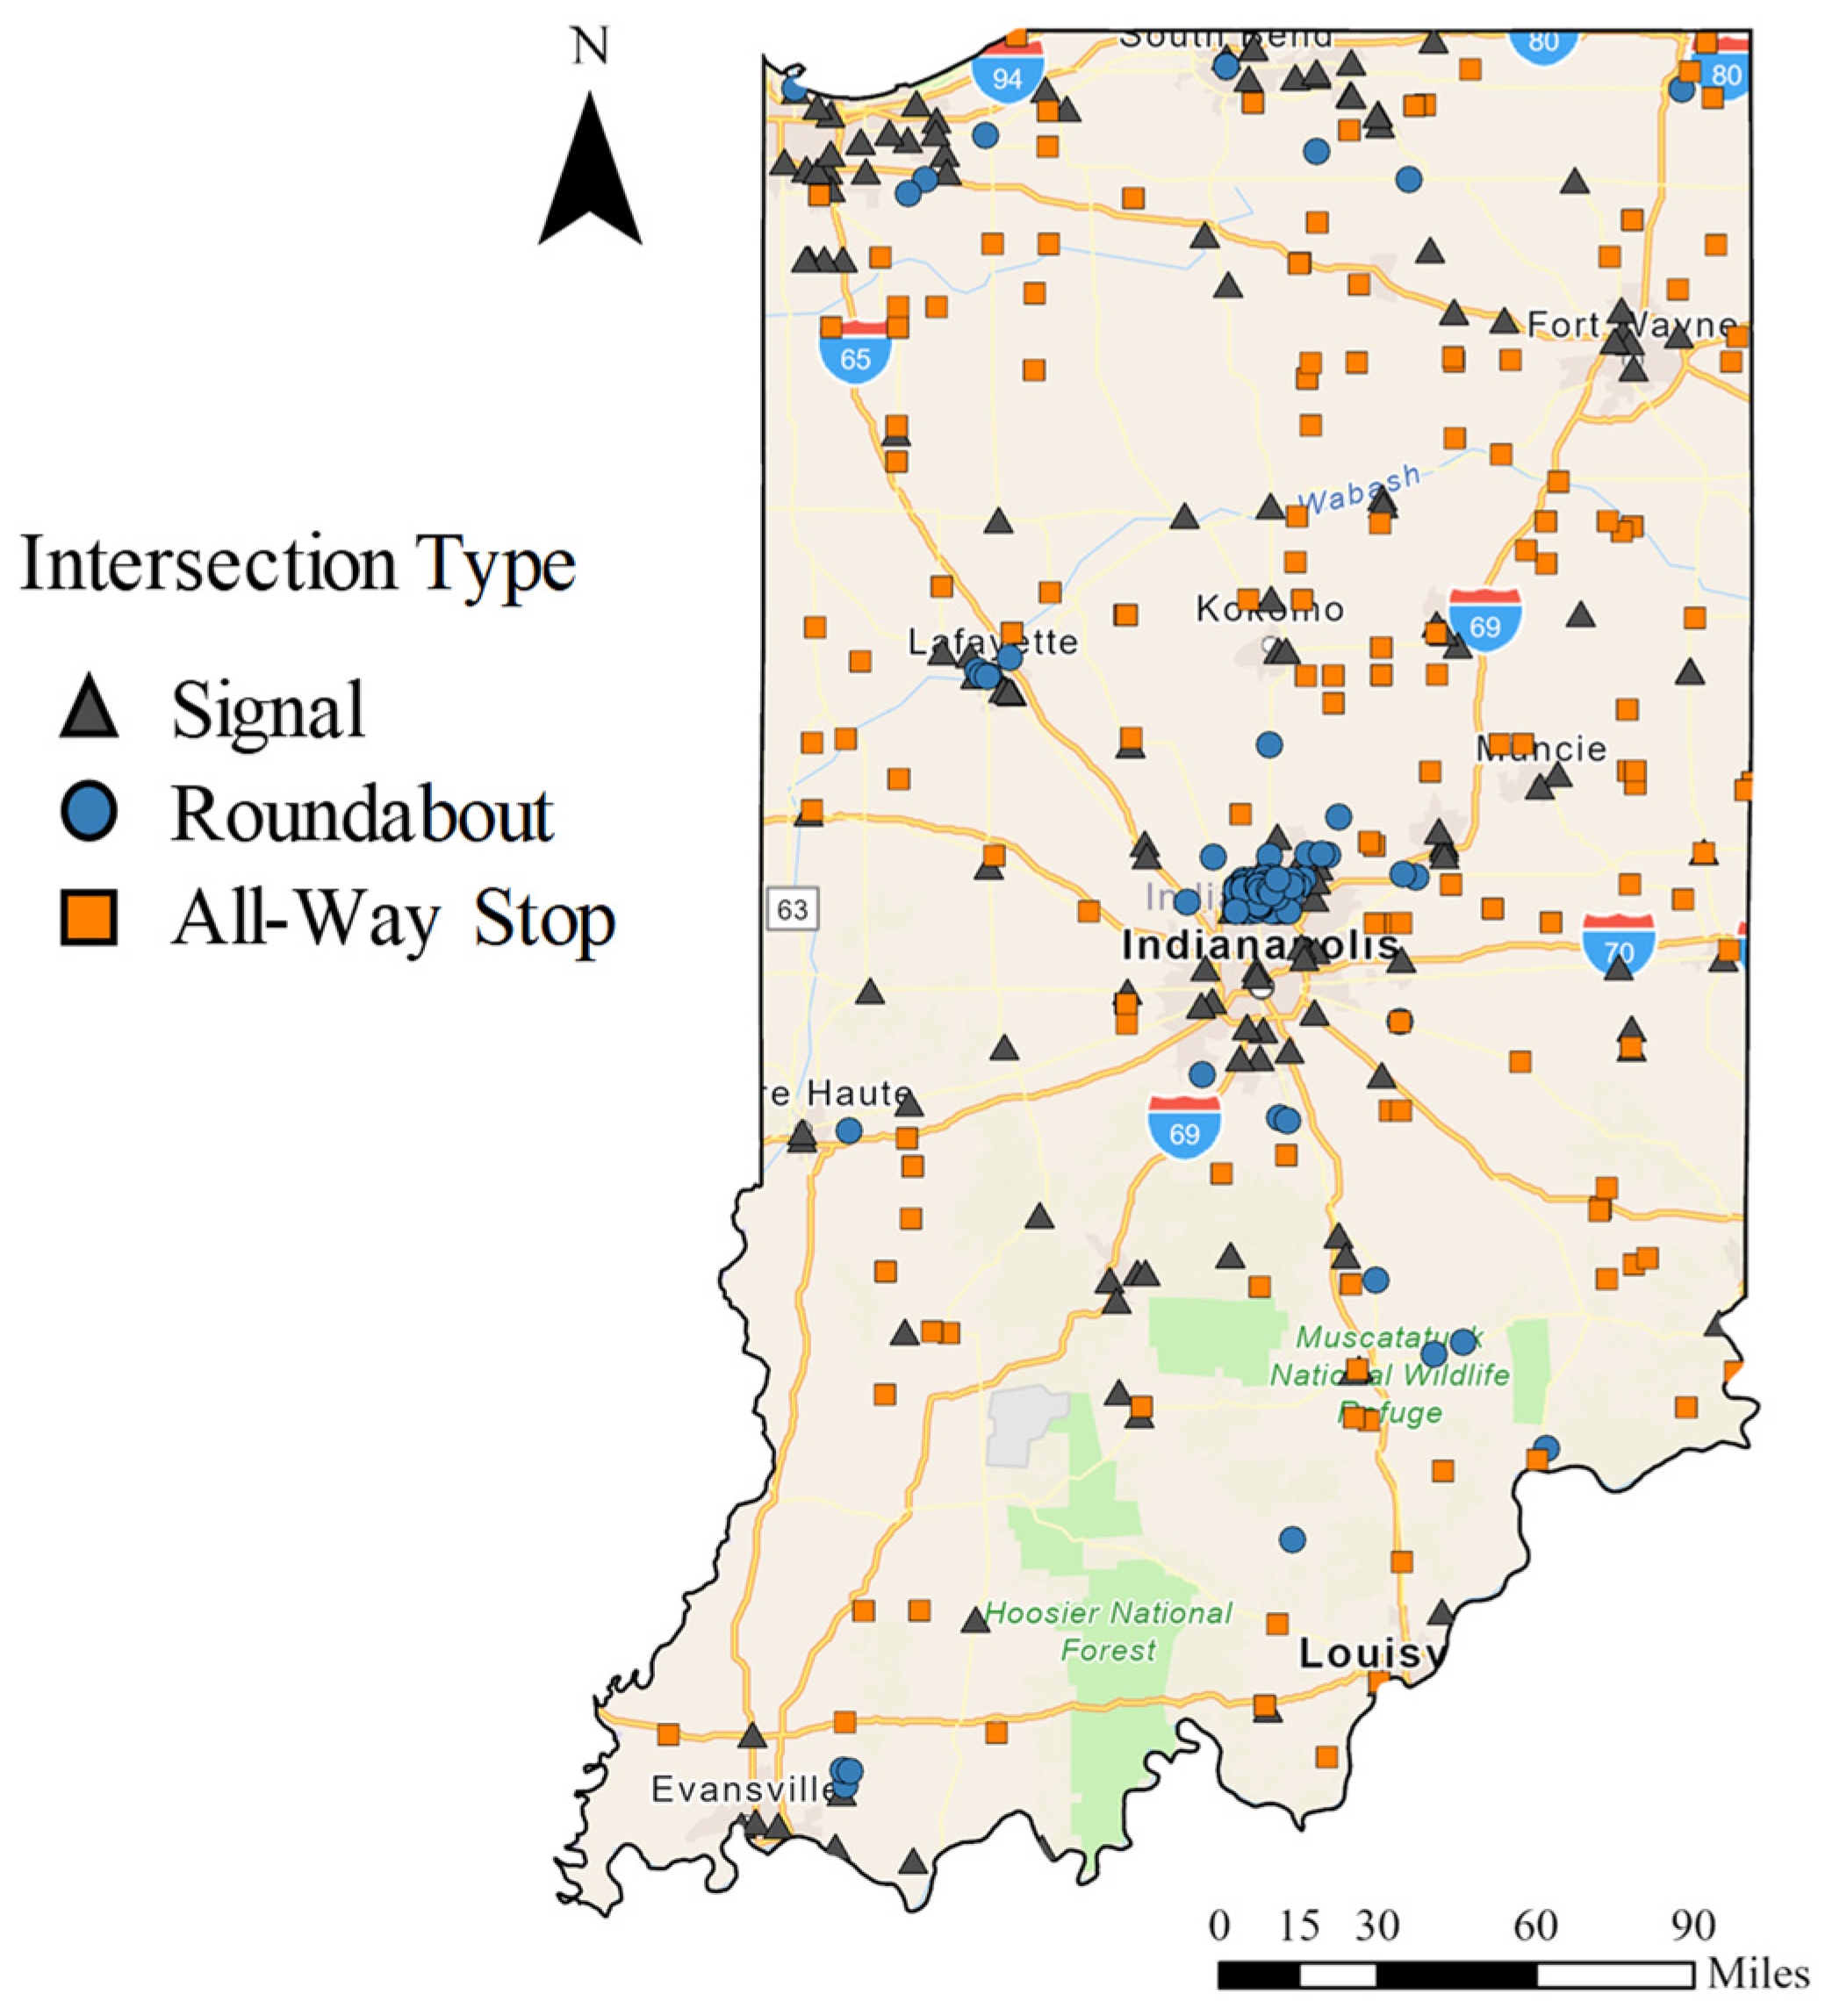
3.1. Studied Locations

This study evaluated a stratified sample of 435 randomly selected intersections in the state of Indiana, consisting of 145 signalized intersections, 145 roundabouts, and 145 all-way stops. This sample mainly contained intersections managed by the Indiana Department of Transportation (INDOT). The selected intersections operate under a wide range of conditions and serve different levels of vehicle and pedestrian demands.
A geographic representation of this sample is presented in Figure 1. All-way stops were the most geographically diverse with a mix of urban and rural locations across the entire state. Signalized intersections and roundabouts were more concentrated near urban regions. In particular, roundabouts were highly concentrated in and around Carmel.

3.2. HB Event Extraction

This study used CV trajectory data to derive HB events. Each trajectory waypoint, as defined in Equations (1) and (2), represents a potential HB location marker depending on its experienced change in speed and time. Using this information, this subsection aims to:
  • Accurately identify HB events derived from CV trajectory data.
  • Normalize HB counts by CV trajectories to control by sampled volume.
The proposed approach extends the use of commercial CV trajectory data, which is typically employed for performance analyses [30], to also be used for safety studies. Additionally, as discussed below, deriving HB events from CV trajectories enables the normalization of HB metrics by sampled volumes and provides information on the severity of each vehicle’s deceleration.

3.2.1. Deriving HBs from CV Data

HB is defined as the event where a waypoint experienced a deceleration greater than 0.27 g, or roughly at least an 18 MPH speed reduction during a three-second period. To identify a HB event, vehicle acceleration needs to be derived from sampled speed and time differentials. The speed differential at waypoint i of trajectory T ( s i ) is defined as the sampled waypoint speed at i ( s i ) subtracted by the speed of the previous waypoint i−1 ( s i 1 ) within trajectory T. That is:
s i = s i s i 1
Similarly, the time differential at waypoint i of trajectory T ( t i ) is defined as the sampled waypoint time at i ( t i ) subtracted by the time of the previous waypoint i−1 ( t i 1 ) within trajectory T. That is:
t i = t i t i 1
The acceleration experienced by waypoint i ( α i ) is then estimated from Equations (3) and (4) as:
α i = s i t i
If the magnitude of a negative α i exceeds the 0.27 g threshold, then waypoint i is labeled as the location of a HB event. If several consecutive waypoints in the same trajectory T meet the deceleration threshold, then only the first waypoint in the sequence is labeled as an HB event.
After HBs were derived from trajectory waypoints, their geospatial locations were evaluated to keep only events that likely occurred as a consequence of a vehicle traversing the assessed intersection. Only the estimated HB events that complied with at least one of following were considered for further analysis:
  • Those that occurred within 150 ft of the intersection center;
  • Those that occurred within 500 ft of the intersection center that were also deemed to have happened on an upstream segment.
An HB event identified at waypoint i ( W i ) is categorized as having occurred upstream if the angular difference between its h e a d i n g i and the bearing of a vector going from W i to the intersection center is less than 90°. Figure 2 displays raw CV trajectory waypoints (blue) sampled over one day and their derived HB events (red) kept for further analysis at three different intersection types. It is shown how HB events occur either near the intersection centers or on the lanes where traffic actively approaches the intersection.
Derived HB events are assigned the same intersection movement that their source vehicle trajectory followed [30]. Therefore, if a sampled trajectory that traveled eastbound-left at an intersection is estimated to have hard-braked, that HB event is labeled as an eastbound-left HB. Figure 3 shows the count of derived HB events ( n H B ) plotted against the count of sampled trajectories ( n T ) by intersection turn type during the analysis period.
The occurrence of HBs is correlated with the sampled volume of vehicle trajectories. For through movements, this association is weaker than for right and left turns. However, right and left turns also tend to have smaller n H B and n T . Overall, signalized intersections have highest n H B and n T , followed by roundabouts, and all-way stops have the smallest values.
A plotted linear regression line separates the intersections into two groups, where the markers located above the best-fit line may require more attention than those located under. For example, callouts i, ii, and iii point to some all-way stop, roundabout, and signal outliers that can be further analyzed to assess if mitigation measures are needed. In contrast, callouts iv, v, and vi point to intersections where HB concerns do not arise. Given these relationships, it is reasonable that any HB metric needs to be normalized by sampled volume.

3.2.2. Normalizing HBs

To normalize HBs (referred to as H B n o r m or HB ratio) at the movement, turn, or intersection level, the ratio of the derived n H B and n T during the analysis period is calculated:
H B n o r m = n H B n T
Figure 4 shows Pareto-sorted bar graphs depicting the analyzed intersections ranked by their derived n H B (Figure 4a) and H B n o r m (Figure 4b). In Figure 4a, most high-ranking locations are signalized intersections and roundabouts (gray and blue). In contrast, when controlling for sampled volume (Figure 4b), most high-ranking intersections are all-way stops (orange).
Callouts i, ii, and iii in Figure 4 point to an example signalized intersection, roundabout, and all-way stop, respectively, and demonstrate how their relative rankings can change depending on whether the criterion is based on n H B (Figure 4a) or H B n o r m (Figure 4b). A raster analysis of these intersections is presented in Figure 5, which illustrates key differences in location and concentration of HBs. At signalized intersections (Figure 5a) and roundabouts (Figure 5b), HBs generally occur evenly along the analyzed 500 ft of roadway upstream of the intersection center. For roundabouts, HBs are slightly concentrated towards the entry of the circulatory roadway. On the other hand, all-way stops (Figure 5c) have the most HB activity close to the stop line.
The Results section provides a statistical analysis of H B n o r m by intersection and turn type. Furthermore, the geospatial and speed density distribution of HB events are discussed.

4. Results

This section first presents the results of a statistical analysis of normalized HBs at the turn level for signalized intersections, roundabouts, and all-way stops. Afterwards, a density analysis is performed for the distance along the intersection and for speeds at HB. Finally, the interaction of distance and speed in relation to the occurrence of HBs is assessed.

4.1. Statistical Comparison of Normalized HB Ratios by Intersection and Turn Type

Figure 6 presents the distribution of HB ratios, or H B n o r m , for different combinations of intersection and turn types throughout the study period. To control for outliers, intersection samples with fewer than 30 trajectories were removed from the analysis.
At the through movement (Figure 6b), normalized HBs for signalized intersections are lowest with an average HB ratio of 0.023 and no HB ratio higher than 0.1. Roundabouts have the second-lowest average HB ratio of 0.031 and all-way stops have the highest average HB ratio of 0.057.
Figure 6 also reveals that all-way stops have much higher within-group variability in normalized HBs than signalized intersections and roundabouts. This is likely due to the all-way stops being more uniformly distributed in the state (Figure 1) and usually handling fewer vehicles than the other intersection types, which makes HB ratio calculations more sensitive to different demands. Additionally, the difference in averages between the HB ratio of all-way stops and either of the other intersection types in a through movement is statistically significant, as demonstrated by the Tukey pairwise comparison [37] presented in Table 1. Both comparisons result in p-values lower than 0.05.
For left (Figure 6a) and right (Figure 6c) turns, the differences in average HB ratios for the analyzed intersection types are less pronounced. All-way stops and roundabouts display similar HB ratio distributions across all turn types. This is reasonable, as vehicles must perform similar maneuvers at these intersections independently of the following turn. At a roundabout, entering the circulatory roadway requires vehicles to slow down, and at all-way stops, everyone must stop before proceeding. Similarly, right- and left-turning vehicles at signalized intersections need to slow down or stop before crossing the intersection. On the other hand, vehicles going through may or may not have to modulate their speeds based on the signal head indication, which results in signalized intersections having different HB ratio distributions across turn types.
According to the Tukey pairwise comparison [37] (Table 1), the differences in average HB ratios are insignificant for turning movements with the exception of roundabout and all-way stop right turns. The pairwise comparisons that are statistically significant are also shown in cells with light shading in Table 1. This table provides practitioners with a preliminary evaluation of which turn types at the different intersections have similar or different HB ratio averages, which may be useful when prioritizing large-scale safety improvements or design decisions.

4.2. Spatial and Speed Density Analysis

This subsection evaluates the distance to the intersection center and the speed when HBs occur at the different intersection types. Density analyses of these attributes can help practitioners identify relevant trends.

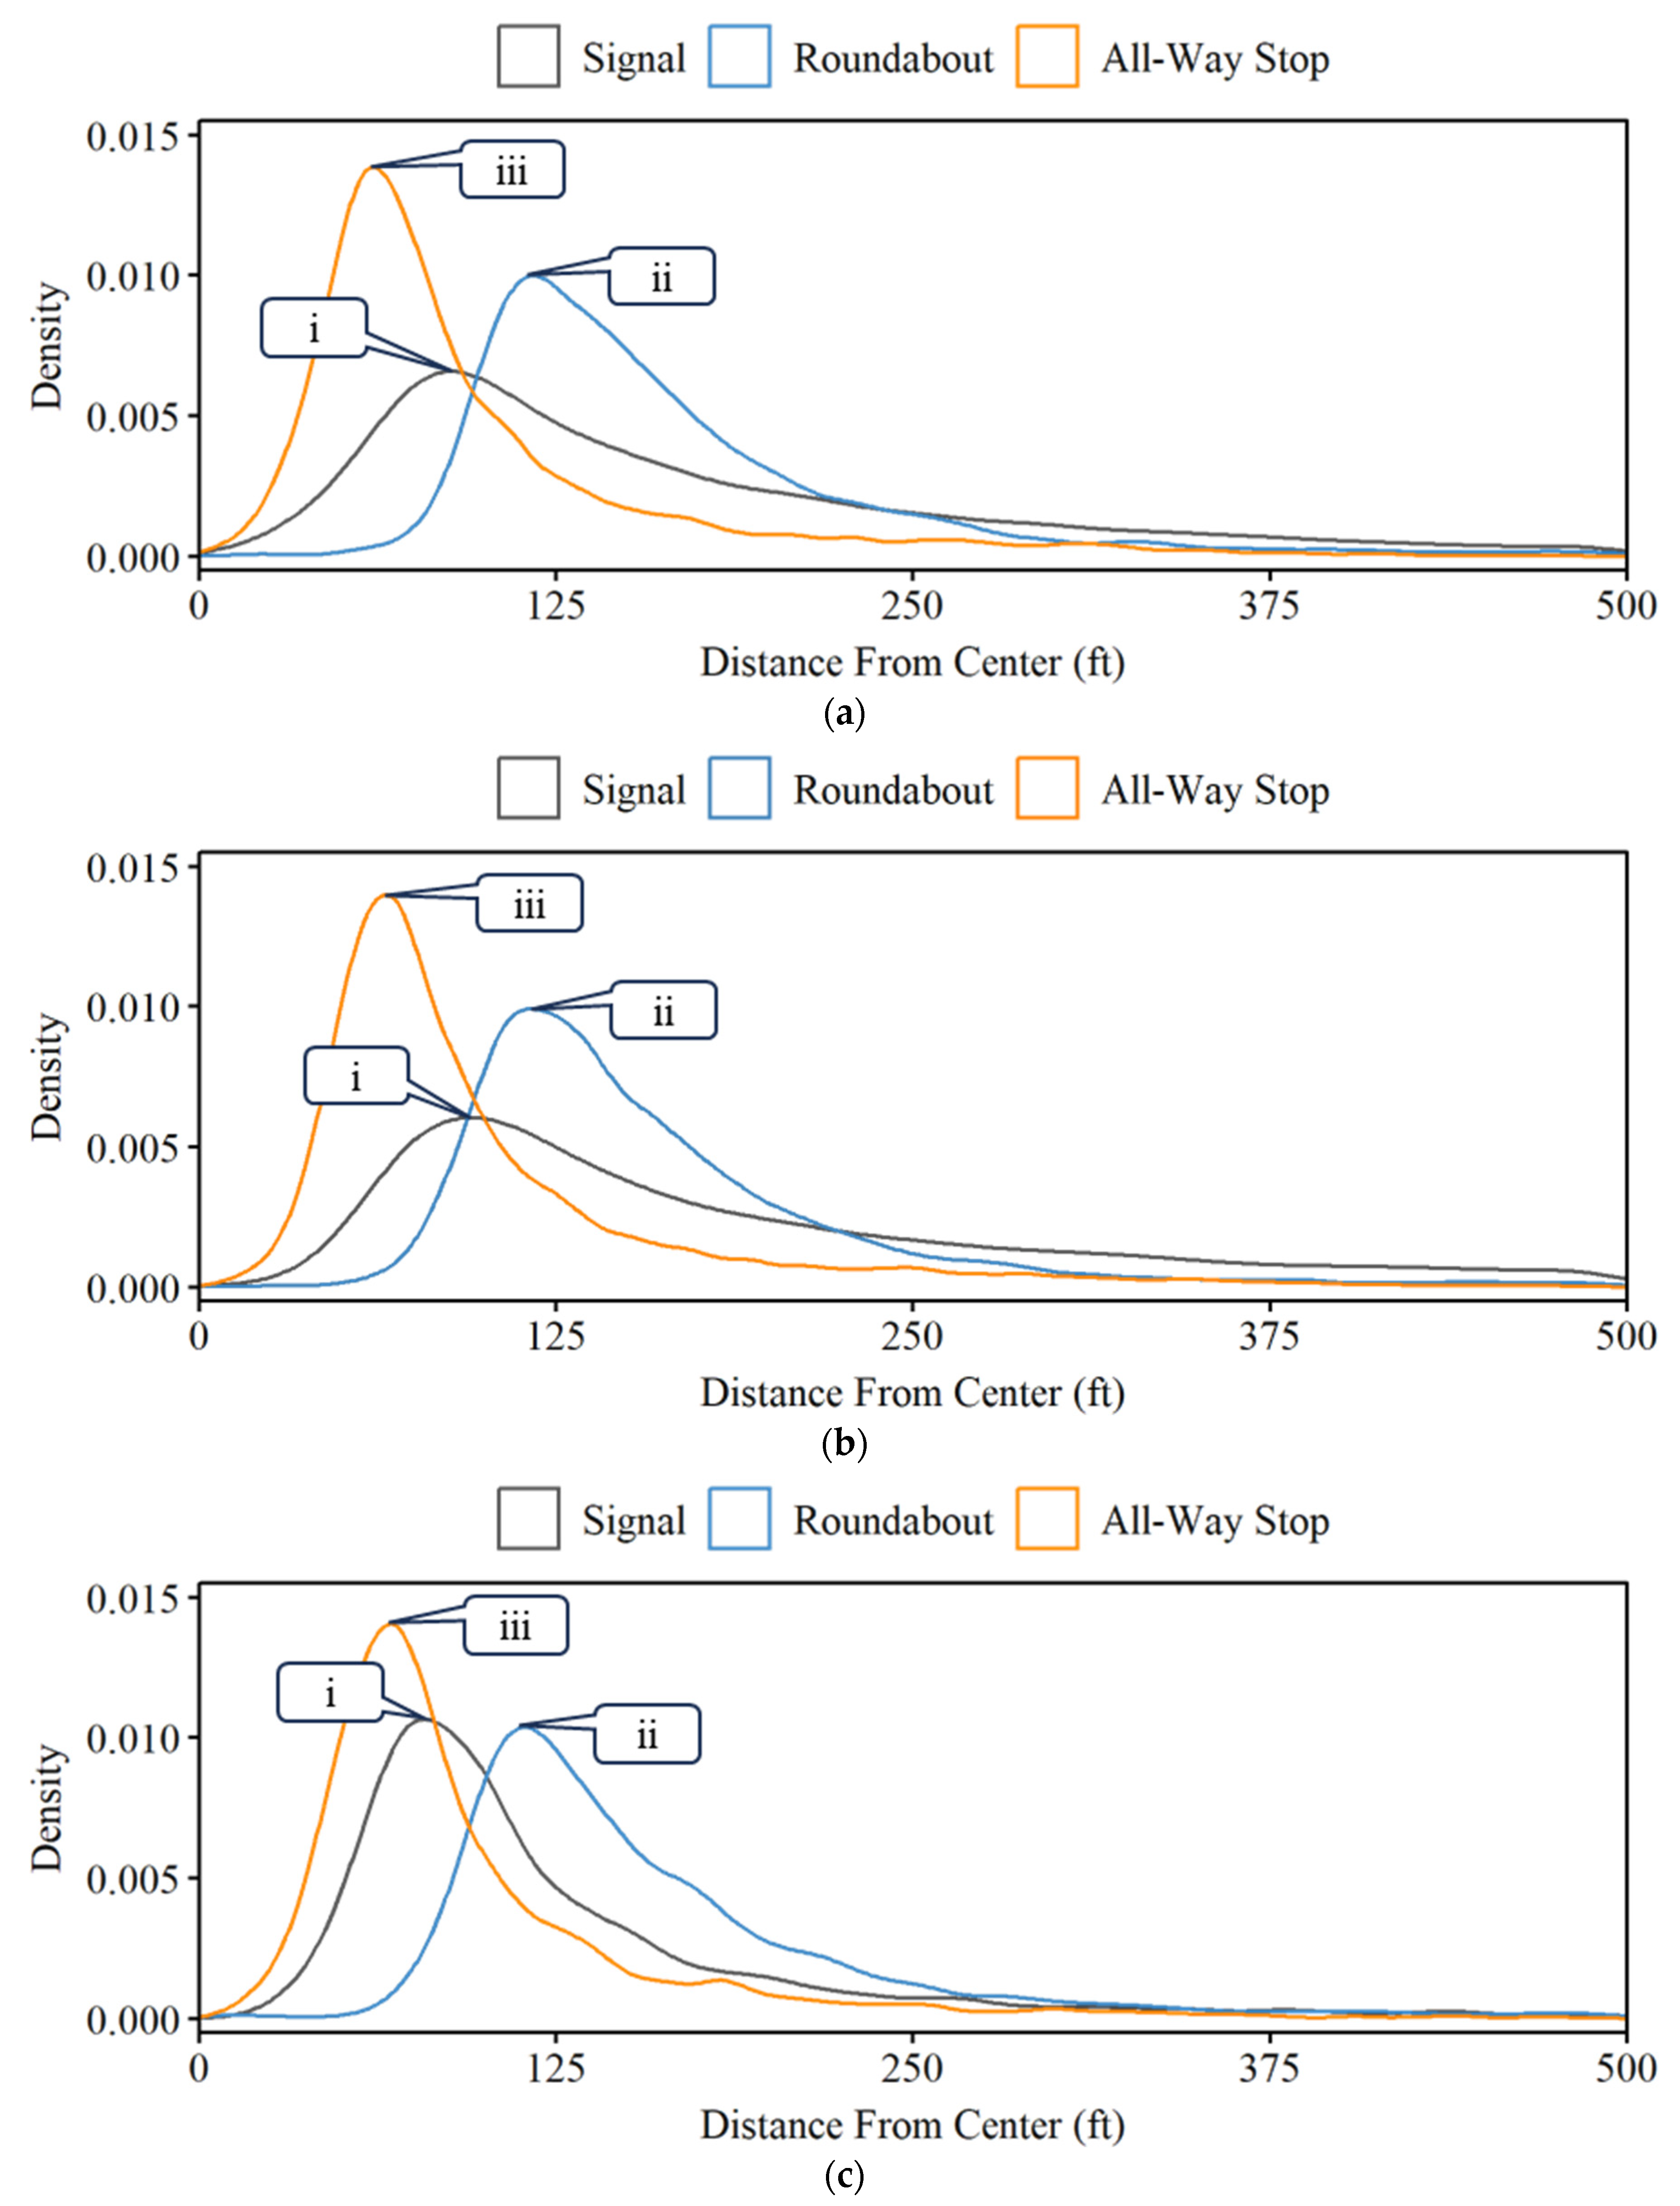
4.2.1. Distance to the Intersection Center

A density distribution of the distance from HB events to the center of the intersection by turn and intersection type is shown in Figure 7. From this plot, key differences in HBs can be observed. Most noticeably, the peak location of HBs at all-way stops is located closest to the intersection center (callout iii), and the peak location of HBs at roundabouts is located farthest from the intersection center (callout ii). This is not surprising, as all-way stops tend to be on less busy routes and are smaller than roundabouts, which can occupy larger areas.
Signalized intersections have the most variability in HB distance (callout i). Although HBs at signalized intersections tend to have a peak distribution closer to the center than at roundabouts, they also tend to be the most evenly distributed throughout the entire roadway. This is likely due to major signalized arterials having longer queues than other intersection types. However, this behavior does not hold true for signalized intersection HBs on right movements, likely due to right-on-red laws that result in reduced queues for vehicles following this movement.

4.2.2. Traveling Speed

Evaluating the speed at HBs ( s i 1 in Equation (3)) is important to understand driver behavior. HBs can be a result of speeding and performing subsequent corrections when encountering an intersection. However, this is not always the case. HBs can occur at almost every traveling speed as long as they meet the deceleration threshold of 0.27 g.
A density distribution of these HB speeds by intersection and turn type is visualized in Figure 8. All distributions for every intersection type are unimodal and symmetric with a mean speed of 30.4 MPH. A 10 MPH pace, as recorded in Figure 9, where median values are displayed as black dots, shows that most HB speeds occur at a 22–32 MPH pace. For through movements at signalized intersections, there is a flatter distribution centered around a much higher speed value. On average, the 10 MPH pace for these HBs is 4 MPH higher than for any other 10 MPH pace. The occurrence of HBs labeled by callout i in Figure 8 could represent HB events that are a direct consequence of a dilemma zone induced by the unexpected onset of yellow. When this happens, drivers going faster must decide whether to stop abruptly or attempt to cross before the light turns red. Drivers that stop abruptly may have to do so by hard braking at higher speeds.

4.2.3. Interactions between Distance and Speed

Figure 10 presents a contour plot of the HB densities based on speed and distance from intersection center at every intersection type and movement combination. Callout i points to the speed–distance density for HBs occurring on signalized through movements. There is an uptick in density for HBs at further distances if they also have higher speeds and vice versa. These HBs also tend to be more sparsely distributed over a variety of speeds and distances, not being particularly concentrated towards specific combinations of speeds and distances.
This is in direct contrast to all-way stops, which have similar HB characteristics of speed and distance for every movement type. Similarly to signalized intersections through movements, densities of speed and distance move together, with most HBs at high speeds also occurring at longer distances from the center. Roundabouts are the only intersection type where there is no clear density-based connection between higher speeds and longer distances. Although they are less concentrated in speed and distance than HBs at all-way stops, HBs at roundabouts are more concentrated than those at signalized intersections.

5. Discussion and Conclusions

This study evaluated the occurrence of hard-braking events derived from CV trajectory data at 435 signalized intersections, roundabouts, and all-way stops in Indiana. Statistical, geospatial, and speed assessments of raw and normalized HB ratios showed that:
  • The plot in Figure 3b illustrates how the components of HB ratios (Equation (6)) can be plotted to identify outliers. For example, callouts i, ii, and iii correspond to some extreme outliers for through movements at all-way stops, roundabouts, and signals that can be further studied to determine if there are underlying geometric or traffic conditions that might warrant some type of mitigation measure.
  • Signalized intersections and roundabouts had the highest counts of HB events (Figure 4a); however, all-way stops presented the highest normalized HB measurements (Figure 4b) when controlling for the sampled volume of CV trajectories.
  • HBs occurred closest to the intersection center at all-way stops and were more evenly distributed at signalized intersections (Figure 7).
  • HBs tend to occur at higher speeds at signalized intersection through movements, roughly between 26 and 36 MPH, than for any other alternative. This is likely caused by vehicles being found in the dilemma zone during an unexpected onset of yellow or by the existence of long queues (Figure 8 and Figure 9). Future studies should investigate the conditions under which high-speed HB events occur.
Overall, most HBs for all intersection types occurred near the stop lines at medium speeds. A contour density analysis (Figure 10) revealed that HB events at signalized intersection through movements that occur at higher speeds also tend to be more concentrated at longer distances from the intersection center. Moreover, Figure 10 also shows that all-way stop HBs tend to show the most predictable patterns, being at consistent speeds and distances from the center. A possible explanation for these results could be because of the geometric and operational homogeneity of all-way stops, which tend to also be in less congested locations. Signalized locations, on the other hand, tend to be more heterogeneous, existing on busy arterials and local roads of varying levels of activity. As such, an implementable solution to reduce HB events at all-way stops can be more generalizable due to its predictable nature.
The presented technique to estimate HB events extends the uses of commercial CV trajectory data, provides a path for the normalization of HB metrics, and makes available the severity of each vehicle’s deceleration for further evaluation. Future studies can investigate the precise causes of HBs and the distribution of their severity in relation to location and speed.
The main limitation of the current study is that it calculated deceleration values from waypoint data with a three-second reporting interval. Even though a three-second reporting frequency usually allows for an accurate estimation of motorists’ experience as they traverse transportation networks, it may be difficult to accurately assess HB distributions and severity when vehicles travel fast. For example, a vehicle traveling at 40 MPH can almost cover a 180 ft distance over a three-second period. This makes it challenging to accurately identify the exact location and magnitude of the deceleration peak. However, the potential impact that this limitation may have on safety studies will likely be mitigated as commercial CV data evolve and reduce reporting intervals.
The extensive coverage of CV data can allow for the scaling of this study to any time period and location. The presented results can be beneficial to transportation agencies seeking to evaluate the occurrence of HB events at different types of intersections and identify locations where further analyses are warranted.

Author Contributions

Conceptualization, V.V., E.D.S.-C., R.S.S. and D.M.B.; methodology, V.V. and E.D.S.-C.; software, V.V. and E.D.S.-C.; validation, V.V. and E.D.S.-C.; formal analysis, V.V. and E.D.S.-C.; investigation, V.V. and E.D.S.-C.; resources, V.V., E.D.S.-C., R.S.S. and D.M.B.; data curation, V.V. and E.D.S.-C.; writing—original draft preparation, V.V. and E.D.S.-C.; writing—review and editing, R.S.S. and D.M.B.; visualization, V.V. and E.D.S.-C.; supervision, D.M.B.; project administration, D.M.B.; funding acquisition, D.M.B. All authors have read and agreed to the published version of the manuscript.

Funding

This work was supported in part by the Joint Transportation Research Program and Pooled Fund Study (TPF-5(519)) led by the Indiana Department of Transportation (INDOT) and supported by the state transportation agencies of California, Connecticut, Georgia, Minnesota, Mississippi, North Carolina, Ohio, Pennsylvania, Texas, Utah, and Wisconsin, and the Federal Highway Administration (FHWA) Operations Technical Services Team. The contents of this paper reflect the views of the authors, who are responsible for the facts and the accuracy of the data presented herein, and do not necessarily reflect the official views or policies of the sponsoring organizations. These contents do not constitute a standard, specification, or regulation.

Institutional Review Board Statement

Not applicable.

Informed Consent Statement

Not applicable.

Data Availability Statement

The original contributions presented in the study are included in the article, further inquiries can be directed to the corresponding author.

Acknowledgments

May 2023 weekday CV trajectory data used in this study were provided by Wejo Data Services, Inc.

Conflicts of Interest

The authors declare no conflicts of interest.

References

  1. Indiana Design Manual, Chapter 5: Engineering Assessment. 2012. Available online: https://www.in.gov/indot/design-manual/archived-design-manuals/indiana-design-manual-2012-archive/# (accessed on 7 July 2024).
  2. Federal Highway Administration. Road Safety Information Analysis: A Manual for Local Rural Road Owners. 2011. Available online: https://safety.fhwa.dot.gov/local_rural/training/fhwasa1210/lrro_data.pdf (accessed on 1 March 2023).
  3. Tarko, A.P. Surrogate Measures of Safety. In Safety Mobility: Challenges, Methodology and Solutions, 1st ed.; Lord, D., Washington, S., Eds.; Emerald Publishing Limited: Bingley, UK, 2018; Chapter 17; Volume 11, pp. 383–405. [Google Scholar]
  4. Arun, A.; Haque, M.M.; Bhaskar, A.; Washington, S.; Sayed, T. A systematic mapping review of surrogate safety assessment using traffic conflict techniques. Accid. Anal. Prev. 2021, 153, 106016. [Google Scholar] [CrossRef]
  5. Tarko, A.; Davis, G.; Saunier, N.; Sayed, T.; Washington, S. Surrogate Measures of Safety; White Paper; Transportation Research Board: Washington, DC, USA, 2009. [Google Scholar]
  6. Wu, K.-F.; Jovanis, P.P. Crashes and crash-surrogate events: Exploratory modeling with naturalistic driving data. Accid. Anal. Prev. 2012, 45, 507–516. [Google Scholar] [CrossRef] [PubMed]
  7. Davis, G.A.; Hourdos, J.; Xiong, H.; Chatterjee, I. Outline for a causal model of traffic conflicts and crashes. Accid. Anal. Prev. 2011, 43, 1907–1919. [Google Scholar] [CrossRef]
  8. Tarko, A.P. Use of crash surrogates and exceedance statistics to estimate road safety. Accid. Anal. Prev. 2012, 45, 230–240. [Google Scholar] [CrossRef] [PubMed]
  9. Jonasson, J.K.; Rootzén, H. Internal validation of near-crashes in naturalistic driving studies: A continuous and multivariate approach. Accid. Anal. Prev. 2014, 62, 102–109. [Google Scholar] [CrossRef] [PubMed]
  10. Tarko, A.P. Estimating the expected number of crashes with traffic conflicts and the Lomax Distribution—A theoretical and numerical exploration. Accid. Anal. Prev. 2018, 113, 63–73. [Google Scholar] [CrossRef]
  11. Zheng, L.; Ismail, K.; Sayed, T.; Fatema, T. Bivariate extreme value modeling for road safety estimation. Accid. Anal. Prev. 2018, 120, 83–91. [Google Scholar] [CrossRef]
  12. Hayward, J.C. Near-miss determination through use of a scale of danger. Highw. Res. Rec. 1972, 384, 24–34. [Google Scholar]
  13. Nadimi, N.; Ragland, D.R.; Amiri, A.M. An evaluation of time-to-collision as a surrogate safety measure and a proposal of a new method for its application in safety analysis. Transp. Lett. 2020, 12, 491–500. [Google Scholar] [CrossRef]
  14. Peesapati, L.N.; Hunter, M.P.; Rodgers, M.O. Evaluation of Postencroachment Time as Surrogate for Opposing Left-Turn Crashes. Transp. Res. Rec. J. Transp. Res. Board 2013, 2386, 42–51. [Google Scholar] [CrossRef]
  15. Allen, B.L.; Shin, B.T.; Cooper, P.J. Analysis of Traffic Conflicts and Collisions; Transportation Research Board: Washington, DC, USA, 1978. [Google Scholar]
  16. Moreno, A.T.; García, A. Use of speed profile as surrogate measure: Effect of traffic calming devices on crosstown road safety performance. Accid. Anal. Prev. 2013, 61, 23–32. [Google Scholar] [CrossRef] [PubMed]
  17. Xiang, W.; Yan, X.; Weng, J.; Li, X. Effect of auditory in-vehicle warning information on drivers’ brake response time to red-light running vehicles during collision avoidance. Transp. Res. Part F Traffic Psychol. Behav. 2016, 40, 56–67. [Google Scholar] [CrossRef]
  18. Hydén, C. Traffic conflicts technique: State-of-the-art. Traffic Saf. Work. Video Process. 1996, 37, 3–14. [Google Scholar]
  19. Amundsen, F.H.; Hyden, C. Proceedings of first workshop on traffic conflicts. In First Workshop on Traffic Conflicts; Amundsen, F.H., Hyden, C., Eds.; Royal Norwegian Council for Scientific and Industrial Research: Oslo, Norway, 1977. [Google Scholar]
  20. Kraay, J.H.; Van Der Horst, A.R.A.; Oppe, S. Manual Conflict Observation Technique DOCTOR: Dutch Objective Conflict Technique for Operation and Research; Foundation Road Safety for All: Voorburg, The Netherlands, 2013. [Google Scholar]
  21. Dingus, T.A.; Klauer, S.G.; Neale, V.L.; Petersen, A.; Lee, S.E.; Sudweeks, J.; Perez, M.A.; Hankey, J.; Ramsey, D.; Gupta, S.; et al. The 100-Car Naturalistic Driving Study, Phase II—Results of the 100-Car Field Experiment; National Highway Traffic Safety Administration: Washington, DC, USA, 2006. [Google Scholar]
  22. Antin, J.F.; Lee, S.; Perez, M.A.; Dingus, T.A.; Hankey, J.M.; Brach, A. Second strategic highway research program naturalistic driving study methods. Saf. Sci. 2019, 119, 2–10. [Google Scholar] [CrossRef]
  23. Glaser, Y.G.; Guo, F.; Fang, Y.; Deng, B.; Hankey, J. Investigate moped-car conflicts in China using a naturalistic driving study approach. J. Saf. Res. 2017, 63, 171–175. [Google Scholar] [CrossRef] [PubMed]
  24. Dimitriou, L.; Stylianou, K.; Abdel-Aty, M.A. Assessing rear-end crash potential in urban locations based on vehicle-by-vehicle interactions, geometric characteristics and operational conditions. Accid. Anal. Prev. 2018, 118, 221–235. [Google Scholar] [CrossRef] [PubMed]
  25. Gecchele, G.; Orsini, F.; Gastaldi, M.; Rossi, R. Freeway rear-end collision risk estimation with extreme value theory approach. A case study. Transp. Res. Procedia 2019, 37, 195–202. [Google Scholar] [CrossRef]
  26. Jo, Y.; Oh, C.; Kim, S. Estimation of heavy vehicle-involved rear-end crash potential using WIM data. Accid. Anal. Prev. 2019, 128, 103–113. [Google Scholar] [CrossRef]
  27. Wu, J.; Xu, H.; Zheng, Y.; Tian, Z. A novel method of vehicle-pedestrian near-crash identification with roadside LiDAR data. Accid. Anal. Prev. 2018, 121, 238–249. [Google Scholar] [CrossRef]
  28. Young, W.; Sobhani, A.; Lenné, M.G.; Sarvi, M. Simulation of safety: A review of the state of the art in road safety simulation modelling. Accid. Anal. Prev. 2014, 66, 89–103. [Google Scholar] [CrossRef]
  29. Mahmud, S.M.S.; Ferreira, L.; Hoque, M.S.; Tavassoli, A. Micro-simulation modelling for traffic safety: A review and potential application to heterogeneous traffic environment. IATSS Res. 2019, 43, 27–36. [Google Scholar] [CrossRef]
  30. Saldivar-Carranza, E.D.; Li, H.; Mathew, J.K.; Desai, J.; Platte, T.; Gayen, S.; Sturdevant, J.; Taylor, M.; Fisher, C.; Bullock, D.M. Next Generation Traffic Signal Performance Measures: Leveraging Connected Vehicle Data; Purdue University: West Lafayette, IN, USA, 2023. [Google Scholar] [CrossRef]
  31. Sakhare, R.S.; Hunter, M.; Mukai, J.; Li, H.; Bullock, D.M. Truck and Passenger Car Connected Vehicle Penetration on Indiana Roadways. J. Transp. Technol. 2022, 12, 578–599. [Google Scholar] [CrossRef]
  32. Guido, G.; Saccomanno, F.; Vitale, A.; Astarita, V.; Festa, D. Comparing Safety Performance Measures Obtained from Video Capture Data. J. Transp. Eng. 2011, 137, 481–491. [Google Scholar] [CrossRef]
  33. Mousavi, S.M. Identifying High Crash Risk Roadways through Jerk-Cluster Analysis. Master’s Thesis, Louisiana State University and Agricultural and Mechanical College, Baton Rouge, LA, USA, 2015. [Google Scholar] [CrossRef]
  34. Desai, J.; Li, H.; Mathew, J.K.; Cheng, Y.-T.; Habib, A.; Bullock, D.M. Correlating Hard-Braking Activity with Crash Occurrences on Interstate Construction Projects in Indiana. J. Big Data Anal. Transp. 2021, 3, 27–41. [Google Scholar] [CrossRef]
  35. Hunter, M.; Saldivar-Carranza, E.; Desai, J.; Mathew, J.; Li, H.; Bullock, D.M. A Proactive Approach to Evaluating Intersection Safety Using Hard-braking Data. J. Big Data Anal. Transp. 2021, 3, 81–94. [Google Scholar] [CrossRef]
  36. National Academies of Sciences, Engineering, and Medicine. Roundabouts in the United States; The National Academies Press: Washington, DC, USA, 2007. [Google Scholar] [CrossRef]
  37. Tukey, J.W. Comparing Individual Means in the Analysis of Variance. Biometrics 1949, 5, 99. [Google Scholar] [CrossRef]
Figure 1. Studied locations in Indiana. (map data: Esri, TomTom, Garmin, FAO, NOAA, USGS, EPA, NPS, USFWS).
Futuretransp 04 00046 g001
Figure 2. CV waypoints and HB events at the different intersection types analyzed. (a) Signalized intersection, (b) roundabout, (c) all-way stop. (map data: Esri).
Futuretransp 04 00046 g002
Figure 3. Scatterplots of n H B by n T for each turn type. (a) Left turn, (b) through, (c) right turn.
Futuretransp 04 00046 g003
Figure 4. Pareto sorting of analyzed intersections by different ranking approaches. (a) Ranked by n H B , (b) ranked by H B n o r m .
Futuretransp 04 00046 g004
Figure 5. HB counts at the different intersection types analyzed with their HB ratios by movement. (a) Signalized intersection (Figure 4, callout i); HB count: 345, HB ratio: 0.04, (b) roundabout (Figure 4, callout ii); HB count: 719, HB ratio: 0.07, (c) all-way stop (Figure 4, callout iii); HB count: 524, HB ratio: 0.14. (map data: Esri).
Futuretransp 04 00046 g005
Figure 6. Box-and-whisker plots of HB ratios by turn and intersection type. (a) Left turn, (b) through, (c) right turn.
Futuretransp 04 00046 g006
Figure 7. Density of HB events along the distance from the intersection center by turn and intersection type. (a) Left turn, (b) through, (c) right turn.
Futuretransp 04 00046 g007
Figure 8. Density of speeds at the time of HB by turn and intersection type. (a) Left turn, (b) through, (c) right turn.
Futuretransp 04 00046 g008
Figure 9. 10 MPH pace at the time of HB by turn and intersection type. (a) Left movement, (b) through movement, (c) right movement.
Futuretransp 04 00046 g009
Figure 10. Distance from the center and speed at the time of HB density contour plots by intersection and turn type.
Futuretransp 04 00046 g010
Table 1. Tukey pairwise comparison p-values of average HB ratios by intersection pair and turn type.
Intersection PairLeftThroughRight
Signal–Roundabout0.7160.6460.941
Signal–All-Way Stop0.9530.0000.074
Roundabout–All-Way Stop0.0600.0000.000
Note: Shaded cells represent statistically significant comparisons.
Disclaimer/Publisher’s Note: The statements, opinions and data contained in all publications are solely those of the individual author(s) and contributor(s) and not of MDPI and/or the editor(s). MDPI and/or the editor(s) disclaim responsibility for any injury to people or property resulting from any ideas, methods, instructions or products referred to in the content.

