Perspective

Visions, Paradigms, and Anomalies of Urban Transport

by
Francesco Filippi
Research Centre for Transport and Logistics, Sapienza University of Rome, 00184 Rome, Italy
Future Transp. 2024, 4(3), 938-967; https://doi.org/10.3390/futuretransp4030045
Submission received: 22 March 2024 / Revised: 19 July 2024 / Accepted: 19 August 2024 / Published: 23 August 2024

Abstract

:
Urban transport has evolved based on three main visions: automobility, multimodality, and accessibility. The first dominates North American cities; the second, European; the third, significantly discussed in the literature, is still in the early stages of practical development, with a few limited examples. Each of the first two visions has an aligned planning paradigm to support aspirational goals and future directions. But implementation has been disappointing, owing to the appearance of anomalies; that is, unanticipated and unexplained mismatches between the vision and the paradigms that refuse to be resolved. The attempts are self-defeating, and result, for example, in congestion and road accidents. A review of the literature with some new insights can shed light on the problems and the anomalies of these two visions. For the third vision, a new paradigm has been proposed based on accessibility and polycentric and multi-timed cities, promising new insights and breakthroughs in the way of thinking about transport and cities. Some practical examples of accessibility cities are presented with a focus on people, places, land use changes, telecommunications, transportation demand management (TDM), and public and non-motorized transport. Some minor anomalies are discussed. In conclusion, enhancing accessibility in cities is crucial for creating more inclusive and sustainable urban environments that are less dependent on cars, but this vision and this paradigm still require further development to be accepted and implemented.

1. Introduction

Urban transport is a socio-technical system that works towards goals with business models and transport policies using technologies, operating within physical infrastructures, and sharing cultural assumptions and institutions. This paper considers three key elements of its evolution: visions, paradigms, and anomalies.
A vision is a description of what society, organizations, and individuals want to achieve. It depicts a desirable future and provides a determined sense of direction and purpose. It assists in setting goals, making decisions, and prioritizing actions.
A paradigm is a broad theoretical framework in a particular field. It defines accepted problems, basic assumptions, key concepts, methodologies, models, and solution sets in the Kuhnian scientific sense [1]. It shapes how scientists and professionals perceive and interact with their field.
To be effective, visions and paradigms should be aligned. An organization or group’s aspirational goals and future direction (vision) must be consistent with and supported by its beliefs, values, methods, and practices (paradigm).
Anomalies are violations of expectations; mismatches between the vision, what the paradigm predicts, and what is revealed when observing the implementations. Anomalies accumulate until scientists begin to question the paradigm itself. In the end, the crisis is resolved by a vision change and a new paradigm that fully comprehends and resolves the anomalies and avoids the mismatches.
A vision can emerge from a collective need for change, influenced by cultural and social factors, technology, and a paradigm shift. After a paradigm shift, a vision of the kind of world in which we live or in which we want to live will change. The old paradigms will survive in a limited field, where their explicative power is still valid, but the new paradigm solves some of the anomalies, delivers more powerful predictions, and offers a fruitful research program in extended fields.
This Kuhnian terminology has been used in public policy regarding how the learning process in public policymaking may unfold and produce various levels of policy changes [2]. In “normal policymaking”, policies are adjusted without challenging the fundamental terms of a particular “policy paradigm”, akin to “normal science”. On the other hand, there are changes affecting the fundamental nature of the policy that led to a “paradigm shift”.
More recently, the paradigm concept has been used in transport planning. A planning paradigm has been defined as “a systematic conceptualization of transport systems, embodied by planning activities and technological models” used “to evaluate transport policies and planning practices and to explore alternative approaches” [3].
There have been several vision and paradigm shifts related to urban transport and sustainability [4,5,6,7]. The vision of automobility cities was immediately linked to the new technology by the architects Le Corbusier [8] and Frank Lloyd Wright [9]. An effective description of the success of the automobile, dubbed “Autopia”, and some future visions “after the car mobility system” can be found in a 2016 book, What is the future? [10].
European cities were more resistant to car domination than American; thanks to their denser urban fabric and more organized transit, they developed a multi-modal transport vision [11].
One of the first studies, 30 years ago, pointed to the necessity of a paradigm shift from automobility to accessibility planning [12]. The paper is focused on people and places rather than on mobility. Accessibility planning relies on more compact, pedestrian-oriented community designs, telecommunications, transport demand management (TDM), and public and active transport (PT, AT). Later studies proposed a new paradigm for sustainable mobility [5,7]. The main transport measures considered include reducing the need to travel through information communication technologies (ICT), such as online shopping; modal shift in favor of active transport (AT); land-use policy measures for distance reduction; and car technology innovations. In the face of a widely recognized increasing uncertainty, some scholars propose a triple access system based on AT for accessibility by proximity, multimodal motorized transport for more distant destinations, and ICT to be more adaptable in the face of change and adversity with policies and investments [13]. Their approach tries to manage the planning process in the uncertain future.
The long-term data indicate that the market for cars in developed markets could be in structural decline, reflected in the current reduction in per capita kilometers driven per year and in the number new driving licenses, particularly for young people [14]. This has inspired a vision of car-free cities, where walking and cycling meet a much higher proportion of urban transport needs than at present, with positive effects on health and better use of public spaces [15].
The different visions and paradigms have been interpreted as an evolution of urban mobility through different stages and paradigms, strongly influenced by the involvement of an increasing range of academic disciplines, with different data, models, and methodologies, interactions, and changing policies (or visions) [16].
Figure 1 illustrates the three visions in terms of the modal share of motorized private cars. The direction is towards less car dependency, with positive effects on sustainability.
This paper focuses on the three visions of automobility, multimodality, and accessibility cities, along with their planning paradigms and associated anomalies. Its main objective is to analyze each vision, its goals or its purpose, and how it seeks to understand and transform urban transport. Each vision alters our perspective, challenges the status quo, and can lead to new insights and paradigms. A paradigm shift is a profound transformation. It involves a fundamental change in the underlying assumptions, beliefs, and models that shape our understanding of reality, the way we are planning, and how we change the urban environment in terms of sustainability. A paradigm shift can be driven by a new vision or by the discovery of anomalies. Identifying anomalies is crucial for advancing knowledge and contributing valuable insights. They represent unanswered questions or unresolved problems that offer opportunities for further investigation within the existing paradigm, and when they accumulate, they produce a paradigm shift. These are the research gaps. All three visions and the corresponding paradigms have persistent anomalies. Finally, particular attention is dedicated to the vision of the accessibility city, supported by scholars, experts, and some decision makers but still in its infancy.
This paper is structured in four parts: one for each vision, followed by the conclusions. Each part is divided into visions, paradigms, and anomalies. The methodology begins with the collection and selection of individual insights from various disciplines to highlight the common complex problem of land use and transport in modern cities, addressing a complex issue that cannot be solved by one discipline alone.
The original contribution of this work is that a search of the literature reveals no research linking the three aspects. Significant emphasis is on the paradigm and paradigm shift; only one recent paper addresses all three [7]. Much of the literature was selected based on urban transport visions and paradigms. It was more difficult to find studies that addressed anomalies, because this term is not used in the transport literature, but sometimes these anomalies are referred to as paradoxes [18,19].

2. Automobility City

2.1. The Vision

At the beginning of the 20th century, a new vision emerged of a city transport system dominated by cars, supported by enormous interests and the aspirations and ideals of societies and millions of individuals ready to reevaluate their life goals and values.
The automobility vision was prevalent in North America after the middle of the century. Cars were dominant in transport and city planning, reflecting a culture and lifestyle that viewed every person as a self-sufficient individual, deeply rooted in car ownership for daily transport. The first cars were for the upper class, but with the Ford Model T and its assembly lines, they became a mass product. There was a massive convergence of interests between oil producers, car companies, infrastructure contractors, officials of transport departments, and the growing number of drivers, as well as politicians trying to please their voters and exploit a profitable situation at the expense of pedestrians, cyclists, public transport, and livable public spaces.
Automobiles attract ordinary people due to their combination of physical and psychological signals, shared to different degrees by all human beings. Through movement and speed, automobiles give us the pleasure of showing skill and accepting risk. In this way, young people are able to show off their ability; the so-called young male syndrome. Automobiles are a status symbol, used as an indicator of social prestige and to increase the chances of being chosen by a partner. Automobiles protect us by surrounding our fragile, soft, and vulnerable human skin with a new shell of steel.
Automobiles have activated irresistible cues to our instincts. In Figure 2, the human being’s instincts are activated by four cues from the automobile, and his instinctive response is so immediate and natural as to compromise the use of his intelligence. A mismatch occurs if we use Kahneman’s System 1 thinking [20], “a near-instantaneous process driven by instincts, to evolutionarily novel problems (like the car) or, the reverse, when applying System 2 thinking, slower conscious and logical reasoning, to evolutionarily ancient problems [21]”.
Strong economic interests promoted the first policies to support automobiles, which were decisive for the affirmation of the new mass product. In particular, the expansion of the road system, urban restructuring, the different allocation of public spaces, and the decline of public transport were fundamental. The industry reaped the benefits of a product that appealed to both mass and elite markets. Politicians, who tend to favor technically simple ideas with broad popular support, realized that cars could solve the complex problems of economic growth and employment.
Artists, writers, and visionaries cemented automotive mobility into popular culture and consequently ensured its influence on national agendas. Engineers, fascinated by the new machine, provided the tools needed to design cities around cars. The most famous architect–urban planners of the period created visions of the city of the future based on automobiles. Le Corbusier imagines the city of tomorrow as vertical, with a triple system of roads: underground for heavy traffic, at grade for urban distribution traffic, and elevated highways running N–S and E–W for rapid traffic. An underground train station is in the center. For Le Corbusier, mobility and speed are priorities for the success of the city. “Speed is on the side of simple dreams: but it is a brutal necessity”, he wrote. “The conquest of speed has always been humanity’s dream, yet it has only taken shape in the last hundred years” [22].
The auto industry brought the idea back to Futurama, a display at the 1939 New York World’s Fair, which showcased a potential vision of the world two decades later (1959–1960). This exhibit, funded by the General Motors Corporation, highlighted automated roads with life-sized models and expansive suburban areas, possibly reflecting the American ethos of individualism [23]. Frank Lloyd Wright captured this in an extreme vision, the end of the city, which would be rendered obsolete by the individual mobility provided by cars. He proposed “Broadacre City”, a widespread, low-density population with individual houses, each surrounded by greenery; the American individualist dream that produced the “sprawl”.
This strong attraction to the car prevents us from objectively judging the manifold damage resulting from its excessive use. A recent study [24] has shown how the use of the car automatically receives a systematically distorted treatment in favor of a positive judgement; an effect that the authors call “motornormativity”. This motor-normative thinking seems endemic among administrators and physicians as well as the population. As a result, policy makers systematically neglect fundamental issues of public health and sustainability.

2.2. The Paradigm

Since 1920, traffic planning has been based on quantitative mathematical models developed based on the theoretical and practical work of numerous traffic engineers. The primary focus was on speed and drivers’ travel times. A paradigm for the automobility city was based on “predict and provide” and a three-step traffic model (Figure 3) with a hydraulic approach to verify a sufficient capacity for the predicted traffic on the existing and planned roads [25]. Mode choice was absent, because the demand was divided between car users and transit passengers.
The vision and the aligned paradigm changed the urban landscape based on these key features:
  • Extensive road networks from the city center to the rural areas, often with multiple lanes and multi-level road intersections that are well connected, allowing for easy access to various parts of the area.
  • Large parking lots, including multi-level parking structures and dedicated parking zones, are strategically located near commercial areas, industrial zones, and public spaces.
  • Wide streets and boulevards are prevalent, mainly auto-oriented and often neglecting the needs of pedestrians, cyclists, and public transport users. The intersections are carefully designed with traffic signals, turning lanes, and other features to optimize traffic flow.
  • The emphasis on automobiles may result in limited public transport infrastructure. While some bus routes or other modes of transit may exist, they might not be as extensive or well-developed as in other urban models.
  • Commercial and business districts are often aligned along major road arteries, making them easily accessible by car. Shopping centers, malls, and office complexes may be strategically positioned for convenient automotive access.
The term “suburb” gradually lost its relevance in describing the developments occurring on the outskirts of urban areas. By the 1980s, numerous former suburbs had become independent of central cities. A notable characteristic of the American-built environment was the emergence of edge cities (Figure 4), where commercial and entertainment activities were concentrated outside the traditional 19th-century urban core, typically located on the outskirts of metropolitan regions at the intersection of main highways, surrounded by urban sprawl. They reinforced the reliance on cars, with their spatial designs prioritizing automobile circulation as the primary mode of transport.
A modern vision of an automotive city revolves around creating a dynamic, efficient, and sustainable urban environment tailored to the needs and preferences of individuals relying on cars (Figure 5). This involves minimizing traffic congestion, optimizing travel times, and integrating advanced technologies for efficient traffic management. Despite the focus on automobiles, the city aims to be a leader in environmental sustainability. This includes promoting electric, hybrid, and autonomous vehicles, investing in green infrastructure, and implementing measures to offset the ecological impact of widespread car usage with innovative infrastructure. This includes smart roads, intelligent parking solutions, and cutting-edge technologies that enhance the overall experience of automotive travel. This involves smart traffic monitoring, strict enforcement of traffic regulations, and community engagement programs to promote responsible driving habits. Technological innovation is envisioned as a catalyst for economic prosperity. The city aims to be a hub for innovation, attracting investments, creating job opportunities, and contributing significantly to the local and national economy. In summary, the long-term vision for an automobility city aims to create a well-balanced urban environment that leverages the benefits of car-centric transport while prioritizing sustainability, quality of life, economic growth, and technological innovation.

2.3. Anomalies

This vision with its paradigm is challenged by many different anomalies. The detrimental impacts on the environment, society, and economy resulting from the relentless pursuit of an automotive city have been extensively emphasized.
The consumption of energy and space needed to move one 80 kg person using a 2–3 ton vehicle that occupies 10 m2 when stationary and 50 m2 at a speed of 30 km/h in a lane of 3 m will never make sense.
The car can reach high speeds, but its maximum capacity is around 60 km/h, 1500–2000 p/h in a 3.5 m lane. Trains carry thousands of passengers, and their performance, speed, density, and capacity, unlike road vehicles, are controlled with maximum safety via signaling. Their capacity can reach up to 90,000 p/h. The pedestrian capacity of the 3.5 m lane is 15,000 p/h; with a bicycle, it is 12,000 p/h.
The effects of car pollution are widespread and affect ecosystems and human health. Some direct and indirect health impacts of cars are given in Figure 6. The list is not complete because there are also effects, including some of the most common cancers [26]. Road accidents are the result of problems with speed, road conditions, and human behavior with its physical and psychological limits.
Human behavior has evolved over millions of years in the Environment of our Evolutionary Adaptedness (EEA), the African savannah [28]. In that environment, running faster than others was a key element of survival. But in contrast to the great physical activity of the hunter–gatherers who covered daily distances of 15–20 km, in the evolutionary past, a strong selection favored the survival of those who obtained the necessary calories with minimal effort [29] and exposure to risks [30]. The survivors, in other words, covered many kilometers but also spent many hours sitting and socializing in the group.
Today, this balance between activity and inactivity no longer works. Food is available in abundance at the supermarket, which is reached by a car parked in a garage under the building or house, often reached by a lift.
Figure 7 illustrates some of the consequences of the mismatch between psychological and behavioural mechanisms that evolution produced and that have been retained via natural selection.
Technology allows us to indulge our ancestral attraction to a sedentary lifestyle [32] to a level never seen in our evolutionary history (Figure 8). The figure shows also that inactivity is more important than speed and saving time. It is currently acknowledged that external elements, such as proximity to essential services, roads primarily for vehicles, the absence of green spaces, urban expansion, and neighborhood traffic safety, play a role in establishing an obesogenic physical setting.
The average portion of household income spent on transport in the US is 17%. Low-income groups spend as much on transport as on housing. The need for parking areas increases land requirements for retail and office use and the cost of housing by 25% (or more). Support and funding for cars are a regressive tax. Individuals with lower to moderate incomes, who typically drive less than the average, end up financially supporting those who drive more than the average, who are usually people with higher incomes.
But more than 50% of the population cannot use a car for transport. The individually owned car is not a universal means of transport; it is not accessible to everyone. An estimate of the percentage of people in the US who cannot use a car at any given moment is based on several key factors:
Licensed drivers: According to the data from the Federal Highway Administration, they were a total of 228,195,802 in the US in 2020, out of a resident population of about 329 million. This means that the percentage of US citizens with a driving license was about 69.4% in 2020. This percentage has been relatively stable since 1991, ranging from 68.3% to 70.5%. The age of the individual also impacts their possibility of having a license. They may be too young to drive or too old.
Access to a car: As of 2021, 91.7% of US households had at least one car; 40% had just one car, and 8.3% did not have access to a car. However, this figure varies significantly according to income. A growing percentage of Americans are falling behind on their car payments due to rising auto costs and loan interest rates. Owning a car is a necessity for many Americans. Nearly one-third (32%) of respondents to a nationally representative online survey in November 2021 by Qualtrics without a car say they need a car but cannot afford one right now. The poorest quintile spends 32% of their income on their car.
Physical disability: A total of 16% of U.S. residents have a physical disability, and only 60.4% of those with disabilities drive a car.
Licence suspended: The number of licenses that are suspended in the US every year, according to a report by the Fines and Fees Justice Center, is approximately 11 million as a result of unpaid court fines and fees, often for reasons completely unrelated to driving. At least 75% of Americans whose licenses are suspended continue driving, according to the National Highway Traffic Safety Administration.
In the end, approximately 50% of U.S. residents at any given moment cannot use an individually owned car. The automobility city is not for all; there is significant discrimination between classes, gender, and age.
Traffic congestion is inevitable and affects all major cities; the “predict and provide” solution to increase road capacity is the problem. The paradigm revealed its self-defeating nature [33,34,35] because increasing road capacity in congested conditions can actually worsen congestion through induced traffic demand.
There are four different perspectives on what constitutes induced traffic demand. The first is the result of a redistribution of car trips throughout the road network to reduce travel time. The second perspective links induced demand to a redistribution of car trips during desired hours. The third perspective depends on further decline of public transport that increases traffic on roads. The fourth perspective derives induced demand from urban expansion with sprawl and new developments.
The concept of induced demand—that expanding roadways will result in additional traffic, which renders any increase in capacity ineffective—is old and is supported by both theoretical and empirical foundations. “On urban commuter expressways, peak-hour traffic congestion rises to meet maximum capacity” [33]. The principle is widely accepted by the scientific transport community.
Nevertheless, induced demand seems difficult to understand and apply. Road expansion continues to have a tenacious appeal with the strong support of a coalescing of vested interests.
Because the construction of highways seems to be a simple and straightforward answer to a lack of capacity, the principle of induced demand is counterintuitive. When drivers are in stop-and-go traffic congestion, their instinctive reaction is to advocate for more roads. It is the fast, automatic, and emotional mode of thinking in a situation of discomfort that our brains use to make quick judgements and decisions [20]. This type of thinking is unconscious and instinctive and requires little effort. This linear simplistic solution is driven by our experiences and instincts, and even traffic engineers are not exempt from this illusion. “Evolution did not equip humans with the mental ability to handle the complex systems of modern cities” [36]. The solution of more of the same, “more traffic, more roads”, becomes the problem. The vision of an automobility city ends in a “black hole of road investments” [37] and perpetuates the process.
The circular dynamic of induced demand, more sprawl, and more roads in US cities led to significantly higher fuel consumption and distance travelled. Figure 9 illustrates the correlation between fuel consumption per capita, increasing from 40 to 70 (MJ/person×1000) with average car speed v1 and decreasing with average transit speed v2.
The distances travelled are not matched by the increase in speed v1, so the time dedicated to car travel increases to the detriment of travel via modes, especially walking, if the time budget is respected. Low-density cities, such as Houston, have higher car speeds, longer travel distances, and slower transit speeds. High-density cities, such as New York and Chicago, have slower car speeds, shorter travel distances, and higher transit speeds. They can increase proximity by shortening the distance between origins and destinations and can reduce car dependency in favor of AT [39,40].
The US per capita consumption (or vehicle-km) presented in Figure 9 is more than four times that of European cities, and this can be explained by the sprawl, low urban density, high level of supplying road capacity, and the decay of transit. For European cities, petrol consumption is stable and independent from the speed of cars and transit.
In Figure 10, v1 and v2 are negatively correlated in the US and positively correlated in Europe, which explains the differences in petrol consumption. In the US, car speed and consumption increase with the increase in car use and travel distances in areas of low density, high sprawl, and marginal transit use. Some cities, like New York, with a good supply of railways resisted the automotive vision. In Europe, the positive correlation of speed ensures competition between the two modes, to the point of keeping petrol consumption constant independently from speed; an important positive effect of transit.
Since the beginning of the 21st century, there has been a trend towards less automobile dependence. Urban density has stopped declining and is beginning to increase in most cities, and transport investments have begun to favor light rail, bus rapid transit (BRT), and metro systems, improving performances and demand [42] to avoid being stuck in traffic congestion [43], even though some authors remain skeptical [44].
Consequently, improving the quality and quantity of collective transport is a prerequisite to reducing congestion in urban areas, benefitting car users, transit users, and the environment.
But the principle of induced traffic demand is still not generally accepted. Many US state transport authorities still are wasting billions of federal dollars from the carbon reduction program (CRP) to fund highway projects. The purpose of the CRP is to fund state projects designed to reduce transport emissions as established by the Infrastructure Investment and Jobs Act. States could spend much of that money on mass transit, active transport, and other lower-carbon modal choices. But there are signs–even from progressive states–that most of it will be used for widening urban freeways. The argument is that, because vehicles idling while blocked on a congested road produce more emissions, additional vehicle lanes will reduce the underlying congestion, improve operational efficiency, and thus lower emissions.

3. Multimodality City

3.1. The Vision

Europeans, like Americans, were attracted by the automobility vision but were constrained by the built environment, high-density urban fabric, and existing public transport infrastructures. They never reached the motorization level of the US and the massive destruction of existing transit [45] that occurred in the US as a result of the influence of General Motors and other companies with a vested interests in the automotive industry.
The appearance of anomalies in the automobility city, with broad violations of expectations, increasingly attracted the attention of the academic community in Europe. The astounding studies that followed provided the background for a new basis of transport theories.
But European resistance to the automobile was not uniform and rigid; even the Old World had its Robert Moseses. In Rome, as early as the 1930s, well in advance of the automobility vision, construction of a motorway began from the center of Rome across the central archaeological zone (including the Roman Forum, the Imperial Fora, and the Colosseum) that required the demolition of a hill and many houses. It turned the Colosseum into a traffic island, broke through the ancient Roman walls, and reached the sea after 26 km. It is still there, but the initial central part has been eliminated, and traffic now avoids the Colosseum.
The emotional vision of maximizing the number of vehicles that can use the city’s road infrastructure, even to the detriment of other uses and other modes of transport, never dominated Europe as it did the US. The automobility vision was mitigated by a vision of a multimodal city that optimizes the transport modes to move people in the most efficient manner without discrimination based on income, physical ability, housing location, or anything else.
A multimodal city recognizes the importance of all aspects of mobility. A transport system must serve a variety of users to operate efficiently and equitably. People can use more than one mode choice for their journeys. Diverse mobility options are crucial, especially for individuals who are physically, economically, and socially disadvantaged. The main mobility choices include AT, automobile sharing, and PT (regular bus; bus rapid transit; light, heavy, and suburban rail). A good transport system must incorporate multiple modes of transport, ensure efficiency and effectiveness, be easy and convenient to use, and be fast, safe, inclusive, and affordable.
The performance of a multimodal transport system can be accurately assessed based on the level of access it provides to amenities and services. Therefore, a crucial aspect of effective urban and transport planning is ensuring that everyone, regardless of income, physical ability, housing location, mode of travel, or any other factor, has equal access to these facilities [46].

3.2. The Paradigm

As a consequence of the new vision, the planning paradigm shifted its focus from traffic to mobility: the movement of people and goods [47]. The Sustainable Urban Mobility Plan (SUMP) represents a European approach that is vision-led in terms of multimodal planning. It emphasizes mode choice and acknowledges that a plan should be shaped through a participatory process. The simple linear “predict and provide”, based on forecasting vehicular traffic demand and supplying new roads, has shifted to a more complex and articulated “decide and provide” approach to reduce individual motorized travel, to promote public (PT) and active transport (AT) to move people, not cars, in the most efficient and sustainable manner possible. PT utilizes urban space more efficiently than private cars, making it a solution for transforming roads and managing improvements to AT, sharing vehicles, and public spaces.
The model structure also changes to include multimodality. It should have new models for evaluating modal split and multimodal assignments, as shown in Figure 11.
The paradigm shift has two important effects on anomalies: the reduction of dependence on the car and the control of traffic congestion.
The first effect is a direct result of fewer cars—less traffic and consequently less space consumption, less energy consumption, less pollution, and fewer accidents. The presence of effective public transport means greater equity and lower costs.
The second effect was recognized theoretically as the Downs/Thomson paradox [33] (Figure 12). Improvements to roads and to transit have completely different effects. Both tend to attract users, but, in the case of transit, they lead to higher revenue and better service while reducing road congestion. In contrast, users attracted to road improvements increase congestion and cancel the benefits. At equilibrium, the costs of a trip by car and mass transit are the same, as seen in Figure 12. The cost of a car increases rapidly with the flow, while the cost of transit is the opposite—the more users, the lower the generalized cost—and the two modes find an equilibrium in E. A better road, the purple dotted line in Figure 12, reduced the cost, but the new equilibrium, E’ is worse than before; with an improvement in the transit, the green dotted line, the new equilibrium, E” is better than before.
To serve an increased demand, transit must increase in frequency, and this reduces the waiting times and increases efficiency due to the expansion of the service; the so-called “Mohring effect” [48].
At the end of the process, the average door-to-door speeds by car and rail are approximately equal, which suggests paradoxically that the most effective approach to increasing average speeds on urban road networks is to increase speeds by rail or other transport modes, such as Bus Rapid Transit (BRT), on dedicated lanes. The opposite is true for road traffic. With more vehicles on a road, the overall efficiency and speed of travel tend to decrease.
The paradox was confirmed in London and Paris by researchers at University College London [34]. A similar paradox in Rome is illustrated in Figure 13. Despite the profound diversity of the situations, in Rome, a new metro line brought about a certain rebalancing between the door-to-door speeds of private transport and rail transport for journeys from concentric rings towards the central areas of the city (Figure 13).
The door-to-door speed increases with the distance from the center, as in the case of London. The private transport speed is a little higher along the corridor of metro A; an effect of a better modal split. In the other sectors of the city, public transport is significantly slower than the sector served by metro A, while speed increases with the distance from the center, where the public transport service is of a lower quality.
A study at the University of California, Berkeley [49] confirms that transit relieves traffic congestion. The study took advantage of a real-life example when a strike shut down the Los Angeles region’s transit for 35 days. The strike caused a significant increase in the average highway delay, which aligns with the projections made by a model. Moreover, this increase is much greater than the previously estimated congestion relief provided by public transit. The effects are more significant on roads along mass transit corridors. During the strike, on the US 101 freeway along the major Red Line subway, the average delay increased by 90 percent and by 123 percent during morning peak. For freeways without transit corridors, the average delay increased by 29 percent and 56 percent during the morning peak. More US studies on the effects of a transit strike are reported in a recent paper [50].
European cities have made significant progress in implementing integrated, multimodal transport systems. The success factors are strong institutional frameworks and advanced information and technological systems.
According to a report by the European Commission, which surveyed 60,000 individuals in 83 European cities, residents in larger urban areas tend to rely less on cars and more on public transport. The majority of city dwellers—about three quarters—expressed satisfaction with public transport services. The frequency of public transport plays a crucial role in overall satisfaction levels and in the use of the service (Figure 14).
Figure 15 shows that 50 per cent of the satisfaction with the city is explained by public transport services.
A multimodal system of high quality should integrate:
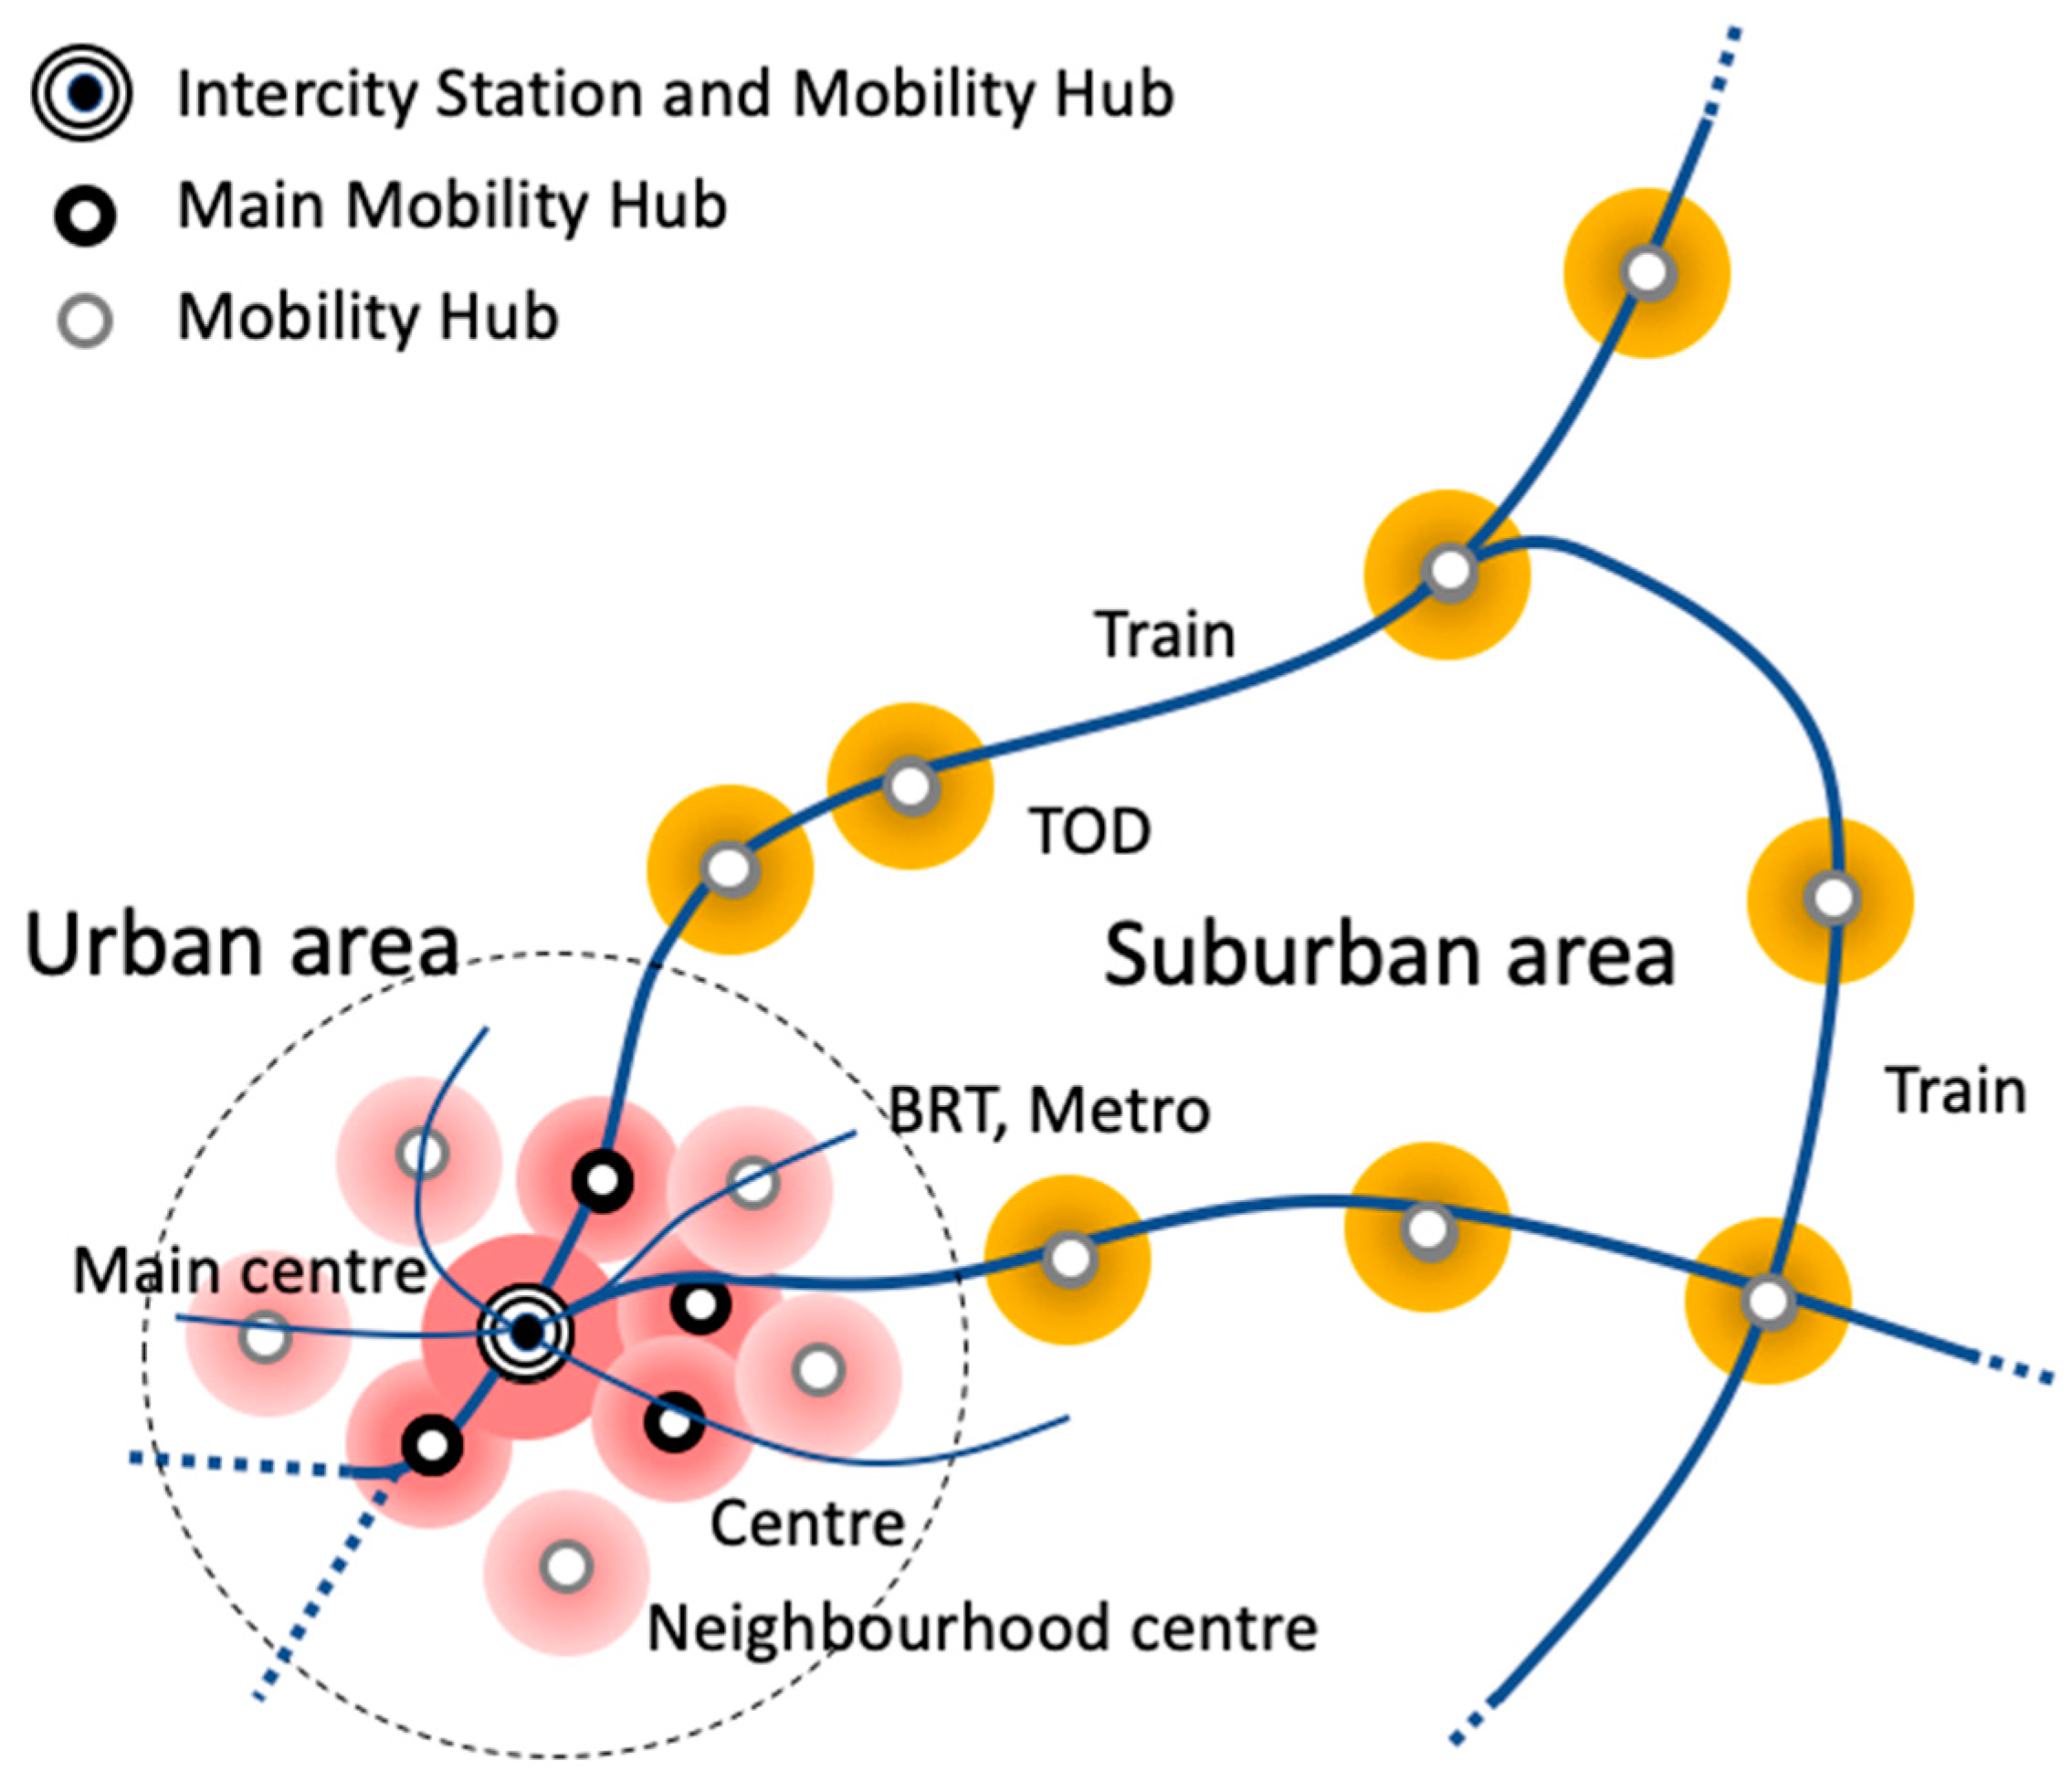
  • The transport modes physically and operationally with mobility hubs;
  • The information systems of service providers with real-time information to passengers on various modes regarding connectivity options, routes, schedules, and payment solutions, such as smart cards, to allow for seamless access and payment across different modes.

3.3. The Anomalies

In Europe, the multimodal vision and the new paradigm have given excellent results in terms of modal share in the capital city, as shown in Figure 16, enabling the operation of quicker, more punctual, and more reliable multimodal services with real-time travel information and more operational efficiency. But even for the capitals, the results are not uniform; some cities like Rome lag behind, in contrast to the good performance in Paris.
In recent years, Paris has adopted a comprehensive approach to transport planning, which has resulted in the implementation of various strategies aimed at reducing car dependency and promoting pedestrian areas, cyclists’ paths, and public transport.
In effect, the most blatant violation of expectations (the Kuhnian anomaly) is that the private cars continue to be the most-used transport mode.
Table 1 shows the distance travelled based on transport mode for 10 Member States. The use of private cars, whether as drivers or passengers, varies across countries but is always at the top. Romania has the lowest share, with private cars accounting for only 57% of the total daily distance traveled, while in Italy, the share is significantly higher, at 74%. On the other hand, Romania and Poland rely more on buses, coaches, and urban rail, which collectively make up around 30% of the distance covered in both countries. Notable differences among the Member States include Greece, where powered two-wheelers contribute to 7% to the total distance traveled, and the Netherlands, where bicycles account for a substantial 16%, followed by Denmark and Belgium, at 7% each, and Germany, at 5%.
The consequences are higher greenhouse gas emissions due to transport and worsening congestion in most European cities.
A special report of the European Court of Auditors on Sustainable Urban Mobility in the EU shows (Figure 17) that only in 2 of 13 of cities with comparable data over different years—Antwerp and Bordeaux—did private car usage drop considerably, while in Budapest, it increased by 80% [53].
The report also shows (Figure 18) that in the 11 cities that provided data on the topic, the modal share of private vehicles was in most cases considerably higher in the metropolitan area surrounding the city than in the city itself.
The car remained by far the most common form of transport in the EU (European Union). The share of public transport remains low. Passenger cars in the EU 27 account for 85% of all land transport modes, buses account for 7%, rail accounts for 6%, and tram and metro account for 1% (Eurostat).
Figure 19 shows the motorization rate in the EU 27 and in selected countries. The number of passenger cars reaches a new peak.
The EU’s highest motorization rate was registered in Italy, with 684 passenger cars per 1000 inhabitants; the lowest in Latvia (414).
In the year 2021, the number of fatalities resulting from road accidents reached nearly 20,000 individuals. It is worth noting that Germany alone accounted for more than 2500 of these deaths.

4. Accessible City

4.1. The Vision

A novel approach to planning is the promotion of a significantly broadened array of urban objectives and methods, extending beyond mere economic efficiency. The enhanced objectives encompass aspects such as social unity and inclusiveness, the physical and mental well-being of humans, environmental sustainability, and the improvement of biodiversity. The aim of the new approach is more to improve accessibility than to reduce traffic and provide mobility. It is a new transport planning paradigm developed with “a vision of a city beyond mobility” [54,55].
The distinction between accessibility and mobility is critical for a sustainable transport policy. Focusing on traffic means that road capacity and speed are seen as beneficial, while congestion for inadequate roads is viewed as the problem. But this approach has not solved the problems and is self-defeating. Positive feedback and circular processes of induced traffic and the cumulative decline of public transport contribute to increasing traffic and car dependence. Attention to mobility means efficient movement of people and goods. Although this is more effective than a focus on traffic and can provide freedom of modal choice and accommodate more mobility with a reduction in time and cost, the results in the EU still indicate a strong prevalence of car use.
If we want to limit global warming to 1.5 °C by 2030 through a strong diminution of greenhouse gas emissions, we have to reconsider our vision of urban accessibility. The ultimate goal is access (or accessibility), the quantity of the desired destinations, opportunities, or amenities that can be reached in a given time. Access is provided through three different systems [13]: digital connectivity, active transport with spatial proximity, and motorized multimodal transport. This interconnected triple-access system serves as the essential facilitator of activities related to economic and social life. The plan must be flexible and resilient to uncertainty by considering different scenarios and how they could perform in future developments.
The increasingly digital connectivity allows numerous activities to be performed digitally without transport (Table 2).
But, digital accessibility means more than just avoiding travel; it can improve modal choice and multimodal integration.
AT provides access through spatial proximity, like the 15 min city, which allows for access to urban daily services and amenities within walking and biking distance. AT can be a feeder of the main public transport, and cars become an option, not a necessity. Special services can be dedicated to elderly and disabled people who cannot use such modes. Fifteen-minute neighborhoods avoid car dependency and isolation through mixed land use and livable neighborhoods, which can be a solution for dormitory peripheries that continue to grow uniformly without the needed amenities.
Multimodal transport (MT) provides access to the centers and institutions of the city and region that are beyond the neighborhood level.
This represents a shift in the land-use plan. Central business districts’ dominance is rebalanced in favor of a polycentric and multi-timed city [56]: public spaces and amenities at various distances from homes, centered on mobility hubs based on public transport, mobility sharing, and micromobility. AT gives residents access to daily amenities in their neighborhoods (15 minutes). Urban roads ought to be designed not merely as efficient traffic flow channels but as versatile green public spaces.
The main objectives must be to:
  • improve mobility impacts with active transport;
  • end car dependence in urban transport;
  • create more livable public spaces;
  • foster responsible lifestyles and economies;
  • ensure the health and well-being of everyone;
  • encourage community cohesion;
  • avoid an obesogenic environment [57].
A desirable scenario is a city structured by neighborhoods with a certain degree of self-sufficiency. Internal travel favors active transport, such as the 15 min city of Paris or the superblocks of Barcelona. A network of urban hubs with superior functions connects this polycentric city via motorized transport systems in which priority is given to collective transport.
The emerging vision of a polycentric and multi-timed city is represented in Table 3.
Moving beyond mobility seems a direct solution to obtain a more livable and less car-dependent city. In the modern world, mobility is no longer a goal in its own right. Yet, urban societies are still mobility-dependent. Several constituent elements have been identified [58], and the attraction of people to mobility responds to the most powerful of our ancestral “seeking” instincts that move us to explore our environment in order to meet our needs. Seeking and mobility, for hundreds of thousands of years, were essential for food procurement and much more. They are thus deeply rooted in our brain and can deceive us when we make behavioral choices. Cars appeal to our desire to cover long distances quickly, protected by a metal shell and comfortably seated. For this reason, going beyond mobility presents some challenges.

4.2. The Paradigm

The proposed methodology overcomes and integrates the traditional four-stage planning model based on zoning and movement between areas. It is no longer a question of predicting increasing mobility. The new policy paradigm is based on the backcasting approach of identifying preferable and sustainable futures [59]. Backcasting, through the participation of all interested parties, formulates a vision of the future, outlines the desirable scenario, and then proceeds backwards in time by identifying the interventions (policies and projects) needed to achieve it, ensuring its realization step-by-step. The new approach is vision-led: to “participate, decide, and provide”. Once a desirable future has been formulated, it focuses on how to get there. At its heart is deciding on a preferred future and providing the development path best suited to achieving it. The transport plan is evaluated in terms of access, not mobility, and is considered in parallel with the land-use plan. The zones of the four-step model are no longer considered as a generator or attractor of trips, but as the first level of access to daily needed services and activities. The cities and technologies adapted to human nature and the planning method are holistic and human-centric.
The steps proposed for the new paradigm based on accessibility are given in Figure 20.
The first activity is a subdivision of the area into zones, with socio-economic, origin–destination (OD), and land-use (LU) data. The next activity is the classification of urban attractors into three levels, beginning with neighborhoods (the lowest level), then sectors of the city, and, third, the city and beyond. The plan should also consider the peripheral and rural areas affected by the sprawl, generally with a few distant attractors, and strongly dependent on cars.
The clusters of amenities of different attractions are classified into three levels as single centers, multiple centers, and neighborhood centers. This tendency of amenities to cluster is consistent with the agglomeration effects of cities.
Figure 21 provides an example of a spatial distribution of urban attractors with mobility hubs distributed in an urban and suburban area. Mobility hubs are places where public transport connections and mobility services intersect, where Mobility as a Service (MaaS) can be located, as well as places where residences, amenities, offices, and healthcare facilities can be built.
Mobility hubs offer a range of transport modes that are safe and convenient to switch between, as well as easily accessible and well-distributed. They encourage the use of these alternative modes of transport, reducing dependency on private cars.
MaaS integrates transport services and mobility solutions into a platform, allowing users to choose and access the best solution for their needs and destinations. Modern multimodal networks often leverage technology to provide real-time information to commuters. This includes mobile apps, digital signage, and other tools to inform users about schedules, delays, and alternative routes, and a unified payment platform that integrates all services and is accepted by all operators.
The main centers contain attractions that require an hour’s travel to reach, such as universities, major museums, concert halls, exclusive shopping districts, and significant historical landmarks. Metro and BRT are optimal for this distance, and the attractions tend to be concentrated near major stations and mobility hubs.
The centers across the urban and metropolitan areas contain hospitals, town halls, shopping centers, headquarters, swimming pools, or larger parks that require a catchment area of half an hour by motorized transport and may be visited more frequently than those in the center. This polycentric city consists of a network of urban centers, small cities in the suburbs, and a regional system of TODs, all linked by quality public transit, both radial and circumferential. This system creates new peripheral mobility hubs and strengthens the position of the main center due to the concentration of radials. This is achieved without making it an obligatory passage point, which improves the accessibility of the entire area.
The neighborhood centers provide people with daily amenities no more than a 15-min walk from home on safe, easy-to-use routes. The closer the destinations, the more frequently they are visited. The aim is to reorganize physical space around walkable and cyclable neighborhoods. A significant portion of all city trips can be completed within a 15 min range by either walking or cycling, while leaving the rest farther away, mostly on motorized transport and constrained by the 1 h time budget.
A spatial proximity analysis is designed to connect the needs of the users with resources (neighborhood services), taking into account pedestrian travel. The attributes of pedestrian routes are identified and categorized for each route through direct surveys and are weighted based on the user’s willingness/capacity to walk. The characteristics are sidewalk width, condition of the pavement, presence of traffic lights, pedestrian crossings, speed limits, low traffic, presence of benches, presence of shaded green paths, and low noise pollution.
City amenities, which are the communal goods and services within a city, significantly impact the living standards of city dwellers. These amenities encompass a variety of aspects such as parks, museums, libraries, high-standard schools, public transit, and safety services. They not only cater to the fundamental needs of city inhabitants but also enhance the appeal of a city to prospective residents, businesses, and investors. The daily amenities included in a study of the 15-min city [60] are listed in Table 4.
Figure 22 shows the accessibility to the above daily amenities within 15 min on foot in Rome and Paris. The color of the zones indicates the mean time it takes for a person to access these everyday amenities on foot. Zones where this time is less than 15 min are depicted in blue. As the travel time increases, the color changes from blue to white, then to red, and finally to brown. The difference between the two cities is striking. Rome has satisfactory accessibility only around the city center, while the periphery completely lacks daily amenities. Paris has very diffused, good accessibility. The figure can explain the effects of these differences in terms of modal split. Rome and Paris are at the extreme of the figure. Rome has very few walking trips and many car trips compared with Paris.
The Paris results are related to the implementation of measures to prioritize pedestrians, cyclists, and transit while aiming to reduce car usage significantly. In addition to pedestrianizing the Seine’s quayside, the French capital has banned heavily polluting diesel cars through the creation of a low-emission zones, introduced triple parking fees for SUVs, reduced drivers’ access to major streets, expanded green areas, and promoted other ways of getting around the city.
The main initiatives to restore livability in the neighborhoods are as follows:
  • Plan Velo Act 2 aims to make Paris entirely bikeable by 2026, with an investment of 250 million euros. It includes adding 130 km of bike-safe pathways, teaching children to ride bikes in schools, and encouraging cycling tourism.
  • Street Code is a new ‘code de la rue’ introduced to help cyclists, cars, and pedestrians share the roads. It includes rules such as respecting pedestrian priority, not encroaching on bus lanes or bike paths, and obeying traffic lights and signs.
  • Low-traffic zones ban through traffic in four central districts to give priority to cyclists, pedestrians, and public transport, creating a less-polluted and safer city.
To continue with the procedure of Figure 21, each zone’s 15 min accessibility on foot can be used to form neighborhoods based on a procedure of partitioning to create compact and balanced areas of zones that can access the daily amenities in less than 15 min.
The gap analysis in Figure 21 will identify and assess the gap between current and desired accessibility levels to the attractors. The gaps will drive the actions with new amenities and transport services. The actions should be based on the greatest accessibility and least mobility, with new land use through urban attractors and transport services.
A plan transforms the neighborhood roads into a walkable/cyclable network, a self-sufficient area for daily needs with reduced speed limits (30 km/h). It reduces space allocated to car traffic, one 3 m lane, and imposes a cap on parking. Instead of minimum parking requirements, there will be maximum parking requirements, as well as several communal garages on the edge of the neighborhood. The remaining on-street parking should have time limitations and payments to favor public spaces for pedestrians with green areas, sitting spaces, and good landscaping.
The plan improves sidewalks with furniture and trees, allows guerrilla gardening and parklets, and disallows curb cuts for driveways. It creates mobility hubs, where people can easily find and use different public transport and shared vehicles. By reducing the need for private cars, it improves travel quality and makes the surroundings more enjoyable.
The 15 min city should be paired with a multimodal transport network connecting neighborhoods to avoid the risks of worsening the social isolation of marginalized communities [61].
The inclusion of local streets in the planning process is an important difference with respect to the traditional models of traffic, where each zone is only a centroid connector to the network. This allows for modelling of the improvement of access to local amenities and the transit network via active transport with attention to density, mixed use, walkability, bikeability, and safety. Walking and biking links can be included in the transit network. The focus on active transport reduces the demand for motorized transport, with benefits for public health, congestion, transport costs, and space occupancy.
The urban requalification at Vauban, a peripheral quarter of Freiburg, Germany, is a good example [62]. Car owners who live on the parking-free blocks must park in one of the peripheral garages. The main roads are located on the edge of the neighborhood, and some are crossed by a bus service, which also serves two tram stops. All the others have a limit of 30 km/h and are designed according to the principle of selective permeability and fused grid. The objective is to limit transit and vehicular crossing in the neighborhood, reducing the internal connectivity of roads for car traffic and increasing the connectivity of the active and public transport networks. Parking within the neighborhood is permitted only for commercial vehicles serving the shops. The natural sedentary habits of humans can be exploited to reduce car dependence. The parking lots are located mainly on the periphery of the neighborhood, except those for the vehicles for people with disabilities or for other essential purposes, and the mobility hubs are centrally located. The few residents who own a car (170 out of every 1000) have parking spaces on the edge of the neighborhood to prevent internal traffic and make the car less appealing.
The multi-timed city has to satisfy the need for accessibility to the superior amenities located in the main center and in minor centers. The gap in accessibility is more difficult to resolve with new developments. These should thus be limited to a few important interventions. Improvements at the neighborhood level should reduce both dependence on cars and distances. The main street should be transformed to give priority to mass transit, reduce pollution, and improve safety. The transformation could begin with the most congested streets, whose capacities are extremely limited, then with those with less traffic.
For decades, transport planning has been primarily concerned with increasing the capacity of roads to accommodate growing automotive mobility. Years passed before research theoretically and experimentally demonstrated that this practice breeds cycles with induced traffic. But, the effect also works in reverse: the new road increases traffic, but its removal causes the traffic to decrease. London Transport and the Department of the Environment, Transport and the Regions (DETR) in London UK funded a study in the late 1990s to explain “the empirical evidence of the effects of reducing road capacity on traffic levels” [63]. After a careful examination of dozens of road removal interventions, the study concluded that “measures that reduce or reallocate road capacity, when well designed and supported by strong reasons, must not be automatically rejected for fear that they will inevitably cause unacceptable congestion”. People are much more adaptable to changing conditions than the models represent, and the feared increase in congestion does not occur [64]. Traffic is not an incompressible hydraulic system. Reducing roads for car traffic leads to changes in destinations, a redistribution on the network, and a different distribution between modes of transport. Therefore, it is possible to improve the usability of urban spaces.
Transformations of urban streets from arteries for car traffic to green, pedestrian, cycle, and collective transport routes are now taking place globally. In Seoul, South Korea, between 2003 and 2005, the central urban highway, Cheonggye, was removed, an elevated road of about 6 km with four lanes over a river, with another six lanes at grade. Today, the river has been redeveloped and has become a route equipped with greenery and public transport services. Even in the US and Europe, many cities have removed major urban roads. The Embarcadero Freeway, an elevated road on the San Francisco seafront damaged by the 1989 earthquake, was demolished and replaced by a pedestrian path. Examples in Europe are the Georges Pompidou expressway in Paris and the M-30 in Madrid. In Italy, part of the Naples seafront was pedestrianized, as was part of Rome’s monumental Via dei Fori Imperiali. In Rome, the idea is to join the central archaeological area with the Circus Maximus and the Baths of Caracalla to create an enormous continuous archaeological park.
The 15 min city, environmental islands, and 30 km/h speed limits can be important tools for transforming the urban road network. Reducing speed increases safety and reduces noise and the space needed for cars for the benefit of pavements, squares, cycle paths, and green spaces. In Europe, hundreds of cities of all sizes have now adopted policies of this nature.
In the transformation of roads, an important role must be attributed to the development of bus rapid transit (BRT). First used in Curitiba, Brazil in 1974, it has spread throughout the world in competition with traditional metros due to its costs, capacity, and popularity with users.
BRT has proved to be much more popular than metros because it is just as fast, more frequent, and easier to access. The global success of BRT is confirmed by the number of new developments [65], rapidly equaling the number of metros in the world. The development of electric buses should give a further boost to BRT.
Sprawl areas can be reintegrated with urban centers and subcenters through the implementation of Transit-Oriented Development (TOD), which is characterized by a high density, combining multiple uses into one space, high-quality mobility hubs with public transit services (such as BRT systems, underground trains, etc.), and streets designed to promote walking and cycling and to reduce dependence on cars [66]. These developments establish a network within less dense and more scattered urban areas, linking entire urban cores with both rural and urban regions, as illustrated in Figure 22. The network supports transit-oriented development principles, promoting mixed-use developments around mobility hubs. This promotes a more compact and walkable urban environment, reducing the need for extensive car use. The functions of TODs can be mainly complementary and less competitive, providing different specializations.
A circular diagram with feedback in Figure 23 represents the new paradigm as a circle from the 15 min access neighborhood to the development of TOD, the reduction of the impacts, and the rebound of public transport.
However, the road to accepting and applying this new paradigm is still long. A recent review of SUMP from eight European countries showed that only the concept of spatial proximity seems to be well understood [67]. The lack of collaboration between institutions and departments often limits integration with major financial uncertainties, subject to norms and rules defined independently in the land-use plan. It is essential to implement governance strategies that are capable of addressing entrenched, systemic opposition to change from many different directions. The Italian SUMPs have all these problems, but they emerge from the rest for their dominant reliance on transport planning, still based on four-stage models, which have trouble dealing with spatial proximity, digital accessibility, and uncertainty [67].

4.3. Anomalies

The new paradigm is still in its infancy, but two possible violations of expectations can be identified.
The first is related to digital accessibility. The gains in time provided by digital accessibility have rebound effects confirmed by several studies [68,69,70]. Such effects are consistent with the broader evidence of the constancy of the time budget dedicated to travel in many different contexts—at slightly more than one hour per day [71].
Many studies have investigated the changes in the travel of teleworkers. They travel less often for work, but they tend to travel more for other reasons and in different periods. For example, US teleworkers take 10.8% more non-work trips per day than non-teleworkers, and these are, on average, 15.7% farther [72]. A study in Newark, New Jersey (US), found that vehicle use has not diminished with online shopping [73]. Studies from the US, Canada, and England all find that teleworkers engage in more cycling and walking than non-teleworkers [74,75] but also find that they engage in more car travel [76]. They could take advantage of their free time to engage in more social activities, or such activities may substitute for the reduced social interaction in workplaces. A study on teleworkers used the data from the English National Travel Survey to estimate the impact of teleworking on the travel patterns of English households over the period of 2005–2019. They found that teleworking has made little contribution to sustainable travel in England over the last 15 years [69].
The success of Paris in enhancing AT and PT has been limited to Paris and the “petite couronne”. Cars are still the first motorized mode used across the region, with a strong preponderance in the “grande couronne”, the four departments around the “petite couronne”. The extension of the new paradigm to the low-density peripheries and rural sprawl around cities dominated by cars can be an area of anomaly. TOD has demonstrated considerable success in compact, polycentric, urban environments [77]. To make it work in less dense and more dispersed urban settings and to connect entire rural and urban regions, the concept of TOD should be profoundly changed. Some efforts are being made in this direction, but they are still developing.
Also, low densities reduce the effectiveness of PT, and increasing distances reduce the attractiveness of AT modes. The use of autonomous vehicles may be able to reverse these problems in the future.

5. Conclusions

Three visions of urban transport with associated paradigms and anomalies have been presented. The first, completely dedicated to the automobile, dominated North American cities with less-structured urban fabric, such as Los Angeles, Houston, and Atlanta. The second, European paradigm focused on cars but mitigated by the existence of well-structured cities with strong public transport services, with a multimodal perspective. Both have violated the expectations of their respective visions and have become obsolete in light of the increasingly pressing needs for GHG reduction to address climate change.
The new vision of the accessible city moves beyond mobility and seeks solutions in the Triple Access System (TAS) version, jointly considering transport and land use, which, however, still has a long way to go to be accepted and applied. Some positive signals are limited to spatial proximity and active transport, multimodality with mobility hubs, and MaaS and sharing. Digital accessibility is still left to a laissez-faire approach, with questionable results due to the presence of rebound effects.
One of the most focused cities is Paris, and, as we have seen, it has achieved excellent results. Automobile cities have enormous difficulties in moving towards the new vision, but there are some trying in cities like Los Angeles, with mass transit, metro, and BRT, and with TODs to create zones of spatial proximity.
Several factors can contribute to the change in accessibility vision. It is important that public opinion is in favor of changing the use of urban motorways for livable streets. Often, the agents of change in facilitating and executing new ideas are key individuals who are primarily responsible for this task, such as mayors, ministers, or charismatic campaigners. Certainly, institutional and organizational changes, as well as institutional and political integration, are needed. Planners from different fields should work across departments and organizations to share visions, policy objectives, and paradigms. The approach must avoid large-scale deployments but opt for pilot studies, trials, and experimental implementation to take into account the widespread uncertainty about the results and their reception by stakeholders. Subsequently, on the basis of an ex post evaluation, some of the pilots will be able to be used for a large-scale implementation.
The significant focus on uncertainty should be carefully managed to avoid the rejection of politicians, who more inclined to favor certainty and the determination of their policies. To encourage its diffusion, the new paradigm must become an integral part of the current SUMP, replacing tools, such as four-stage transport models, that are not aligned with accessibility (digital and proximity) and uncertainty.

Funding

This research received no external funding.

Institutional Review Board Statement

Not applicable.

Informed Consent Statement

Not applicable.

Data Availability Statement

All data can be found were available in the references.

Conflicts of Interest

The author declares no conflicts of interest.

References

  1. Kuhn, T.S. The Structure of Scientific Revolutions, with an Introductory Essay by Ian Hacking, 4th ed.; University of Chicago Press: Chicago, IL, USA, 2012. [Google Scholar]
  2. Hall, P.A. Policy Paradigms, Social Learning, and the State: The Case of Economic Policymaking in Britain. Comp. Politics 1993, 25, 275–296. [Google Scholar] [CrossRef]
  3. Akse, R.; de la Bruhèze Adri, A.; Geurs, K. Transport planning, paradigms and practices: Finding conditions for change. In Discourse Analysis in Transport and Urban Development; Edward Elgar Publishing: Cheltenham, UK, 2023. [Google Scholar]
  4. Goldman, T.; Gorham, R. Sustainable urban transport: Four innovative directions. Technol. Soc. 2006, 28, 261–273. [Google Scholar] [CrossRef]
  5. Banister, D. The Sustainable Mobility Paradigm. Transp. Policy 2008, 15, 73–80. [Google Scholar] [CrossRef]
  6. Tuominen, A.; Kanner, H.; Linkama, E. A Paradigm Shift in European Transport and Urban Planning—Fact or Fable? Procedia Soc. Behav. Sci. 2012, 48, 1415–1423. [Google Scholar] [CrossRef]
  7. Filippi, F. A Paradigm Shift for a Transition to Sustainable Urban Transport. Sustainability 2022, 14, 2853. [Google Scholar] [CrossRef]
  8. Corbusier, L. City of Tomorrow and Its Planning; Dover Publications: New York, NY, USA, 1987; p. 190. [Google Scholar]
  9. Gray, J. Reading Broadacre. In Perspective, Frank Lloyd Wright Quarterly 2018; Winter Issue; Frank Lloyd Wright Foundation: Scottsdale, AZ, USA, 2018. [Google Scholar]
  10. Urry, J. What is the Future? Polity Press: Cambridge, UK, 2016. [Google Scholar]
  11. Litman, T. Towards More Comprehensive and Multi-Modal Transport Evaluation; Victoria Transport Policy Institute: Victoria, BC, Canada, 2023. [Google Scholar]
  12. Cervero, R. Paradigm shift: From automobility to accessibility planning. Urban Futures 1997, 22, 9–20. [Google Scholar]
  13. Lyons, G.; Davidson, C. Guidance for transport planning and policymaking in the face of an uncertain future. Transp. Res. Part A 2016, 88, 104–116. [Google Scholar] [CrossRef]
  14. Goodwin, P. Trends in Car Use, Travel Demand and Policy Thinking. In International Transport Forum Discussion Papers; OECD Publishing: Paris, France, 2020. [Google Scholar]
  15. Nieuwenhuijsen, M.J.; Khreis, H. Car free cities: Pathway to healthy urban living. Environ. Int. 2016, 94, 251–262. [Google Scholar] [CrossRef] [PubMed]
  16. Jones, P. The evolution of urban mobility: The interplay of academic and policy perspectives. Int. Assoc. Traffic Saf. Sci. Res. 2014, 38, 7–13. [Google Scholar] [CrossRef]
  17. Dalkmann, H.; Sakamoto, K. Transport: Investing in Energy and Resource Efficiency. Green Economy Report; UNEP: Nairobi, Kenya; UITP: Brussels, Belgium, 2006. [Google Scholar]
  18. Braess, D.; Nagurney, A.; Wakolbinger, T. On a paradox of traffic planning. Transp. Sci. 2005, 39, 446–450. [Google Scholar] [CrossRef]
  19. Mogridge, M.J.H. The Downs-Thomson paradox. In Travel in Towns; Palgrave Macmillan: London, UK, 1990; pp. 181–212. [Google Scholar] [CrossRef]
  20. Kahneman, D. Thinking Fast and Slow; Farrar, Straus and Giroux: New York, NY, USA, 2011. [Google Scholar]
  21. Van Vugt, M.; De Vries, L.P.; Li, N.P. Nudging Evolutionary Mismatched Behaviors: Implications for Social Psychology and Public Policy. In Sydney Symposium of Social Psychology; Forgas, J.P., Fiedler, K., Crano, W.D., Eds.; Routledge: London, UK, 2020. [Google Scholar]
  22. Mitpress. The Automobile in Le Corbusier’s Ideal Cities. 2014. Available online: http://mitp-content-server.mit.edu:18180/books/content/sectbyfn?collid=books_pres_0&id=9008&fn=9780262015363_sch_0001.pdf (accessed on 4 January 2014).
  23. Norton, P. Autonorama: The Illusory Promise of High-Tech Driving; Island Press: Washington, DC, USA, 2021. [Google Scholar]
  24. Walker, I.; Tapp, A.; Davis, A. Motornormativity: How Social Norms Hide a Major Public Health Hazard. Int. J. Environ. Health 2023, 11, 21–33. [Google Scholar]
  25. Naess, P.; Anderson, J.; Nicolaisen, M.S.; Strand, A. Transport modelling in the context of the ‘predict and provide’ paradigm. Eur. J. Transp. Infrastruct. Res. 2014, 14, 102–121. [Google Scholar] [CrossRef]
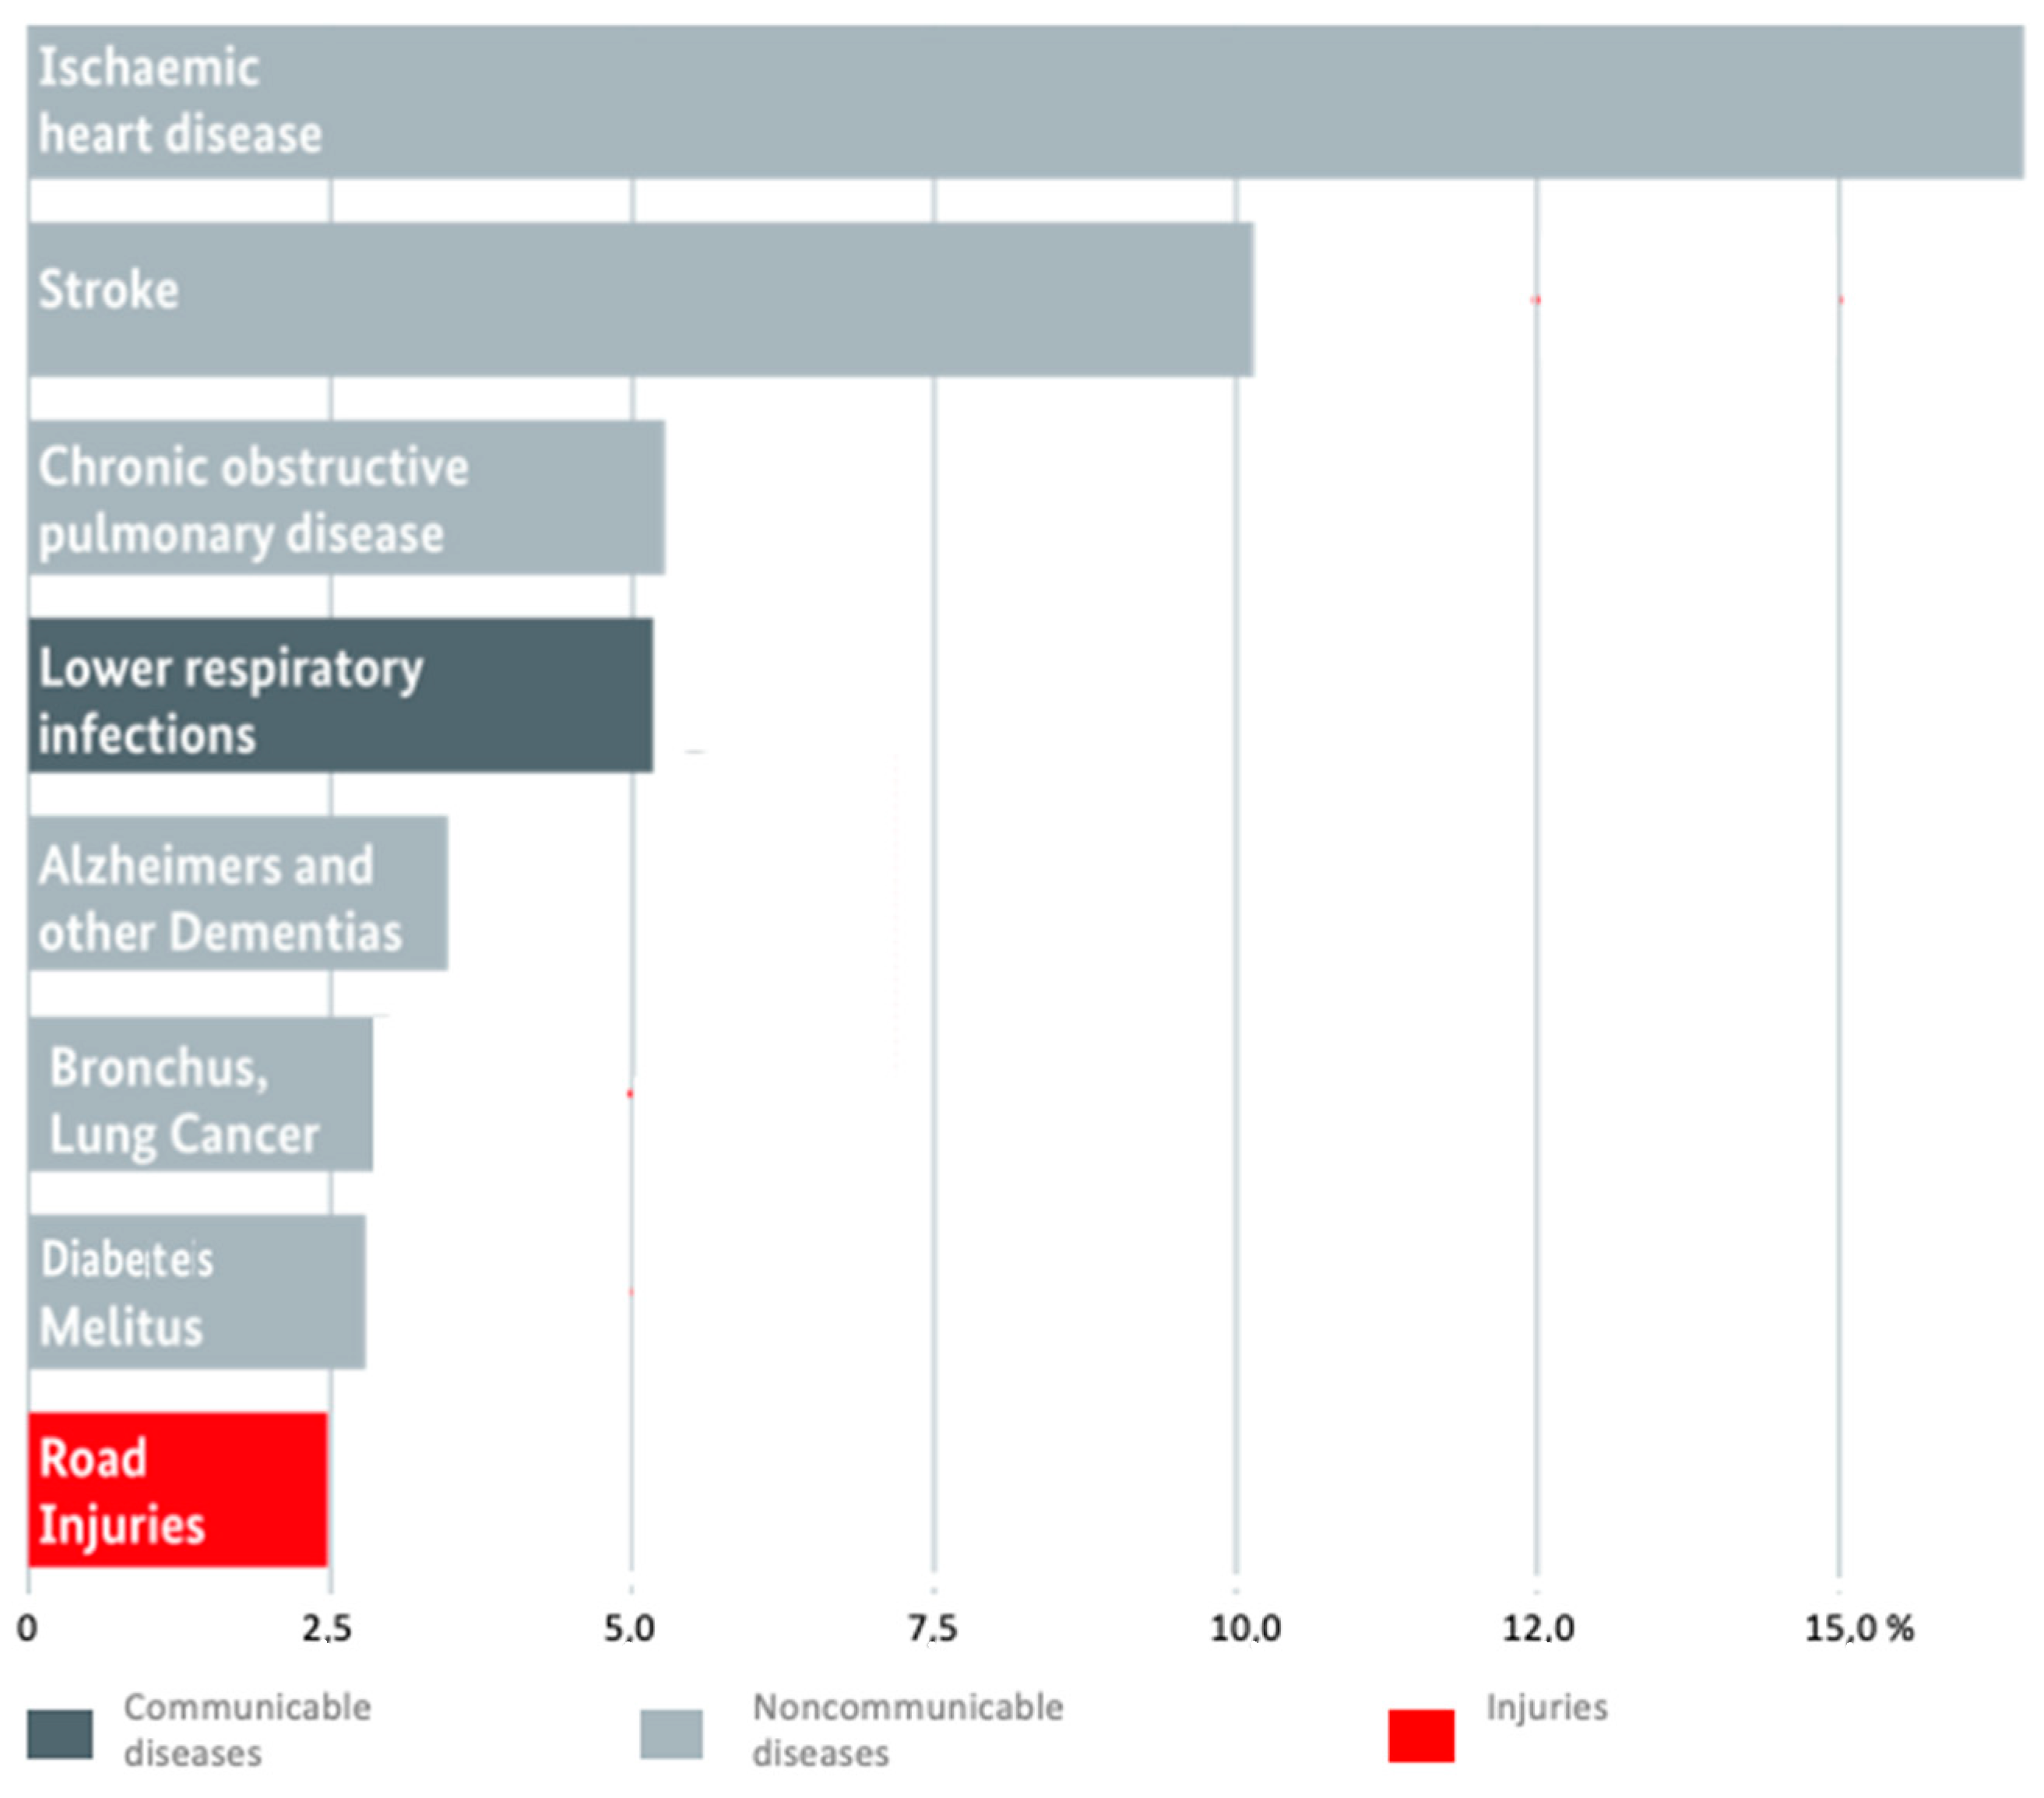
  26. Leon, D.A. Cities, urbanization and health. Int. J. Epidemiol. 2014, 37, 4–8. [Google Scholar] [CrossRef] [PubMed]
  27. World Health Organization. WHO Global Health Estimates: Deaths by Cause, Age, Sex by Country and by Region, 2000–2016; World Health Organization: Geneva, Switzerland, 2018. [Google Scholar]
  28. Giphart, R.; van Vugt, M. Mismatch: How Our Stone Age Brain Deceives Us Every Day and What We Can Do about It; Little Brown Book Group: London, UK, 2018. [Google Scholar]
  29. Kelly, R.L. The Fifth Beginning: What Six Million Years of Human History Can Tell Us About Our Future; University of California Press: Berkeley, CA, USA, 2016. [Google Scholar]
  30. Speakman, J.R. An Evolutionary Perspective on Sedentary Behavior. In BioEssays; Wiley Online Library: Hoboken, NJ, USA, 2019. [Google Scholar]
  31. Sbarra, D.; Briskin, J.; Slatcher, R.B. Smartphones and Close Relationships: The Case for an Evolutionary Mismatch. Perspect. Psychol. Sci. 2019, 14, 596–618. [Google Scholar] [CrossRef] [PubMed]
  32. Shaw, J. Born to Rest. Harvard Magazine, September—October 2016. Available online: https://www.harvardmagazine.com/2016/08/born-to-rest (accessed on 22 August 2024).
  33. Downs, A. Stuck in Traffic: Coping with Peak-Hour Traffic Congestion; Brookings Institution Press: Washington, DC, USA, 1992. [Google Scholar]
  34. Mogridge, M.J.H. The self-defeating nature of urban road capacity policy. A review of theories, disputes and available evidence. Transp. Policy 1997, 4, 5–23. [Google Scholar] [CrossRef]
  35. Cervero, R. Road Expansion, Urban Growth, and Induced Travel: A Path Analysis. In Dialogues in Urban and Regional Planning; Stiftel, B.B., Watson, V., Acselrad, H., Eds.; Routledge: New York, NY, USA, 2006; pp. 310–343. [Google Scholar]
  36. Forrester, J.W. Counterintuitive Behavior of Social Systems. Technol. Rev. 1971, 73, 52–68. [Google Scholar]
  37. Plane, D.A. Urban transportation: Policy alternatives. In The Geography of Urban Transportation; Hanson, S., Ed.; Guilford Press: London, UK, 1986; pp. 386–414. [Google Scholar]
  38. Filippi, F.; Papola, N. Effectiveness of New Road Investments in Metropolitan Areas. In Transactions on The Built Environment; WIT Press: UK, London, 1995. [Google Scholar]
  39. Newman, P.; Kenworthy, J. Gasoline Consumption and Cities Revisited: What Have We Learnt? Curr. Urban Stud. 2021, 9, 532–553. [Google Scholar] [CrossRef]
  40. Levine, J.; Grengs, J.; Shen, Q.; Shen, Q. Does accessibility require density or speed? A comparison of fast versus close in getting where you want to go in US metropolitan regions. J. Am. Plan. Assoc. 2012, 78, 157–172. [Google Scholar] [CrossRef]
  41. Newman, P.; Kenworthy, J. Cities and Automobile Dependence: An International Sourcebook; Gower Publishing: Brookfield, VT, USA, 1989. [Google Scholar]
  42. Newman, P.; Kenworthy, J. The End of Automobile Dependence: How Cities Are Moving beyond Car-Based Planning; Island Press: Washington, DC, USA, 2015. [Google Scholar]
  43. Sena, M.L. Beating Traffic. Time to Get Unstuck; Green Horse Publishing Company: ASA, Sweden, 2008. [Google Scholar]
  44. Duranton, G.; Turner, M.A. The Fundamental Law of Road Congestion: Evidence from US Cities. Am. Econ. Rev. 2011, 101, 2616–2652. [Google Scholar] [CrossRef]
  45. Kwitny, J. The great transportation conspiracy. Harper’s Magazine, February 1981, p. 262. Available online: https://nissenbaum.tech.cornell.edu/papers/Kwinty.pdf (accessed on 22 August 2024).
  46. Schaeffer, K.H.; Sclar, E. Access for All: Transportation and Urban Growth; Penguin Books; Columbia University Press: New York, NY, USA, 1975. [Google Scholar]
  47. Rupprecht Consult. (Ed.) Guidelines for Developing and Implementing a Sustainable Urban Mobility Plan, 2nd ed.; 2019. Available online: https://urban-mobility-observatory.transport.ec.europa.eu/system/files/2023-09/sump_guidelines_2019_second%20edition.pdf (accessed on 22 August 2024).
  48. Fielbaum, A.; Jara-Diaz, S.; Gschwender, A. Beyond the Mohring effect: Scale economies induced by transit lines structures design. Econ. Transp. 2020, 22, 100163. [Google Scholar] [CrossRef]
  49. Anderson, M.L. Subways, Strikes, and Slowdowns: The Impacts of Public Transit on Traffic Congestion. Am. Econ. Rev. 2014, 104, 2763–2796. [Google Scholar] [CrossRef]
  50. Nguyen-Phuoc, D.Q.; Young, W.; Currie, G.; De Gruyte, C. Traffic congestion relief associated with public transport: State-of-the-art. Public Transp. 2020, 12, 455–481. [Google Scholar] [CrossRef]
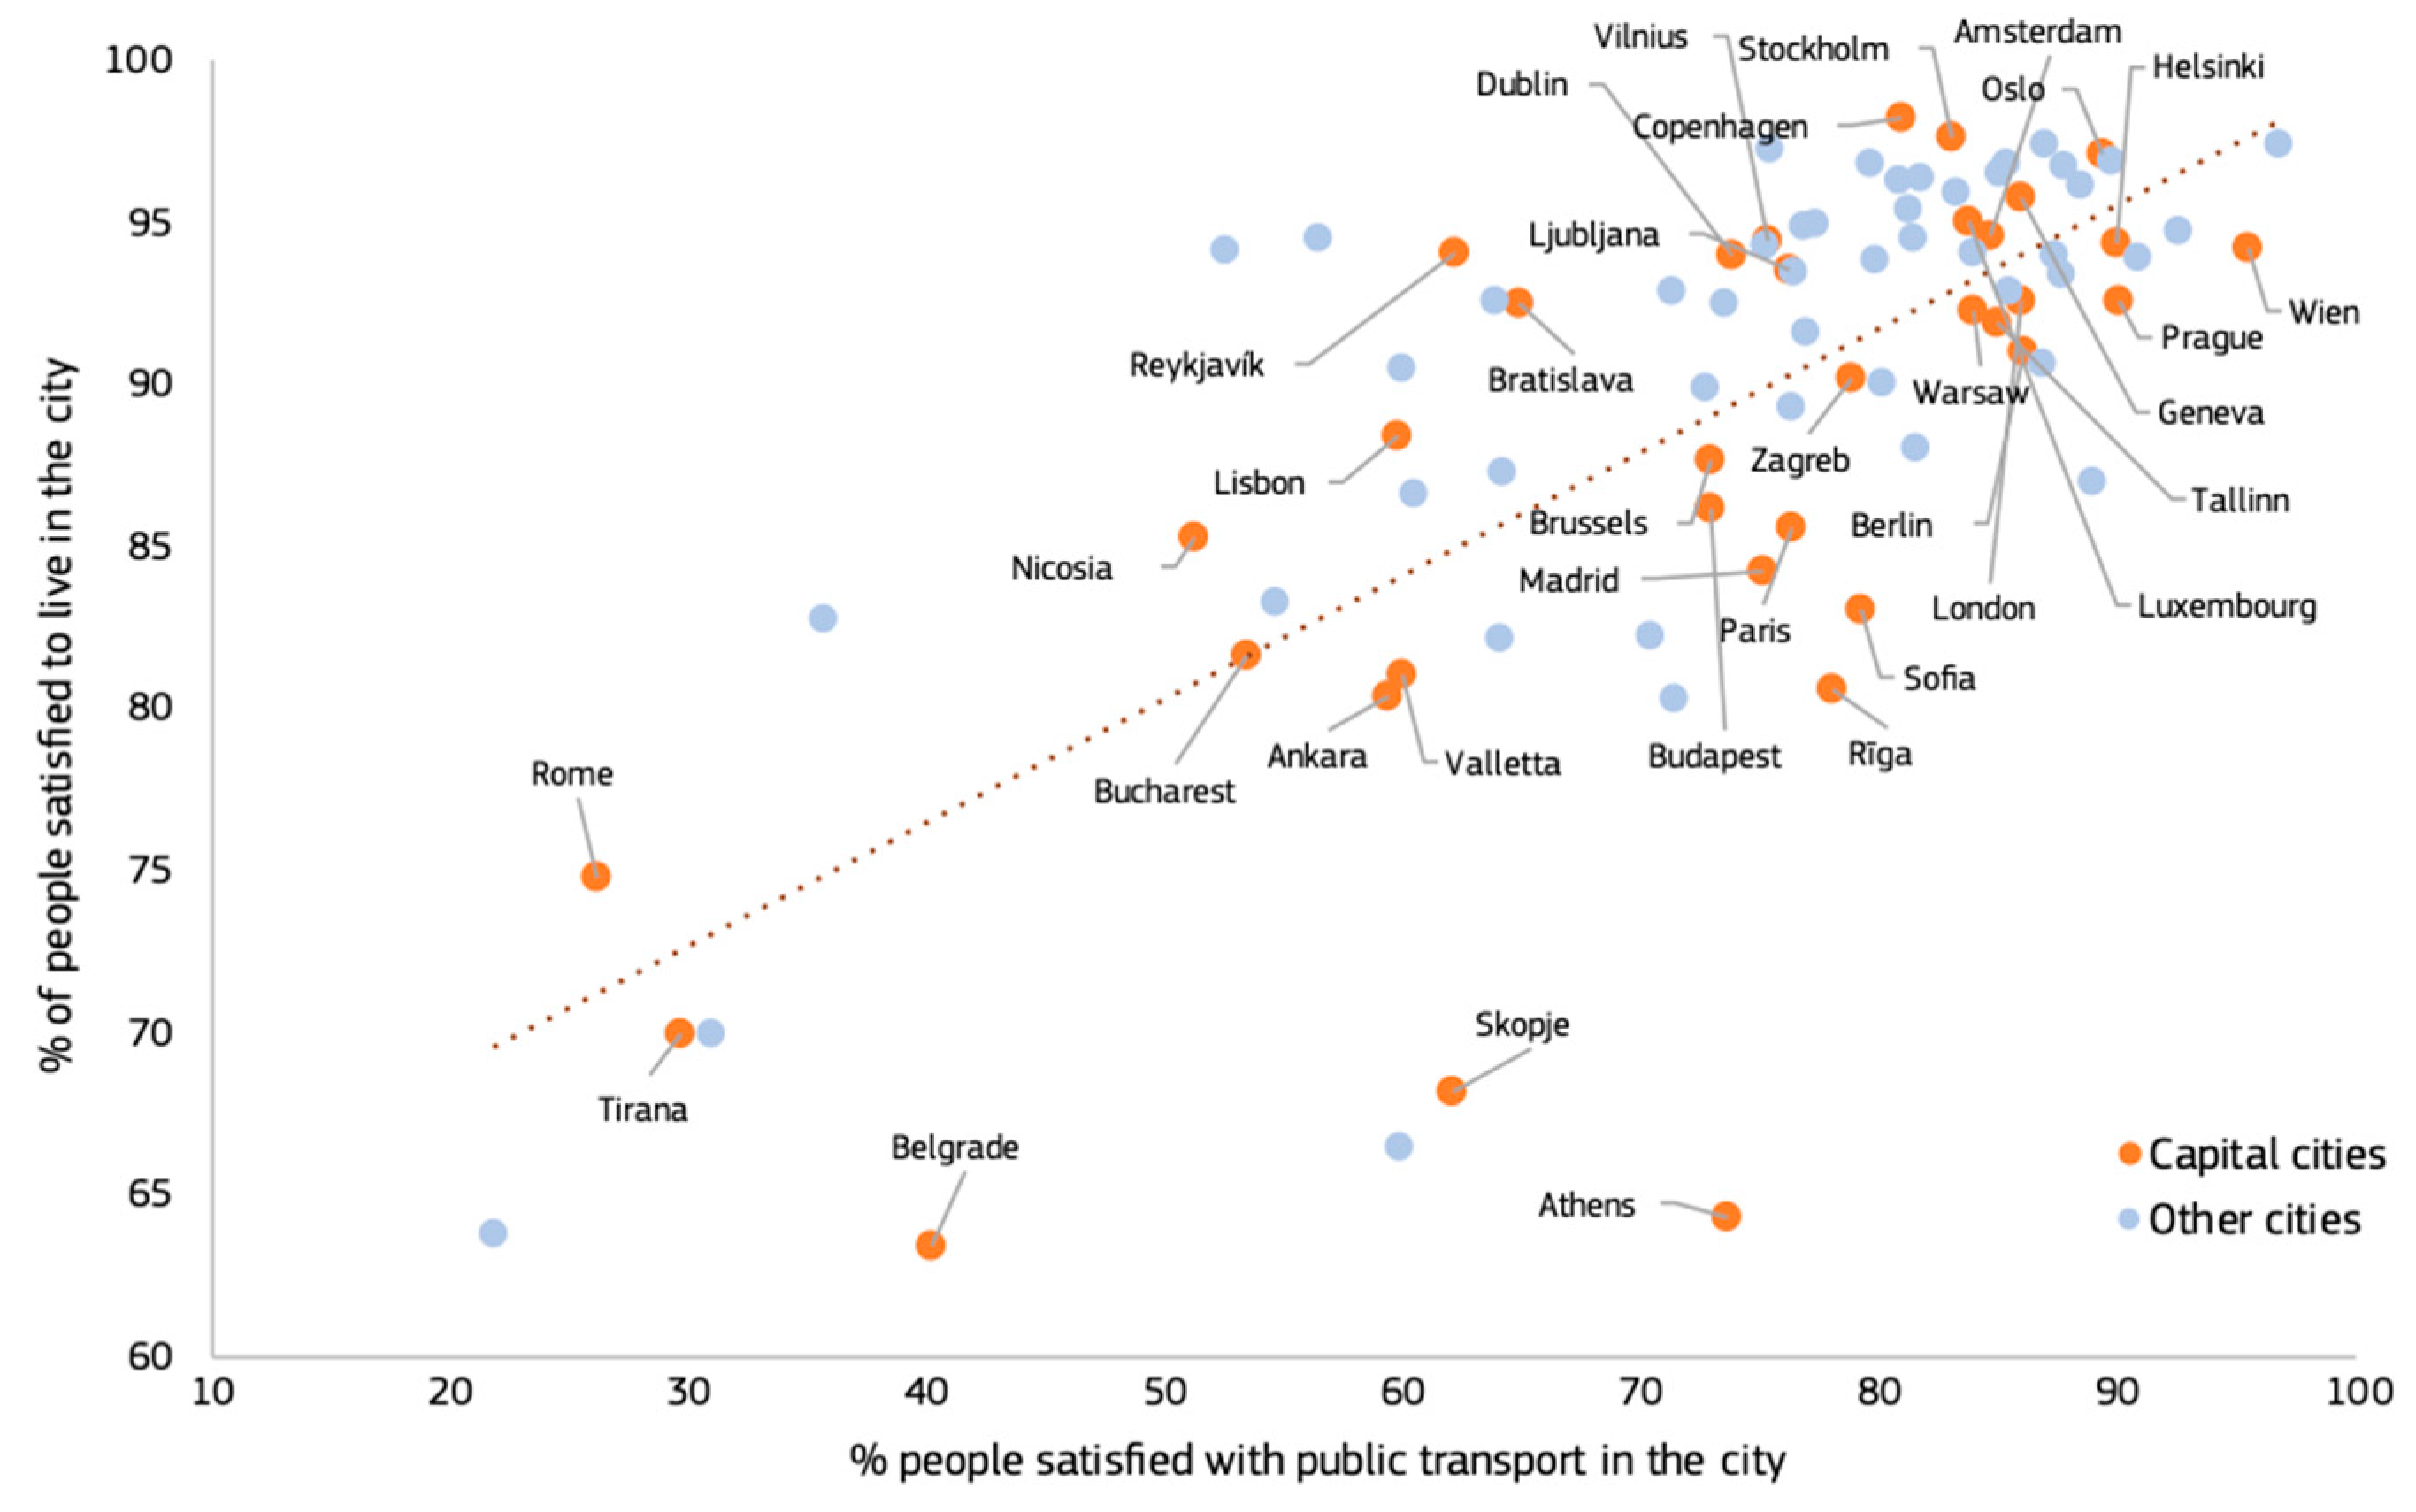
  51. European Commission. Report on the Quality of Life in European Cities; European Commission: Brussels, Belgium, 2023.
  52. EPOMM. Managing Mobility for a Better Future. Available online: http://www.epomm.eu (accessed on 12 October 2018).
  53. European Court of Auditors Special Report 06. Sustainable Urban Mobility in the EU: No Substantial Improvement is Possible without Member States’ Commitment; European Court of Auditors: Luxembourg, 2020.
  54. Cervero, R.; Guerra, E.; Al, S. Beyond Mobility-Planning Cities for People and Places; Island Press: Washington, DC, USA, 2017. [Google Scholar]
  55. Bertolini, L. The next 30 years: Planning cities beyond mobility? Eur. Plan. Stud. 2023, 31, 2354–2367. [Google Scholar] [CrossRef]
  56. Kurland, E. Thinking Beyond 15 Minutes: A New Perspective on Space, Time and Travel. 2022. TransportXtra. Available online: https://www.transportxtra.com/publications/evolution/news/72383/thinking-beyond-15-minutes-a-new-perspective-on-space-time-and-travel/ (accessed on 22 August 2024).
  57. Robertson-Wilson, J.; Giles-Corti, B. Walkability, Neighbourhood Design and Obesity. In Obesogenic Environments: Complexities, Perceptions and Objective Measures; Townshend, M.T., Alvanides, S., Lake, A., Eds.; Wiley-Blackwell: Hoboken, NJ, USA, 2009. [Google Scholar]
  58. Mattioli, G.; Roberts, C.; Steinberger, J.K.; Brown, A. The political economy of car dependence: A systems of provision approach. Energy Res. Soc. Sci. 2020, 66, 101486. [Google Scholar] [CrossRef]
  59. Bibri, S.E. Backcasting in futures studies: A synthesized scholarly and planning approach to strategic smart sustainable city development. Eur. J. Futures Res. 2018, 6, 13. [Google Scholar] [CrossRef]
  60. Sony CLS. The 15 Minutes City. Available online: https://csl.sony.it/project/the-15-minutes-city/ (accessed on 22 August 2024).
  61. Abbiasov, T.; Heine, C.; Glaeser, E.L.; Ratti, C.; Sabouri, S.; Salazar, M.A.; Santi, P. The 15-Minute City Quantified Using Mobility Data (December 2022). In NBER Working Paper No.w30752; National Bureau of Economic Research: Cambridge, MA, USA, 2022. [Google Scholar]
  62. Beim, M.; Haague, M. Freiburg’s Way to Sustainability: The Role of Integrated Urban and Transport Planning; Real Corp.: Vienna, Austria, 2010. [Google Scholar]
  63. Cairns, S.; Atkins, S.; Goodwin, P. Disappearing traffic? The story so far. In Proceedings of the Institution of Civil Engineers: Municipal Engineer; ICE Publishing: London, UK, 2002; Volume 151, pp. 13–22. [Google Scholar]
  64. Frey, H.; Leth, U.; Mayerthaler, A.; Brezina, T. Predicted congestions never occur. On the gap between transport modelling and human behaviour. Transp. Probl. 2011, 6, 73–86. [Google Scholar]
  65. Ghodmare, S.D.; Bajaj, P.; Khode, B.V. Comparative Analysis of BRTS and MRTS: An Approach Required for Selection of System. In Smart Technologies for Energy, Environment and Sustainable Development; Lecture Notes on Multidisciplinary Industrial, Engineering; Kolhe, M., Labhasetwar, P., Suryawanshi, H., Eds.; Springer: Singapore, 2019. [Google Scholar]
  66. Pojani, D.; Stead, D. Past, present and future of transit-oriented development in three European Capital City-Regions. Adv. Transp. Policy Plan. 2018, 1, 93–118. [Google Scholar]
  67. Rye, T.; Lyons, G.; Svensson, T.; Lenferink, S.; Mladenovič, L.; Piras, F.; Witzell, J. Uncertainty and Triple Access Planning in European Sustainable Urban Mobility Plans: A long way to go yet? Transp. Plan. Technol. 2024, 29, 1–23. [Google Scholar] [CrossRef]
  68. Coroamă, V.C.; Mattern, F. Digital Rebound: Why Digitalization Will Not Redeem us our Environmental Sins. In Proceedings of the 6th International Conference on ICT for Sustainability (ICT4S), Lappeenranta, Finland, 10–14 June 2019. [Google Scholar]
  69. Caldarola, B.; Sorrell, S. Do teleworkers travel less? Evidence from the English National Travel Survey. Transp. Res. Part A 2022, 159, 282–303. [Google Scholar] [CrossRef]
  70. Gossart, C. Rebound Effects and ICT: A Review of the Literature. In ICT Innovations for Sustainability; Advances in Intelligent Systems and, Computing; Hilty, L., Aebischer, B., Eds.; Springer: Cham, Switzerland, 2015; Volume 310. [Google Scholar] [CrossRef]
  71. Marchetti, C. Anthropological invariants in travel behavior. Technol. Forecast. Soc. Change 1994, 47, 75–88. [Google Scholar] [CrossRef]
  72. Zhu, P. Are Telecommuting and Personal Travel Complements or Substitutes? Ann. Reg. Sci. 2012, 48, 619–639. [Google Scholar] [CrossRef]
  73. Laghaei, J.; Faghri, A.; Li, M. Impacts of home shopping on vehicle operations and greenhouse gas emissions: Multi-year regional study. Int. J. Sustain. Dev. World Ecol. 2016, 23, 381–391. [Google Scholar] [CrossRef]
  74. Chakrabarti, S. Does telecommuting promote sustainable travel and physical activity? J. Transp. Health 2018, 9, 19–33. [Google Scholar] [CrossRef]
  75. Lachapelle, U.; Tanguay, G.; Neumark-Gaudet, L. Telecommuting and sustainable travel: Reduction of overall travel time, increases in non-motorised travel and con-gestion relief? Urban Stud. 2018, 55, 2226–2244. [Google Scholar] [CrossRef]
  76. de Abreu e Silva, J.; Melo, P.C. Does home-based telework reduce household total travel? A path analysis using single and two worker British households. J. Transp. Geogr. 2018, 73, 148–162. [Google Scholar] [CrossRef]
  77. Cervero, R. The Transit Metropolis: A Global Inquiry; Island Press: Washington, DC, USA, 1998. [Google Scholar]
Figure 1. Visions and patterns of urban transport. Source: ref. [17].
Futuretransp 04 00045 g001
Figure 2. The evolutionary mismatch of the automobile.
Futuretransp 04 00045 g002
Figure 3. Model structure for the automobility city.
Futuretransp 04 00045 g003
Figure 4. An idealized edge city (Bing image creator).
Futuretransp 04 00045 g004
Figure 5. The modern vision of an automotive city (Bing image creator).
Futuretransp 04 00045 g005
Figure 6. Health impacts of fossil-based automobility as percentage of global annual deaths. Source: based on ref. [27].
Futuretransp 04 00045 g006
Figure 7. Public health problems as a consequence of mismatch. Source: Inspired by ref. [31].
Futuretransp 04 00045 g007
Figure 8. Let us be compassionate about people’s natural instincts.
Futuretransp 04 00045 g008
Figure 9. Fuel use per person vs. average speed by private car v1 and public transport v2. Source: [38].
Futuretransp 04 00045 g009
Figure 10. The average speed of cars, v1 and collective transport, v2 for metropolitan areas in the US and EU. Source: Data from Newman and Kenworthy’s source book [41].
Futuretransp 04 00045 g010
Figure 11. Model structure for a multimodal city.
Futuretransp 04 00045 g011
Figure 12. The Downs/Thomson paradox. Source: ref. [34].
Futuretransp 04 00045 g012
Figure 13. Door-to-door speed variation towards the center of Rome in private and public transport in the sector served by metro line A and in the other sectors.
Futuretransp 04 00045 g013
Figure 14. People satisfied with public transport in the city vs. people using public transport in the city. Source: ref. [51].
Futuretransp 04 00045 g014
Figure 15. Percentage of people satisfied with public transport in the city vs. people satisfied with living in the city. Source: ref. [51].
Futuretransp 04 00045 g015
Figure 16. Modal shares in selected European capitals in 2018. Source: ref. [52].
Futuretransp 04 00045 g016
Figure 17. Modal share of private vehicles in 13 cities between 2007 and 2017. Source: ECA [53].
Futuretransp 04 00045 g017
Figure 18. Modal share of private vehicles in 11 cities and metropolitan areas surrounding the cities. Source: ECA [53].
Futuretransp 04 00045 g018
Figure 19. Motorization rate (passenger cars per 1000 inhabitants) in the EU 27 and in selected countries. Source: Eurostat.
Futuretransp 04 00045 g019
Figure 20. The steps of the new urban and transport paradigm.
Futuretransp 04 00045 g020
Figure 21. The hierarchy of urban attractors and diffused TODs.
Futuretransp 04 00045 g021
Figure 22. Accessibility on foot to daily amenities in Rome and Paris. Source: Adapted with permission from ©2023 Sony Lab, Rome, Italy [60].
Futuretransp 04 00045 g022
Figure 23. A circle for sustainable transport.
Futuretransp 04 00045 g023
Table 1. Travel distance per person per day by main travel mode for urban mobility on all days (%). Source: Eurostat data from Member States pilot and national surveys.
ModesBelgiumDenmarkGermanyGreeceItalyNlAustriaPolandPortugalRomania
Car as driver54.453.858.044.663.749.650.648.257.330.4
Car as passenger16.311.311.815.410.612.613.510.612.926.4
Taxi as passenger0.10.30.21.30.20.01.10.00.42.5
Van/lorry0.08.12.20.80.10.00.00.00.00.0
Motorcycle and moped0.80.90.67.02.82.01.00.61.30.1
Bus and coach 4.34.12.311.57.23.74.025.910.827.6
Urban rail2.84.45.412.82.50.013.02.94.01.9
Train8.65.58.60.13.87.59.02.95.13.9
Cycling6.67.55.50.51.916.03.44.70.50.3
Walking3.84.14.05.86.85.13.91.85.86.9
Table 2. Main potential activities using digital connectivity.
Smart workingMany people can work remotely from their homes or other locations, instead of commuting to an office. Digital connectivity allows for communication, collaboration, and productivity without an office space.
Teleconferencing and virtual meetingsReplace in-person meetings with virtual ones using platforms like Zoom, Microsoft Teams, or Google Meet. Digital tools allow for real-time communication, screen sharing, and collaboration across distances.
Online learning and educationAccess from home to educational content, courses using e-learning platforms. They offer a wide range of subjects and allow for self-paced learning.
Digital entertainmentStream movies, TV shows, music, and games using online platforms like Netflix, Spotify, and YouTube, with a vast choice of entertainment.
Digital banking and financial servicesManage finances, pay bills, etc. Mobile banking apps and digital wallets for financial transactions, e.g., bill paying, payments for services, and transferring funds.
Telehealth and online consultationsTelemedicine platforms with AI allow for remote diagnosis, prescriptions, and medical advice at a fraction of the present cost. Remote consultation of healthcare professionals.
Online shopping and e-commerceE-commerce platforms, such as Amazon, eBay, and local online stores, make a wide range of products and services available to buy online.
Transport user experience improvementAccess to real-time information and tools via mobile apps makes transport more efficient, accessible, and sustainable. These can include traffic updates, navigation services, public transport schedules, and payments. Digital platforms integrate various modes (buses, trains, bikes, scooters, vehicle sharing, and riding) for seamless travel experiences, as in MaaS.
Table 3. The accessibility system of a polycentric and multi-timed city.
Accessibility SystemConnectivityMulti-Timed CityAttractors
Digital connectivity ICTDigitalNo timeWebsites, online
services, and stores
Active transport (AT)Walking, bicycle
micromobility
Spatial proximity, 0–15 minNeighborhood
centers
Motorized transportBus, demand-responsive sharedSector of a city, 15–30 minCenters
Metro, LRT, BRTCity ≤ 60 minMain center, airport, main train stations, museums, historic sites, university
TrainRegion ≥ 60 minCenters, suburbs, and rural-urban landscapes organized around diffused TODs
Table 4. List of daily amenities. Source: ref. [60].
Type of AmenitiesAmenities
Outside activitiesParks, walks, picnics
LearningSchools, universities
SuppliesSupermarkets, grocery stores
EatingRestaurants, bistros, cafes
MovingBus stations, train stations, taxis
Cultural activitiesMuseums, theatres, cinemas
Physical exerciseGyms, sport centers
ServicesOffices, banks, post offices, town halls
HealthcareHospitals, doctors, pharmacies
Disclaimer/Publisher’s Note: The statements, opinions and data contained in all publications are solely those of the individual author(s) and contributor(s) and not of MDPI and/or the editor(s). MDPI and/or the editor(s) disclaim responsibility for any injury to people or property resulting from any ideas, methods, instructions or products referred to in the content.

