
Trends in Autonomous Vehicle Performance: A Comprehensive Study of Disengagements and Mileage


Abstract
:1. Introduction
2. Literature Review
Correlation Analysis Methods
3. Materials and Methods
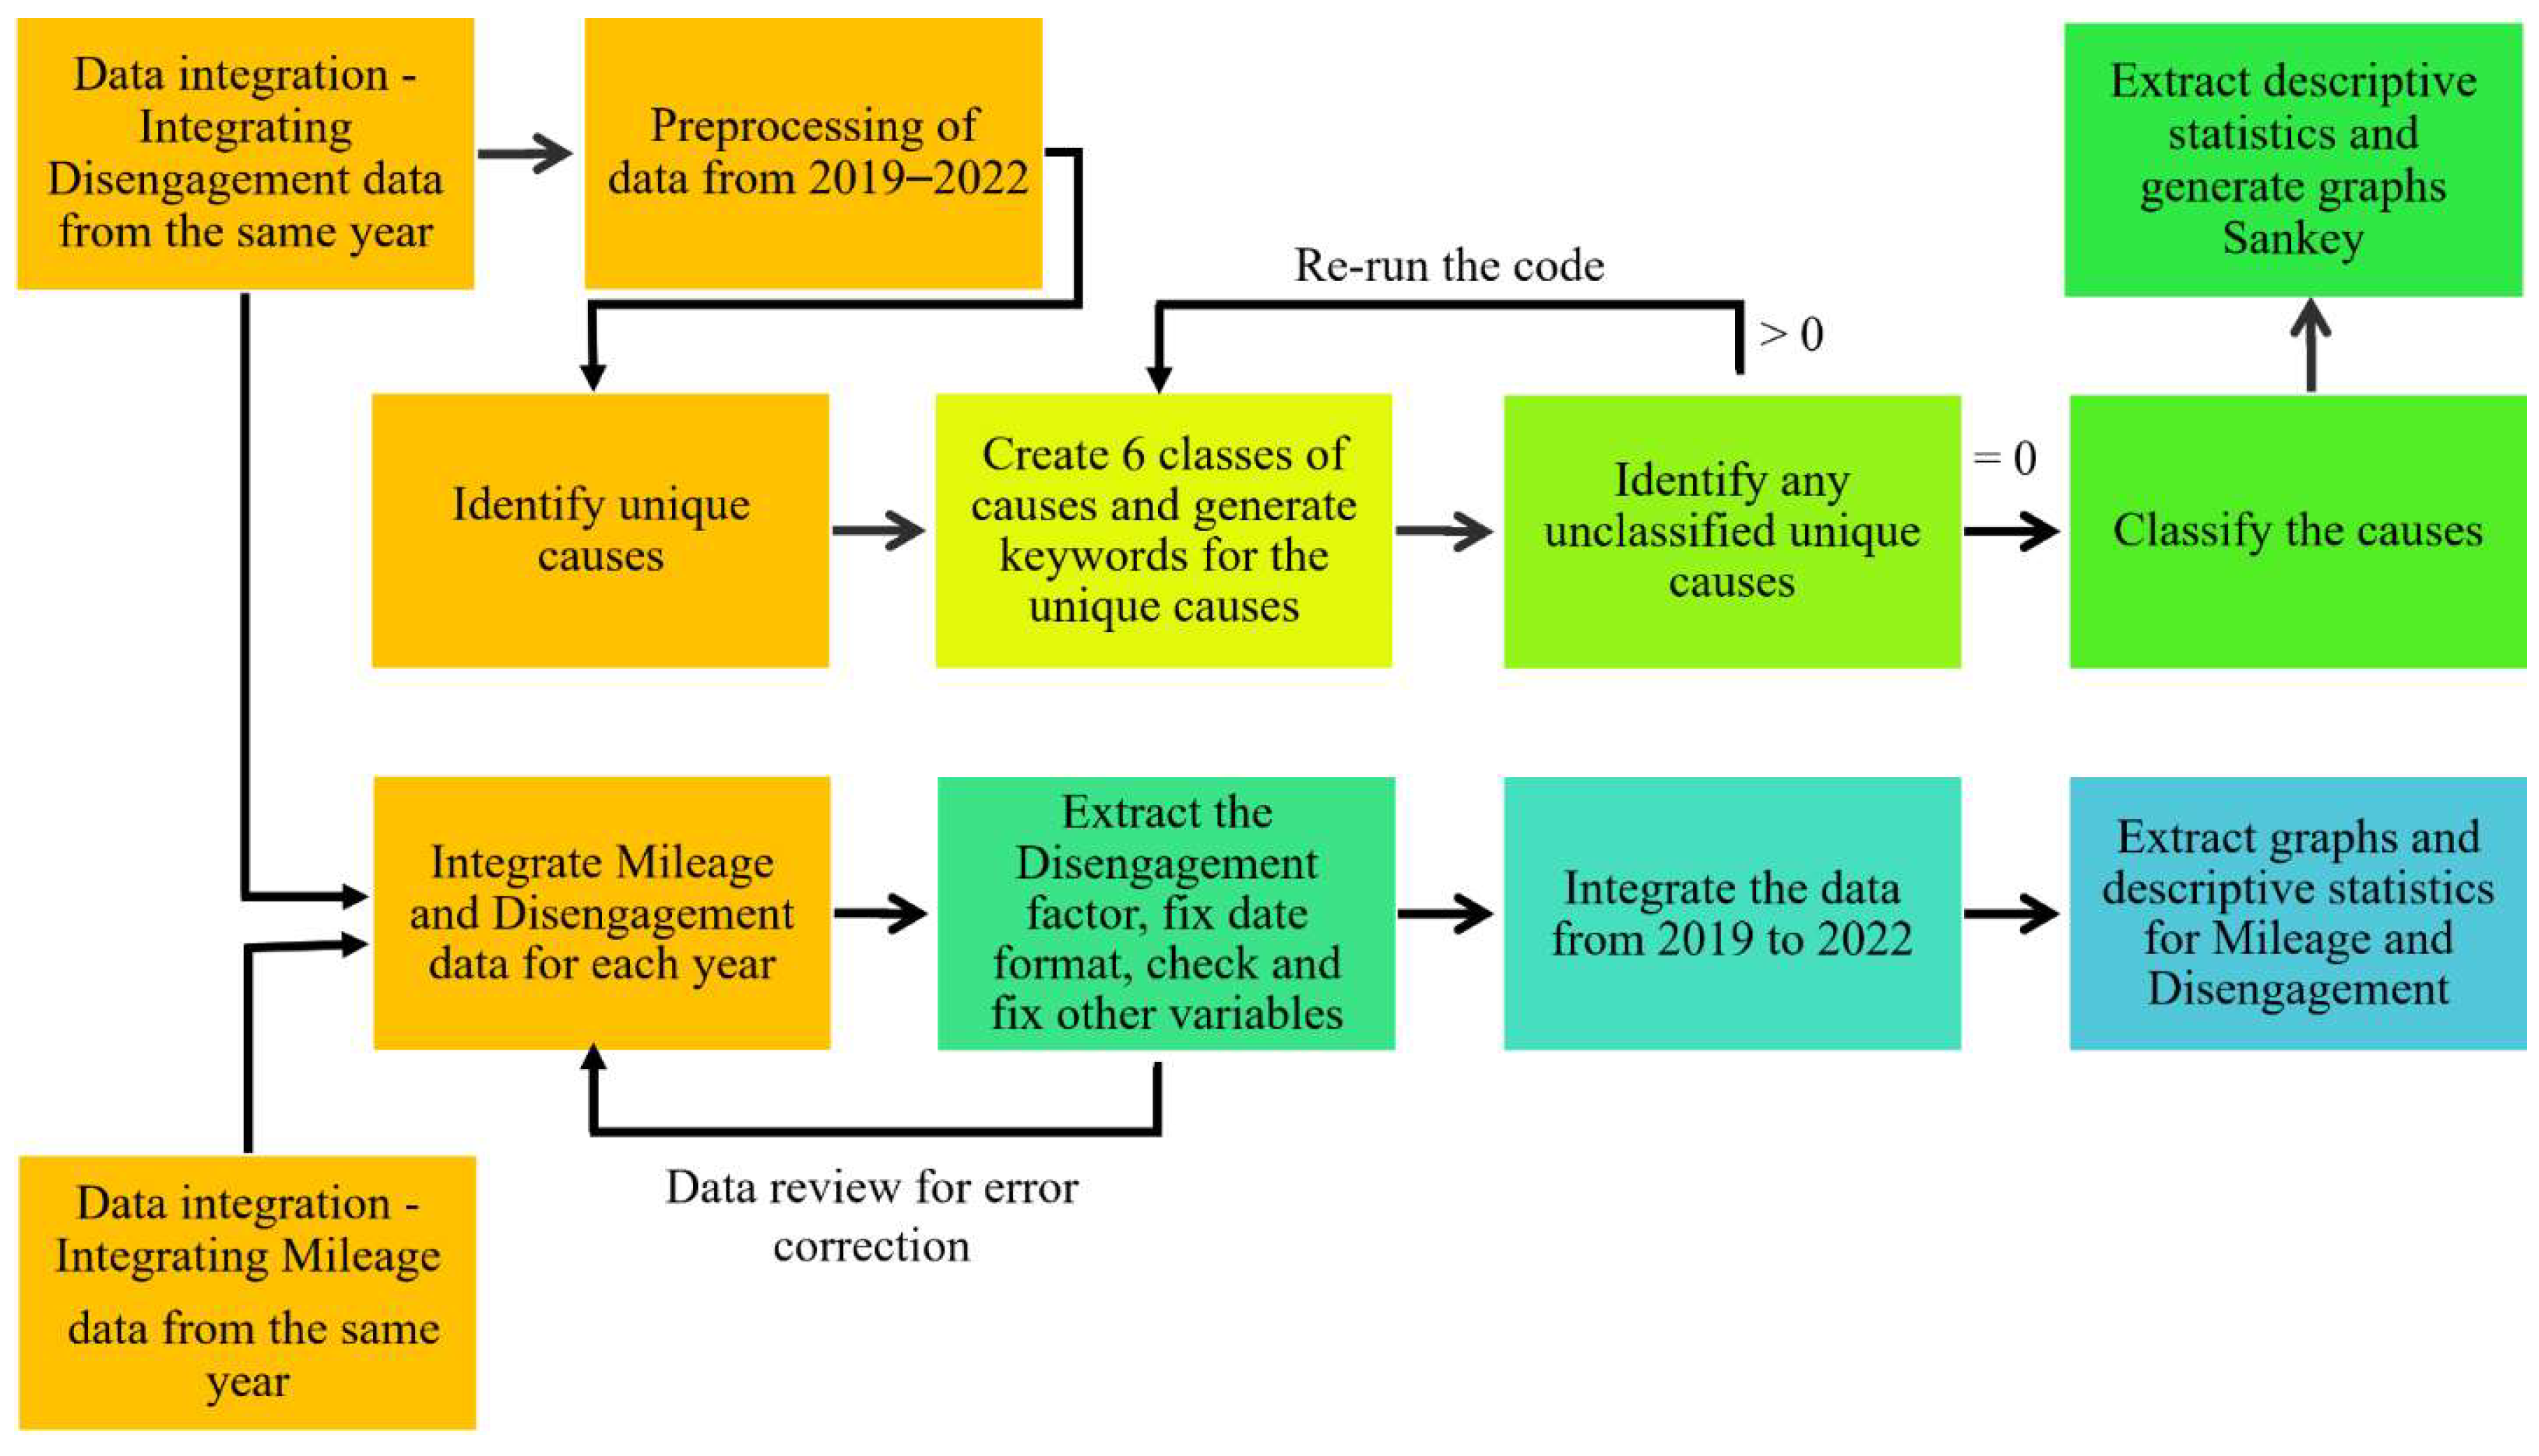
3.1. Conceptual Framework
3.2. Data Collection
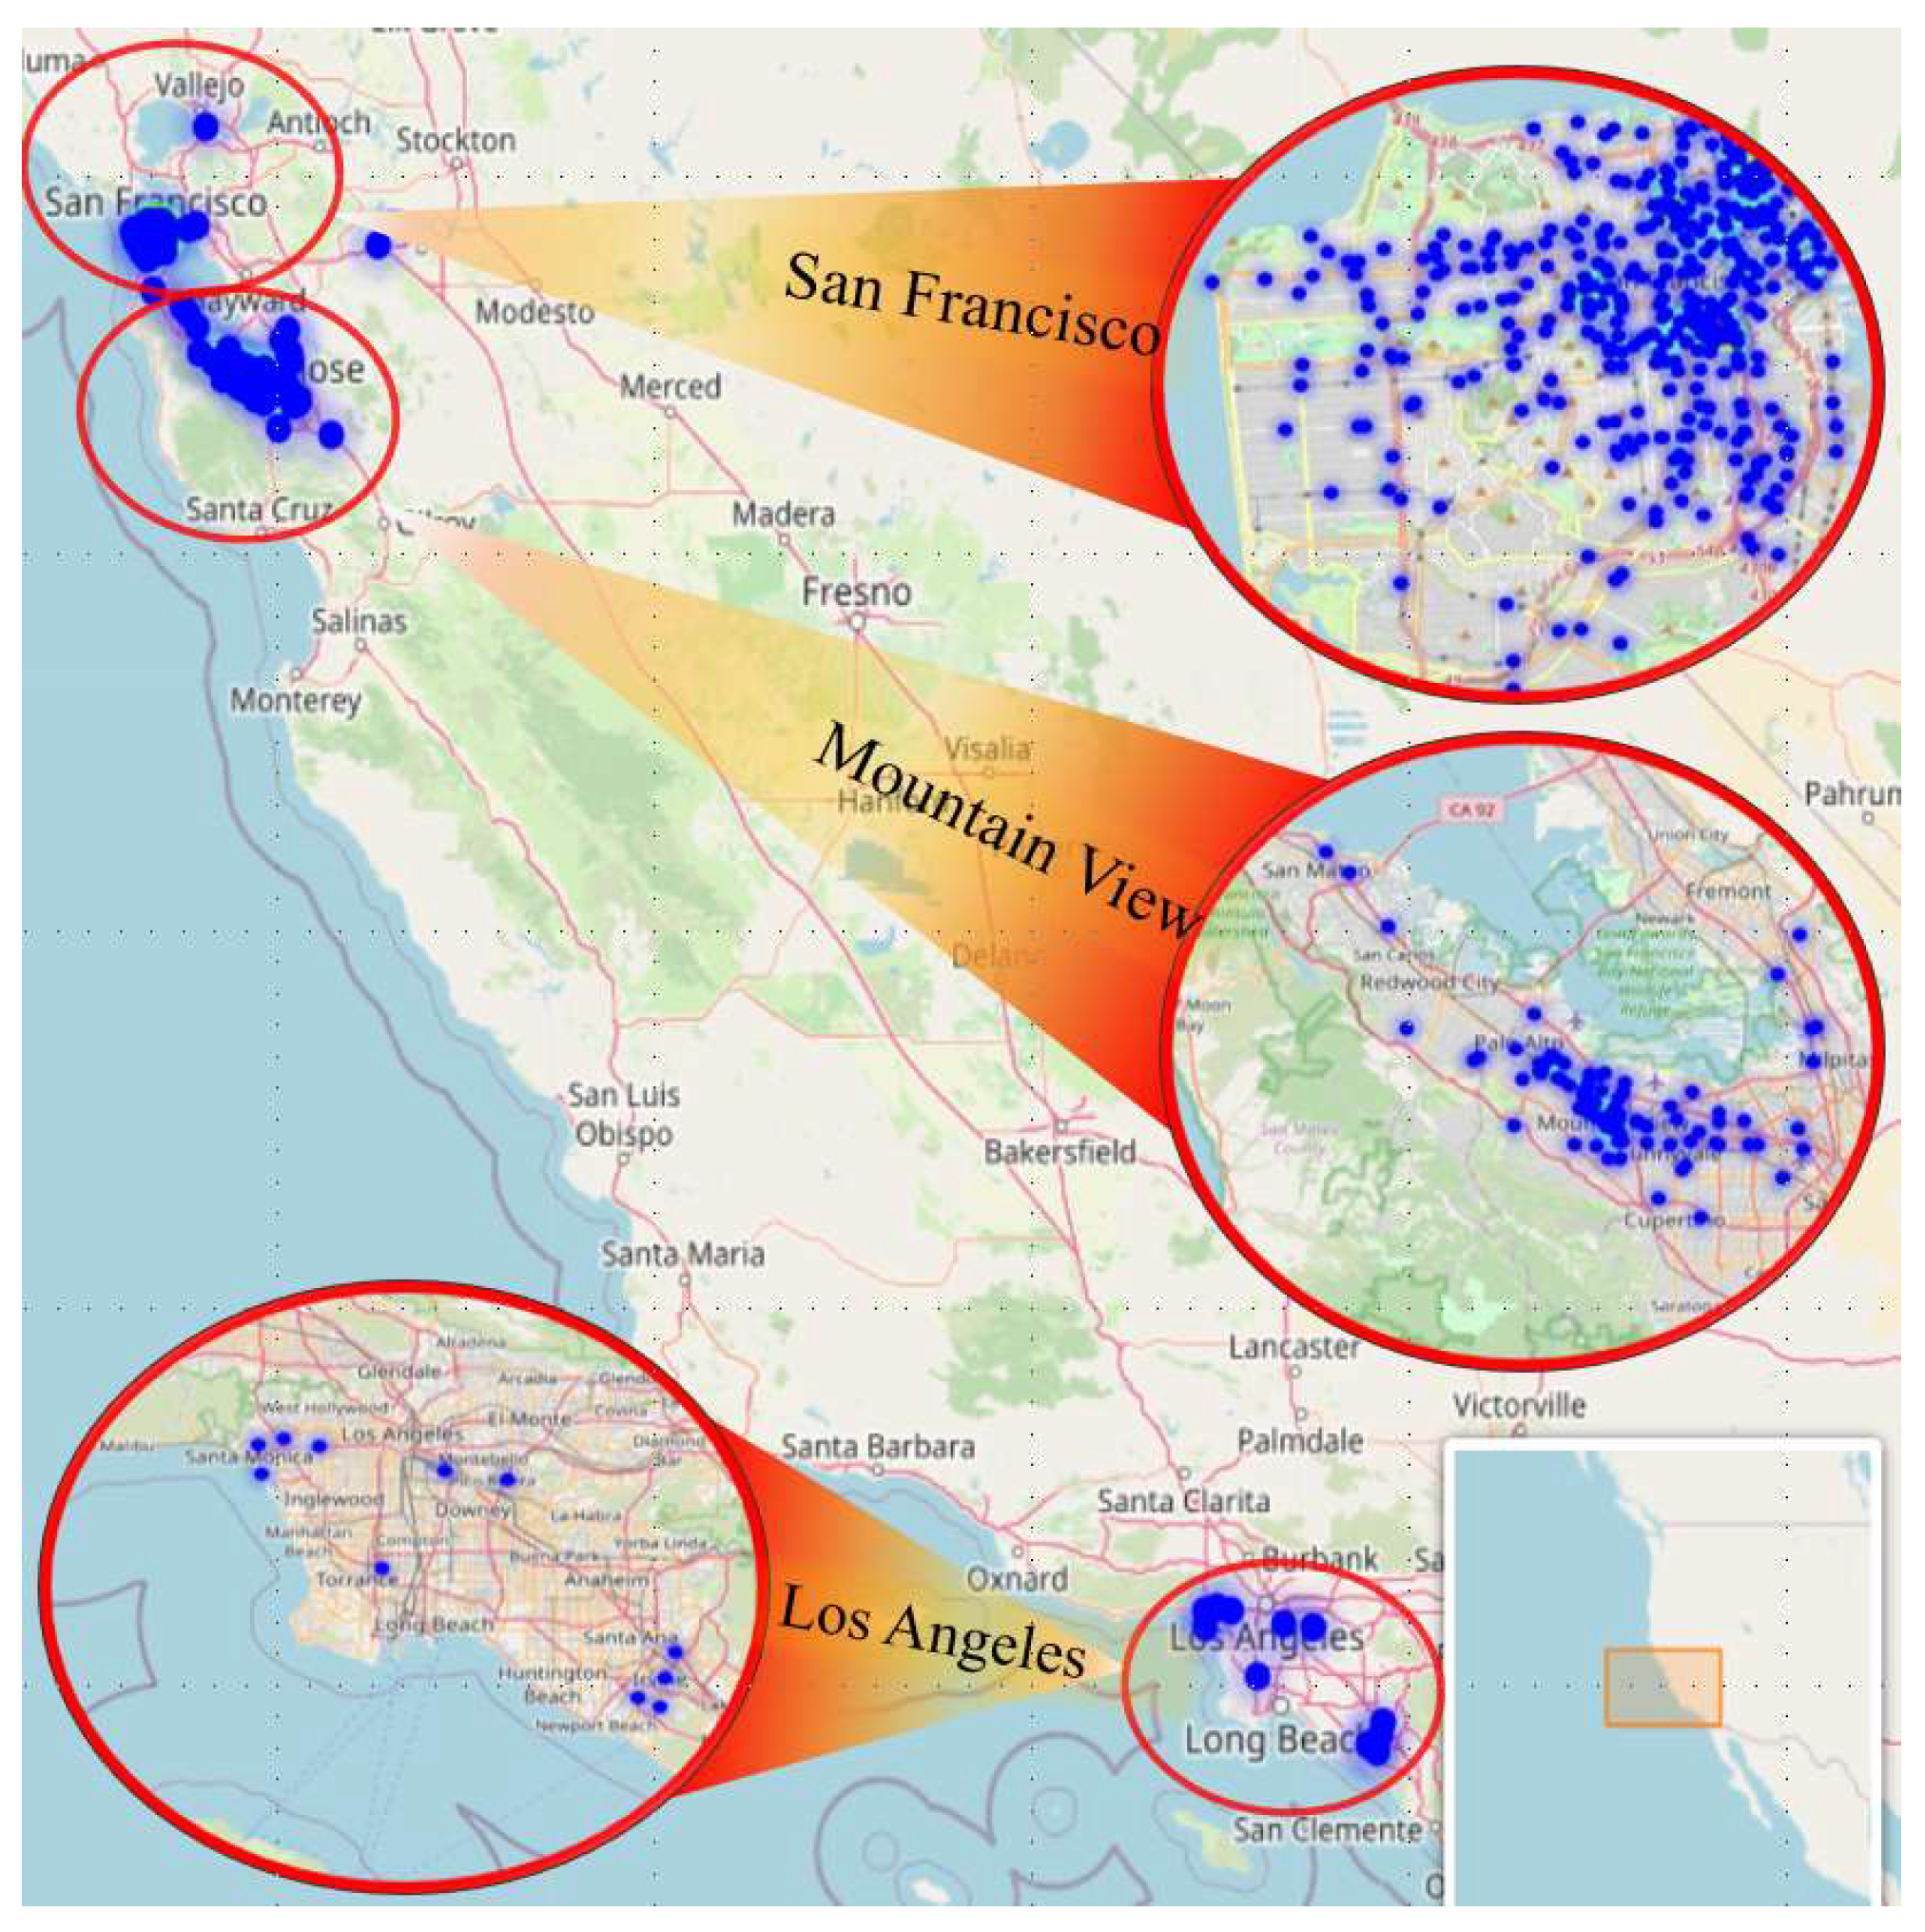
Study Area
3.3. Data Sources
3.3.1. Disengagement Data
3.3.2. Mileage Data
3.4. Data Analysis
3.4.1. Dependent Variable
3.4.2. Study Population and Sample
3.4.3. Data Preprocessing
Variable Classification
3.5. Statistical Algorithms
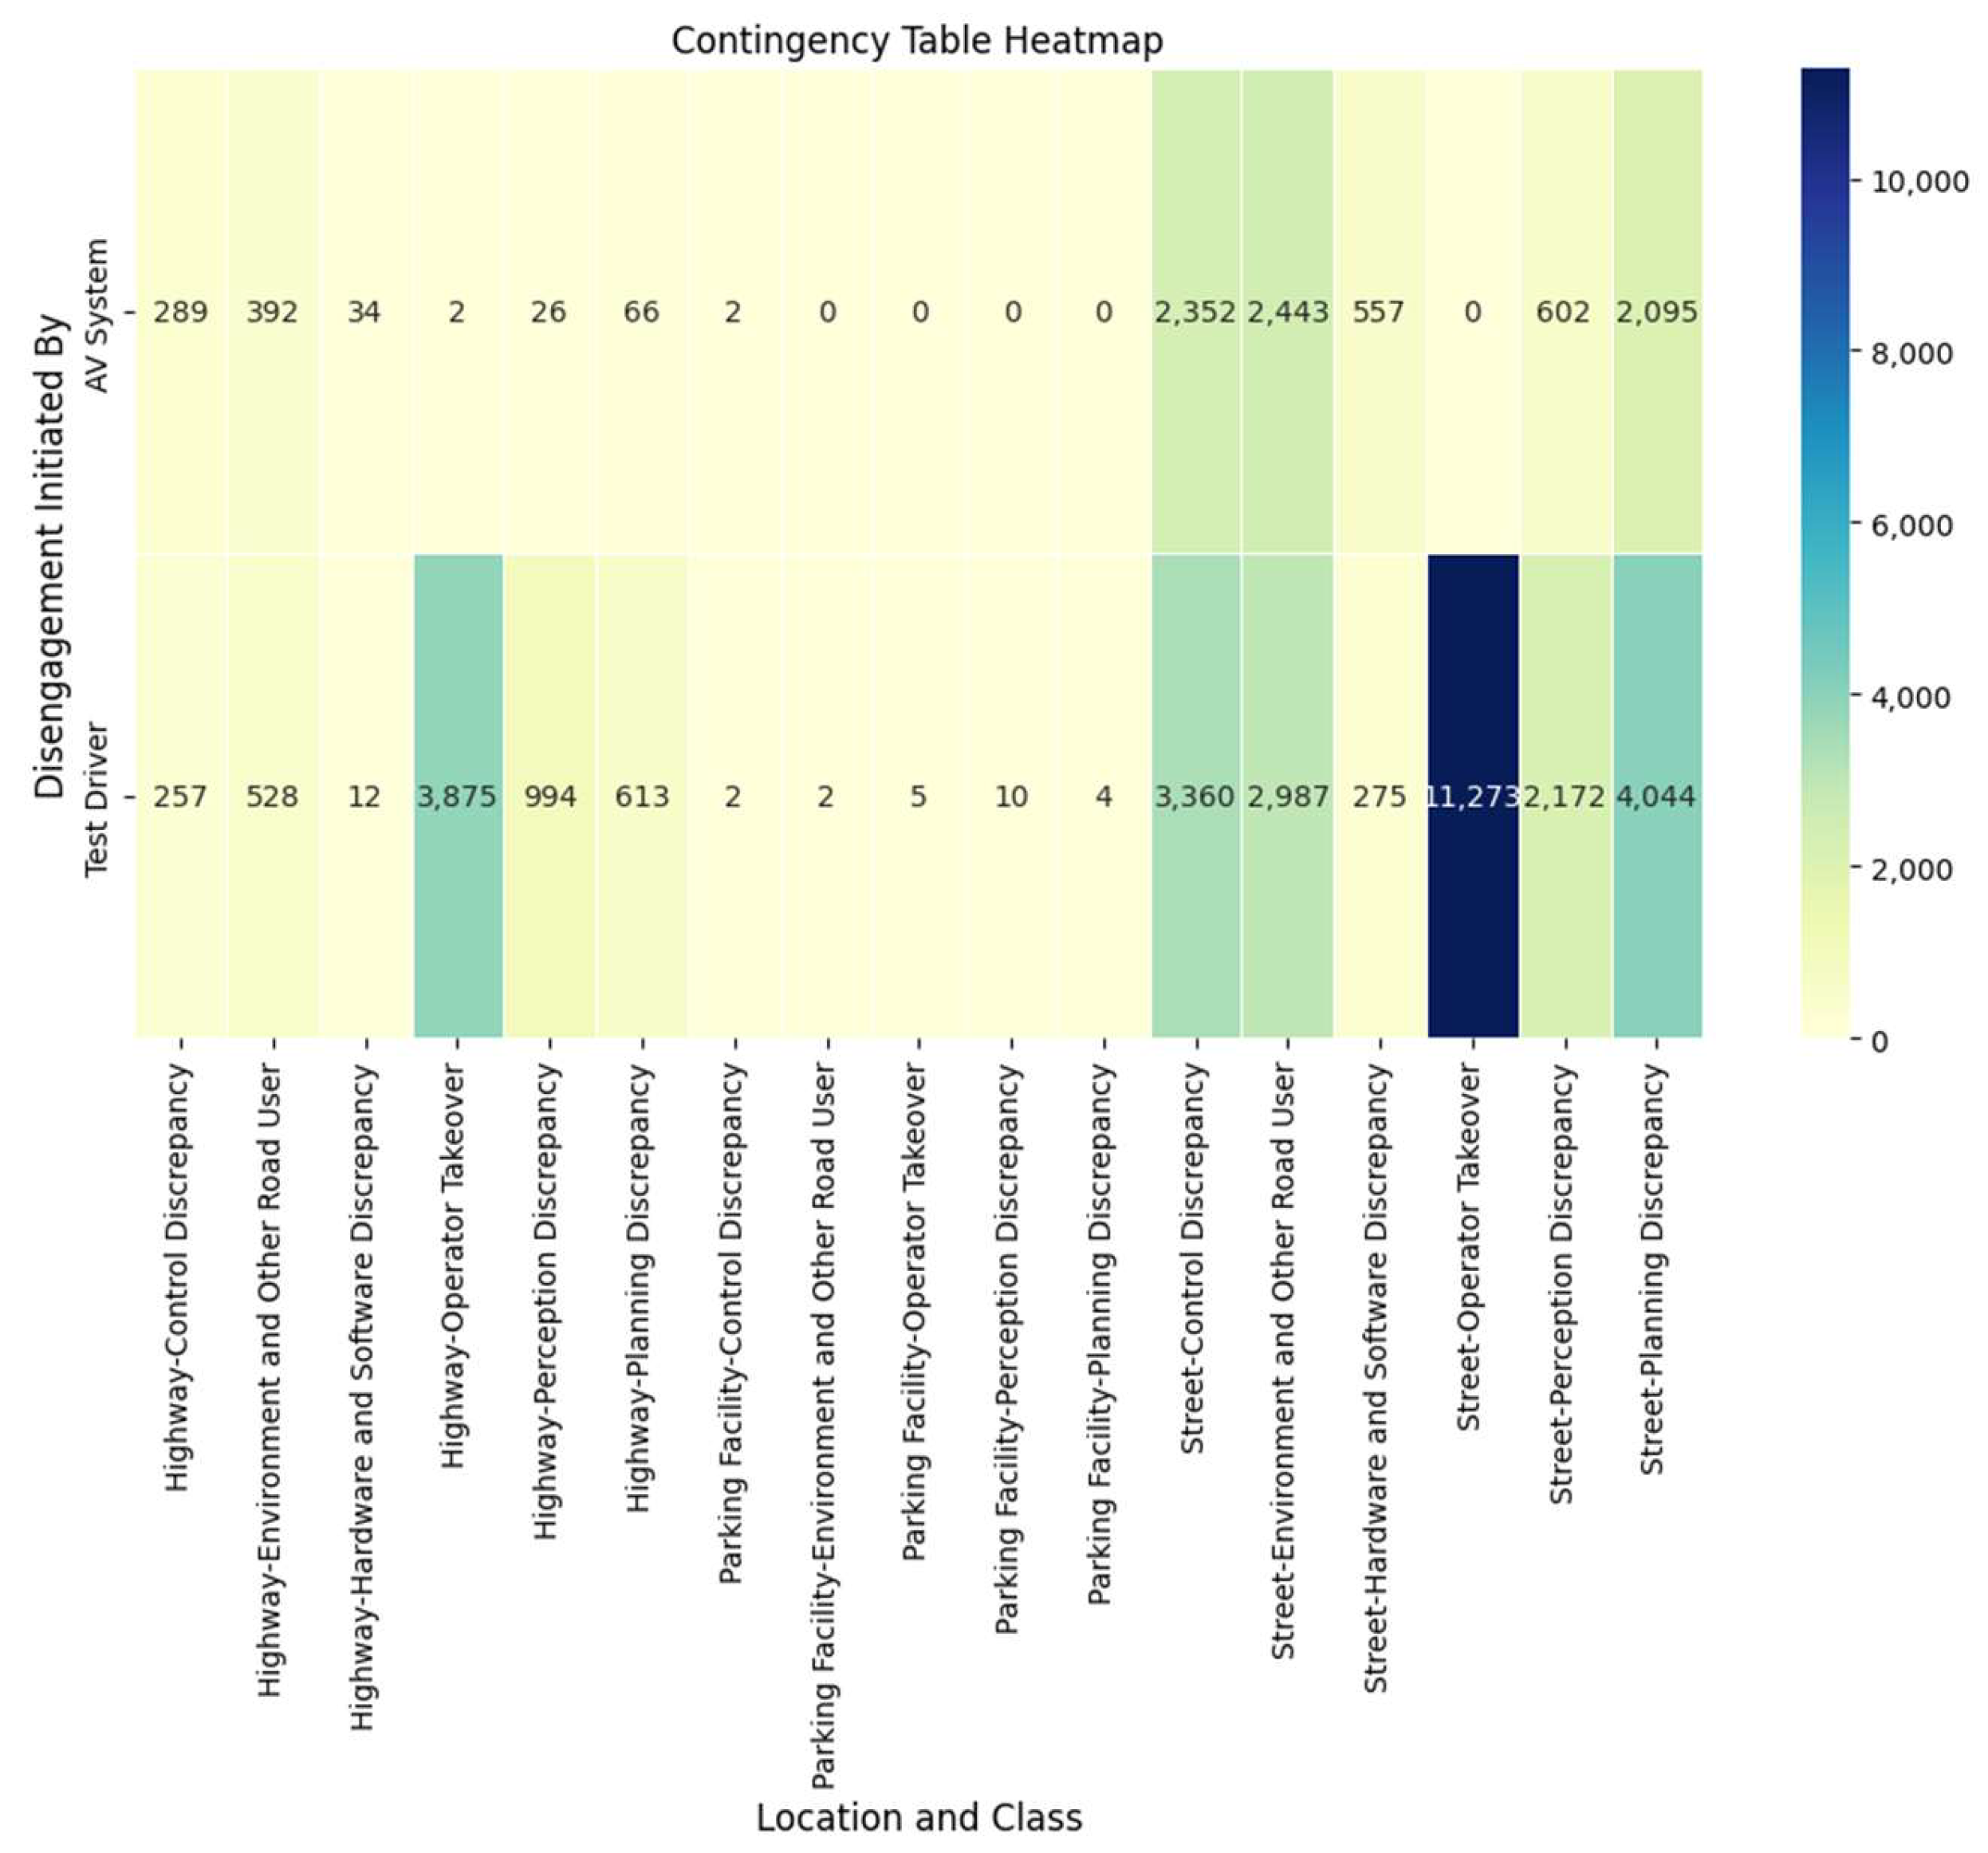
Contingency Table
4. Results
4.1. Accident Analysis
4.2. Disengagement Dataset
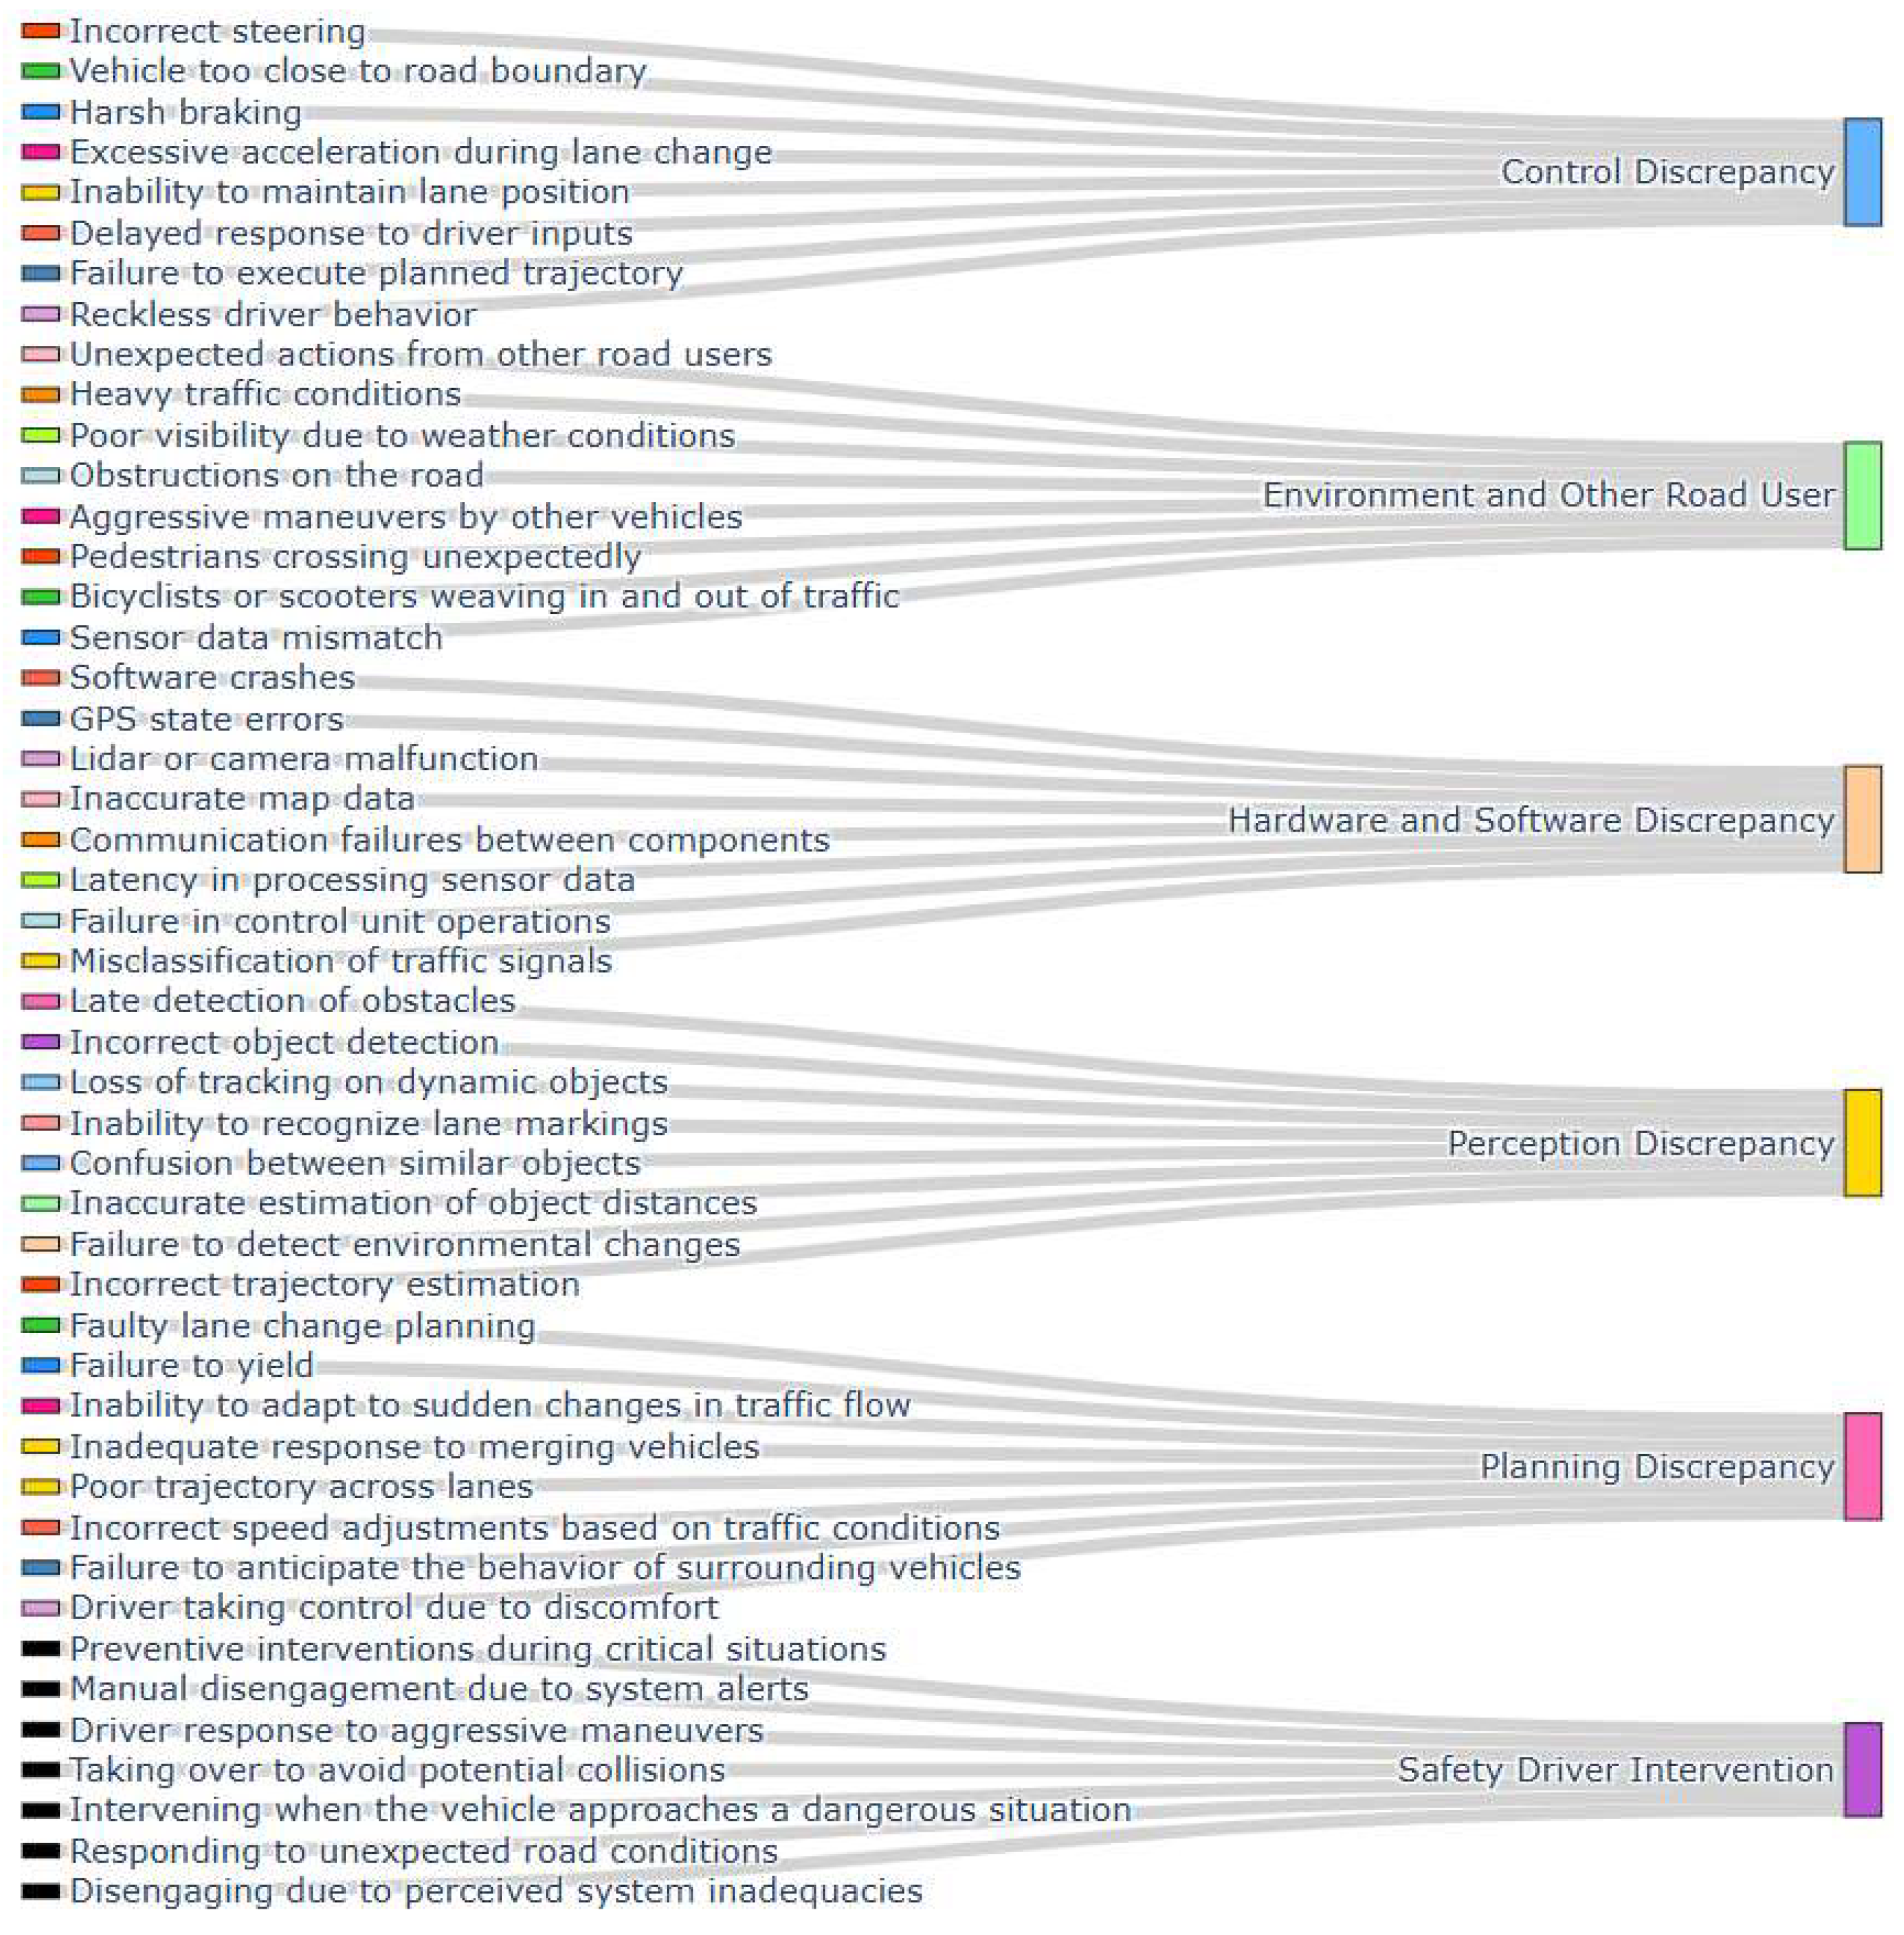
4.2.1. Classification of Disengagement Causes
- Operator Takeover
- Planning Discrepancy
- Control Discrepancy
- Perception Discrepancy
- Hardware and Software Discrepancy
- Environment and Other Road Users.
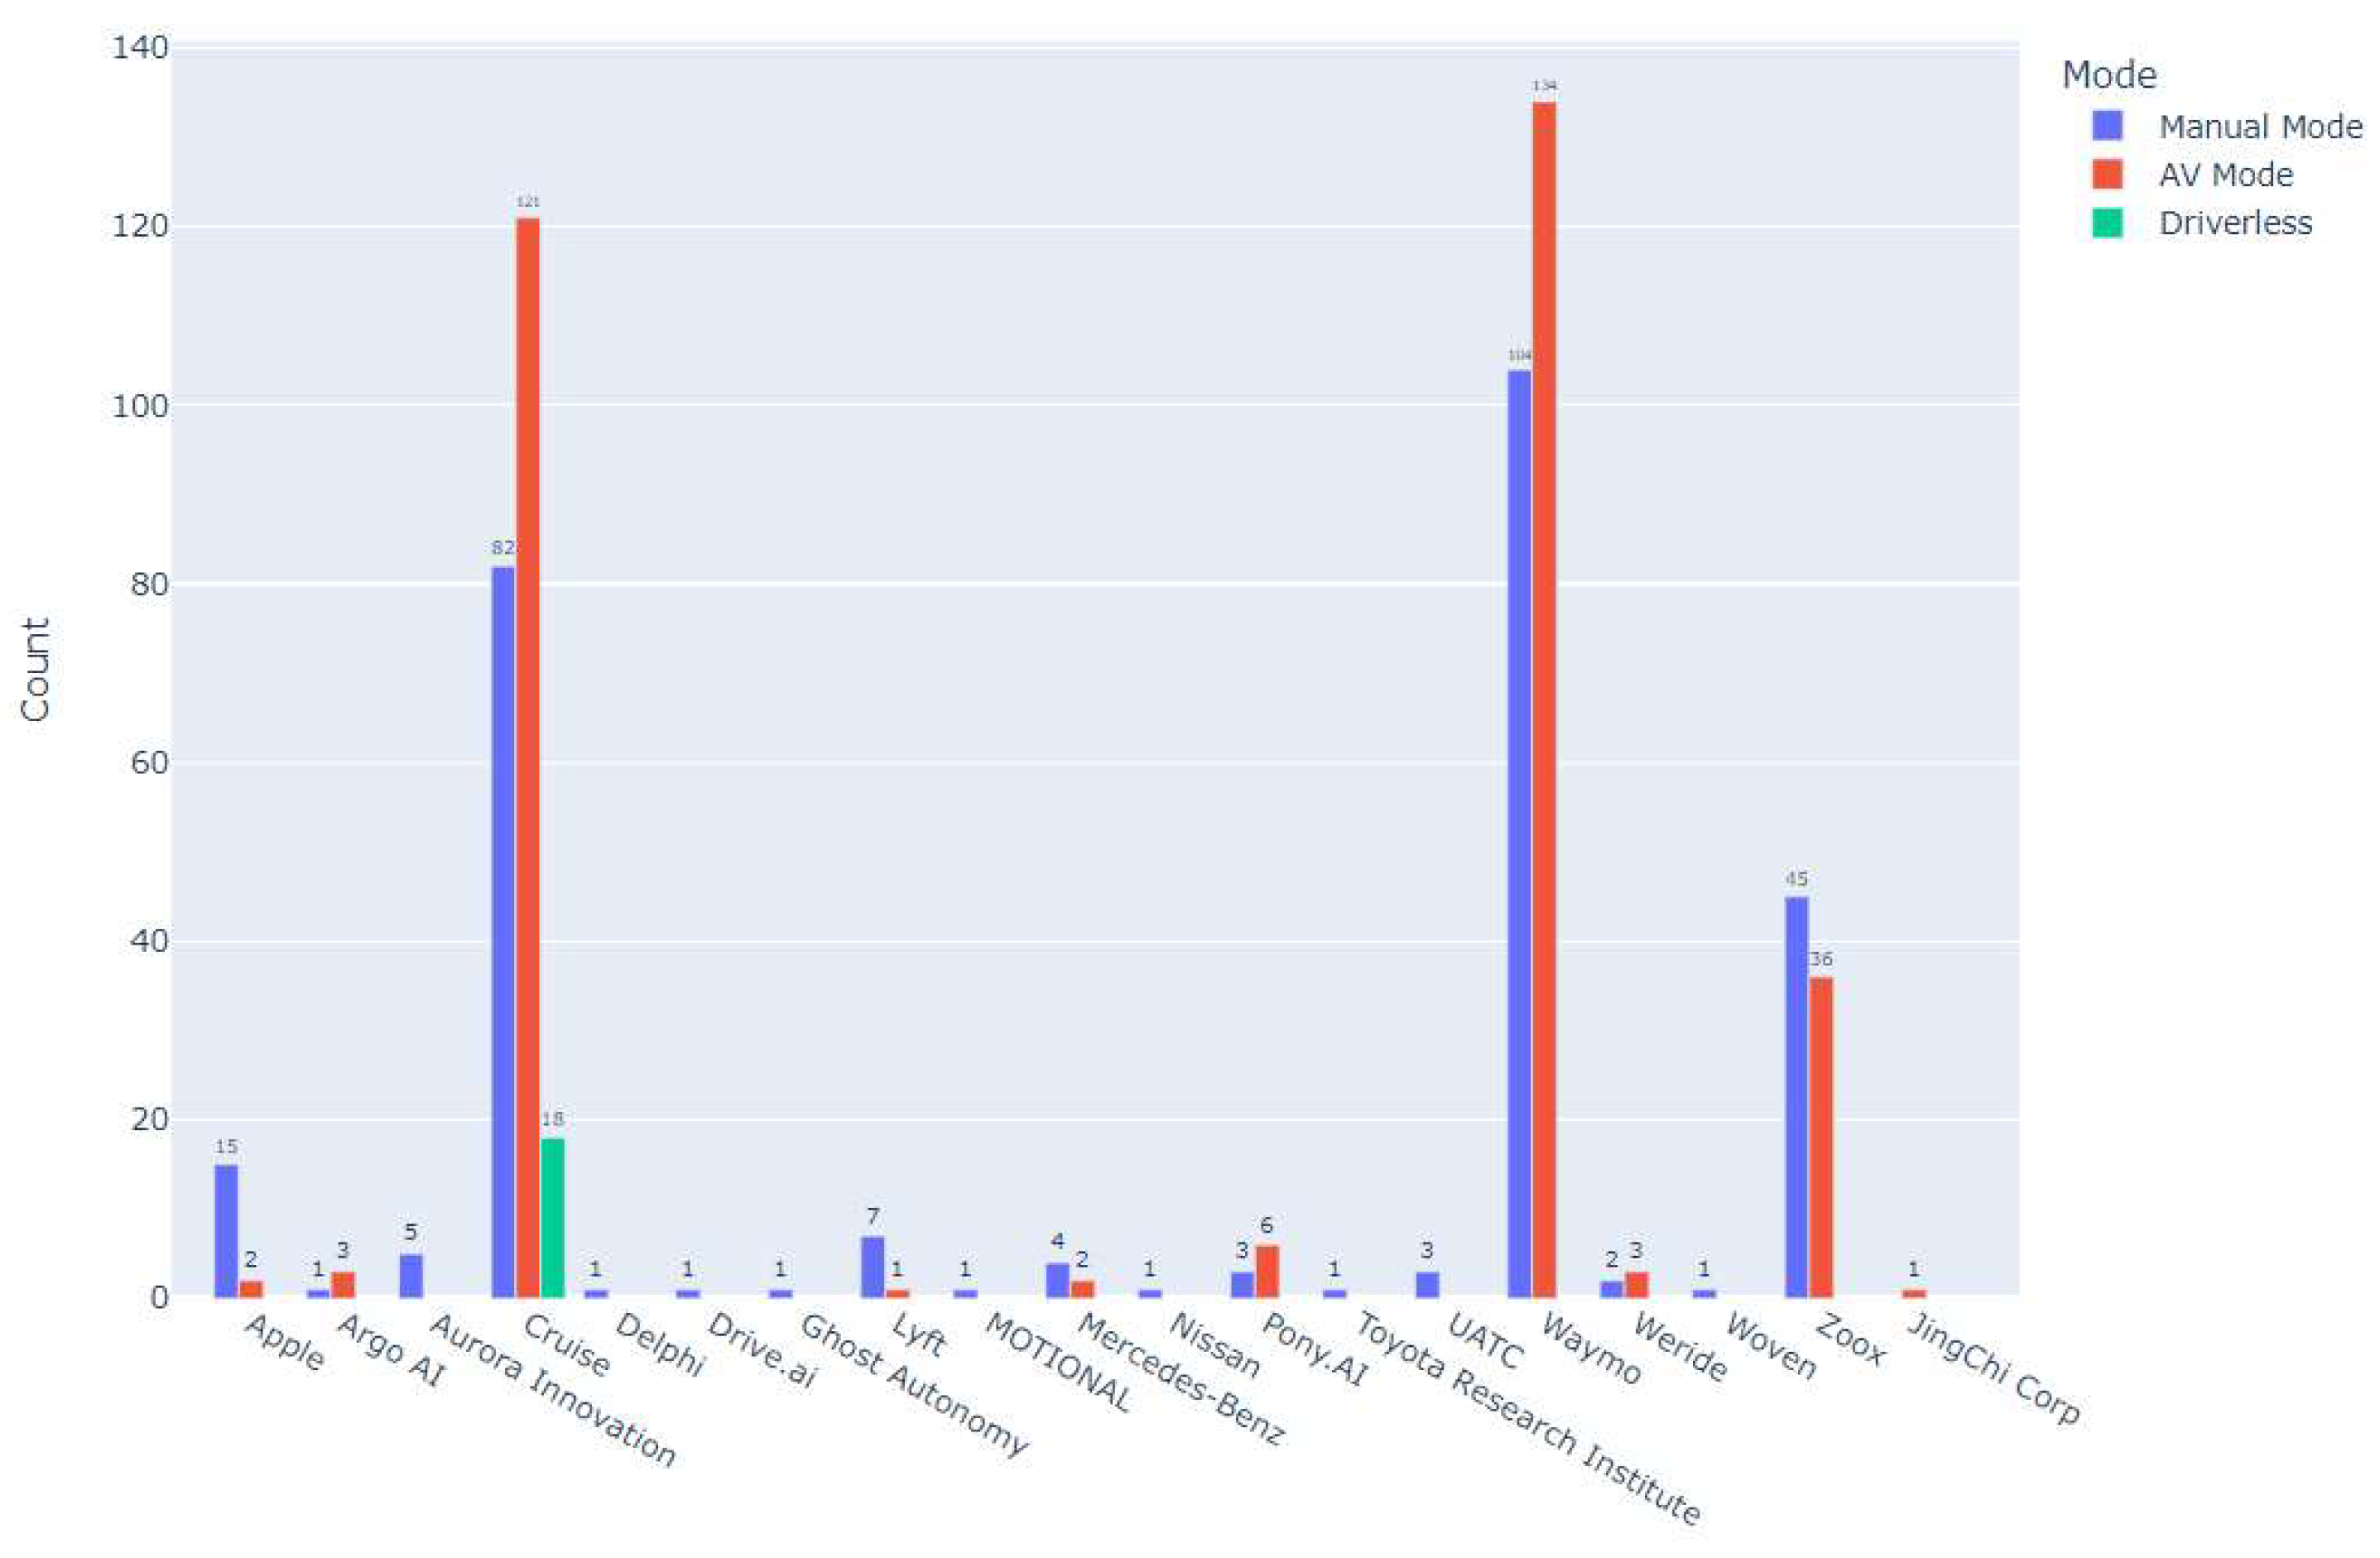
4.2.2. Distribution of Disengagement Classes
4.2.3. Evaluation of Disengagement Results
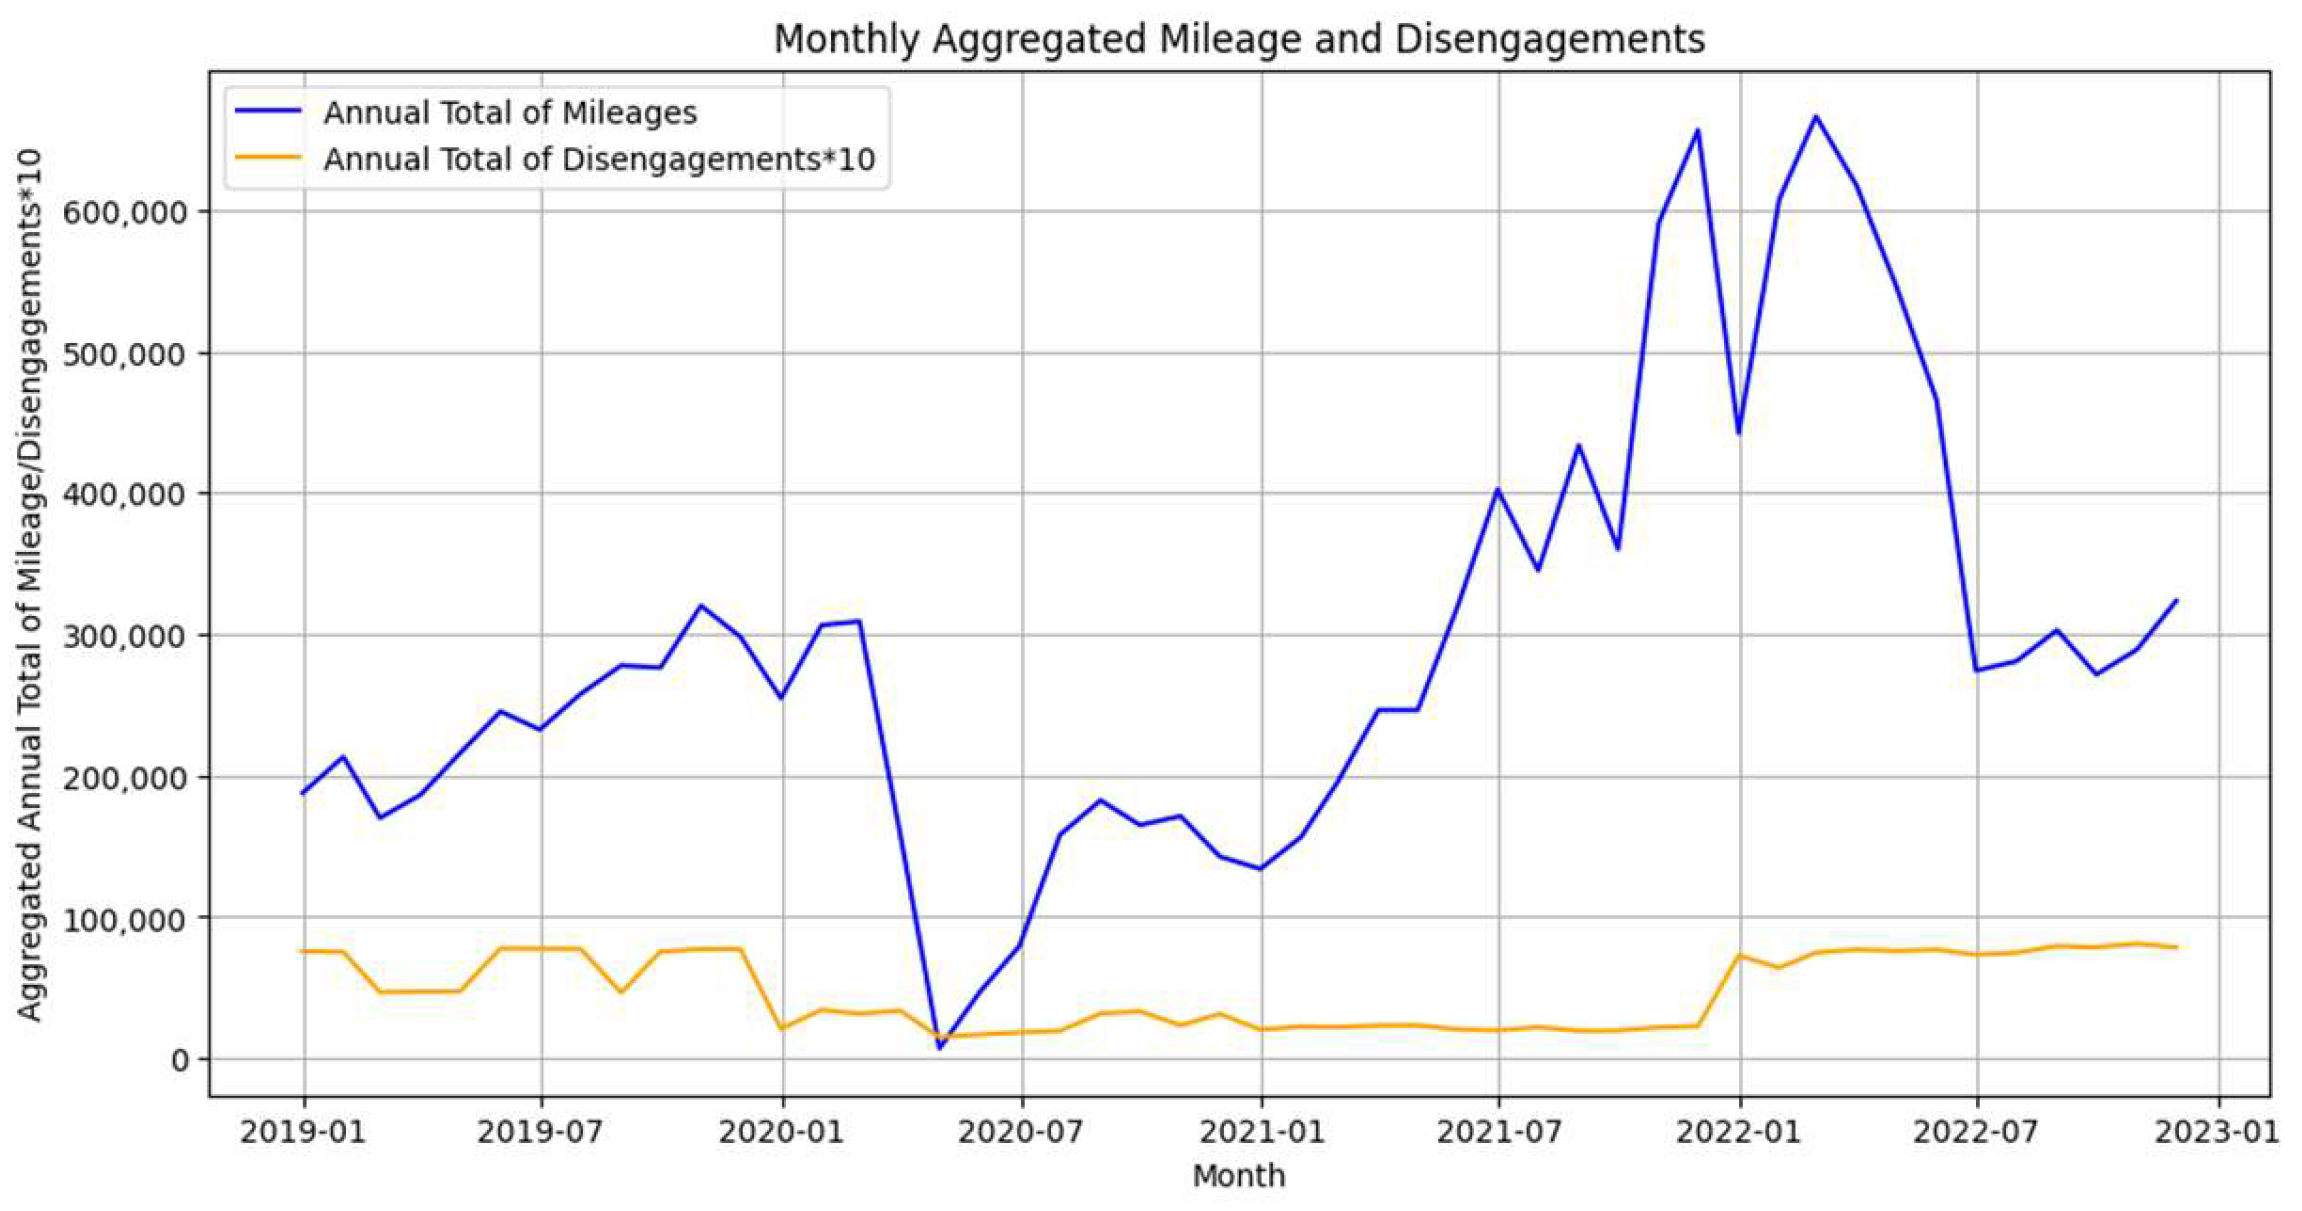
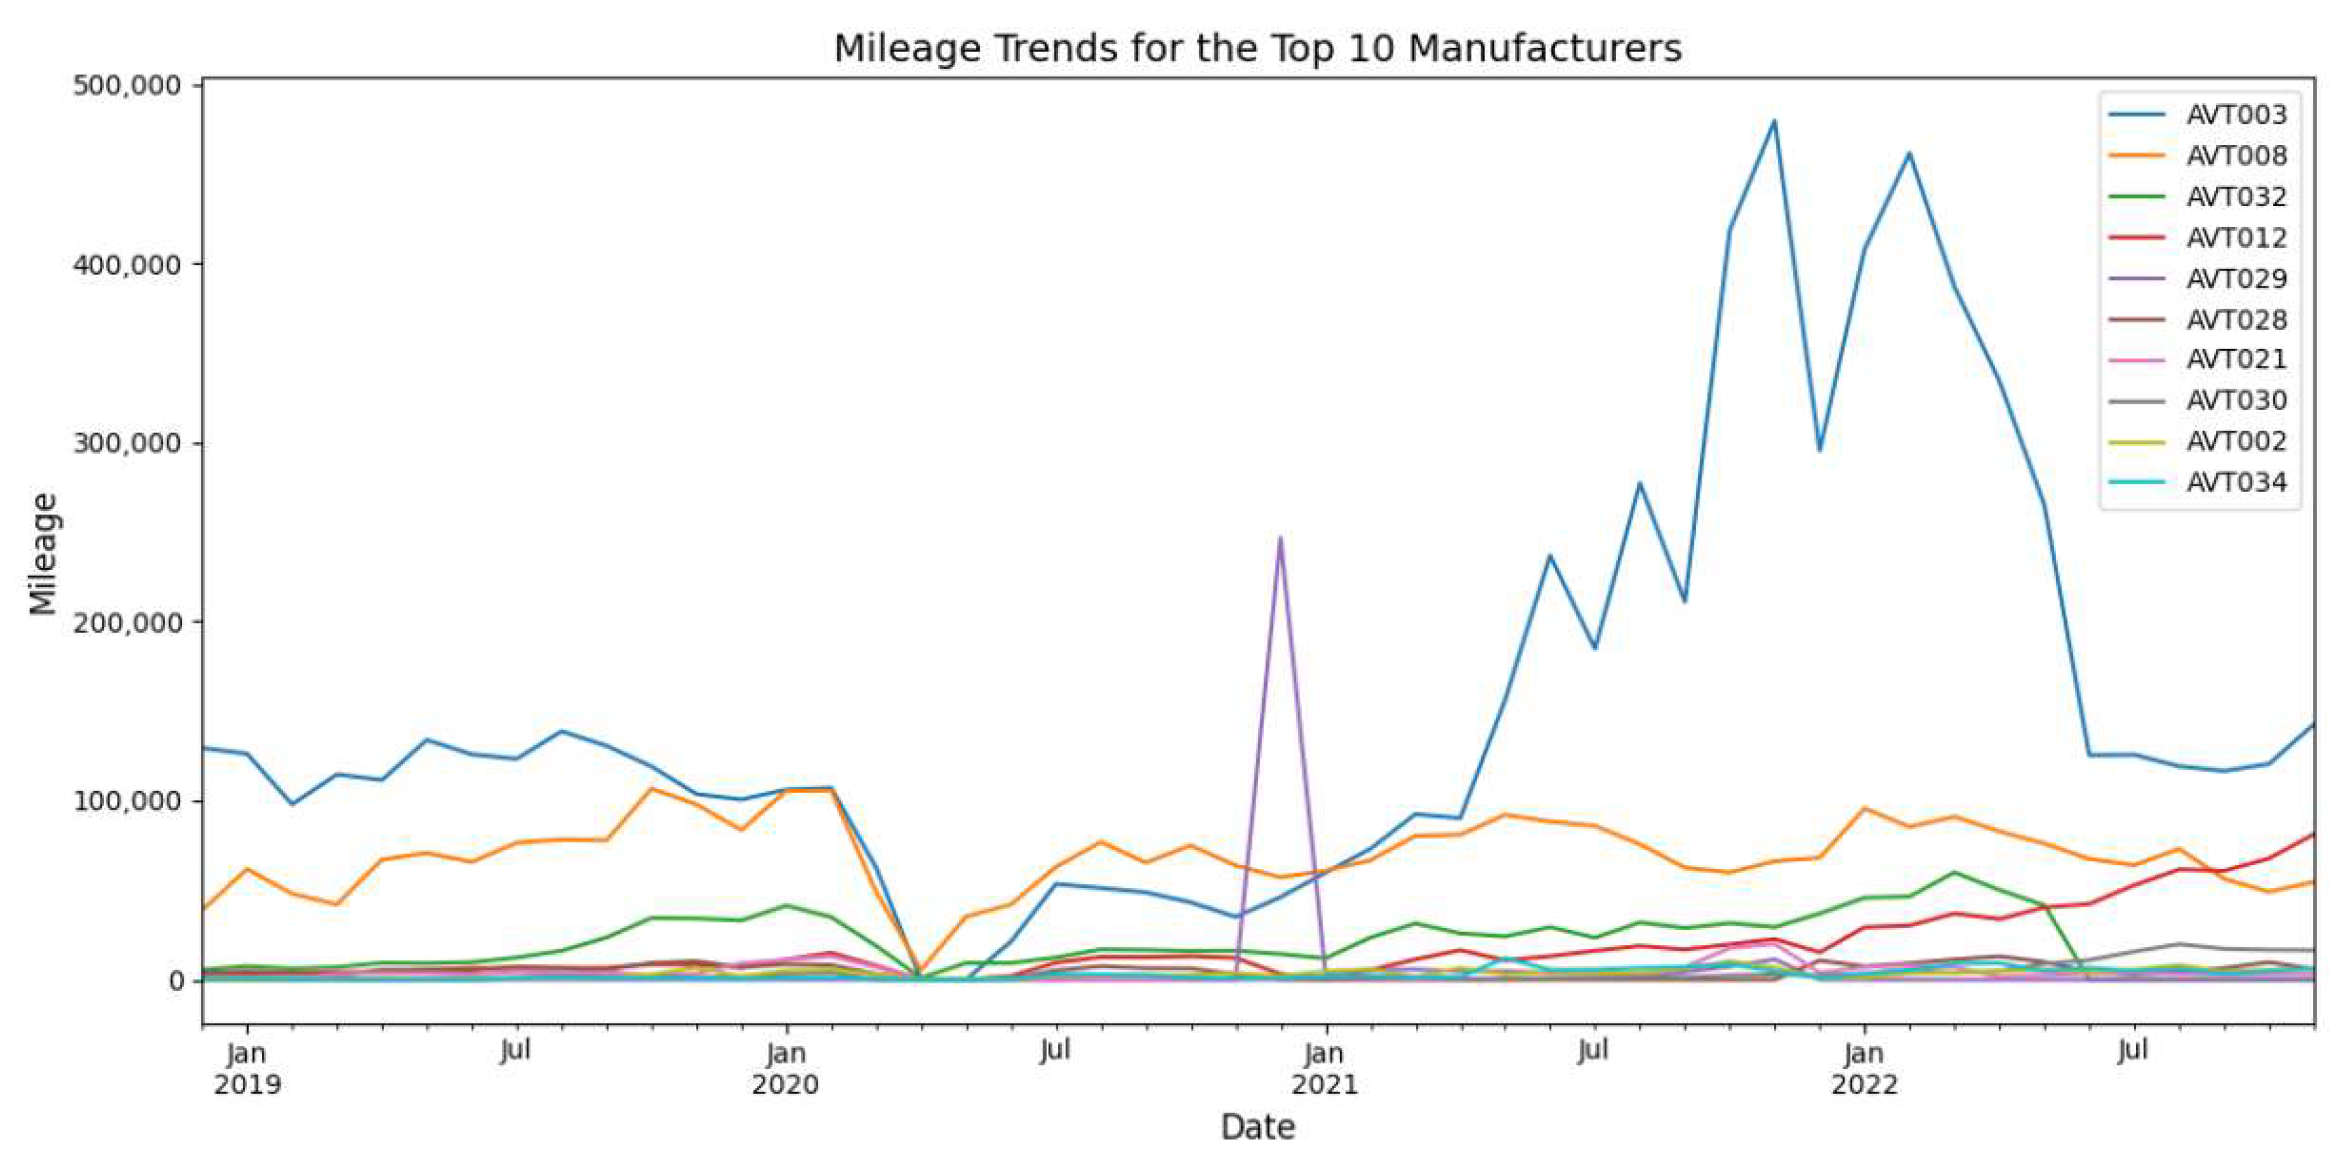
4.3. Mileage Dataset
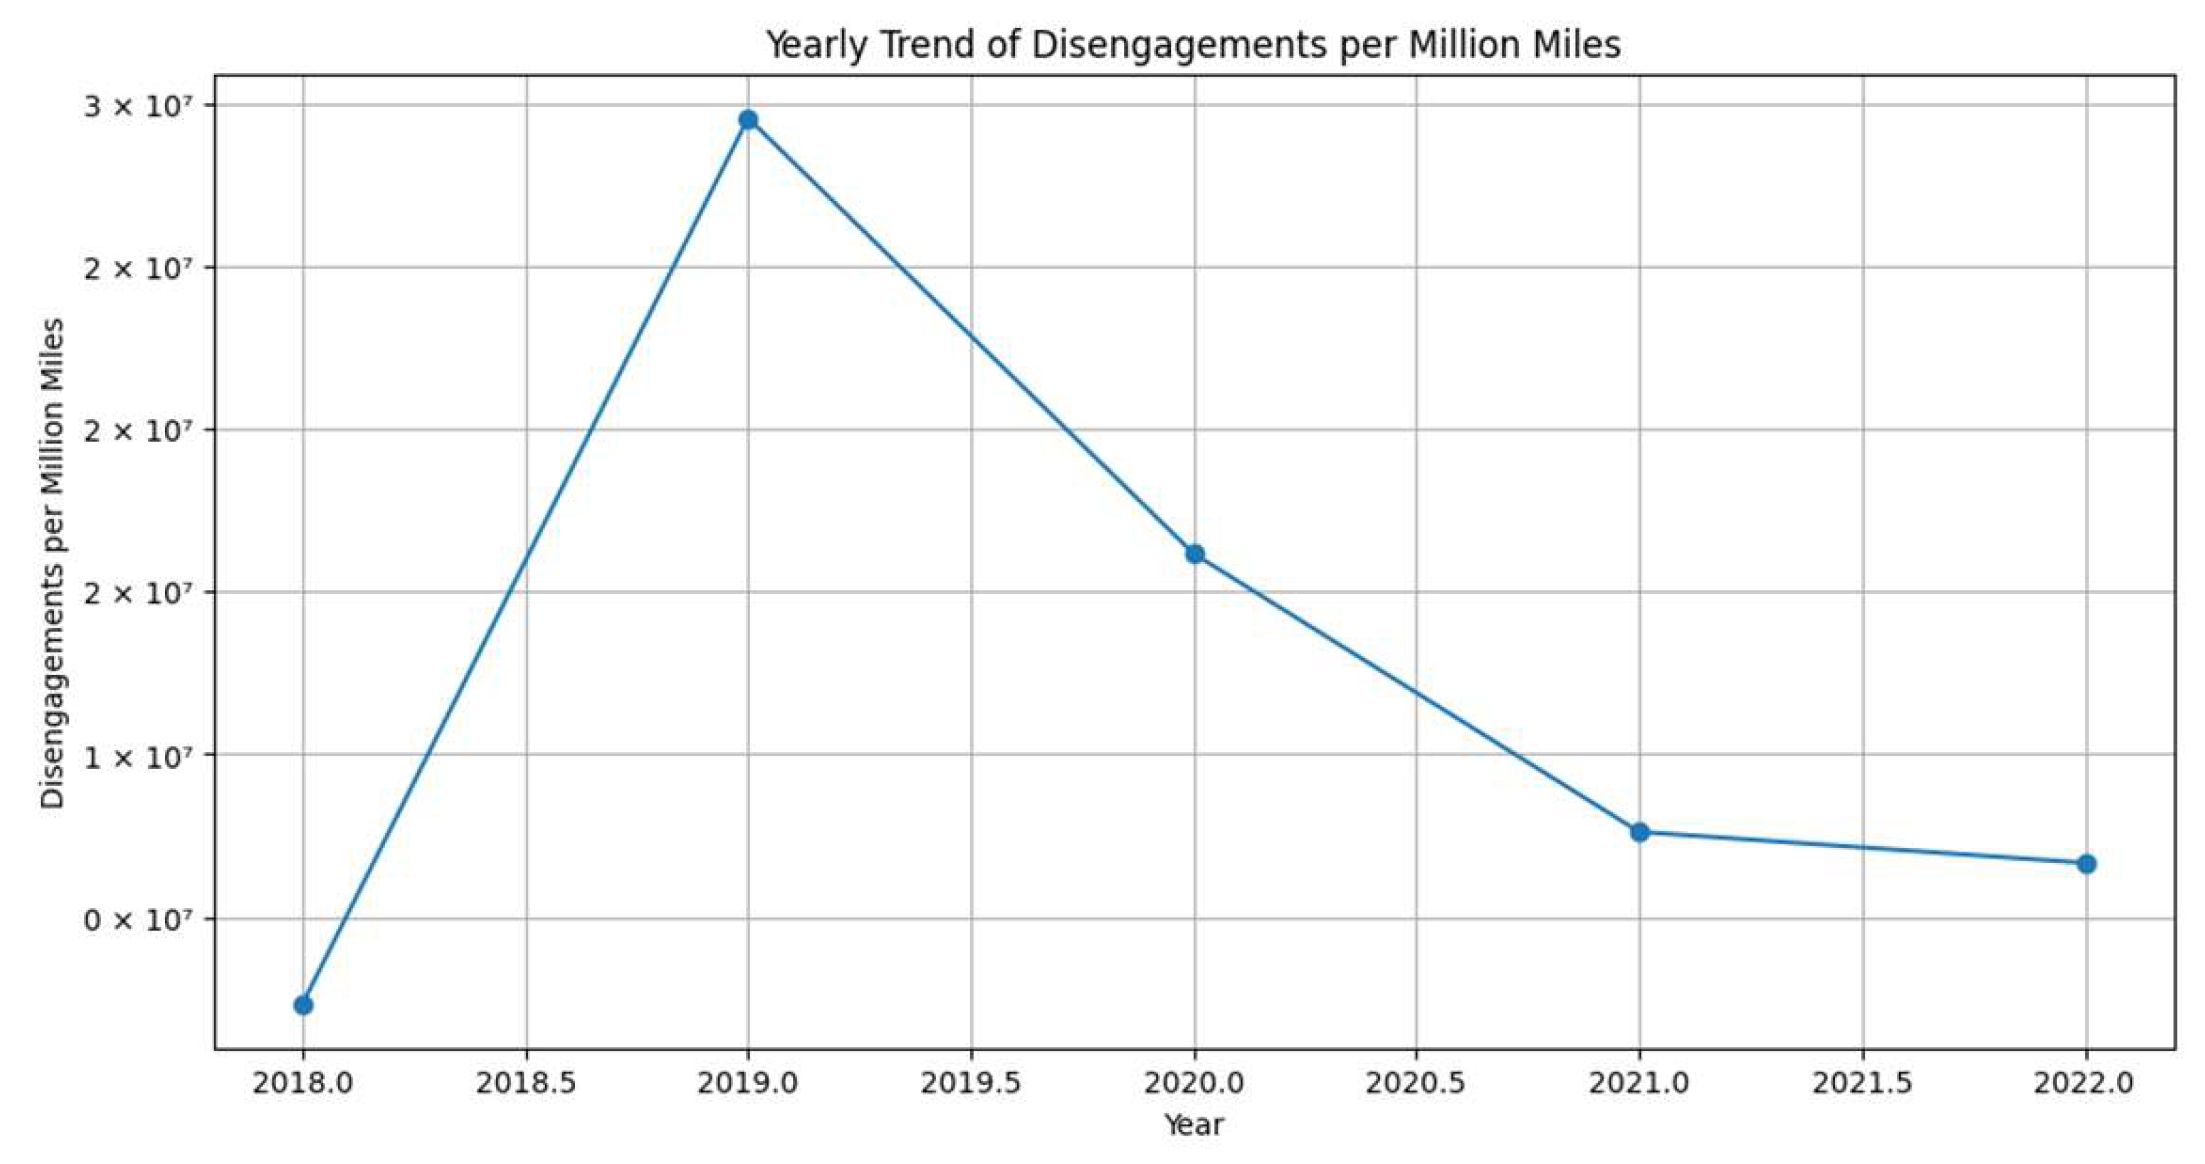
- Disengagements (Numerator): This represents the total number of disengagement events recorded during the specified period (2019 to 2022). In this case, the total is 39,000 disengagements.
- Mileage (Denominator): This is the total distance traveled by the vehicles during the same period. Here, it amounts to 14,000,000 miles.
5. Discussion
5.1. Disengagement Patterns and Causes
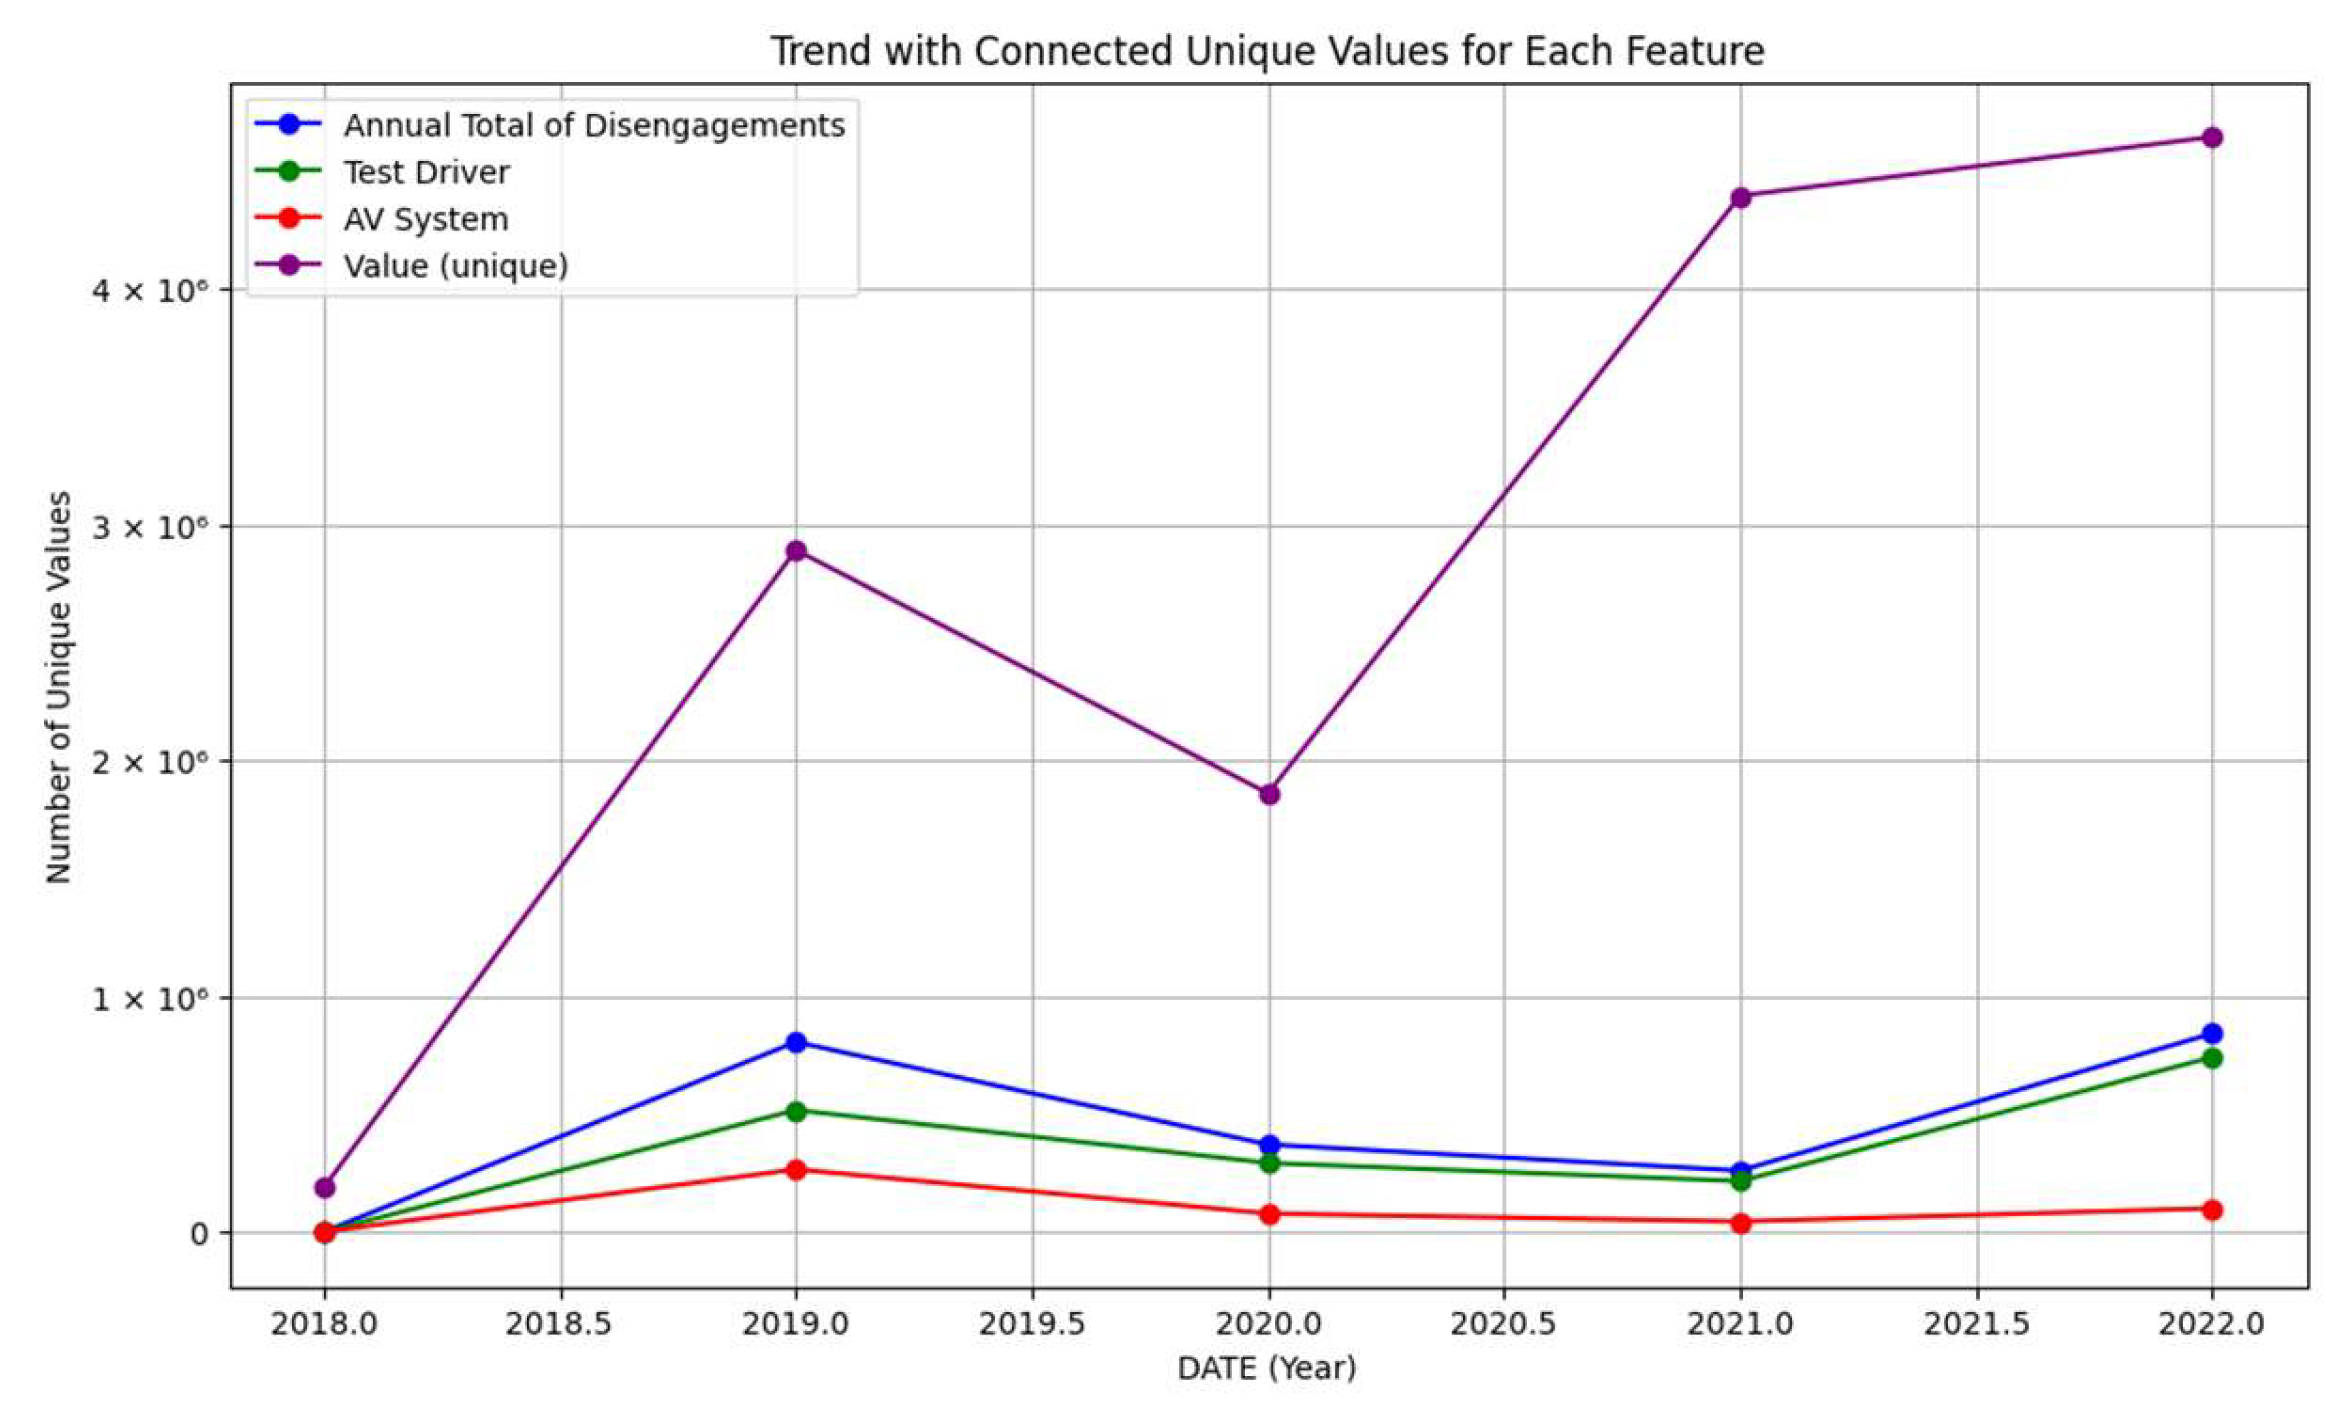
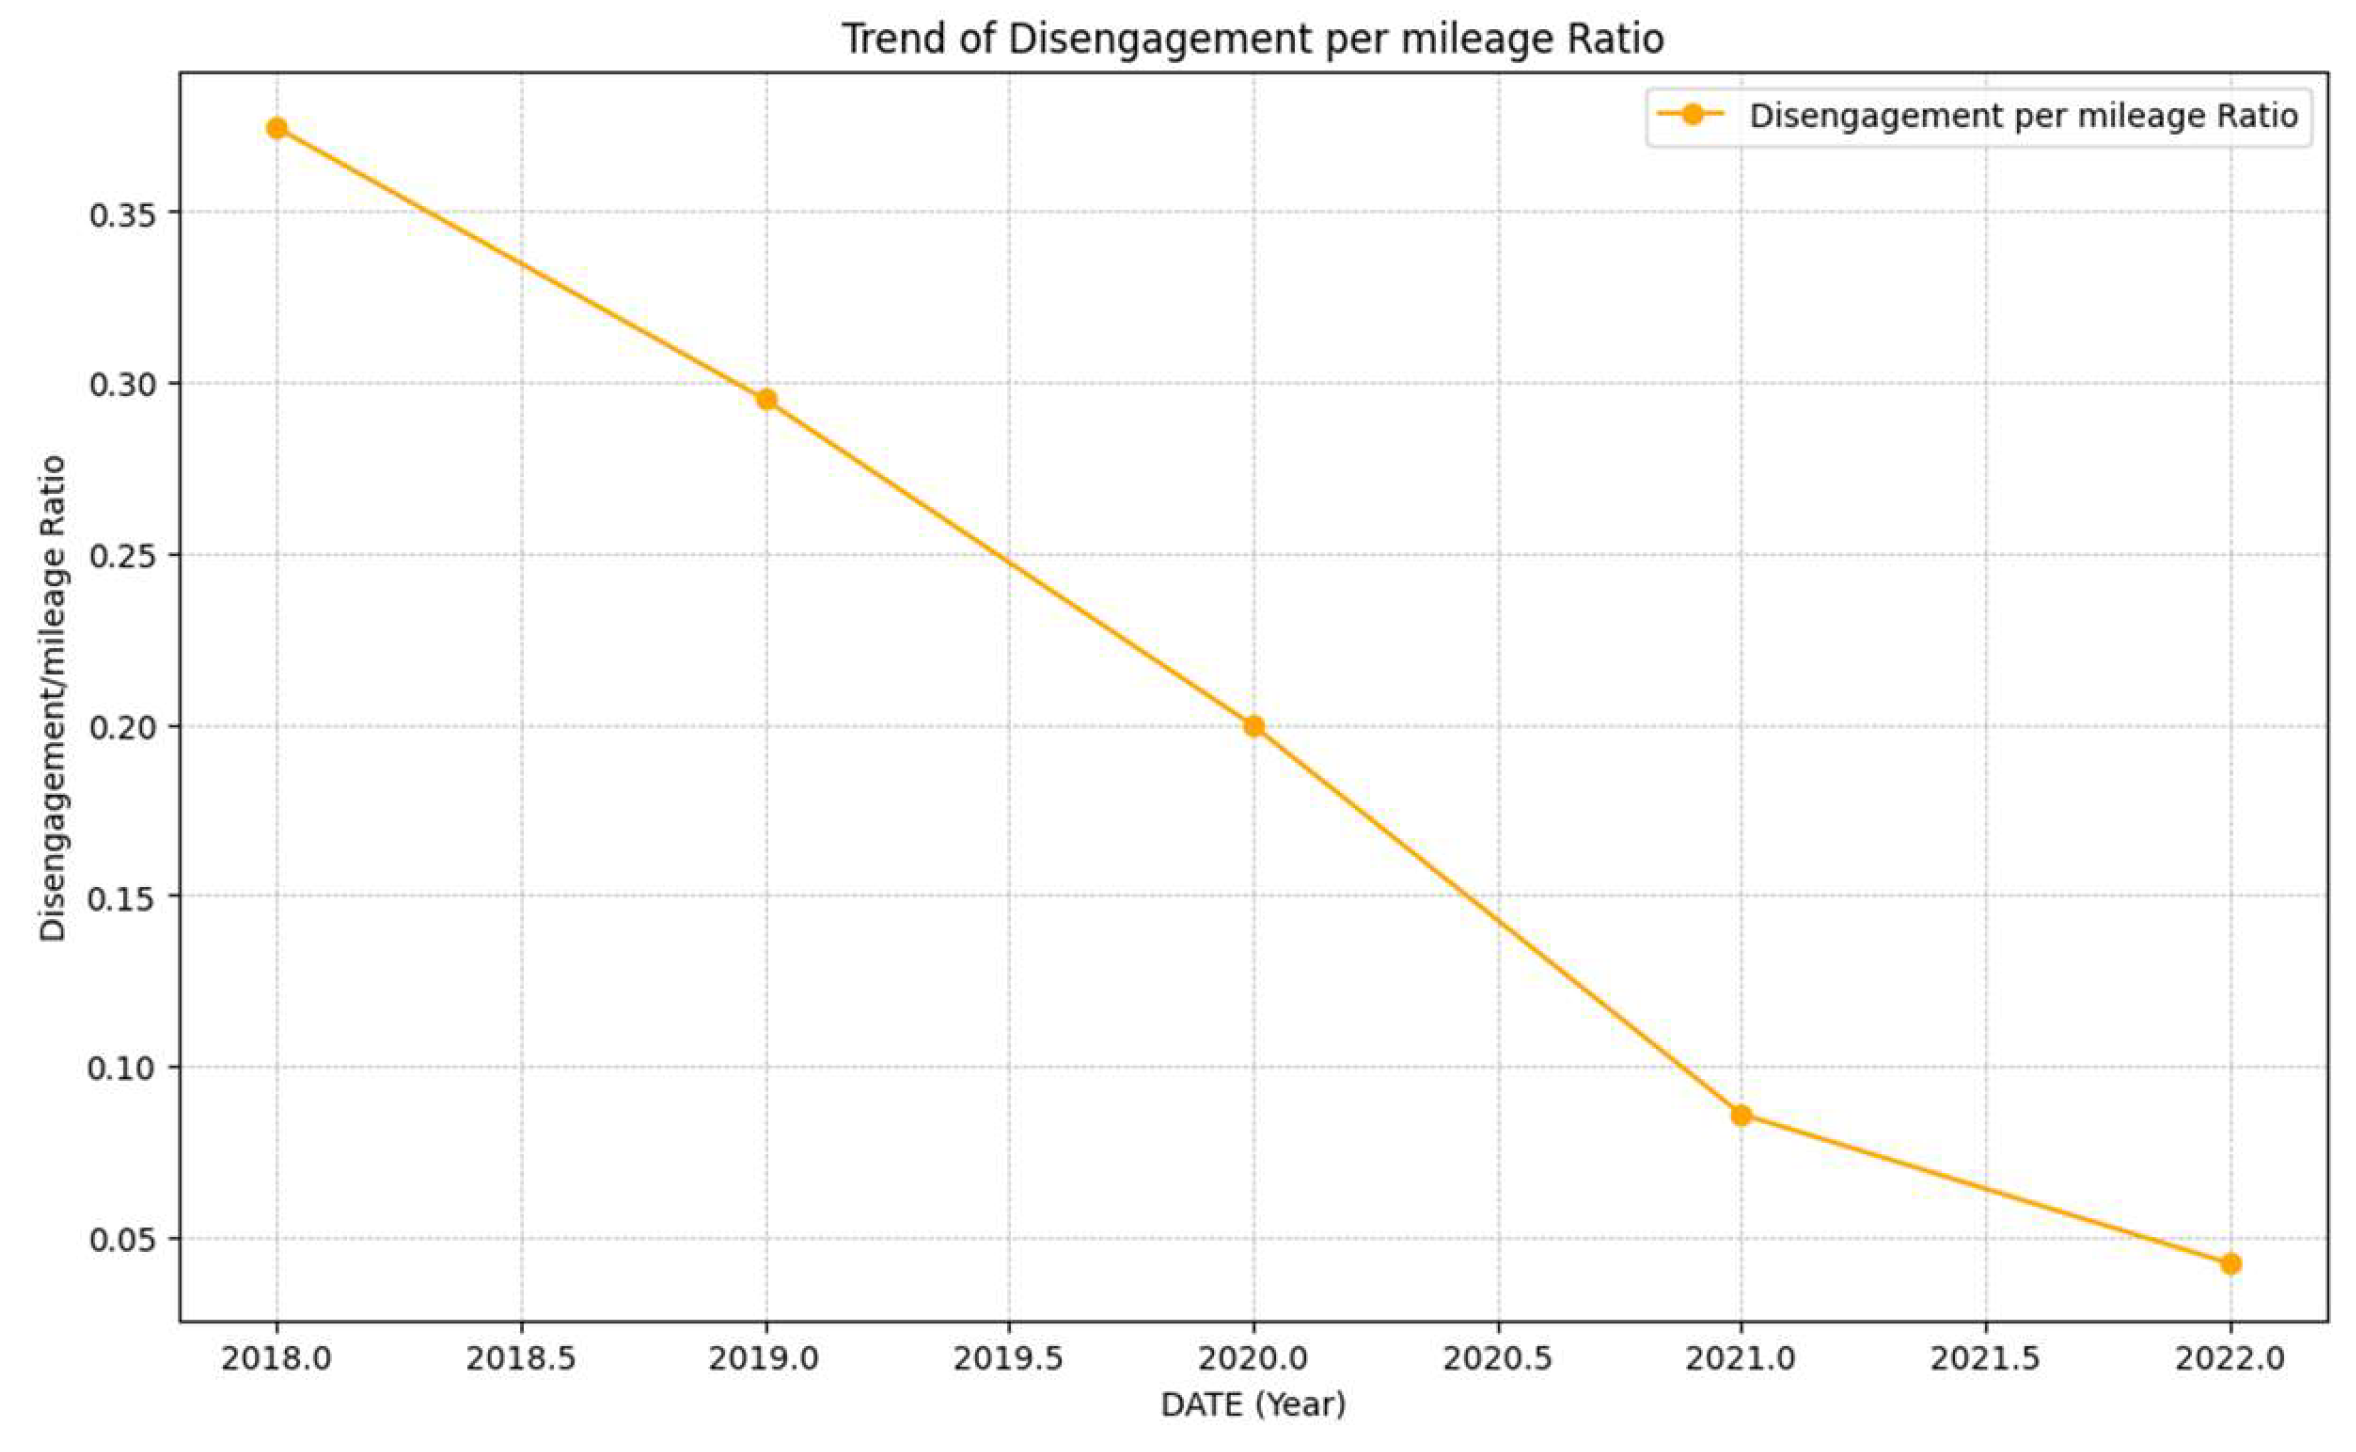
5.2. Trends in Disengagements and Mileage
5.3. Safety Implications and Future Directions
5.4. Suggestions for Future Development of ATO Algorithms
6. Conclusions
Author Contributions
Funding
Institutional Review Board Statement
Informed Consent Statement
Data Availability Statement
Conflicts of Interest
Abbreviations
| AVs | Autonomous Vehicles |
| ADS | Autonomous Driving Systems |
| AVT | Autonomous Vehicle Testing |
| CA DMV | California Department of Motor Vehicles |
| ATO | Autonomous Train Operation |
References
- Rahman, M.T.; Dey, K.; Dimitra Pyrialakou, V.; Das, S. Factors influencing safety perceptions of sharing roadways with autonomous vehicles among vulnerable roadway users. J. Saf. Res. 2023, 85, 266–277. Available online: https://www.sciencedirect.com/science/article/pii/S0022437523000312 (accessed on 31 December 2024).
- Nair, G.S.; Bhat, C.R. Sharing the road with autonomous vehicles: Perceived safety and regulatory preferences. Transp. Res. Part C Emerg. Technol. 2021, 122, 102885. Available online: https://linkinghub.elsevier.com/retrieve/pii/S0968090X20307853 (accessed on 31 December 2024).
- Ghanim, M.S.; Shaaban, K. Investigating the Impact of Autonomous Vehicles on Roundabout Performance Using Microsimulation. In Proceedings of the 2024 Intermountain Engineering, Technology and Computing (IETC), Logan, UT, USA, 13–14 May 2024; pp. 341–346. Available online: https://ieeexplore.ieee.org/document/10564400/ (accessed on 31 December 2024).
- Soni, S.; Reddy, N.; Tsapi, A.; van Arem, B.; Farah, H. Behavioral adaptations of human drivers interacting with automated vehicles. Transp. Res. Part F Traffic Psychol. Behav. 2022, 86, 48–64. Available online: https://www.sciencedirect.com/science/article/pii/S1369847822000201 (accessed on 31 December 2024).
- Giannaros, A.; Karras, A.; Theodorakopoulos, L.; Karras, C.; Kranias, P.; Schizas, N.; Kalogeratos, G.; Tsolis, D. Autonomous Vehicles: Sophisticated Attacks, Safety Issues, Challenges, Open Topics, Blockchain, and Future Directions. J. Cybersecur. Priv. 2023, 3, 493–543. Available online: https://www.mdpi.com/2624-800X/3/3/25 (accessed on 31 December 2024). [CrossRef]
- Kaye, S.-A.; Li, X.; Oviedo-Trespalacios, O.; Pooyan Afghari, A. Getting in the path of the robot: Pedestrians acceptance of crossing roads near fully automated vehicles. Travel Behav. Soc. 2022, 26, 1–8. [Google Scholar] [CrossRef]
- Xu, C.; Sankar, R. A Comprehensive Review of Autonomous Driving Algorithms: Tackling Adverse Weather Conditions, Unpredictable Traffic Violations, Blind Spot Monitoring, and Emergency Maneuvers. Algorithms 2024, 17, 526. [Google Scholar] [CrossRef]
- Raiyn, J.; Weidl, G. Predicting Autonomous Driving Behavior through Human Factor Considerations in Safety-Critical Events. Smart Cities 2024, 7, 460–474. Available online: https://www.mdpi.com/2624-6511/7/1/18 (accessed on 31 December 2024). [CrossRef]
- Lv, C.; Cao, D.; Zhao, Y.; Auger, D.J.; Sullman, M.; Wang, H.; Dutka, L.M.; Skrypchuk, L.; Mouzakitis, A. Analysis of autopilot disengagements occurring during autonomous vehicle testing. IEEE/CAA J. Autom. Sin. 2018, 5, 58–68. [Google Scholar]
- Khattak, Z.H.; Fontaine, M.D.; Smith, B.L. Exploratory Investigation of Disengagements and Crashes in Autonomous Vehicles under Mixed Traffic: An Endogenous Switching Regime Framework. IEEE Trans. Intell. Transp. Syst. 2021, 22, 7485–7495. [Google Scholar]
- Shladover, S.E. Connected and automated vehicle systems: Introduction and overview. J. Intell. Transp. Syst. 2018, 22, 190–200. Available online: https://linkinghub.elsevier.com/retrieve/pii/S0968090X18306764 (accessed on 30 December 2024).
- Anderson, J.; Kalra, N.; Stanley, K.; Sorensen, P.; Samaras, C.; Oluwatola, O. Autonomous Vehicle Technology: A Guide for Policymakers; Rand: Santa Monica, CA, USA, 2016. [Google Scholar]
- Favarò, F.; Eurich, S.; Nader, N. Autonomous vehicles’ disengagements: Trends, triggers, and regulatory limitations. Accid. Anal. Prev. 2018, 110, 136–148. [Google Scholar] [PubMed]
- Wang, S.; Li, Z. Exploring the mechanism of crashes with automated vehicles using statistical modeling approaches. PLoS ONE 2019, 14, e0214550. [Google Scholar]
- California DMV. Autonomous Vehicle Collision Reports [Internet]. 2024. Available online: https://www.dmv.ca.gov/portal/vehicle-industry-services/autonomous-vehicles/autonomous-vehicle-collision-reports/ (accessed on 22 January 2024).
- Boggs, A.M.; Arvin, R.; Khattak, A.J. Exploring the who, what, when, where, and why of automated vehicle disengagements. Accid. Anal. Prev. 2020, 136, 105406. [Google Scholar] [CrossRef] [PubMed]
- Zhang, Y.; Yang, X.J.; Zhou, F. Disengagement Cause-and-Effect Relationships Extraction Using an NLP Pipeline. 2021. Available online: http://arxiv.org/abs/2111.03511 (accessed on 29 December 2024).
- Sinha, A.; Chand, S.; Wijayaratna, K.P.; Virdi, N.; Dixit, V. Comprehensive safety assessment in mixed fleets with connected and automated vehicles: A crash severity and rate evaluation of conventional vehicles. Accid. Anal. Prev. 2020, 142, 105567. [Google Scholar] [CrossRef] [PubMed]
- Banerjee, S.S.; Jha, S.; Cyriac, J.; Kalbarczyk, Z.T.; Iyer, R.K. Hands off the wheel in autonomous vehicles?: A systems perspective on over a million miles of field data. In Proceedings of the 48th Annual IEEE/IFIP International Conference on Dependable Systems and Networks (DSN), Luxembourg, 25–28 June 2018; pp. 586–597. [Google Scholar]
- Centeio Jorge, C.; Bouman, N.H.; Jonker, C.M.; Tielman, M.L. Exploring the effect of automation failure on the human’s trustworthiness in human-agent teamwork. Front. Robot. AI 2023, 10, 50–80. Available online: https://linkinghub.elsevier.com/retrieve/pii/S0001457521001342 (accessed on 31 December 2024). [CrossRef] [PubMed]
- Guo, X.; Zhang, Y. Maturity in Automated Driving on Public Roads: A Review of the Six-Year Autonomous Vehicle Tester Program. Transp. Res. Rec. 2022, 2676, 352–362. [Google Scholar]
- California DMV. Article 3.7. Testing of Autonomous Vehicles; California DMV: Sacramento, CA, USA, 2022; p. 32. [Google Scholar]
- Sinha, A.; Chand, S.; Vu, V.; Chen, H.; Dixit, V. Crash and disengagement data of autonomous vehicles on public roads in California. Sci Data. 2021, 8, 298. [Google Scholar] [PubMed]
- Kohanpour, E.; Davoodi, S.R.; Shaaban, K. Analyzing Autonomous Vehicle Collision Types to Support Sustainable Transportation Systems: A Machine Learning and Association Rules Approach. Sustainability 2024, 16, 9893. Available online: https://www.mdpi.com/2071-1050/16/22/9893 (accessed on 30 November 2024). [CrossRef]
- Sinha, A.; Vu, V.; Chand, S.; Wijayaratna, K.; Dixit, V. A crash injury model involving autonomous vehicle: Investigating of crash and disengagement reports. Sustainability 2021, 13, 7938. [Google Scholar] [CrossRef]
- Zhang, Y. Cause-and-Effect Analysis on Autonomous Vehicle Disengagement with NLP Deep Transfer Learning: A Scalable End-to-End Pipeline Approach Using the California DMV Dataset Related Work. Master’s Thesis, UMSI, Ann Arbor, MI, USA, 2021; pp. 1–19. [Google Scholar]


| Feature Name | Class/Value | Disengagement | Percentage | Mileage | |
|---|---|---|---|---|---|
| Year | 2019 | 18,344 | 46.71 | 2,888,593 | |
| 2022 | 8303 | 21.14 | 5,105,949 | ||
| 2020 | 6934 | 17.66 | 1,986,361 | ||
| 2021 | 4709 | 11.99 | 4,091,517 | ||
| 2018 | 983 | 2.50 | 21.36 | ||
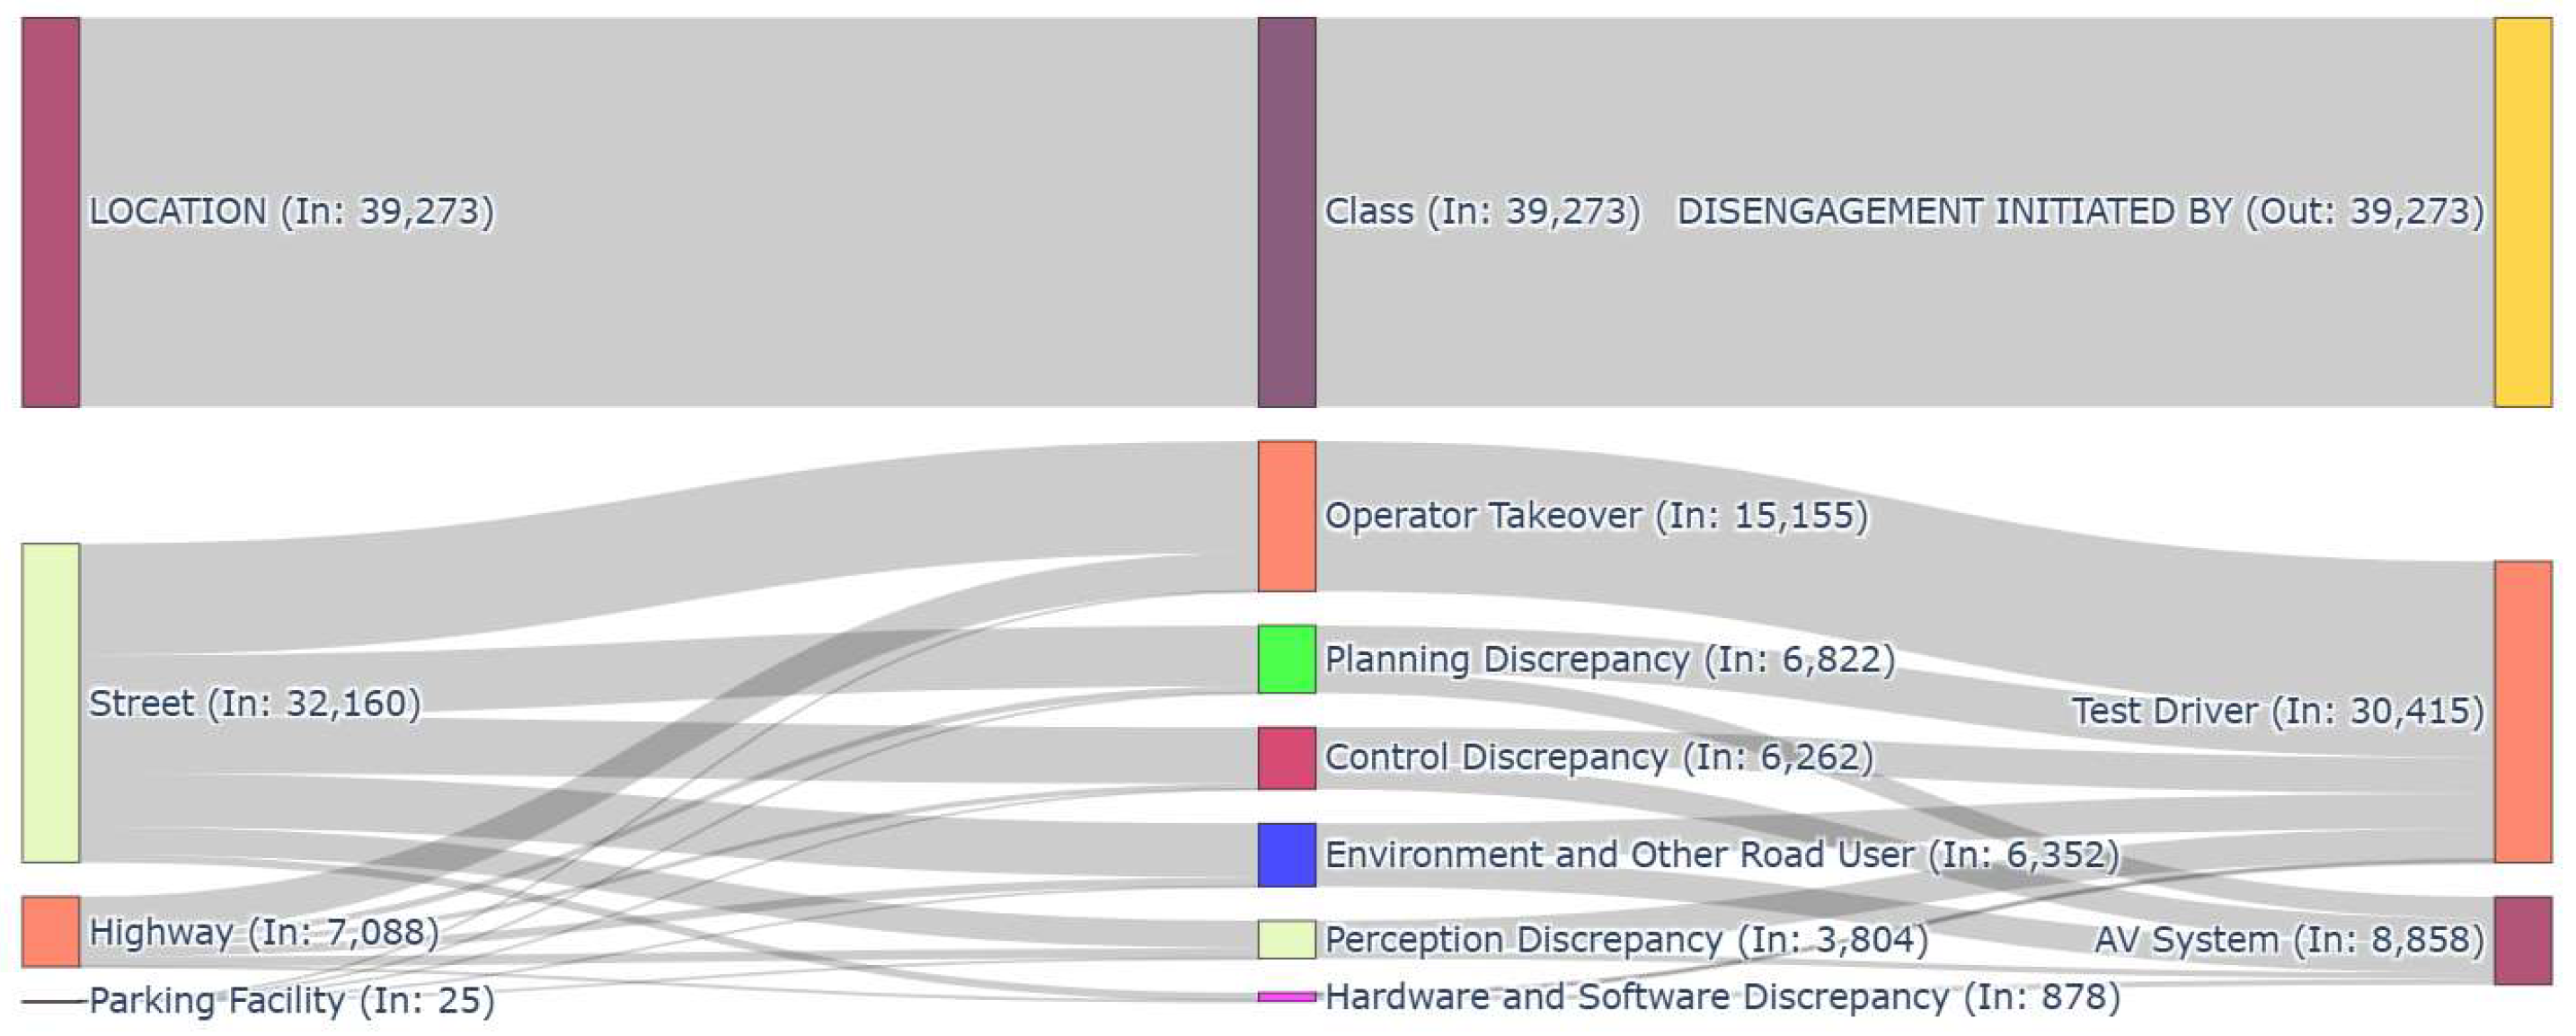
| Disengagement Initiated By | Test Driver | 30,413 | 77.44 | - | |
| AV System | 8860 | 22.56 | - | ||
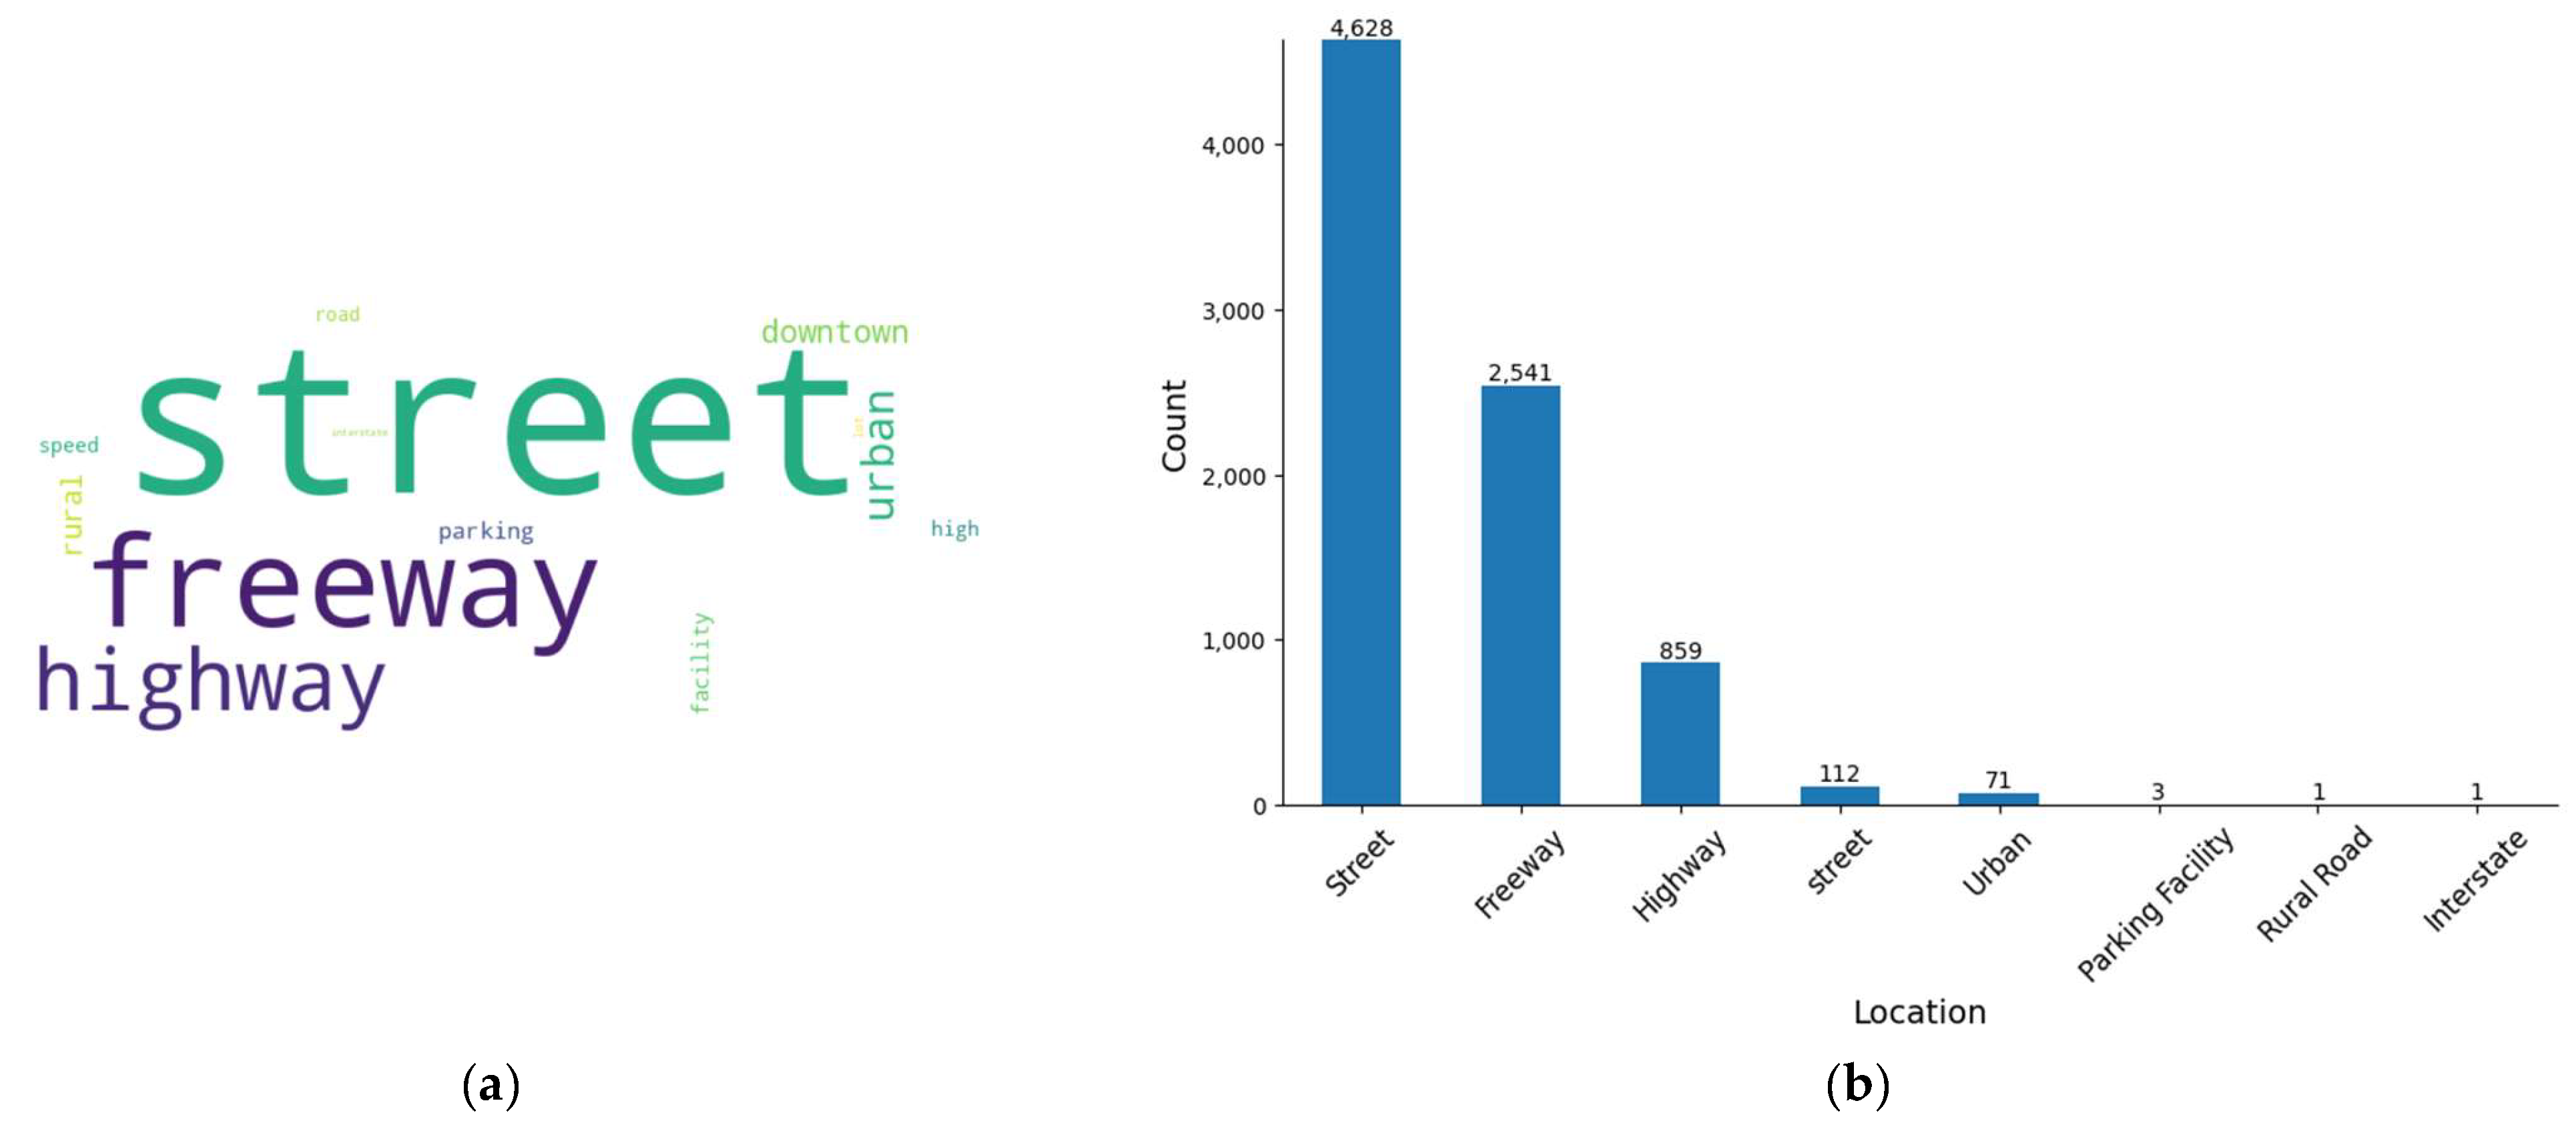
| Location | Street | 32,160 | 81.89 | - | |
| Highway | 7088 | 18.05 | - | ||
| Parking Facility | 25 | 0.06 | - | ||
| Permit Number | Toyota Research Ins | AVT050 | 9274 | 23.61 | 46,300.55 |
| Apple | AVT030 | 7696 | 19.60 | 185,445.8 | |
| Mercedes-Benz | AVT002 | 7024 | 17.89 | 309,427.3 | |
| Lyft | AVT045 | 3626 | 9.23 | 173,492.8 | |
| Nvidia Corporation | AVT020 | 1731 | 4.41 | 30,910.71 | |
| AImotive | AVT036 | 1170 | 2.98 | 34,411.76 | |
| Udelv | AVT029 | 1078 | 2.74 | 3,593,333 | |
| Waymo LLC(Google) | AVT003 | 1016 | 2.59 | 9,236,363 | |
| Valeo | AVT017 | 863 | 2.20 | 1666.02 | |
| EasyMile | AVT058 | 700 | 1.78 | 639.097 | |
| Qualcomm Tech | AVT047 | 668 | 1.70 | 14,334.76 | |
| Ghost Autonomy | AVT073 | 448 | 1.14 | 14,545.45 | |
| SF Motors | AVT049 | 402 | 1.02 | 8040 | |
| Ridecell | AVT062 | 384 | 0.98 | 307.84 | |
| Aurora Innovation | AVT037 | 374 | 0.95 | 76,326.53 | |
| Intel Corporation | AVT052 | 320 | 0.81 | 2922.37 | |
| Zoox | AVT012 | 273 | 0.70 | 1,365,000 | |
| Cruise | AVT008 | 241 | 0.61 | 11,234.44 | |
| Imagry | AVT061 | 204 | 0.52 | 650.09 | |
| Pony.AI | AVT032 | 158 | 0.40 | 1,580,000 | |
| Nuro | AVT028 | 151 | 0.38 | 377,500 | |
| Drive.AI | AVT013 | 150 | 0.38 | 115,384.6 | |
| Nissan North A | AVT007 | 144 | 0.37 | 8275.86 | |
| Bosch | AVT006 | 141 | 0.36 | 780.73 | |
| Nullmax | AVT038 | 140 | 0.36 | 1456.23 | |
| Motional.AD | AVT004 | 135 | 0.34 | 4945.05 | |
| Box Bot | AVT057 | 109 | 0.28 | 462.45 | |
| WeRide Corp | AVT034 | 91 | 0.23 | 303,333.3 | |
| Phantom.AI | AVT046 | 86 | 0.22 | 284,344.3 | |
| SAIC Innovation C | AVT035 | 80 | 0.20 | 4469.27 | |
| Apex.AI | AVT051 | 63 | 0.16 | 448.40 | |
| Woven | AVT077 | 63 | 0.16 | 6407.76 | |
| Gatik.AI | AVT054 | 61 | 0.16 | 15,250 | |
| Ambarella Corp | AVT053 | 52 | 0.13 | 3151.5 | |
| QCRAFT | AVT067 | 29 | 0.07 | 19,333.33 | |
| ThorDrive | AVT064 | 27 | 0.07 | 2547.2 | |
| BMW of North A | AVT009 | 22 | 0.06 | 286.83 | |
| DiDi Research A | AVT055 | 16 | 0.04 | 80,000 | |
| Baidu USA | AVT015 | 14 | 0.04 | 92,857 | |
| AutoX Technologies | AVT021 | 13 | 0.03 | 144,444.4 | |
| Telenav | AVT019 | 10 | 0.03 | 31.86 | |
| Atlas Robotics | AVT068 | 10 | 0.03 | 47.40 | |
| Argo.AI | AVT066 | 5 | 0.01 | 41,666.66 | |
| Deeproute.AI | AVT069 | 4 | 0.01 | 25,000 | |
| PlusAI | AVT027 | 4 | 0.01 | 25,474 | |
| Class | Operator Takeover | 15,155 | 38.59 | - | |
| Planning Discrepancy | 6822 | 17.37 | - | ||
| Environment and Other Road Users | 6352 | 16.17 | - | ||
| Control Discrepancy | 6262 | 15.94 | - | ||
| Perception Discrepancy | 3804 | 9.69 | - | ||
| Hardware and Software Discrepancy | 878 | 2.24 | - | ||
| Variable | Result | |||
|---|---|---|---|---|
| Location of Disengagement | 619.22 | 3.45 × 10−135 | 2 | |
| Cause of Disengagement | 8975.41 | 0.00 | 5 |
Disclaimer/Publisher’s Note: The statements, opinions and data contained in all publications are solely those of the individual author(s) and contributor(s) and not of MDPI and/or the editor(s). MDPI and/or the editor(s) disclaim responsibility for any injury to people or property resulting from any ideas, methods, instructions or products referred to in the content. |
© 2025 by the authors. Licensee MDPI, Basel, Switzerland. This article is an open access article distributed under the terms and conditions of the Creative Commons Attribution (CC BY) license (https://creativecommons.org/licenses/by/4.0/).
Share and Cite
Kohanpour, E.; Davoodi, S.R.; Shaaban, K. Trends in Autonomous Vehicle Performance: A Comprehensive Study of Disengagements and Mileage. Future Transp. 2025, 5, 38. https://doi.org/10.3390/futuretransp5020038
Kohanpour E, Davoodi SR, Shaaban K. Trends in Autonomous Vehicle Performance: A Comprehensive Study of Disengagements and Mileage. Future Transportation. 2025; 5(2):38. https://doi.org/10.3390/futuretransp5020038
Chicago/Turabian StyleKohanpour, Ehsan, Seyed Rasoul Davoodi, and Khaled Shaaban. 2025. "Trends in Autonomous Vehicle Performance: A Comprehensive Study of Disengagements and Mileage" Future Transportation 5, no. 2: 38. https://doi.org/10.3390/futuretransp5020038
APA StyleKohanpour, E., Davoodi, S. R., & Shaaban, K. (2025). Trends in Autonomous Vehicle Performance: A Comprehensive Study of Disengagements and Mileage. Future Transportation, 5(2), 38. https://doi.org/10.3390/futuretransp5020038