Article

Single-Plant Grain Yield in Corn (Zea mays L.) Based on Emergence Date, Seed Size, Sowing Depth, and Plant to Plant Distance

by
Chad L. Kimmelshue
1,2,
A. Susana Goggi
1,2,* and
Kenneth J. Moore
1
1
Department of Agronomy, Iowa State University, Ames, IA 50011, USA
2
Seed Science Center, Iowa State University, Ames, IA 50011, USA
*
Author to whom correspondence should be addressed.
Crops 2022, 2(1), 62-86; https://doi.org/10.3390/crops2010006
Submission received: 28 December 2021 / Revised: 1 March 2022 / Accepted: 2 March 2022 / Published: 8 March 2022

Abstract

:
The lack of seedling emergence uniformity in corn (Zea mays L.) is concerning for producers in the Midwestern U.S. These producers believe that just a few hours delay in emergence can increase interplant competition and decrease single-plant yield, thus reducing overall crop yield. It is speculated that lack of uniformity in seedling emergence occurs due to a variation in seed size within a commercial bag of seed, and variation in seed depth placement at sowing throughout the field. Due to these concerns, producers evaluate size seed variation within the bag before sowing. To date, research has investigated sowing dates, growing degree days, or varying sowing depths to simulate a delay in seedling emergence. These studies are important for understanding the effects of delayed emergence on overall yield, but they fail to examine the effect of inter-plant competition on single-plant yield. The objective of this study was to understand the effect of seed size and sowing depth on emergence and subsequent single-plant yield in a bare soil and a perennial groundcover (PGC) cropping system. Commercially sized seed and seed sized further in the laboratory to obtain a narrower seed size distribution were sown in Kentucky bluegrass and bare soil systems and at two sowing depths of 3.18 and 6.35 cm. The two-year experiment was planted in a split-plot design with four replications. Individual plants were flagged at emergence, and harvested individually. Seed placement was crucial to uniform emergence in both cropping systems, while seed size did not affect emergence in either system. The PGC cropping system delayed seed corn emergence and reduced grain yield as much as 50%. Single-plant yield decreased with delayed corn emergence in both cropping systems. Yield decrease as a function of emergence date followed either a quadratic or linear trend in each growing season, likely related to post emergence environmental factors. This information is important for producers and seed companies to understand the effect of seed size and sowing depth on yield and emergence. This study demonstrates that uniform sowing depth is more important than seed size distribution.

1. Introduction

A delay in seedling emergence of just a few hours in corn (Zea mays L.) may contribute to decreased plant yield. Producers believe that this uneven emergence is associated with the variation of seed size within a bag of seed and uneven sowing depth. While most studies have shown that genetic potential is crucial to corn grain yield and seed size has very little effect, producers remain concerned about seedling emergence when sowing small seeds [1,2]. However, variable sowing depths for both large and small seed sizes can play a role on emergence uniformity. Seed sown deeper and sown earlier, when environmental conditions are unfavorable for germination and growth, had slower seedling emergence rate regardless of seed size [3,4]. Corn yield studies to date have focused on the effect of delayed seedling emergence on a whole plot level, and producers are interested in assessing its effect on single-plant yield. To our knowledge, the combined effects of delayed emergence, seed size, and sowing depth on single-plant yield have not been studied.
Producers are interested in new conservation cropping systems, but they are also concerned about their effects on crop emergence and yield. Understanding the effect of uneven emergence on cash crop yield is essential for promoting producer’s adoption of these new cropping systems. Corn planted directly into cover crops such as white clover and mixed grasses has decreased emergence rate and delayed development [5]. This reduction in corn development is partially the result of lower soil temperatures and slower increase in those temperatures in a perennial cover crop system. When cover crop growth is suppressed using strip tillage or herbicide suppression, soil temperature increases faster and its negative effect on the cash crop emergence and stand is limited [6,7]. The use of moderate tillage practices allows normal cash crop emergence while allowing the perennial groundcover to provide its environmental benefits. Seed size, sowing depth, and hybrid characteristics also could play a critical role on emergence depending on how the perennial groundcover or cover crop affects the soil and the environment in which the seed is placed. The single-plant yield decrease from a daily emergence delay of additional crop plants in a perennial groundcover system are little understood.
As corn breeders have steadily enhanced the genetic potential for hybrids to withstand greater competition at higher plant density, yields have continued to increase. Many studies have shown that breeders have increased corn yield potential by increasing adaptability of newer hybrids to perform under higher plant density stress [8,9,10]. Grain yield is a function of the number of plants per acre, kernels per plant, and weight per kernel. Of these factors, producers have most control over the number of plants per acre. With the average United States corn plant density increasing 300 plants per acre per year, it is crucial to understand the impact of plant-to-plant spacing and its effect on single-plant yield [11]. These higher-plant-density sowings may increase yield, but the economic optimum balance of cost and benefits is unknown and varies with seed cost and grain market value. It is crucial for researchers, breeders, and producers to work together to understand the impact of these higher plant density sowings and determine where the optimum balance is achieved.
Research into the effect of plant-to-plant spacing in corn has yielded mixed results. Some of the early research into plant-to-plant spacing within a row reported losses of up to 302.63 kg ha−1 for every 2.54 cm of deviation from the proper placement of the seed depending on population density [12]. Further research investigating higher-plant-density populations of newer hybrids saw a yield decrease of up to 228.65 kg ha−1 when the seed was placed ahead or behind the proper location by 2.54 cm [13,14]. Even with the advances in new sowing equipment, plant-to-plant spacing can vary and it is important to understand the effect of spacing on yield variation.
Currently, all research on plant-to-plant spacing variation has been conducted in conventional tillage systems. Plant-to-plant spacing effects could differ in a cover crop system, depending on how cover crop species affect competition with the cash crop. Our studies will help determine the effects of plant spacing in corn under a Kentucky bluegrass (KBG) perennial groundcover and a conventional system.
Understanding the effect of uneven emergence and plant-to-plant spacing of a cash crop grown with a perennial ground cover and a conventional tillage system could lead to increased crop yields and encourage producers to adopt these new conservation cropping systems. The objective of this study was to understand the effect of seed size and sowing depth on emergence and subsequent single-plant yield in a bare soil and on a Kentucky bluegrass (KBG) groundcover system.

2. Materials and Methods

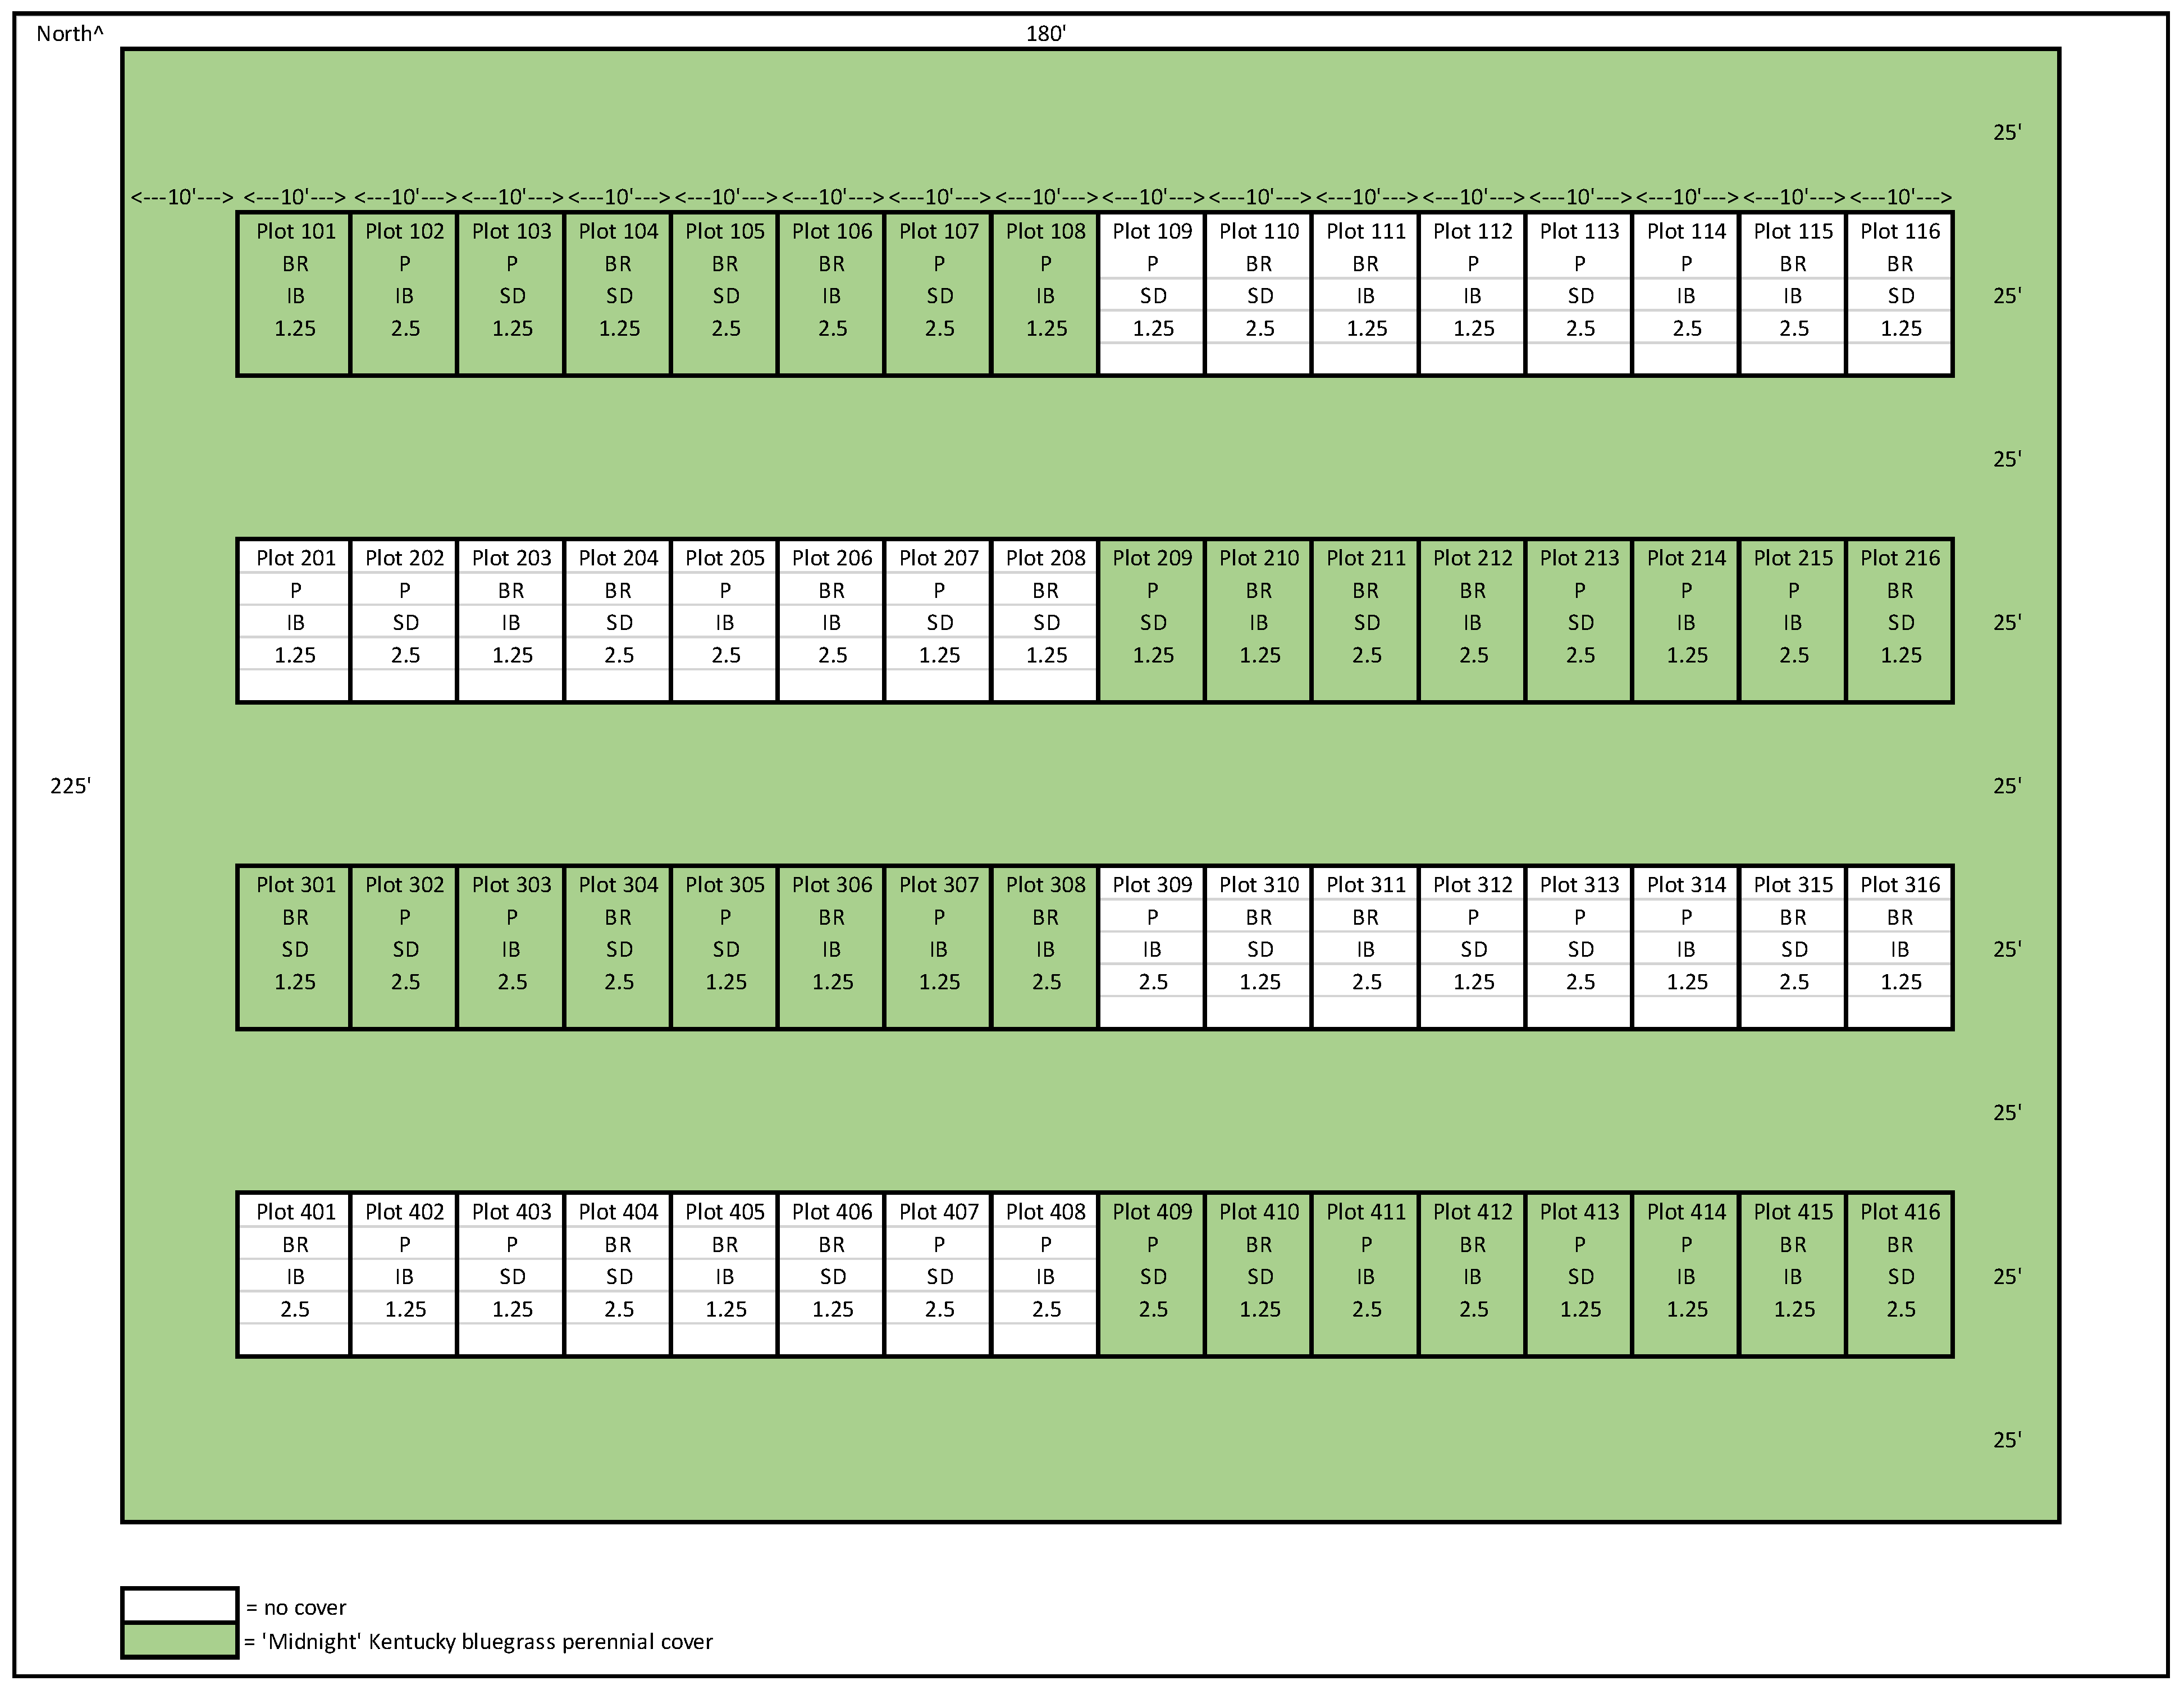
2.1. Field Plot Design and Sowing

The field experiments for this study were conducted at the Bruner Research Station (42°00′44.8″ N 93°43′57.3″ W) in Boone, Iowa, in 2019 and 2020. Soil at the research site is a Nicollet loam (Aquic Hapludolls, 85%), Clarion loam (Typic Hapludolls, 10%), and Webster loam (Typic Endoaquolls, 5%) which are somewhat poorly drained and have 1–3% slopes.
The field experiment used a split-plot design consisting of four 0.036 ha blocks (replications), that were split into two whole plot treatments: ‘Midnight’ Kentucky bluegrass (KBG) groundcover, or bare soil (Figure 1).
The KBG groundcover was seeded and established on 12 September 2018 in preparation for the 2019 and 2020 experiments. All plots were disked twice with a 4.57 m John Deere 210 disk (conical blades on 22.86 cm spacing) prior to seeding of the KBG. The initial pass was parallel to the length of field, and the second pass was performed at a 45° angle diagonally. All plots were tilled with John Deere 680 three-point mounted rotary tiller to a 15.24 cm depth. All plots were then rolled with a Brillion PPD-7 soil pulverizer/roller after tillage. KBG was planted at 48.2 kg ha−1 using a Tye Pasture Pleaser (model 104-4204) three-point mounted grain drill with 10 rows on 20.32 cm spacings at 0.64 cm depth. An additional 48.2 kg ha−1 KBG was planted using a Brillion Sure Stand Seeder (model SSPT-604) three-point mounted broadcast drill. Seeds were broadcast and packed into the upper 0.32–0.64 cm of soil. Total amount of KBG planted was 96.4 kg ha−1.
Eight subplot treatments were planted into each whole plot treatment (KBG cover or bare soil). The eight subplot treatments consisted of two different hybrids subdivided into two different seed sizes and planted at two sowing depths (3.18 and 6.35 cm). All subplot treatments were tested in combination with other subplot treatments.
Corn was established in the KBG cover using strip tillage to create a cover-crop free sowing area. Strip tillage was accomplished by first using a Unverferth model 330 Ripper Stripper (Unverferth Manufacturing Co., Shell Rock, IA, USA) (four-row, 76.2 cm spacing) with the ripper shanks running at a 30.45 cm depth and the coulters running at 10.16 cm depth. The total strip width was 38.1 cm. Following the Unverferth, a Maschio PTO (Maschio-Gaspardo North America Inc., DeWitt, IA, USA) driven gang tiller was used. The gang tiller has three gangs on 76.2 cm spacings. The gang tiller was placed directly over the original tillage strips and tilled to a 10.16 cm depth.
Tillage occurred perpendicular to the direction in which the KBG was planted. Each subplot was 3.05 m wide by 7.62 m long consisting of 4 rows (0.76 m spacing). Corn was planted with a four-row Kinze 3000 pull type planter (Kinze Mfg., Inc., Williamsburg, IA, USA) at 86,000 seeds ha−1. Corn was planted on 24 April 2019 and 24 April 2020. All seed samples were treated with Apron XL (Mefenoxam) (Syngenta) at 5.21mL kg−1 of seed and Maxium 4FS (Fludioxonil) (Syngenta) at 10.43 mL kg−1 of seed prior to sowing. Data were collected in 3.05 m from the middle of each of the two central rows of each subplot.
Fertilizer was applied seven days prior to corn sowing. Fertilizer was a combination of diammonium phosphate (DAP) and muriate of potash (MOP) blended together and applied at a rate of 33.63 kg N, 89.67 kg P, and 112.09 kg K ha−1. An additional 168.13 kg N ha−1 in the form of sulfur coated urea was applied as a band placed on the afternoon following corn sowing in the morning.

2.2. Seed

Seed graded as “Medium Flat” seed was used in this study, from two commonly grown hybrids in central Iowa: 70N16 CNV (Blue River Organic Hybrids, Ames, IA, USA) and P1197 (Corteva, Johnston, IA, USA). 70N16 CNV is a 114-day relative maturity and P1197 is a 111-day relative maturity hybrid. The same seed lot of 70N16 CNV was used in both 2019 and 2020. Different seed lots of P1197 were used in 2019 and 2020. Seed from each of these lots was resized using an AEC Hand Screen Shaker—TSV 90 (Applied Electronics Corporation, Saint Charles, IA, USA). Both seed lots were sized by using first the seed dimension of width and second by thickness. Seed sizes with width of 8.33 mm and 8.73 mm, and thickness of 4.76 mm and 5.16 mm from both hybrids were used as the “sized seed” category. For this study, two seed sizes per hybrid were used, either “unsorted seed” in the bag, or “sized seed” with a narrower seed size distribution.

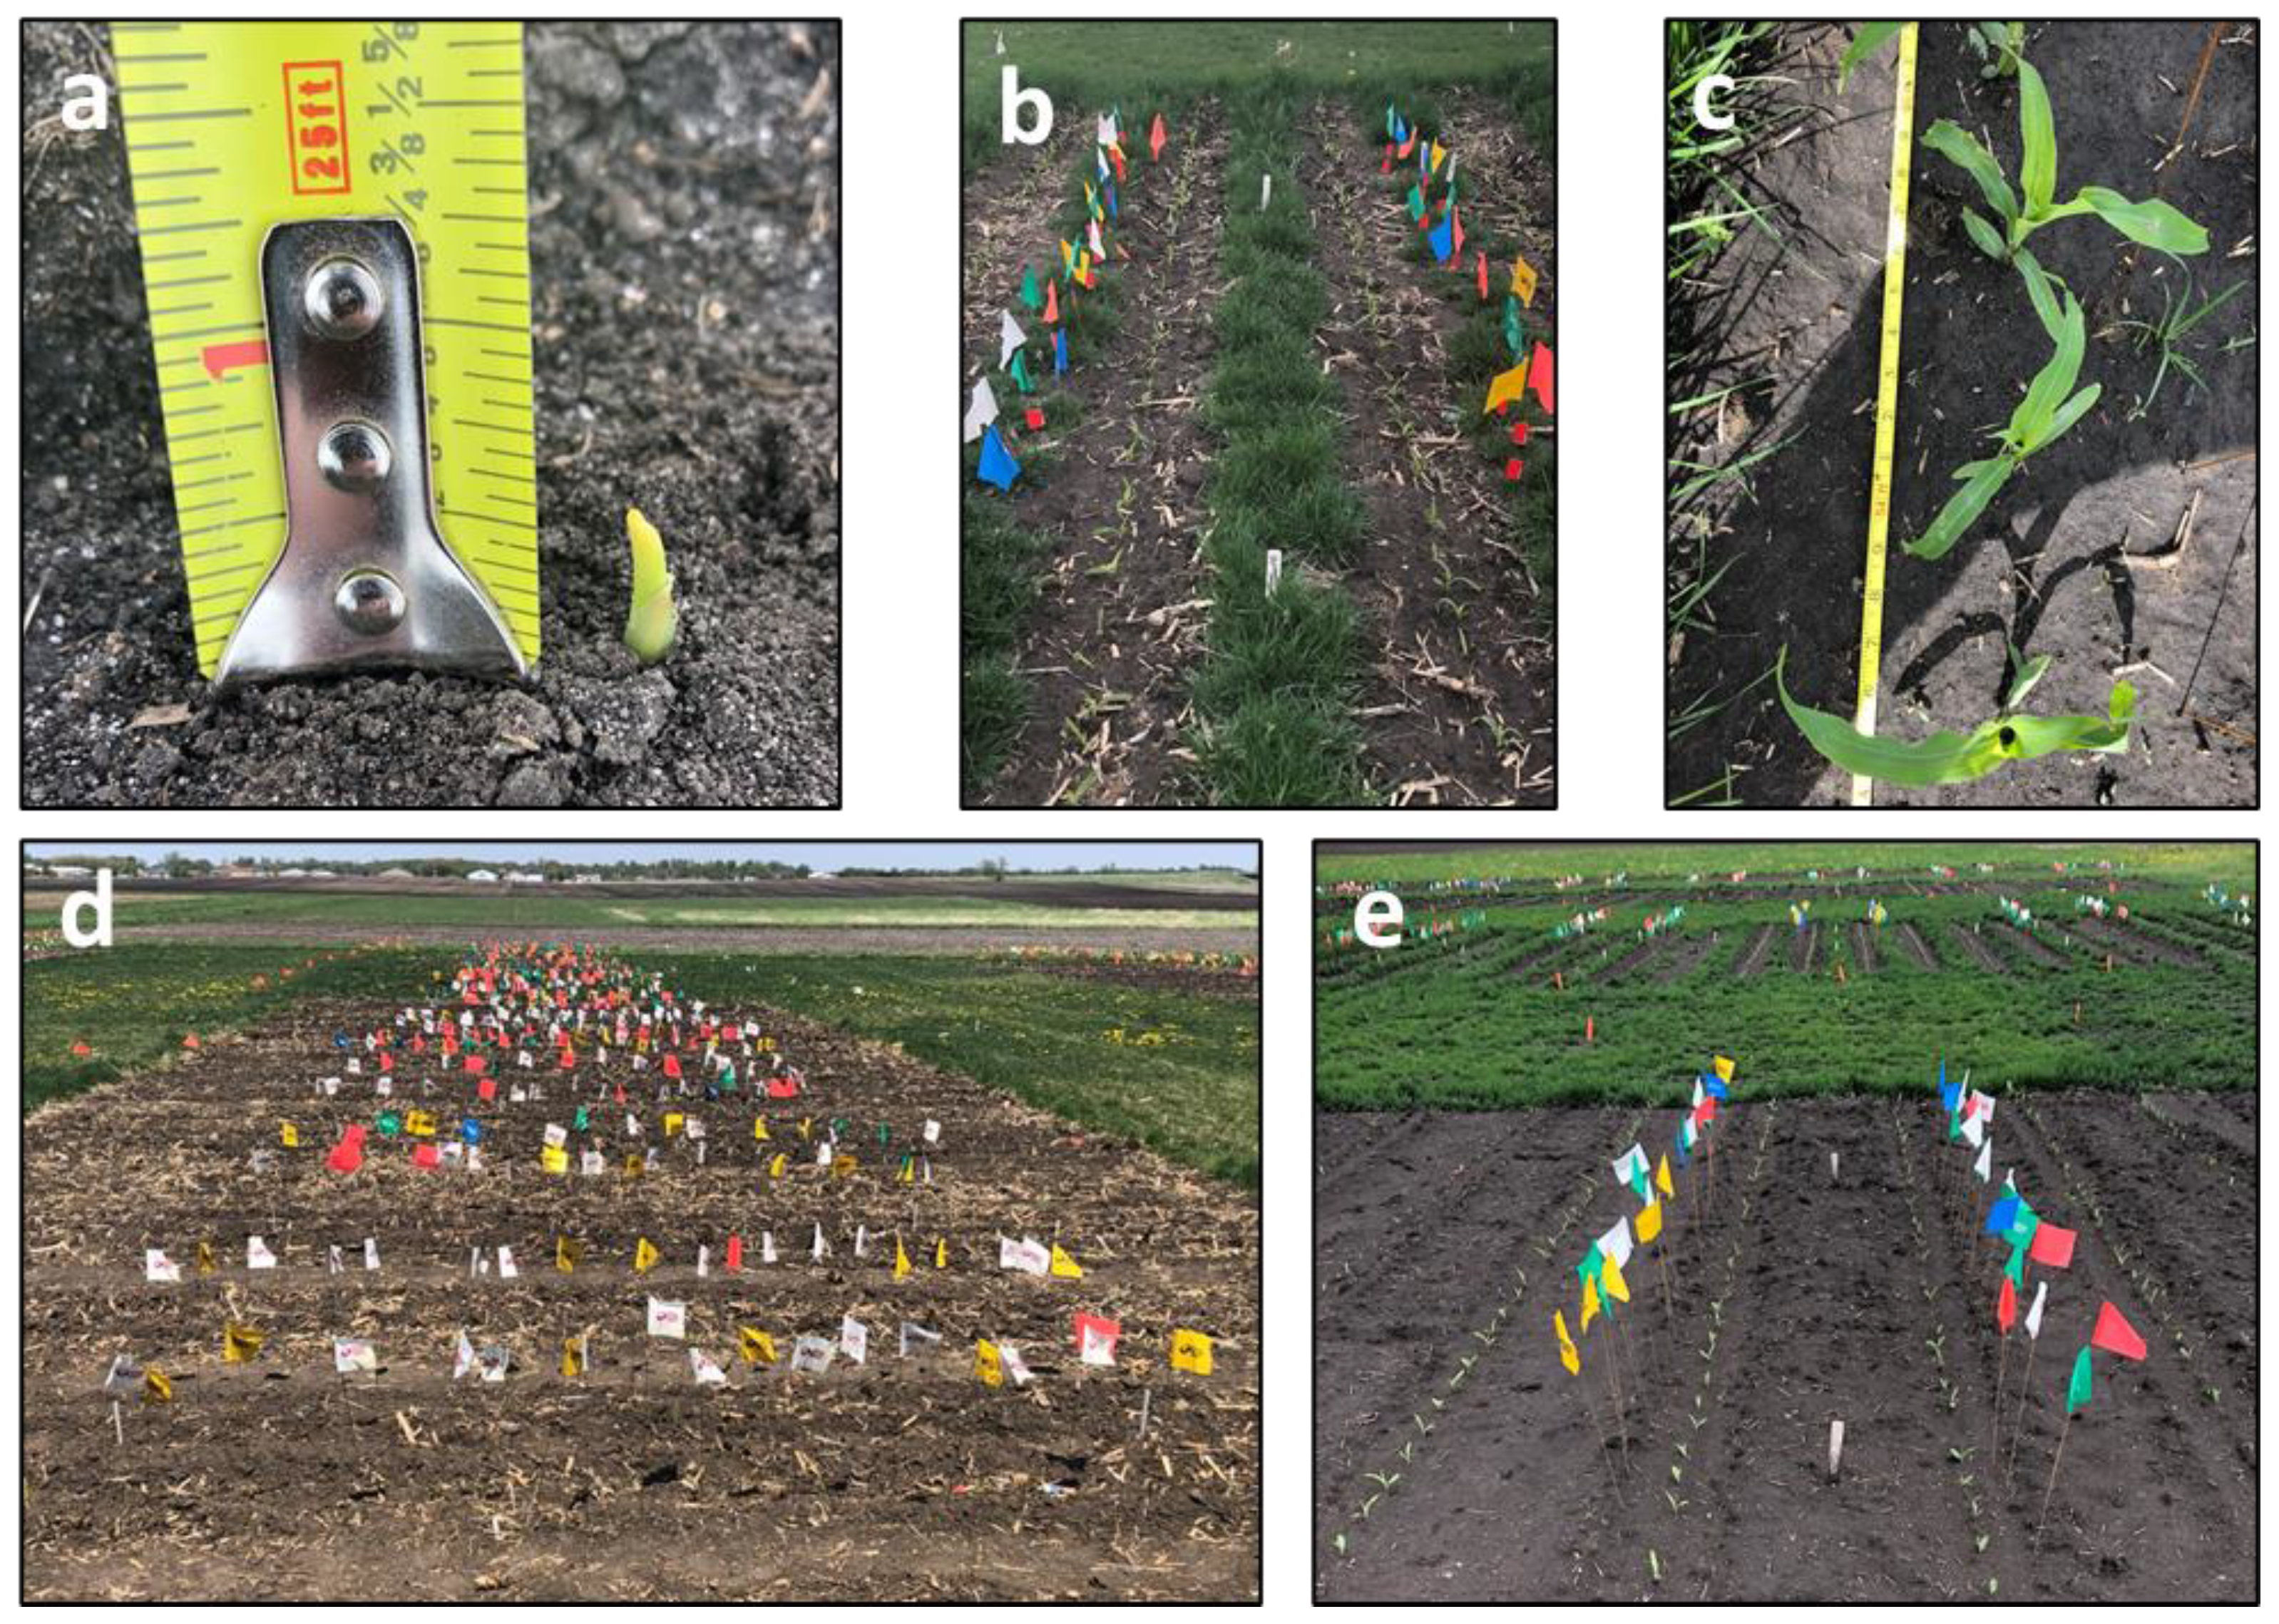
2.3. Field Emergence

Emerged seedlings from the central 3.05 m of the inner two rows of each plot were flagged daily, and the emergence date was recorded. A seedling was considered emerged when its coleoptile emerged at least 1.25 cm above the soil surface. Flags used were color-coded to facilitate visual identification of emergence date throughout the experiment (Figure 2). Emergence was considered complete after 16 days following the first emergence date recorded for each plot. Any additional plants emerging after day 16 were grouped with day 16 during data analysis. Total days to emergence was computed as the number of days after sowing until no further plants emerged. Final emergence percentage was calculated based on the number of seedlings emerged as a percentage of seeds planted.

2.4. Field Harvest

In both 2019 and 2020, each ear was harvested by hand, tagged, and dried at 42 °C for 48 h. Moisture concentration of each ear was recorded after drying using a SCiO micro-spectrometer (Consumer Physics Inc., Herzliya, Tel Aviv, Israel). Individual plant yield was calculated and normalized to 15% moisture. Harvest dates were 23 October 2019 and 1 October 2020.

2.5. Weather

The monthly mean temperature (°C), rainfall (mm) and growing degree units (GDU) on a base of 10 °C for the corn growing seasons in 2019 and 2020 are presented in Table 1.
Weather patterns varied in each year of the study. The number of growing degree units base 50 (GDU) accumulated from sowing to harvest, however, were very similar, with accumulations of 3173 and 3052 GDU in 2019 and 2020, respectively (Table 1). The GDU accumulated both years were slightly higher than the average values for the Bruner research farm of 2825 GDU at harvest. The year 2020 was a dry year, where 38% of the entire season rainfall occurred in the first six weeks following sowing. Additionally, in 2020, a large wind storm (Derecho) occurred on August 10th. Sustained winds from the storm in Boone, IA were 80 mph with gusts near 100 mph. The developmental stage of corn plants in bare soil plots was approximately 3–4 weeks post tasseling (VT) at the time of the storm and corn in the KBG plots was approximately 2–3 weeks post VT. This wind storm, coupled with dry conditions, was likely the cause of lower corn grain yields in 2020. This wind storm delayed corn growth and seed fill by 7–10 days with respect to a normal growth cycle. Plants in several plots had lodged, but very few plants were completely snapped. However, all plots were harvested in 2020 following the wind storm.
Precipitation in 2020 was half the amount recorded in 2019. The total precipitation in 2019 was 760.5 mm, while total precipitation in 2020 was only 389.6 mm. In 2019, average mean air temperature for the six weeks following sowing was below the normal average temperature typically recorded at the Bruner research farm. Precipitation from sowing to emergence in 2019 was 62.8 mm of rain and the average temperature was 11.1 °C. Low temperatures and high rainfall are known to stress corn seed and possibly caused the observed delayed corn emergence of 17 days after sowing. In 2020, the average rainfall following sowing was 2.3 mm and temperature was 15.9 °C and corn emerged at 11 days after sowing. Seed moisture content decreased earlier in the 2020 season and harvest occurred 22 days earlier (1st October) than in 2019 (23rd October). This difference in weather conditions caused a significant year effect and year by treatment interaction in the model, and some data were analyzed for each year individually.

2.6. Statistical Analysis

The field experimental design was a split plot design. The cropping systems (KBG or bare soils) were main plot factors; and hybrid, seed size and sowing depth were sub plot factors. Statistical analysis for field experiments was performed as a split-plot using the PROC MIXED procedure in SAS (SAS Institute, version 9.4, 2013). Analysis of variance was computed for data from each year. All factors were considered fixed except for blocks which were considered random. Mean separations were assessed using an alpha level = 0.05 using either the least significant difference or contrasts. Interaction terms containing blocks were pooled into appropriate whole-plot and subplot error terms. All tests of significance were performed at alpha = 0.05 unless otherwise noted.
Statistical analysis for single-plant yield based on emergence date was done using the PROC REG and PROC MIXED procedures in SAS [15]. Linear and quadratic regression models were fitted to yield based on emergence date. Lines were fitted using PROC REG and PROC NLIN. Intercepts, slopes, and model comparisons of the fitted lines were compared using PROC MIXED. Estimate statements (t-tests) were used to pull out and compare specific treatment combinations of interest.
Fitted models of emergence were obtained by using PROC NLIN in SAS. Logistic, gompertz, and monomolecular models were examined for the best model fit. The logistic model was chosen, as it fit well with emergence data in which all R2 values were greater than 0.99 (Tables S1 and S2). The logistic model used was: Single-plant yield = a/(1 + b ∗ EXP(−c ∗ emergence)). The suitability of each model was determined by calculating the approximate R squared value (1 − (SS Residual/SS Total)) and the standard error of the difference.
Emergence and yield models were separated by year, cover cropping system, seed size, and hybrid. Difference in emergence models were determined using PROC MIXED procedure in SAS. An ANOVA was conducted on the number of additional plants that emerged each day using a split-plot-in-time model. An alpha level of 0.05 was used to determine significance of emergence rate differences among main factors and interactions. Time dependence was assumed on the emergence and yield variables.
A normalized emergence pattern in addition to the standard emergence pattern was also analyzed. The normalized emergence was calculated by making the initial emergence date of both sowing depths patterns coincide. The first emergence day for the deeper (6.35 cm) sowing depth was set as the first emergence date for both, deeper and shallow (3.18 cm) sowing depth. This provided a narrower emergence window more similar to that observed in producers’ fields, and provided more replication for emergence date. The same statistical analyses were conducted on both standard emergence and normalized emergence.

3. Results

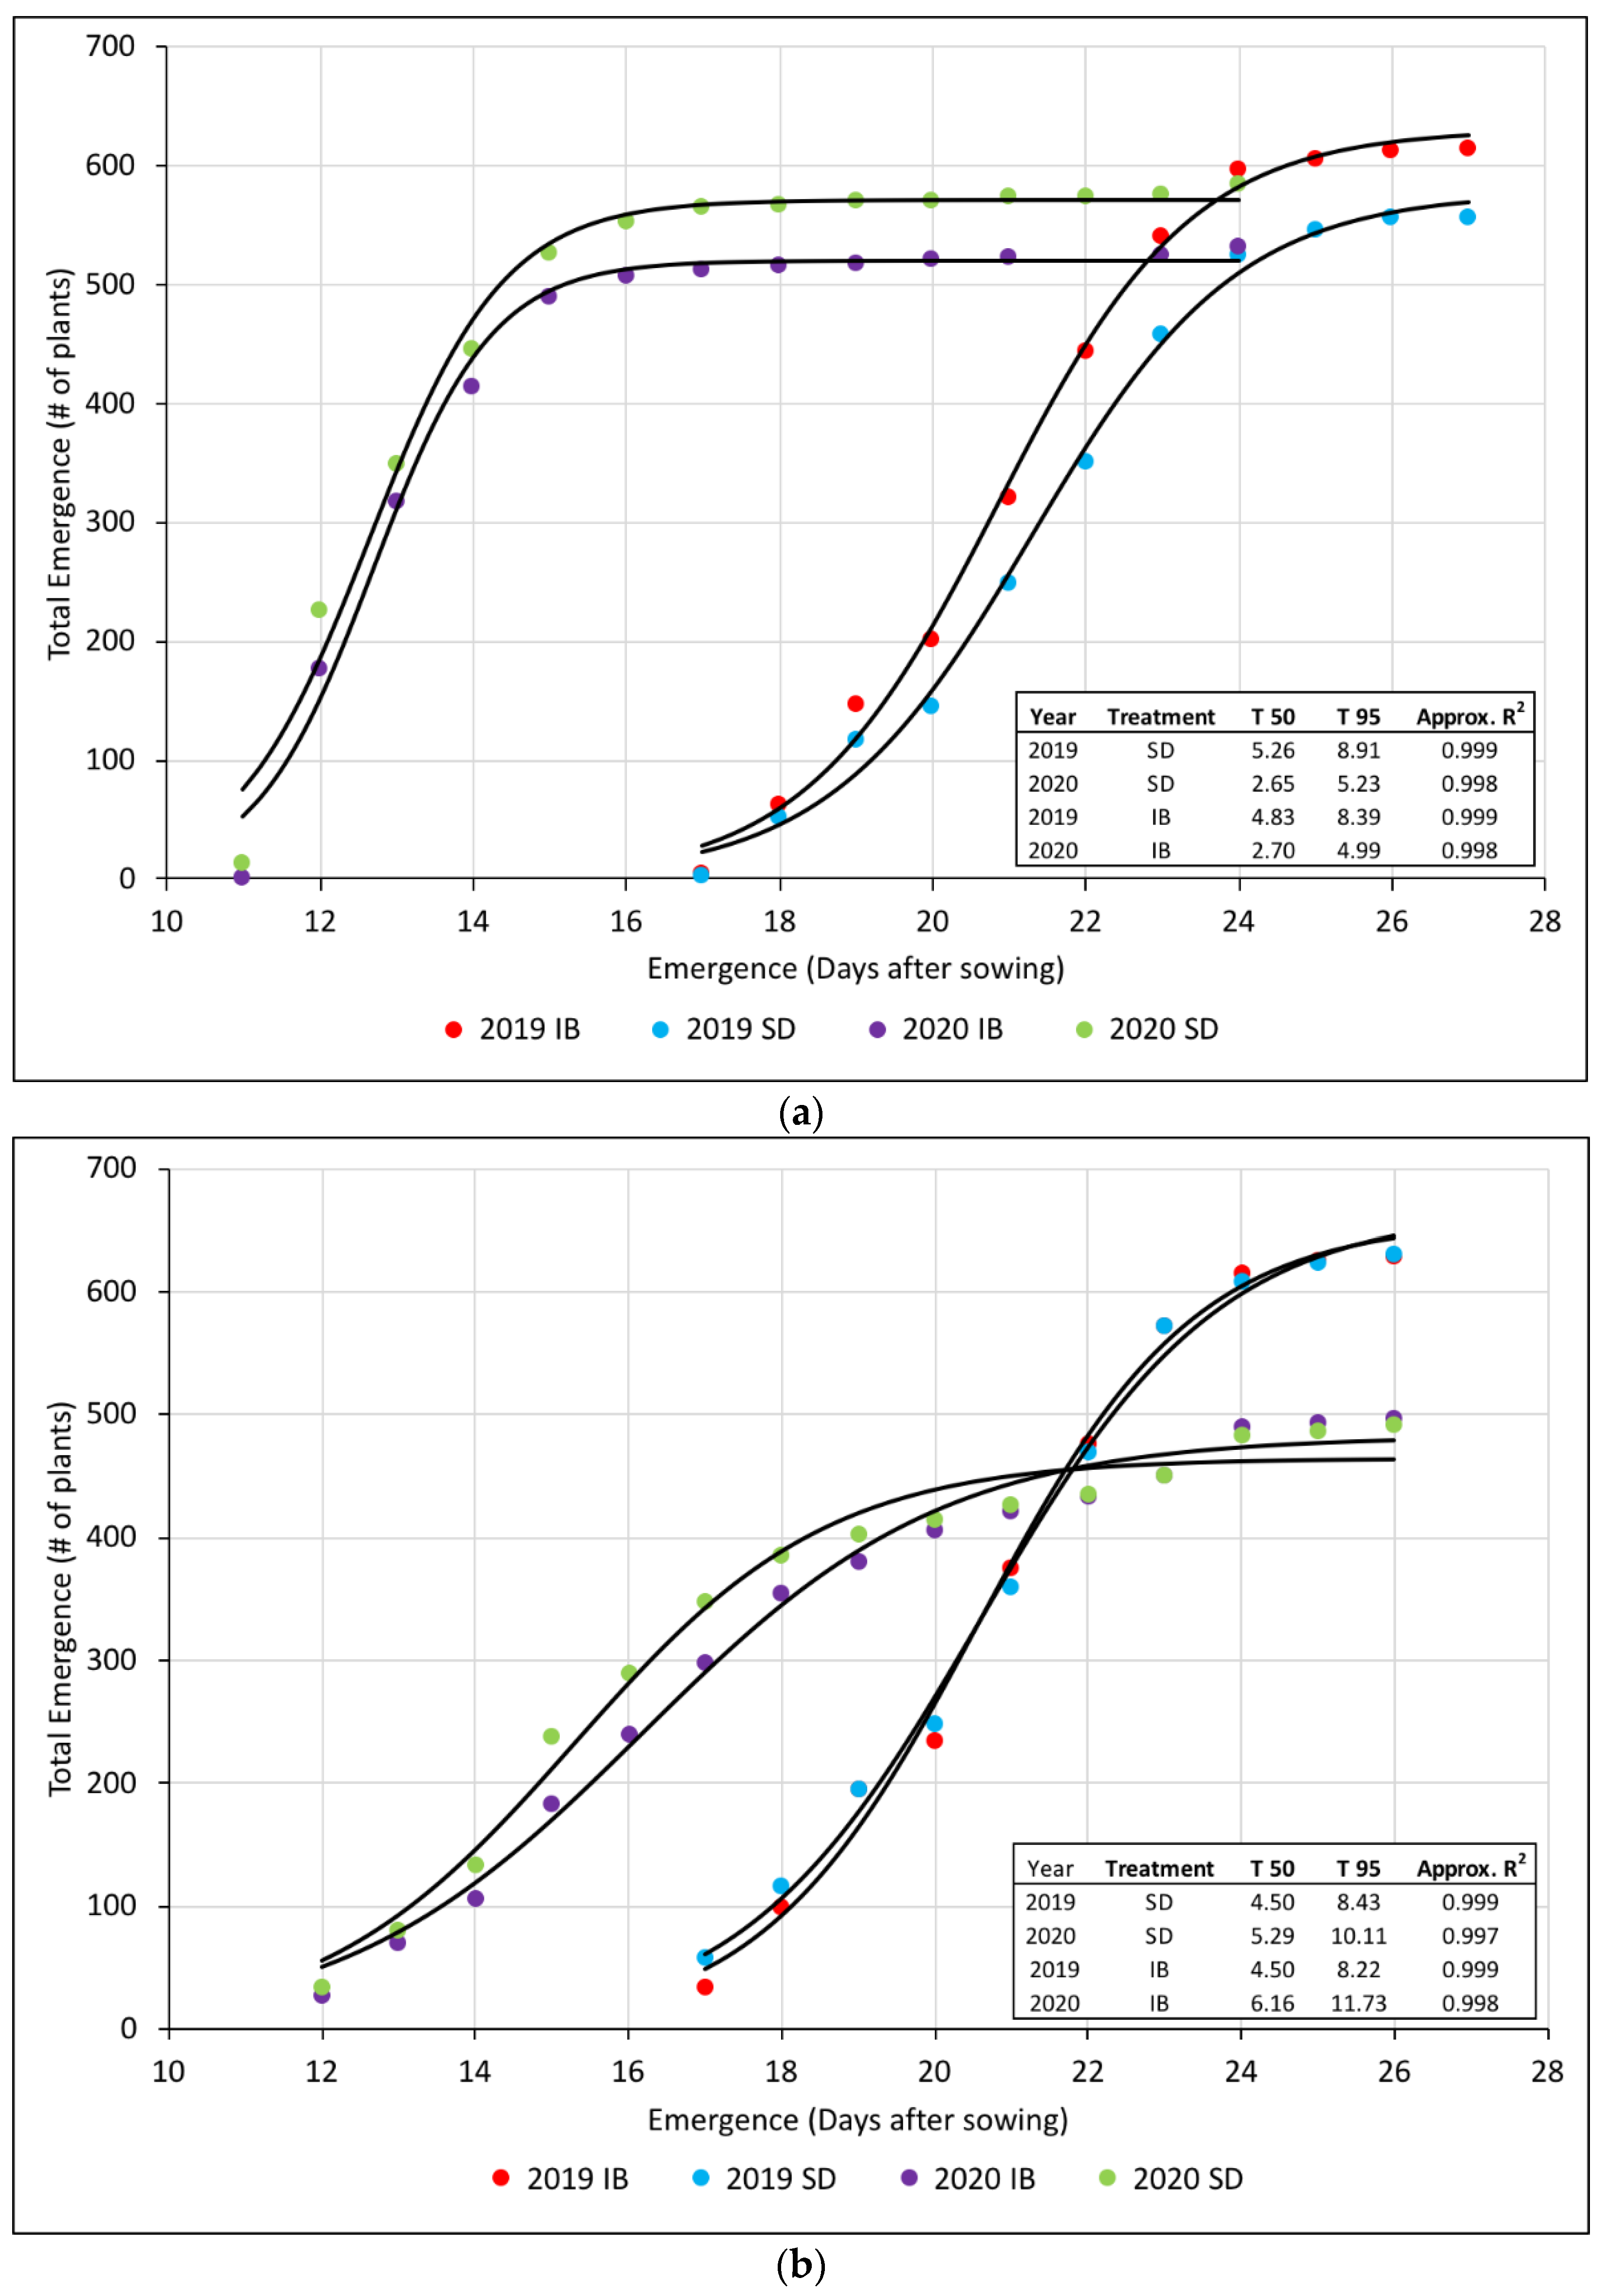
3.1. Field Emergence

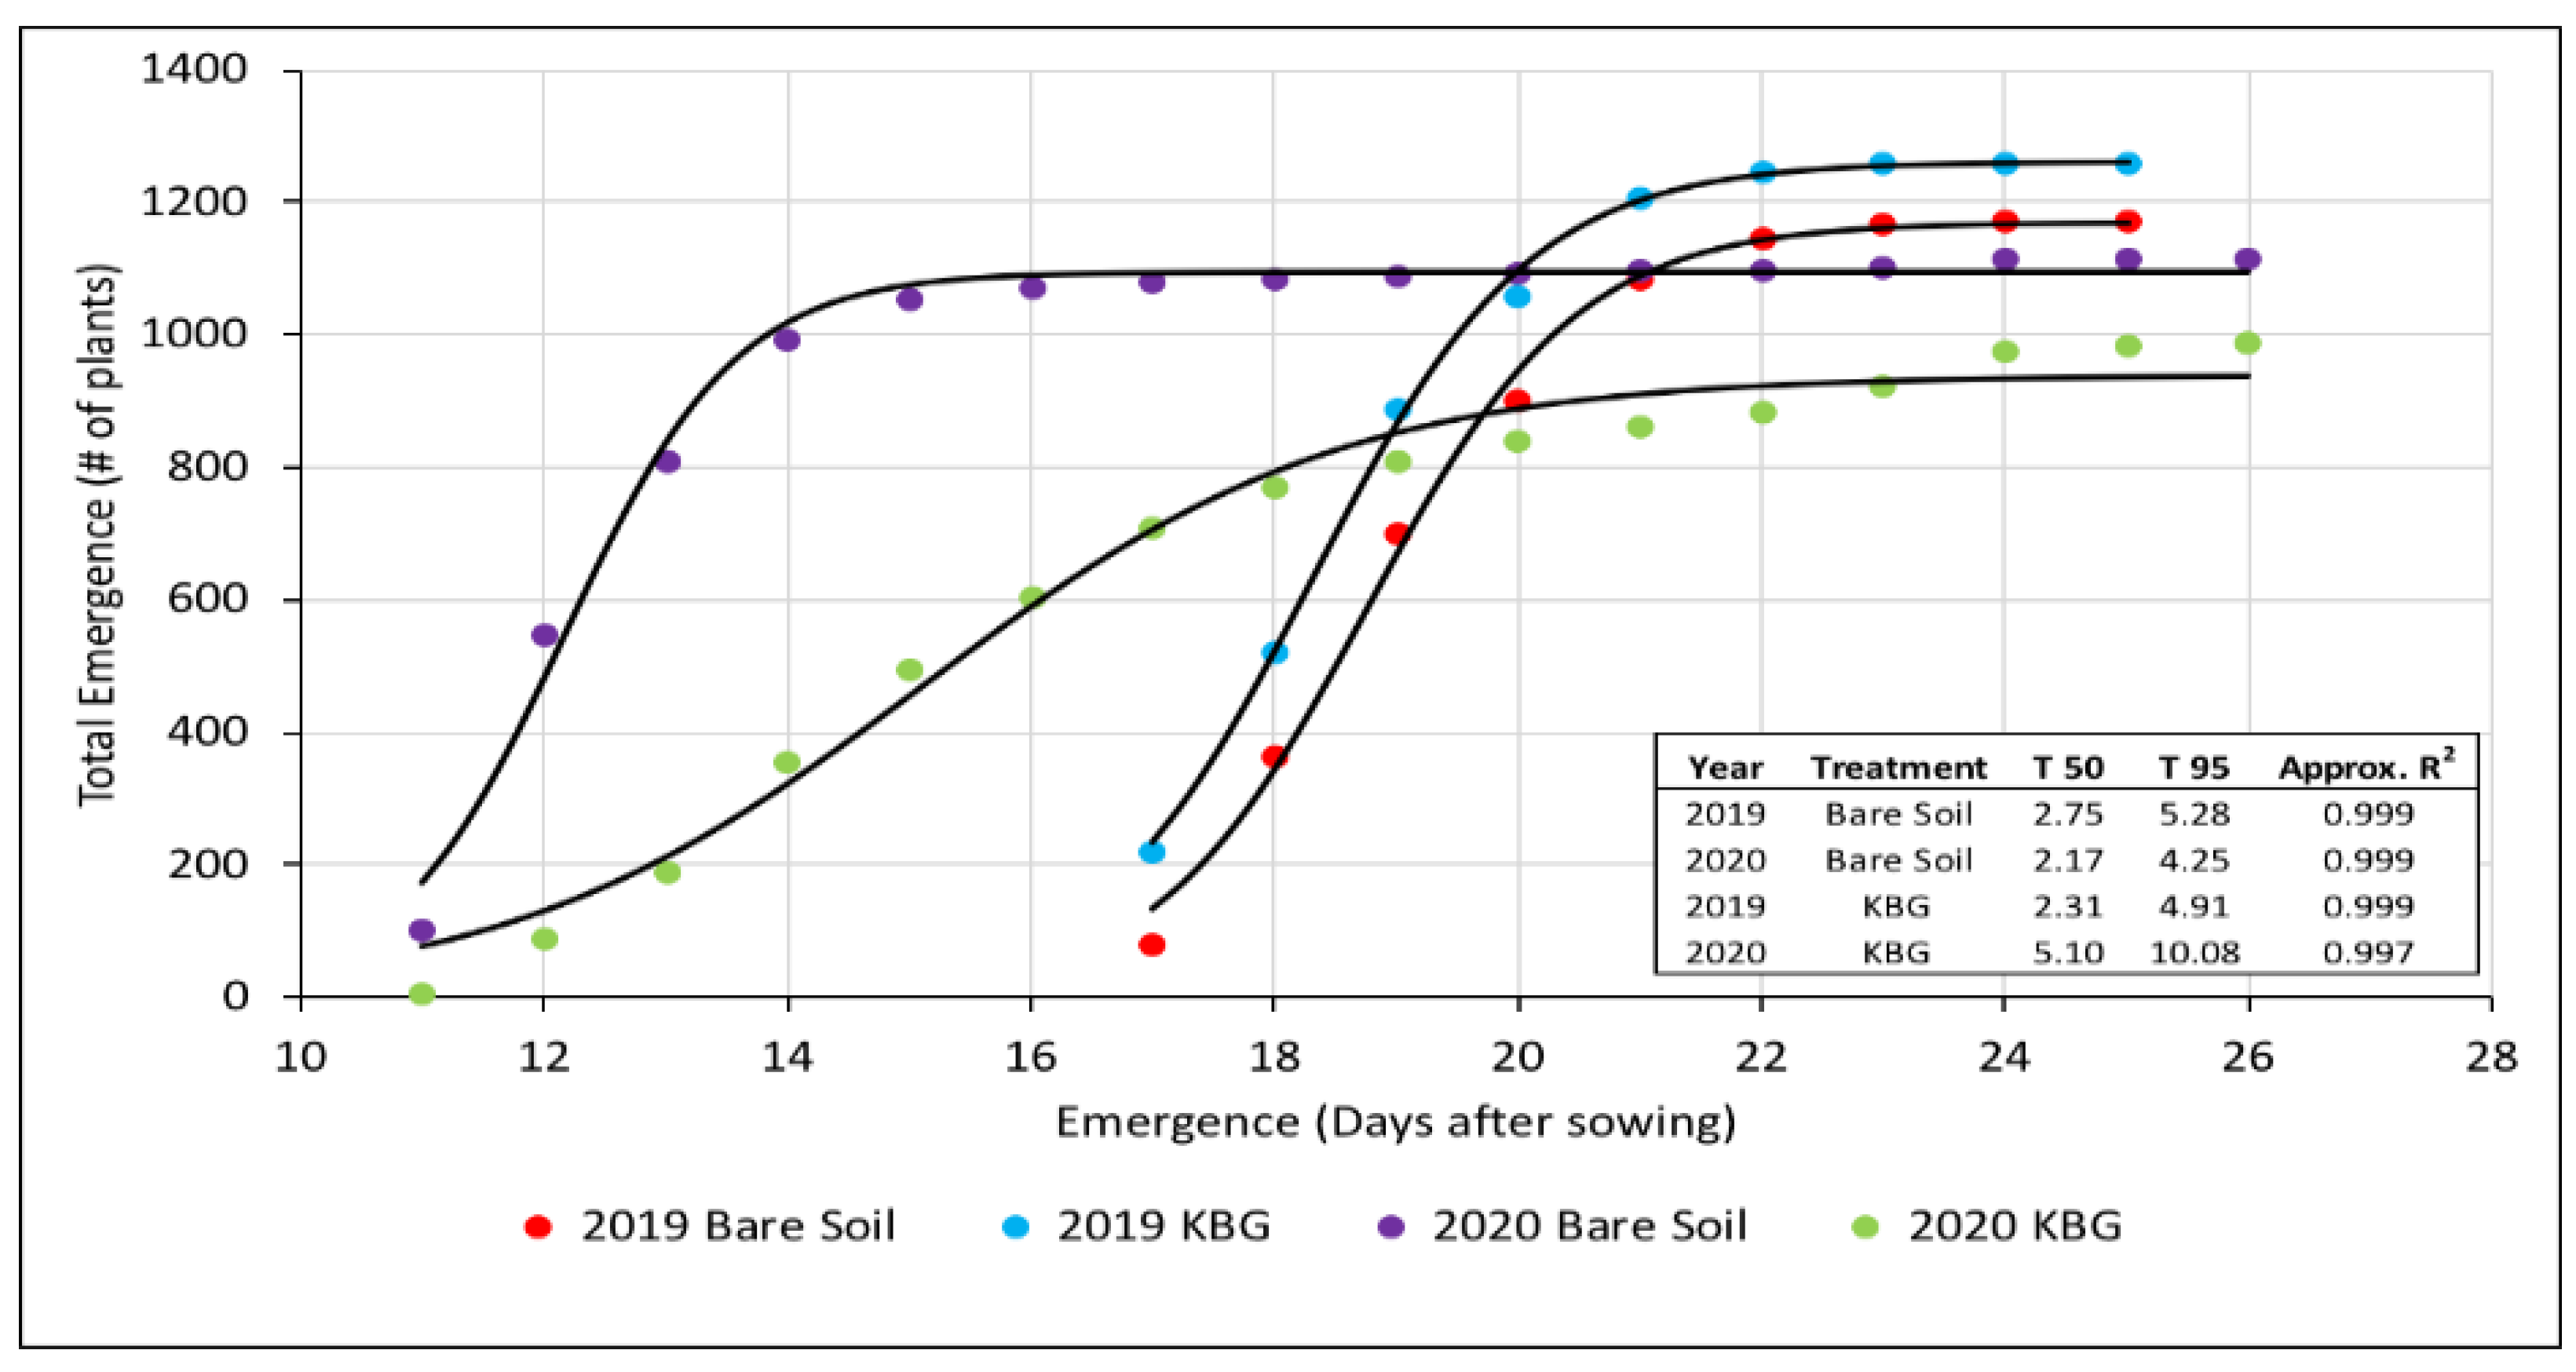
3.1.1. Bare Soil vs. KBG-PGC Cropping System

The cropping system showed a significant effect on emergence and grain yield. Because of this interaction, results are presented for each cropping system separately. Emergence patterns for corn plants in the bare soil and KBG cropping systems were significantly different in 2019 and 2020 as described by the logistic model. Table 2 includes the daily accumulated Growing Degree Units (GDU/Base 50) from sowing to emergence of all seedlings recorded in research plots for 2019 and 2020. GDU base 50 were calculated as: [Daily Maximum Air Temperature (°F) + Daily Minimum Temperature (°F)/2] − 50 °F.
Visual inspection and analysis of variance indicated that in 2019 bare soil and KBG plots had similar emergence patterns, with plants in KBG plots reaching 50% emergence 0.53 days (5 GDU) faster than in the bare soil plots. Even though corn plants in the bare soil plots were slower to emerge compared to KBG, they reached 95% emergence at the same time as the KBG plots (Figure 3). Parameter estimates for the logistic equations (Table S1) were similar in 2019, but differences were observed in 2020. Year 2020 provided a longer emergence window than 2019. In 2020, corn plants in the bare soil plots reached 50% emergence 3.02 days (11 GDU) faster than those in the KBG plots. The same trend continued as additional plants emerged, where corn plants in bare soil plots reached 95% emergence 5.62 days (30 GDU) faster than those in KBG plots (Figure 3).

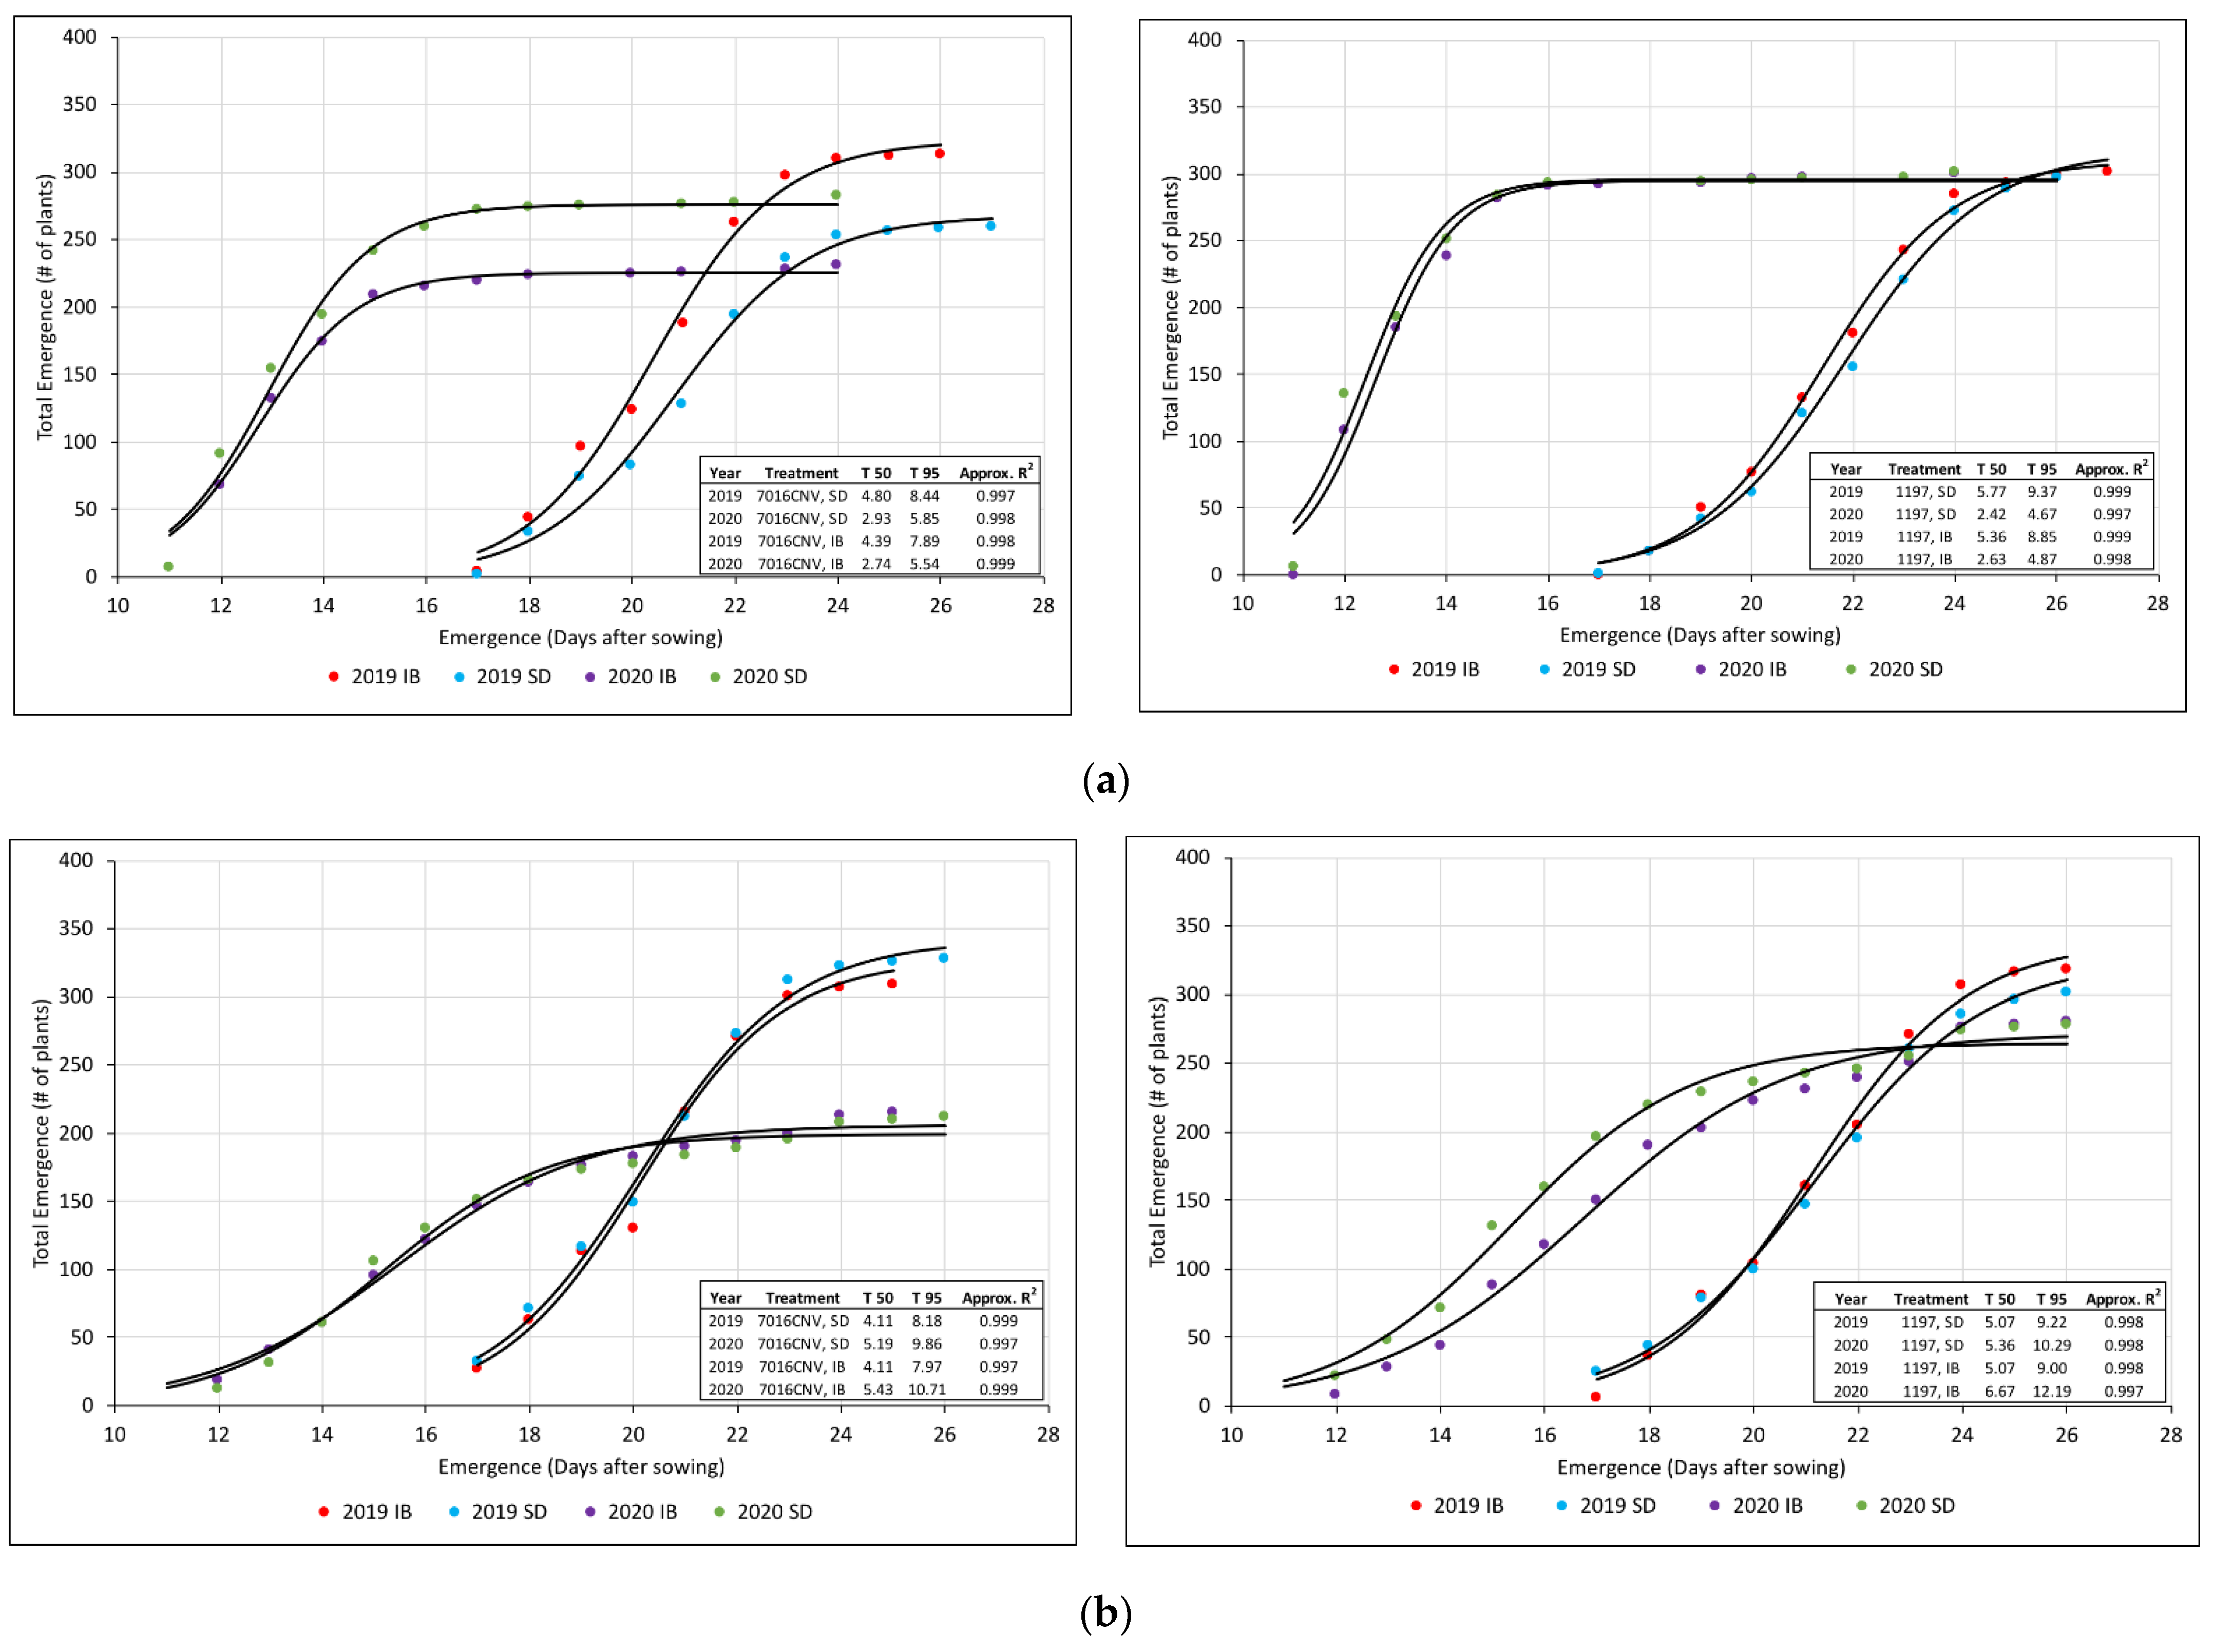
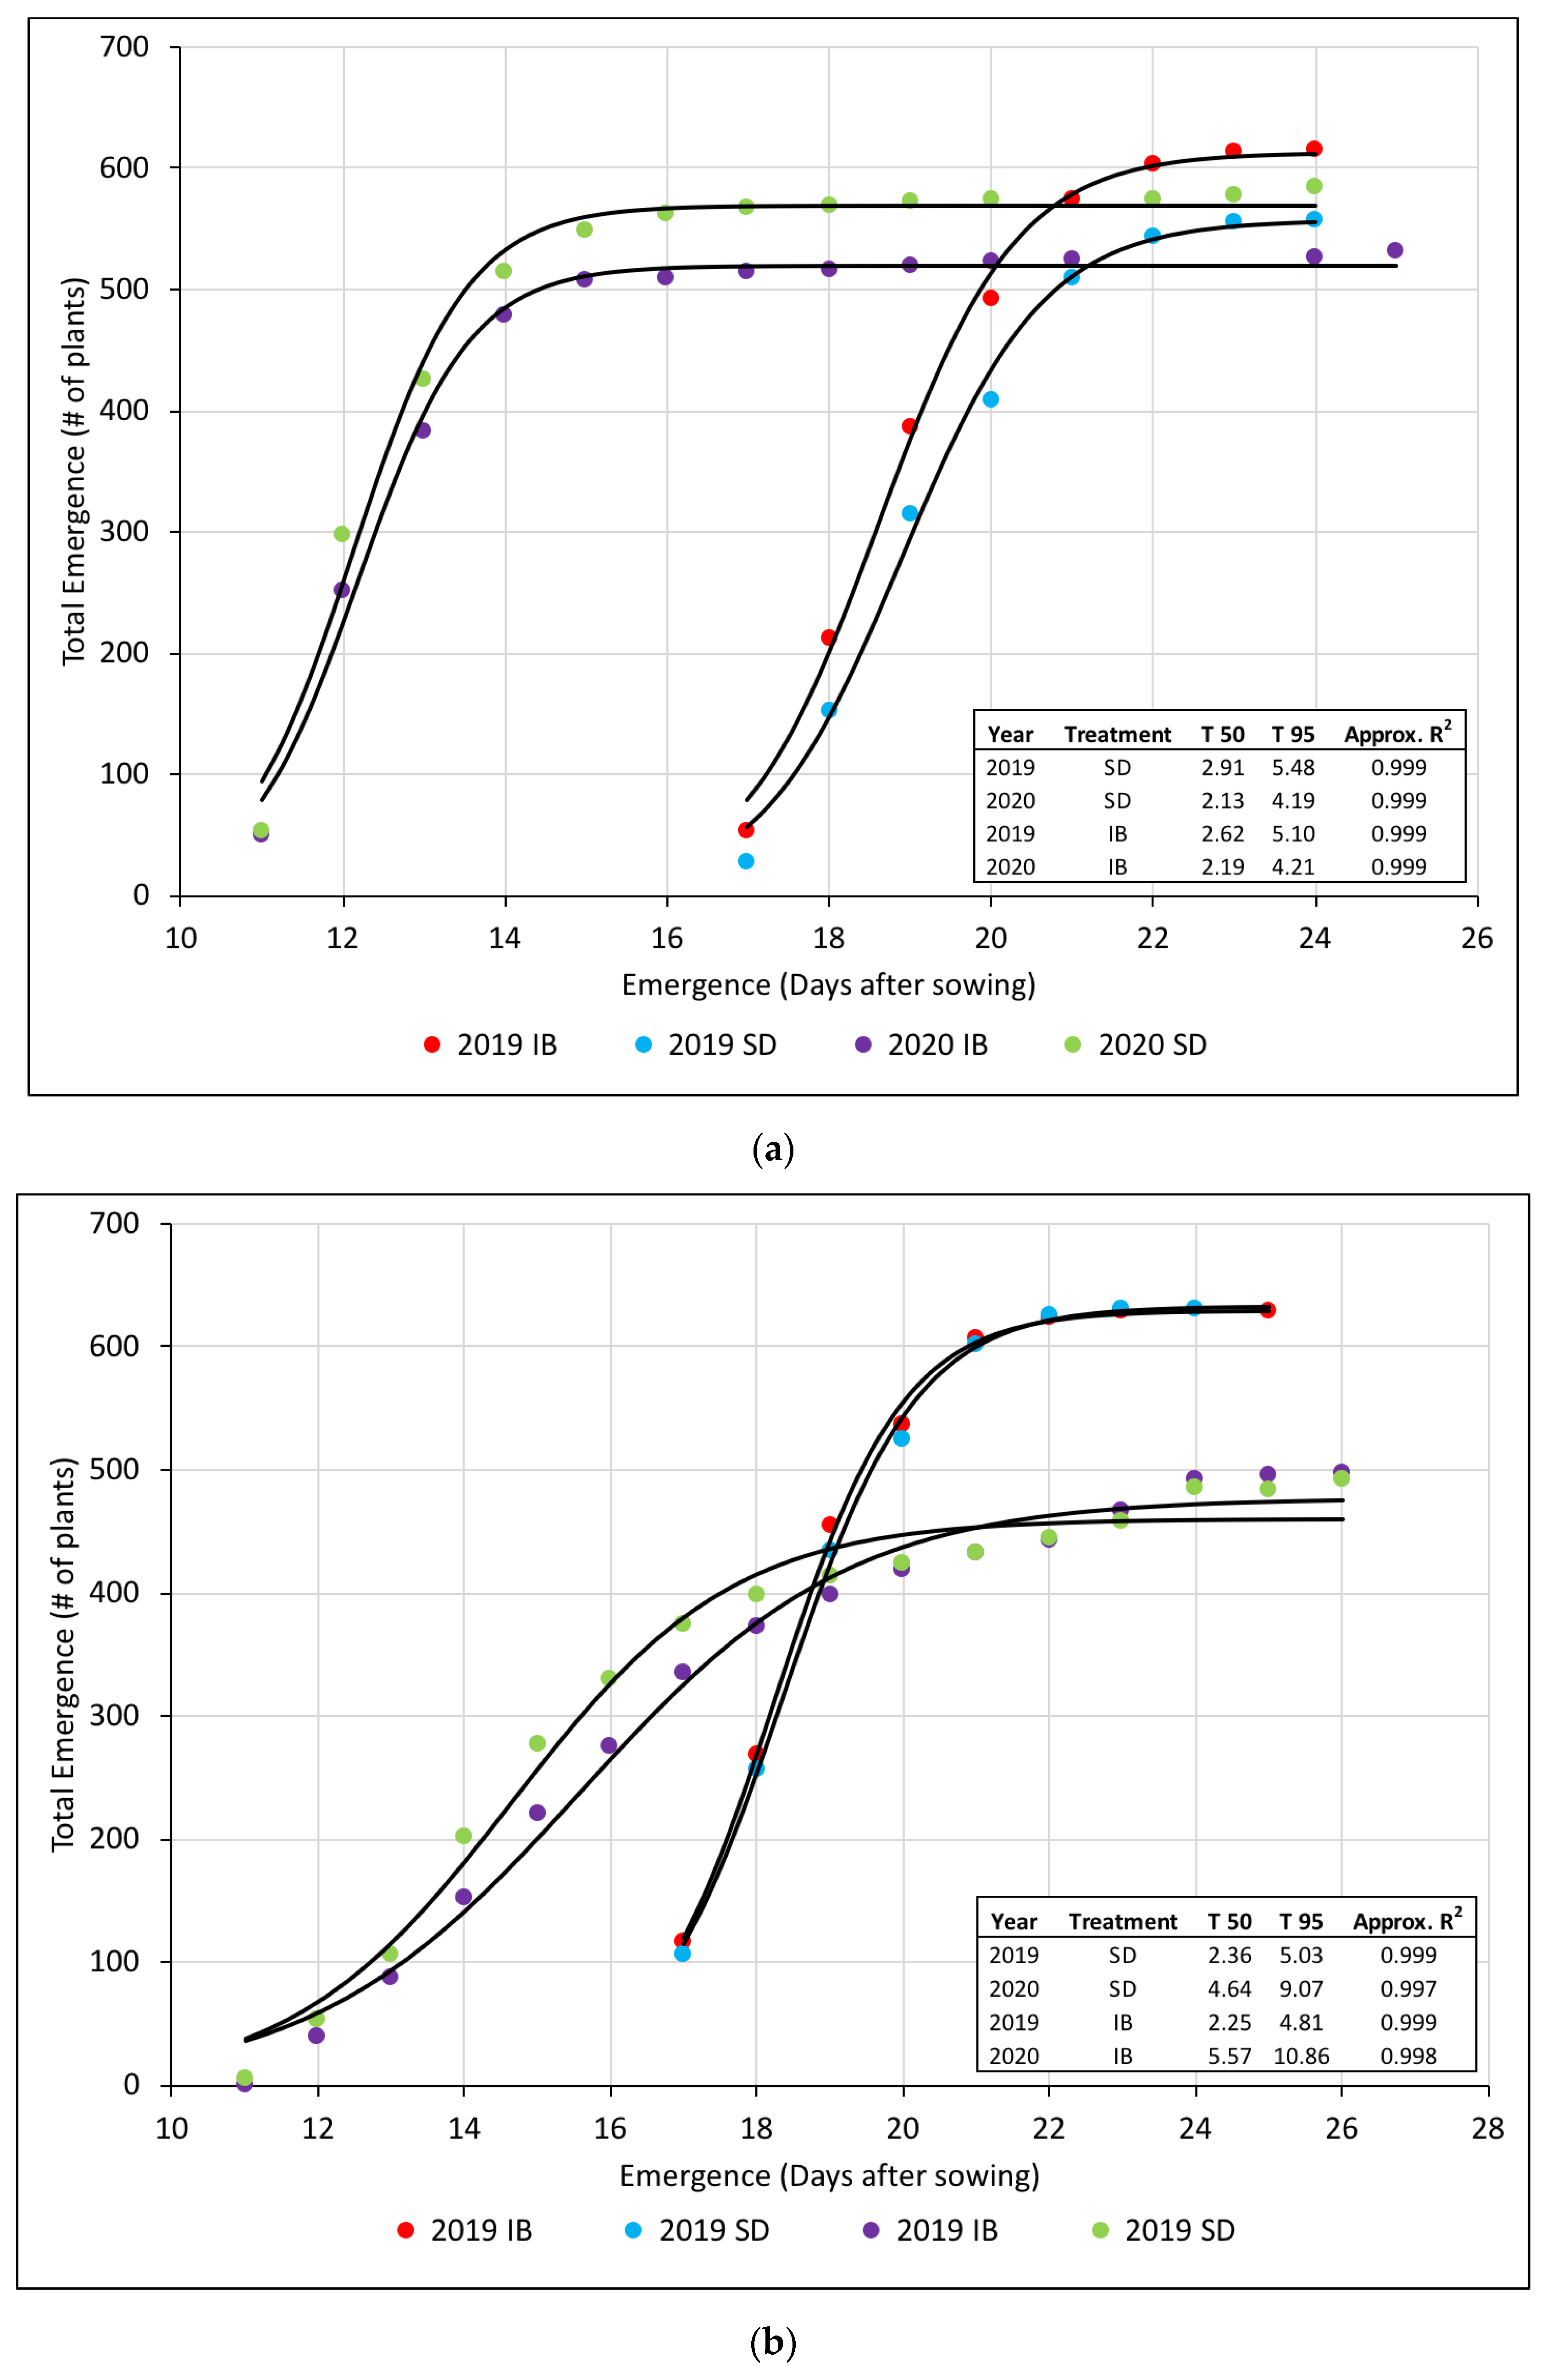
3.1.2. Seed Size in Bare Soil vs. KBG-PGC Cropping System

Seed size did not have a significant effect on seedling emergence parameters in both cropping systems. Logistic models and analysis of variance indicated small differences among emergence rates in bare soil plots in both 2019 and 2020. A slightly faster rate to 50% emergence (0.43 days, 4 GDU) for seed from the bag was observed in 2019 (Figure 4a). Conversely, there were no significant differences in 2020 as sized seed and unsorted seed from the bag reached 50% emergence at the same rate (Figure 4a). In KBG plots, there were very small emergence differences associated with seed-size. There were no emergence differences between seed sizes in 2019 (Figure 4b). In 2020; however, sized seed reached 50% emergence 0.87 days (5 GDU) earlier than unsorted seed from the bag (Figure 4b). Confirmation of this different emergence trend was observed in the logistic fitted equations (Table S1). Equations were very similar in both 2019 and 2020, but analysis of variance indicated differences in 2020.

3.1.3. Hybrid and Seed Size Interaction in a Bare Soil vs. KBG-PGC Cropping System

Emergence rate based on hybrid and seed size were significantly different. These results showed evidence of an interaction between genotype and seed size. Nonlinear regression and analysis of variance indicated no emergence differences based on seed size for hybrid 1197 in the bare soil cropping system in 2020. A small difference was observed in 2019, where unsorted seed from the bag emerged 0.41 days (4 GDU) faster than sized seed. Visual confirmation of these results showed a near overlap of the logistic fitted models (Figure 5a). However, significant differences in emergence were observed for hybrid 7016CNV. Unsorted seed from the bag of 7016CNV reached 50% emergence 0.41 days in 2019 and 0.19 days in 2020 earlier (3 and 1 GDU, respectively) in the bare soil cropping system. Figure 5a represents the total number of plants to emergence in 2019 and 2020. Both years some of the early emerging seedlings were lost due to ground squirrels. Smaller differences in emergence patterns were observed in KBG plots compared to bare soil plots. Following the same trend as the bare soil plots, no differences were observed for 1197 emergence in 2019. Conversely, in 2020 sized seed reached 50% emergence 1.31 days (7 GDU) faster, and 95% emergence 1.90 days (9 GDU) faster (Figure 5b). There were very small differences in emergence for 7016CNV based on seed size in KBG plots. Model parameter comparison and analysis of variance indicated no significant differences in 2020 between seed size. In 2019, a very small difference was observed in which unsorted seed from the bag reached 95% emergence 0.21 days (4 GDU) faster than sized seed. This was confirmed by analysis of variance. However, there were no differences in the rate to 50% emergence.

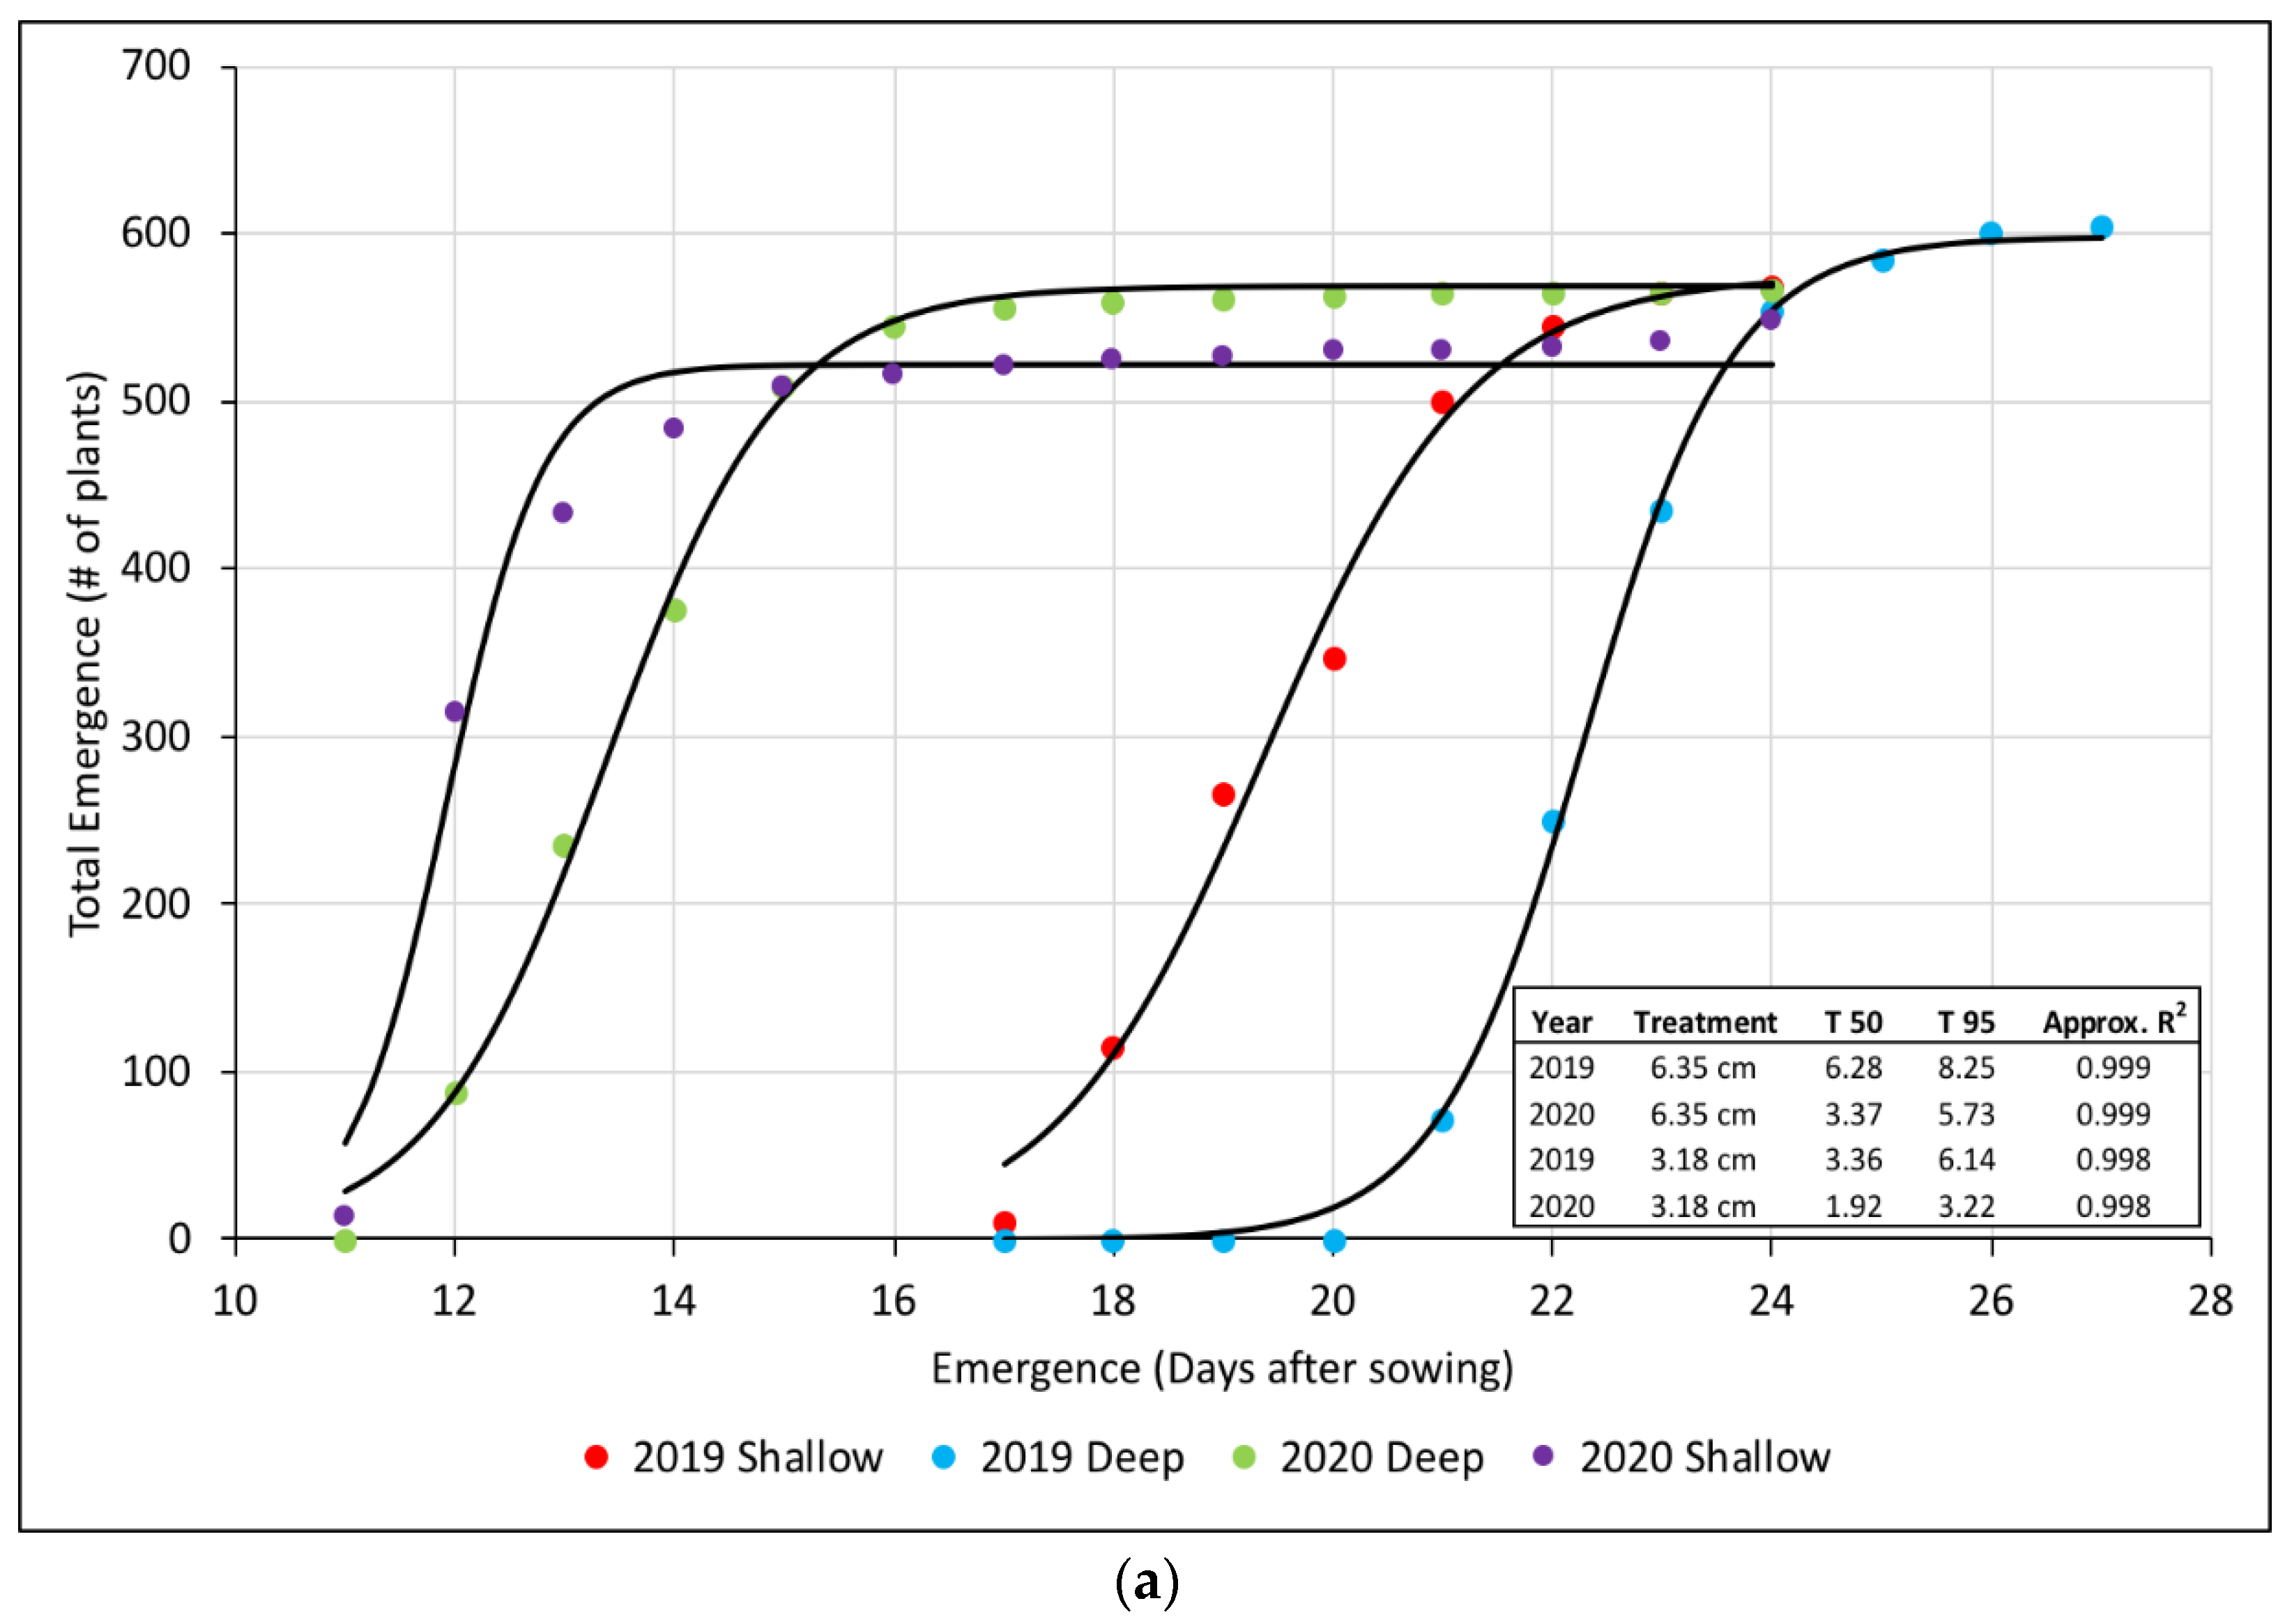
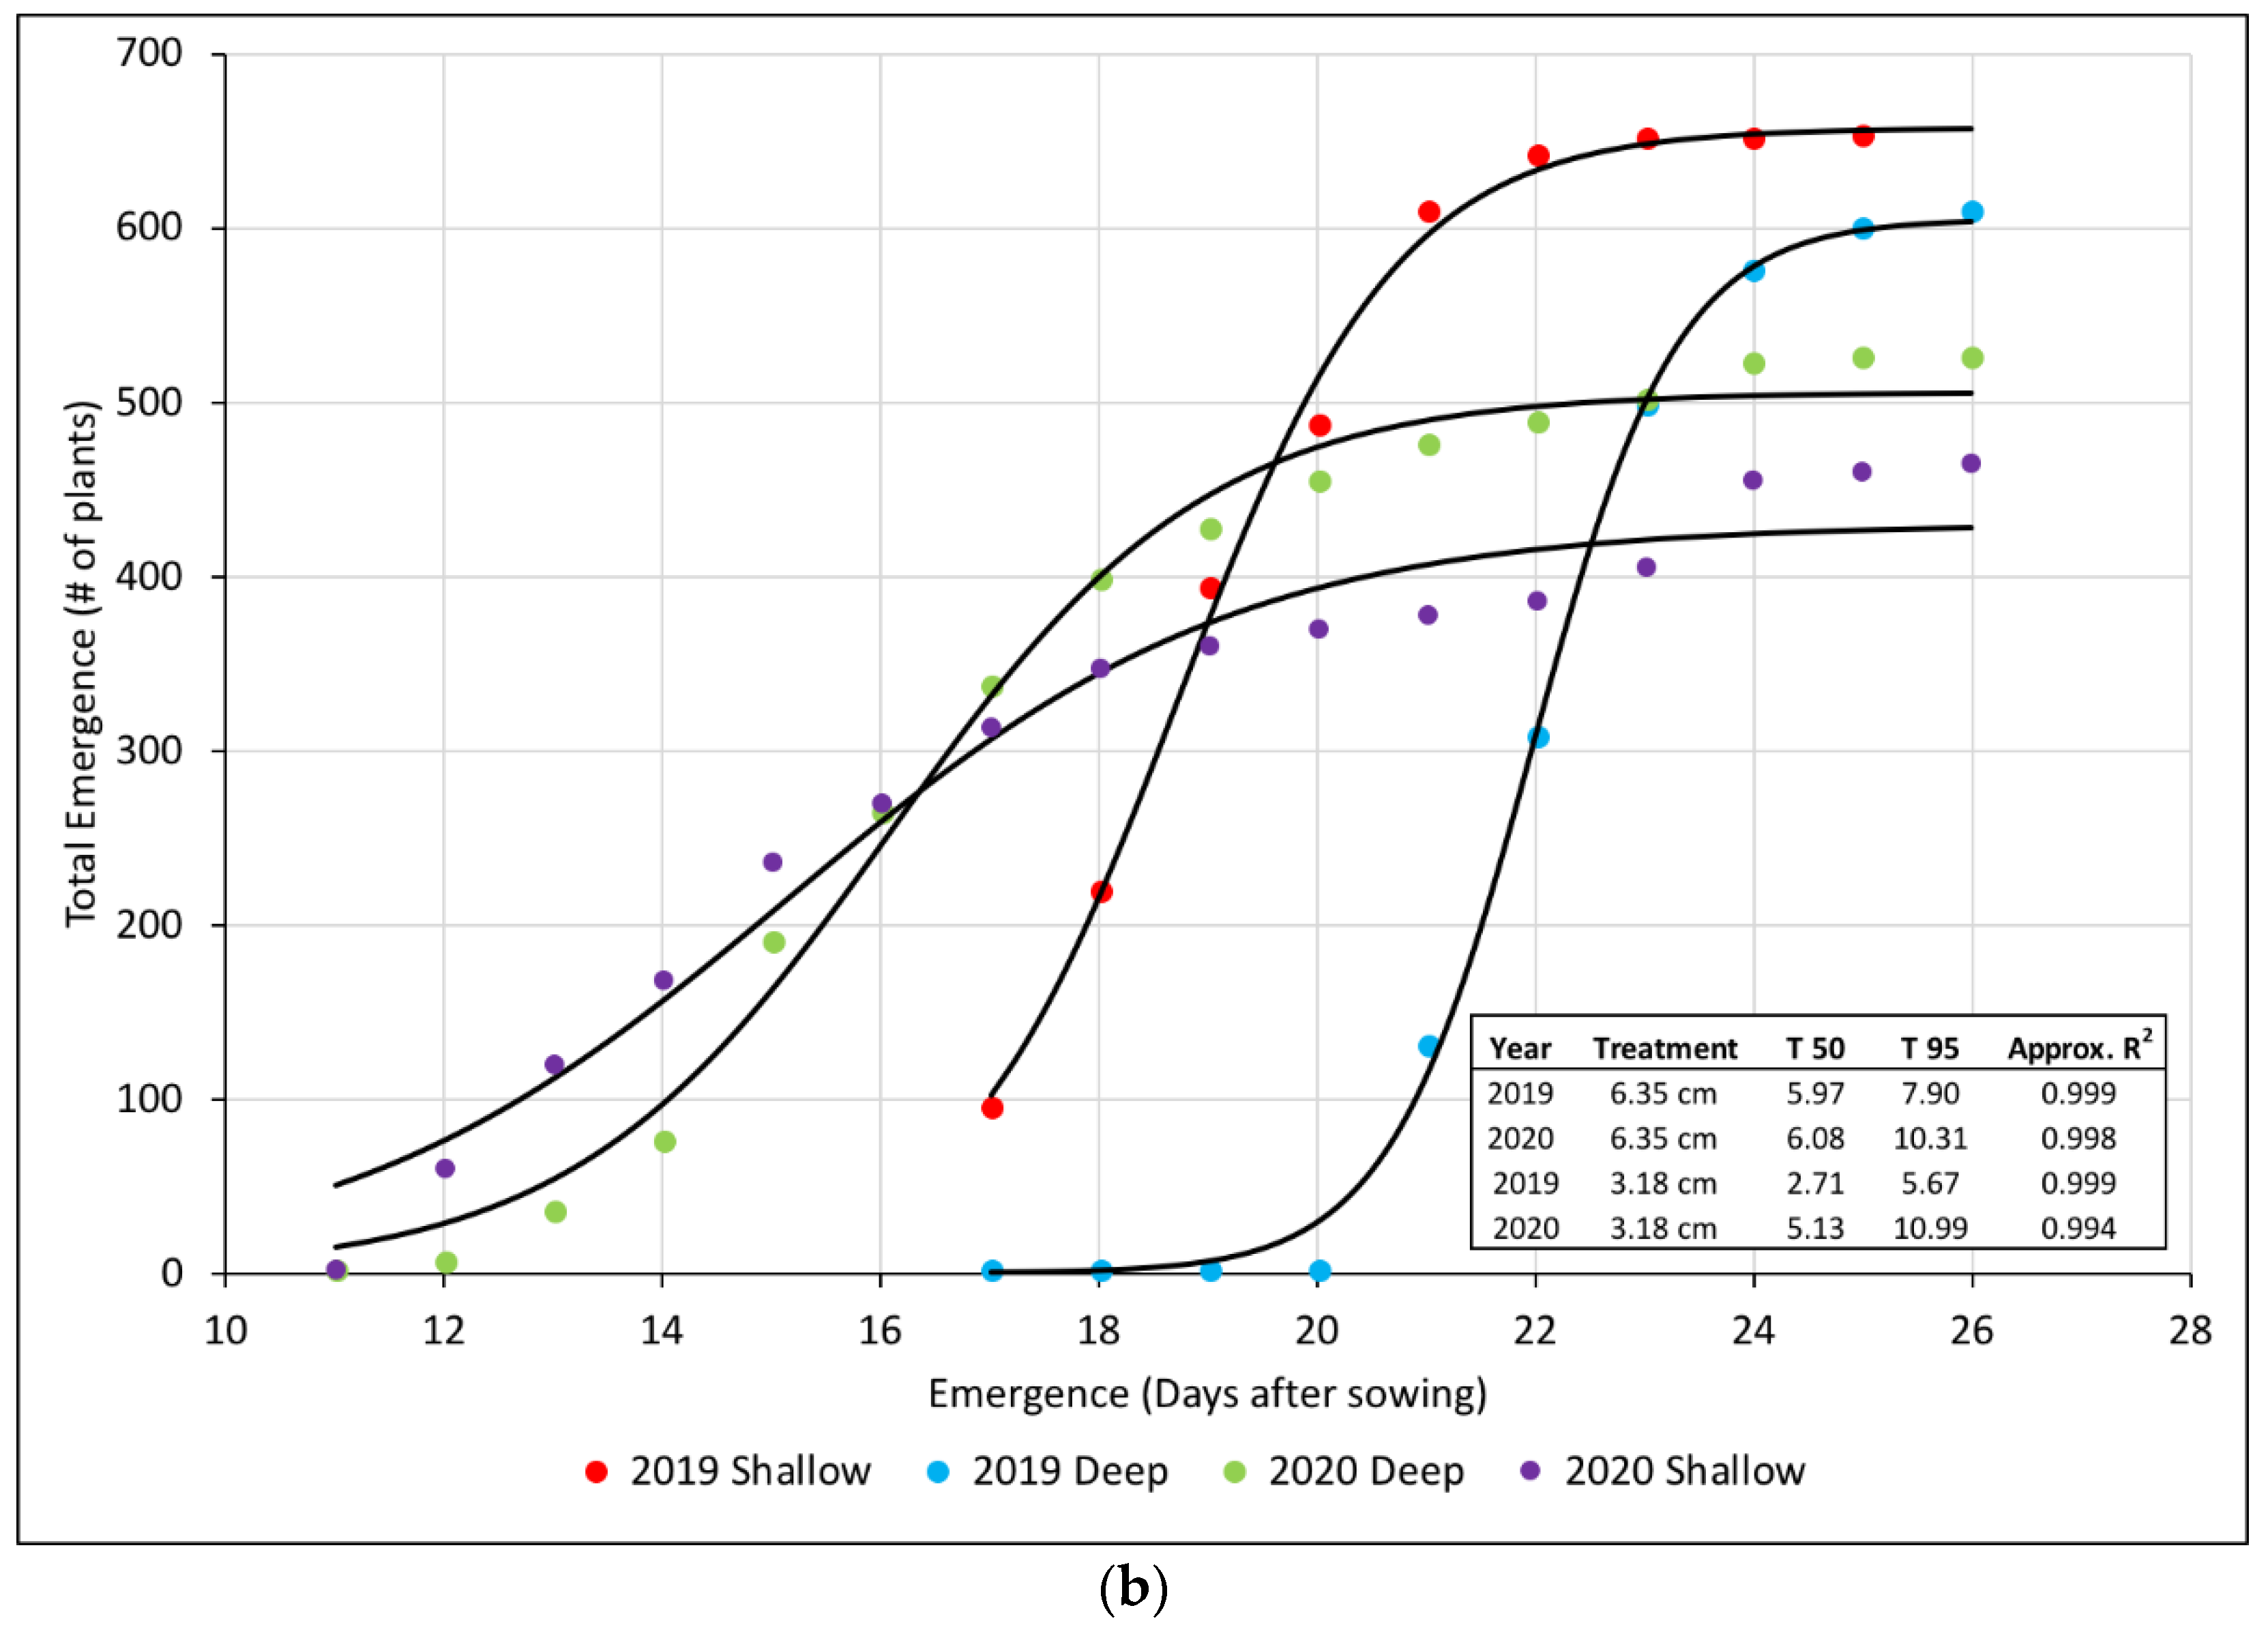
3.1.4. Sowing Depth in Bare Soil vs. KBG Cropping Systems

The logistic model for sowing depth showed a difference in emergence pattern. Deeper sowing depth in both 2019 and 2020 showed a delay to 50% emergence in both cropping systems (Figure 6a,b). In the bare soil system, a deeper sowing depth had a delay of 2.92 and 1.45 days (24 and 4 GDU) in the time to 50% emergence in 2019 and 2020, respectively. A similar trend was observed in deeper planted seed in the KBG system where delays of 3.26 and 0.95 days (22 and 6 GDU) were observed in each respective year. Differences in emergence between sowing depths are represented in Figure 6. Parameters in the logistic fitted models (Table S2) showed a greater difference between sowing depth models, than between models for any other main factors.

3.2. Normalized Emergence

3.2.1. Bare Soil vs. KBG-PGC Cropping System

Normalized emergence patterns in the bare soil and KBG cropping systems were significantly different in 2019 and 2020. Nonlinear regression (Figure 7) and analysis of variance indicated that in 2019 bare soil and KBG plots had similar emergence patterns. KBG plots reached 50% emergence 0.44 days (2 GDU) faster and 95% emergence 0.37 days (4 GDU) faster than the bare soil plots. In 2020, corn in bare soil plots reached 50% emergence 2.93 days (8 GDU) faster than in the KBG plots. The same trend continued throughout emergence, where corn seedlings in bare soil plots reached 95% emergence 5.83 days (30 GDU) faster than in KBG plots (Figure 7).

3.2.2. Effect of Seed Size in Bare Soil vs. KBG-PGC Cropping System

When normalizing emergence, seed size did not have an effect on seedling emergence (Figure 8). Nonlinear regression and analysis of variance indicated small differences among normalized emergence rates in bare soil and KBG plots in both 2019 and 2020. In bare soil plots, unsorted seed from the bag reached 50% and 95% emergence 0.29 and 0.38 days (1 and 3 GDU) faster than sized seed in 2019, respectively (Figure 8a). Conversely, no differences were observed in 2020 in which sized seed and unsorted seed from the bag reached 50% and 95% emergence at the same rate (Figure 8a). Similarly, KBG plots had very small normalized emergence differences based on seed size in both 2019 and 2020. In 2019, unsorted seed from the bag reached 50% and 95% emergence 0.11 and 0.22 days (0 and 2GDU) faster than sized seed. In 2020, however, sized seed reached 50% and 95% emergence 0.93 and 1.79 days (6 and 10 GDU) faster than seed from the bag. Logistic regression equations showed very similar model fits based on seed size (data not shown).

3.2.3. Hybrid and Seed Size Interaction in Bare Soil vs. KBG-PGC Cropping System

There was a significant hybrid and seed size interaction for normalized emergence. This significant interaction between genetic characteristic of the hybrids and seed size was not unexpected. In 2019, unsorted seed from the bag for both hybrids that was planted in bare soil plots emerged faster to 50% emergence, 0.12 and 0.29 days (1 and 1 GDU), respectively. This same trend was also observed in 2020 for 7016CNV. However, sized seed for 1197 was 0.23 days (1 GDU) faster to reach 50% emergence in bare soil in 2020. The graphs of these results show a near overlap of the logistic fitted models (Figure 9a). In the KBG system, only hybrid 1197 had a different normalized emergence in 2020. Sized seed from 1197 reached 50% and 95% emergence 1.22 and 2.00 days (13 and 9 GDU) faster (Figure 9b) than unsorted seed from the bag. No significant differences were observed for seed size in both hybrids in the KBG cropping system in 2019, for hybrid 1197 in bare soil in 2020, and hybrid 7016CNV in KBG in 2020.

3.3. Yield

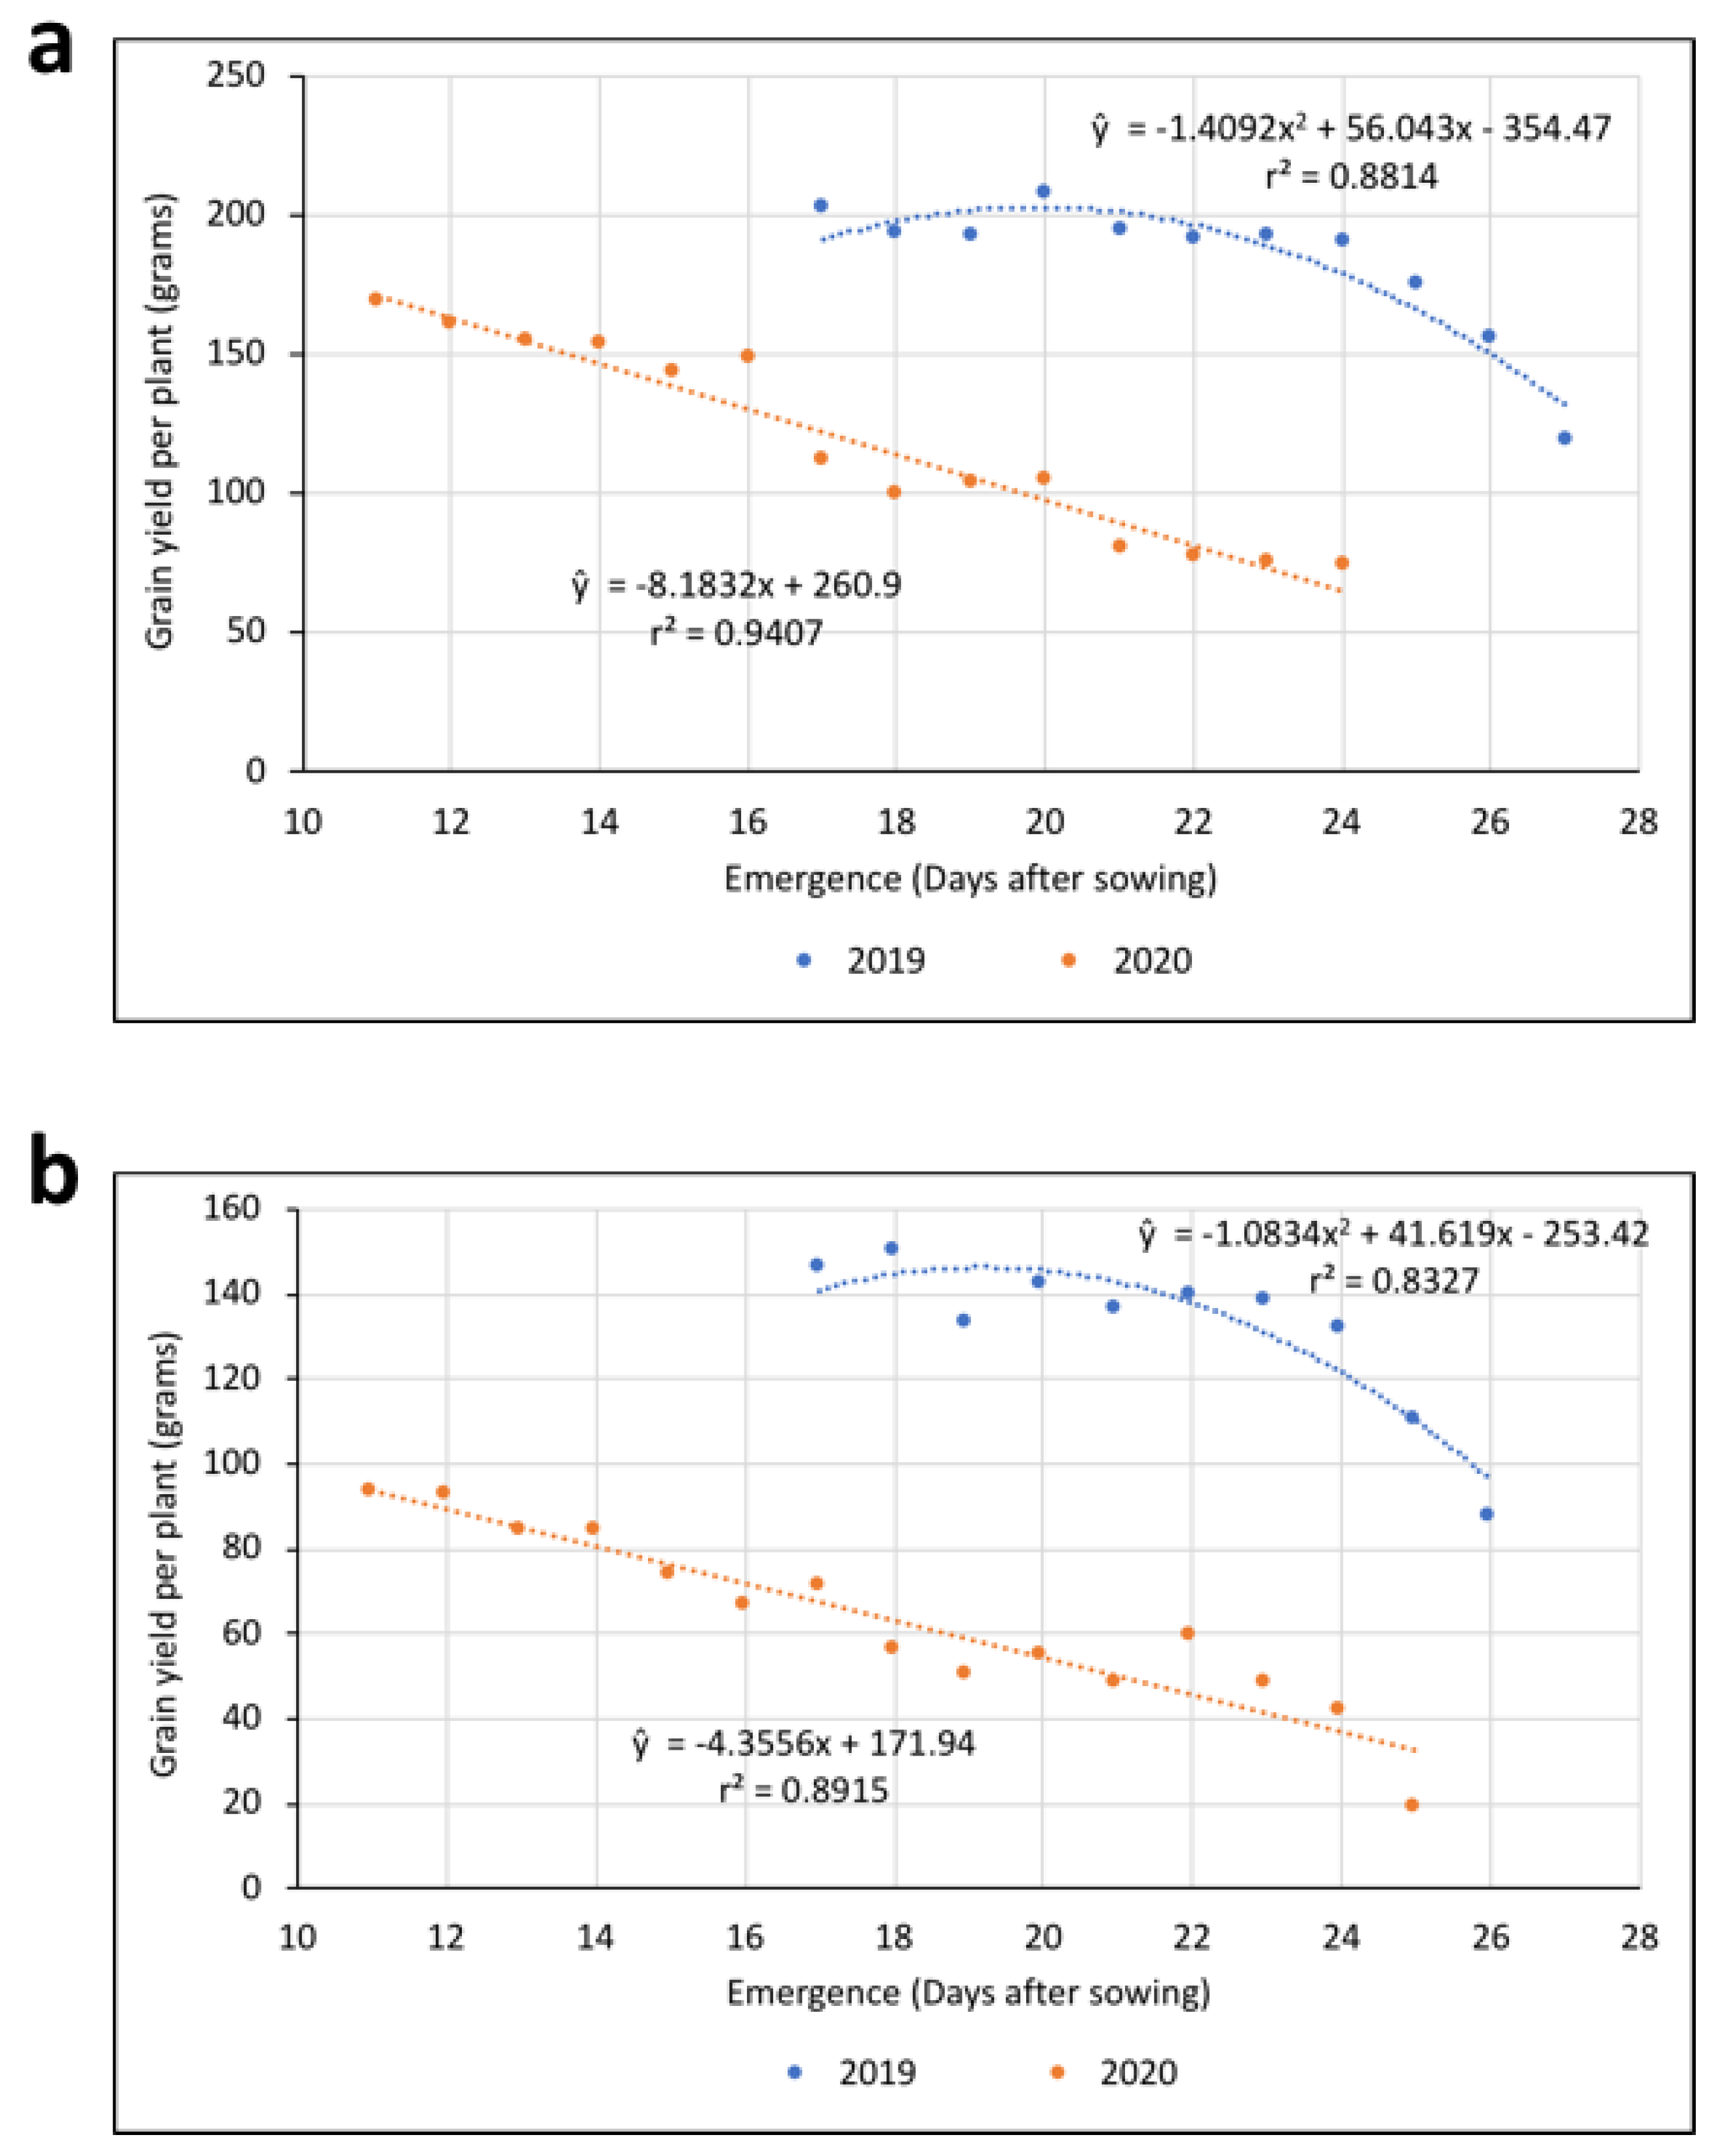
3.3.1. Yield Based on Emergence Date

The decline in single-plant yield with each additional emergence-date delay followed a quadratic pattern for both cropping systems in 2019 and a linear pattern for plants in both cropping systems in 2020 (Figure 10). In 2019, quadratic models for each cropping system were similar and indicated that corn yield was stable for the first seven days of emergence (up to 193 GDU). After seven days, yield decreased in a linear relationship. In 2020, corn yield of plants grown in a bare soil system (Figure 10a) decreased by 8.18 g for each emergence-date delay. In 2020, corn grown in a KBG system was again modeled by a linear regression (Figure 10b), and each individual plant showed a 4.35 g decrease in yield for each day of delayed emergence (GDU’s in Table 2). Kentucky bluegrass and bare soil plots followed similar trends when looking at each growing season individually. Overall, yields in the KBG system were lower than those of the bare soil system. Although lower yields were observed, similar decreases in yield response based on emergence date was seen in both systems. These similar yield responses indicate that post-emergence environmental factors have a significant impact on single-plant yield.

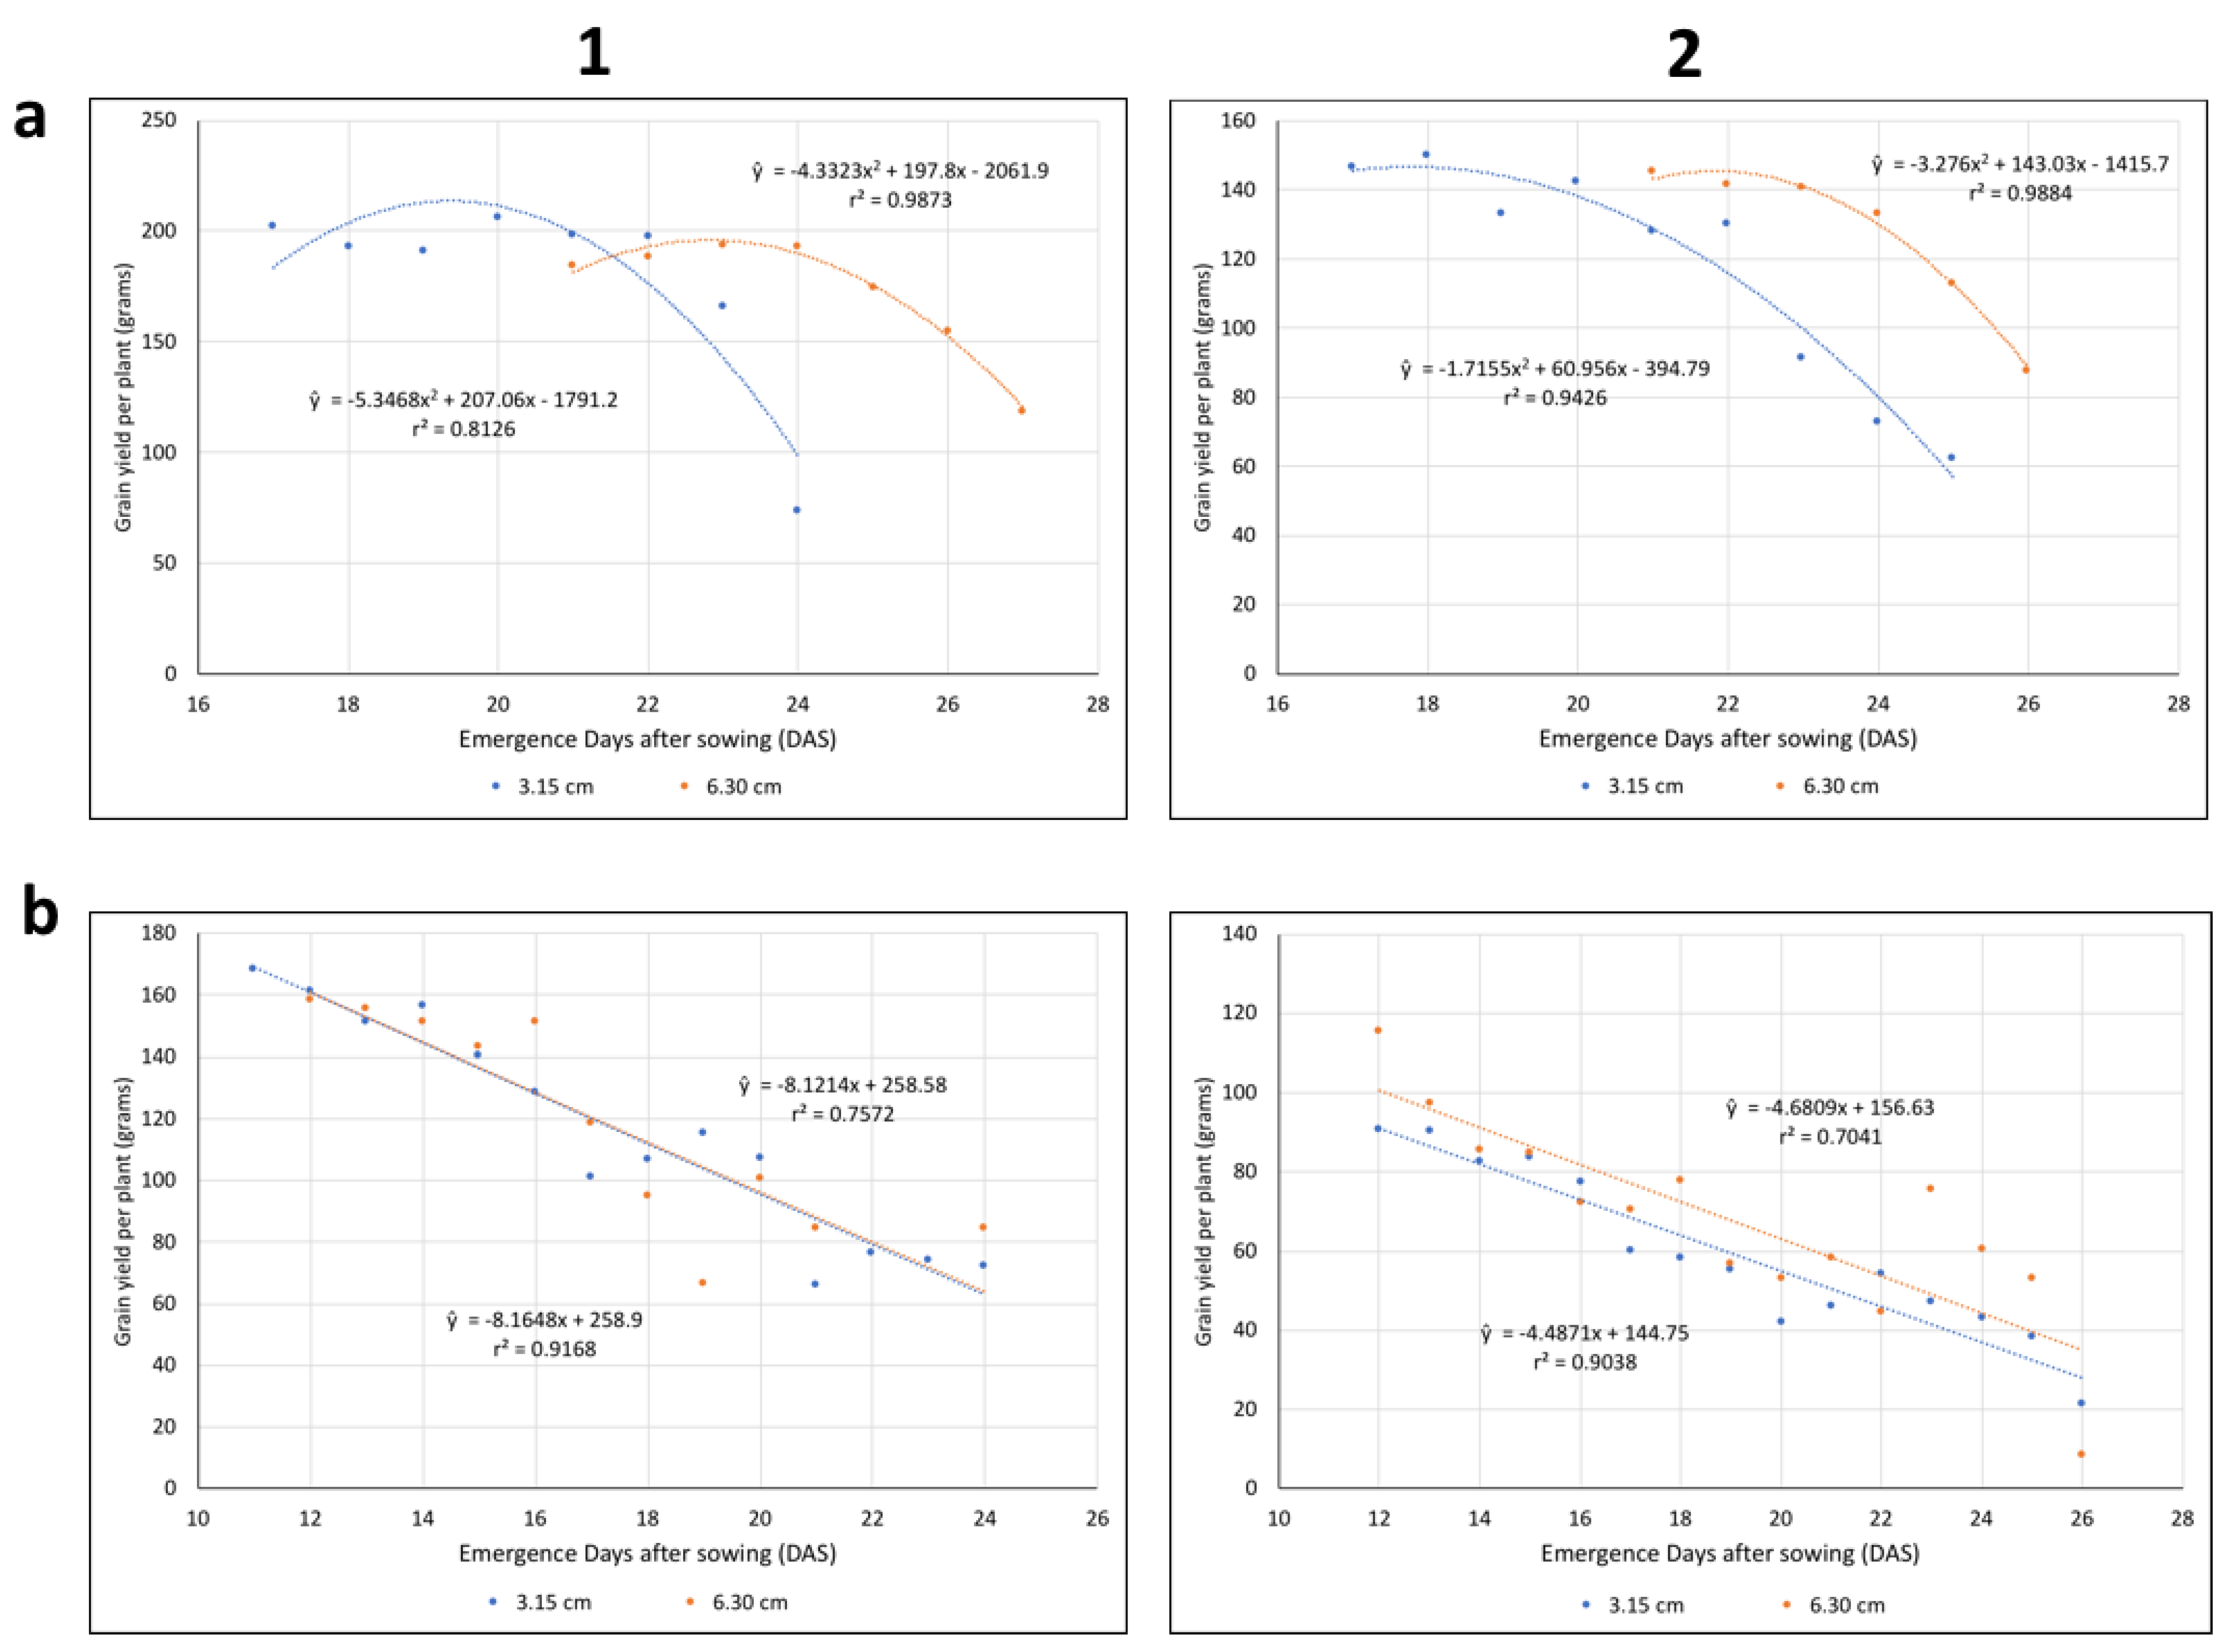
3.3.2. Yield Based on Seed Size

The effect of seed size on single-plant yield was best modeled by a quadratic equation in 2019 and a linear equation in 2020 for both the bare soil and KBG cropping systems (Figure 11). Seed size did not have an effect on single-plant yield. In 2019, single-plant yield from both seed sizes r stable for the first 6–7 emergence dates (177–193 GDU) and then yield decreased rapidly (Figure 11a) with each additional emergence date. This trend was observed in both cropping systems, bare soil and KBG. A linear yield decline based on emergence date was observed for both cropping systems in 2020. In both cropping systems, single-plant yield for unsorted seed from the bag and sized seed declined at similar rates. Unsorted seed from the bag had a slower rate of yield decline for each subsequent emergence date than sized seed. Single-plant yield in sized seed decreased 2.26 g, and 0.55 g per day (GDU in Table 2) in the bare soil and KBG cropping system, respectively (Figure 11b).

3.3.3. Yield Based on Sowing Depth

Sowing depth did not significantly affect single-plant yield. Although there was a delay in emergence for those seeds planted at 6.30 cm compared to 3.15 cm, similar yields were observed once plants began to emerge. In 2019, a quadratic equation was fit to single-plant yield based on emergence date for both sowing depths in both cropping systems (Figure 11). Yield of plants from seed planted at 3.15 cm in the bare soil system were consistent for plants emerging the first six days (177 GDU from sowing). Yield from seed planted at 6.30 cm remained constant only for the first 4 days (159 GDU from sowing) before it began to decrease with each additional date emergence was delayed (Figure 12a). In the KBG system, corn plants emerged within the first 2–3 emergence dates (154–156 GDU) had similar yields. After this initial period, a steady decline in single-plant yield was observed with each subsequent emergence date (Figure 12a). In 2020, both sowing depths in both cropping systems were fit with linear equations (Figure 12b). Sowing depths did not affect yield. A steady yield decline of 8.1 g per plant for bare soil plots and 4.5 g per plant for KBG plots was observed for each subsequent day of delayed emergence (GDU in Table 2).

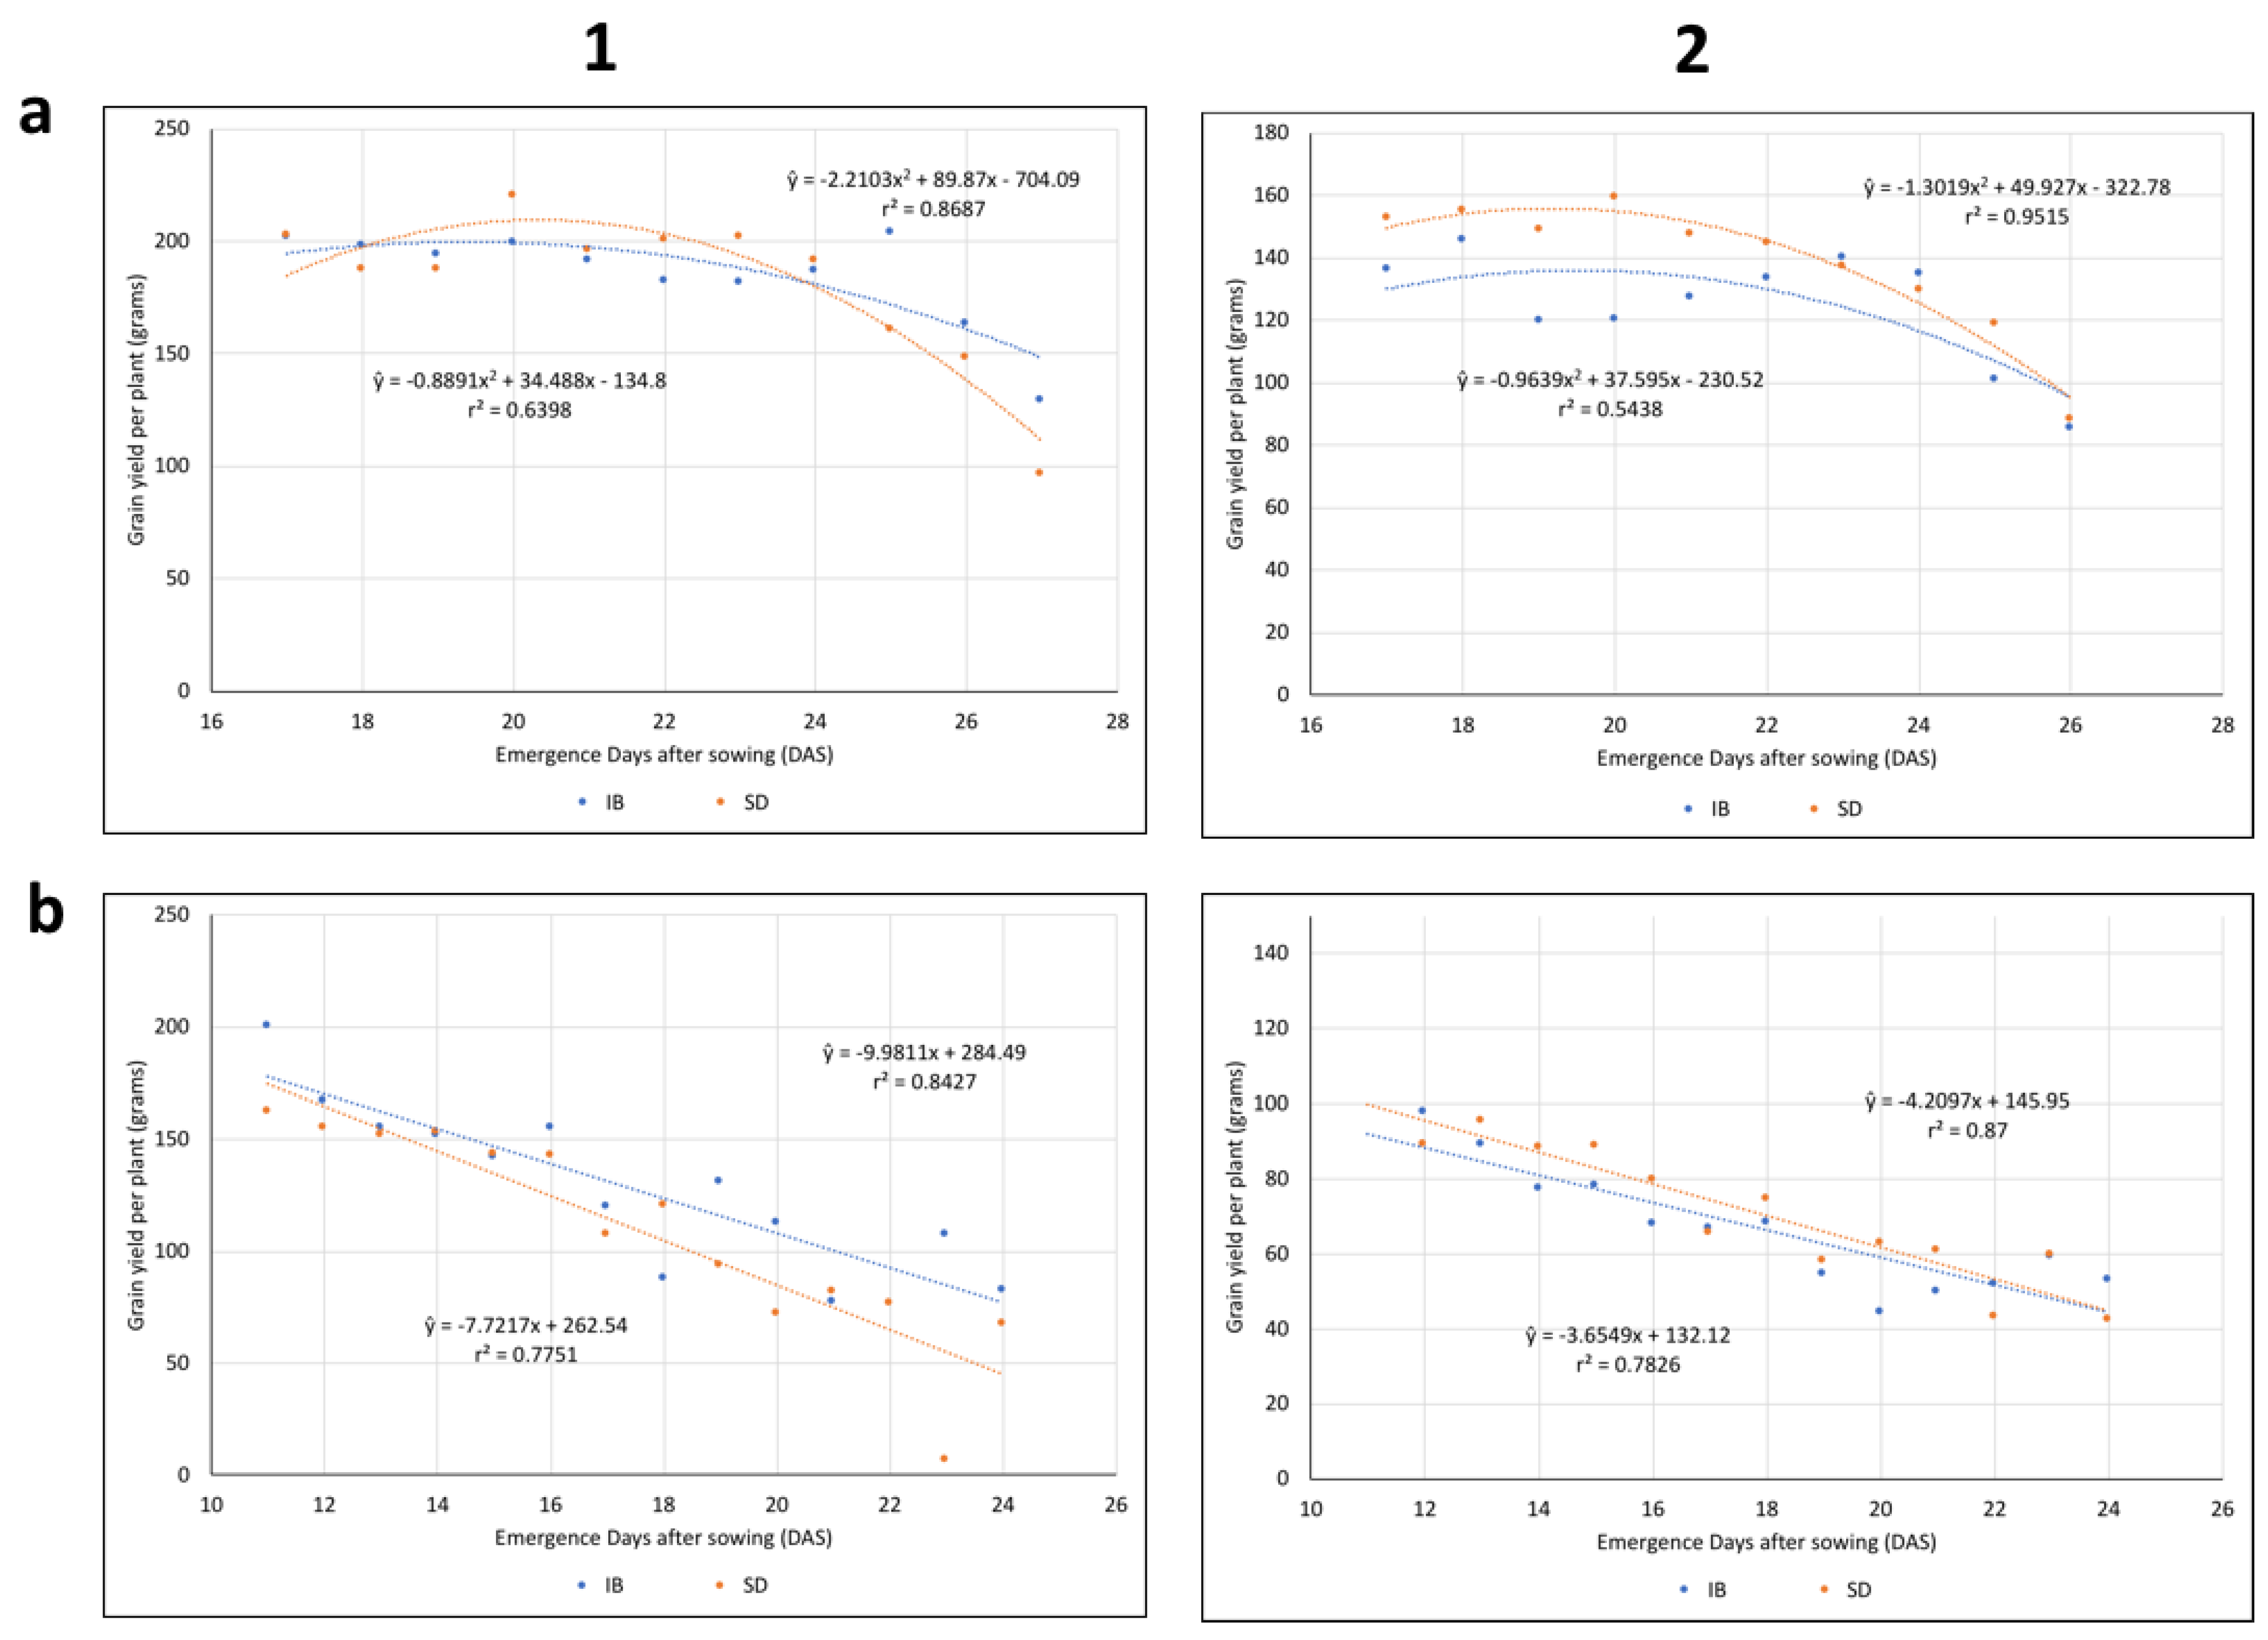
3.3.4. Yield Based on Hybrid

Overall, hybrid 7016CNV had lower yield than hybrid 1197 (Table 3).

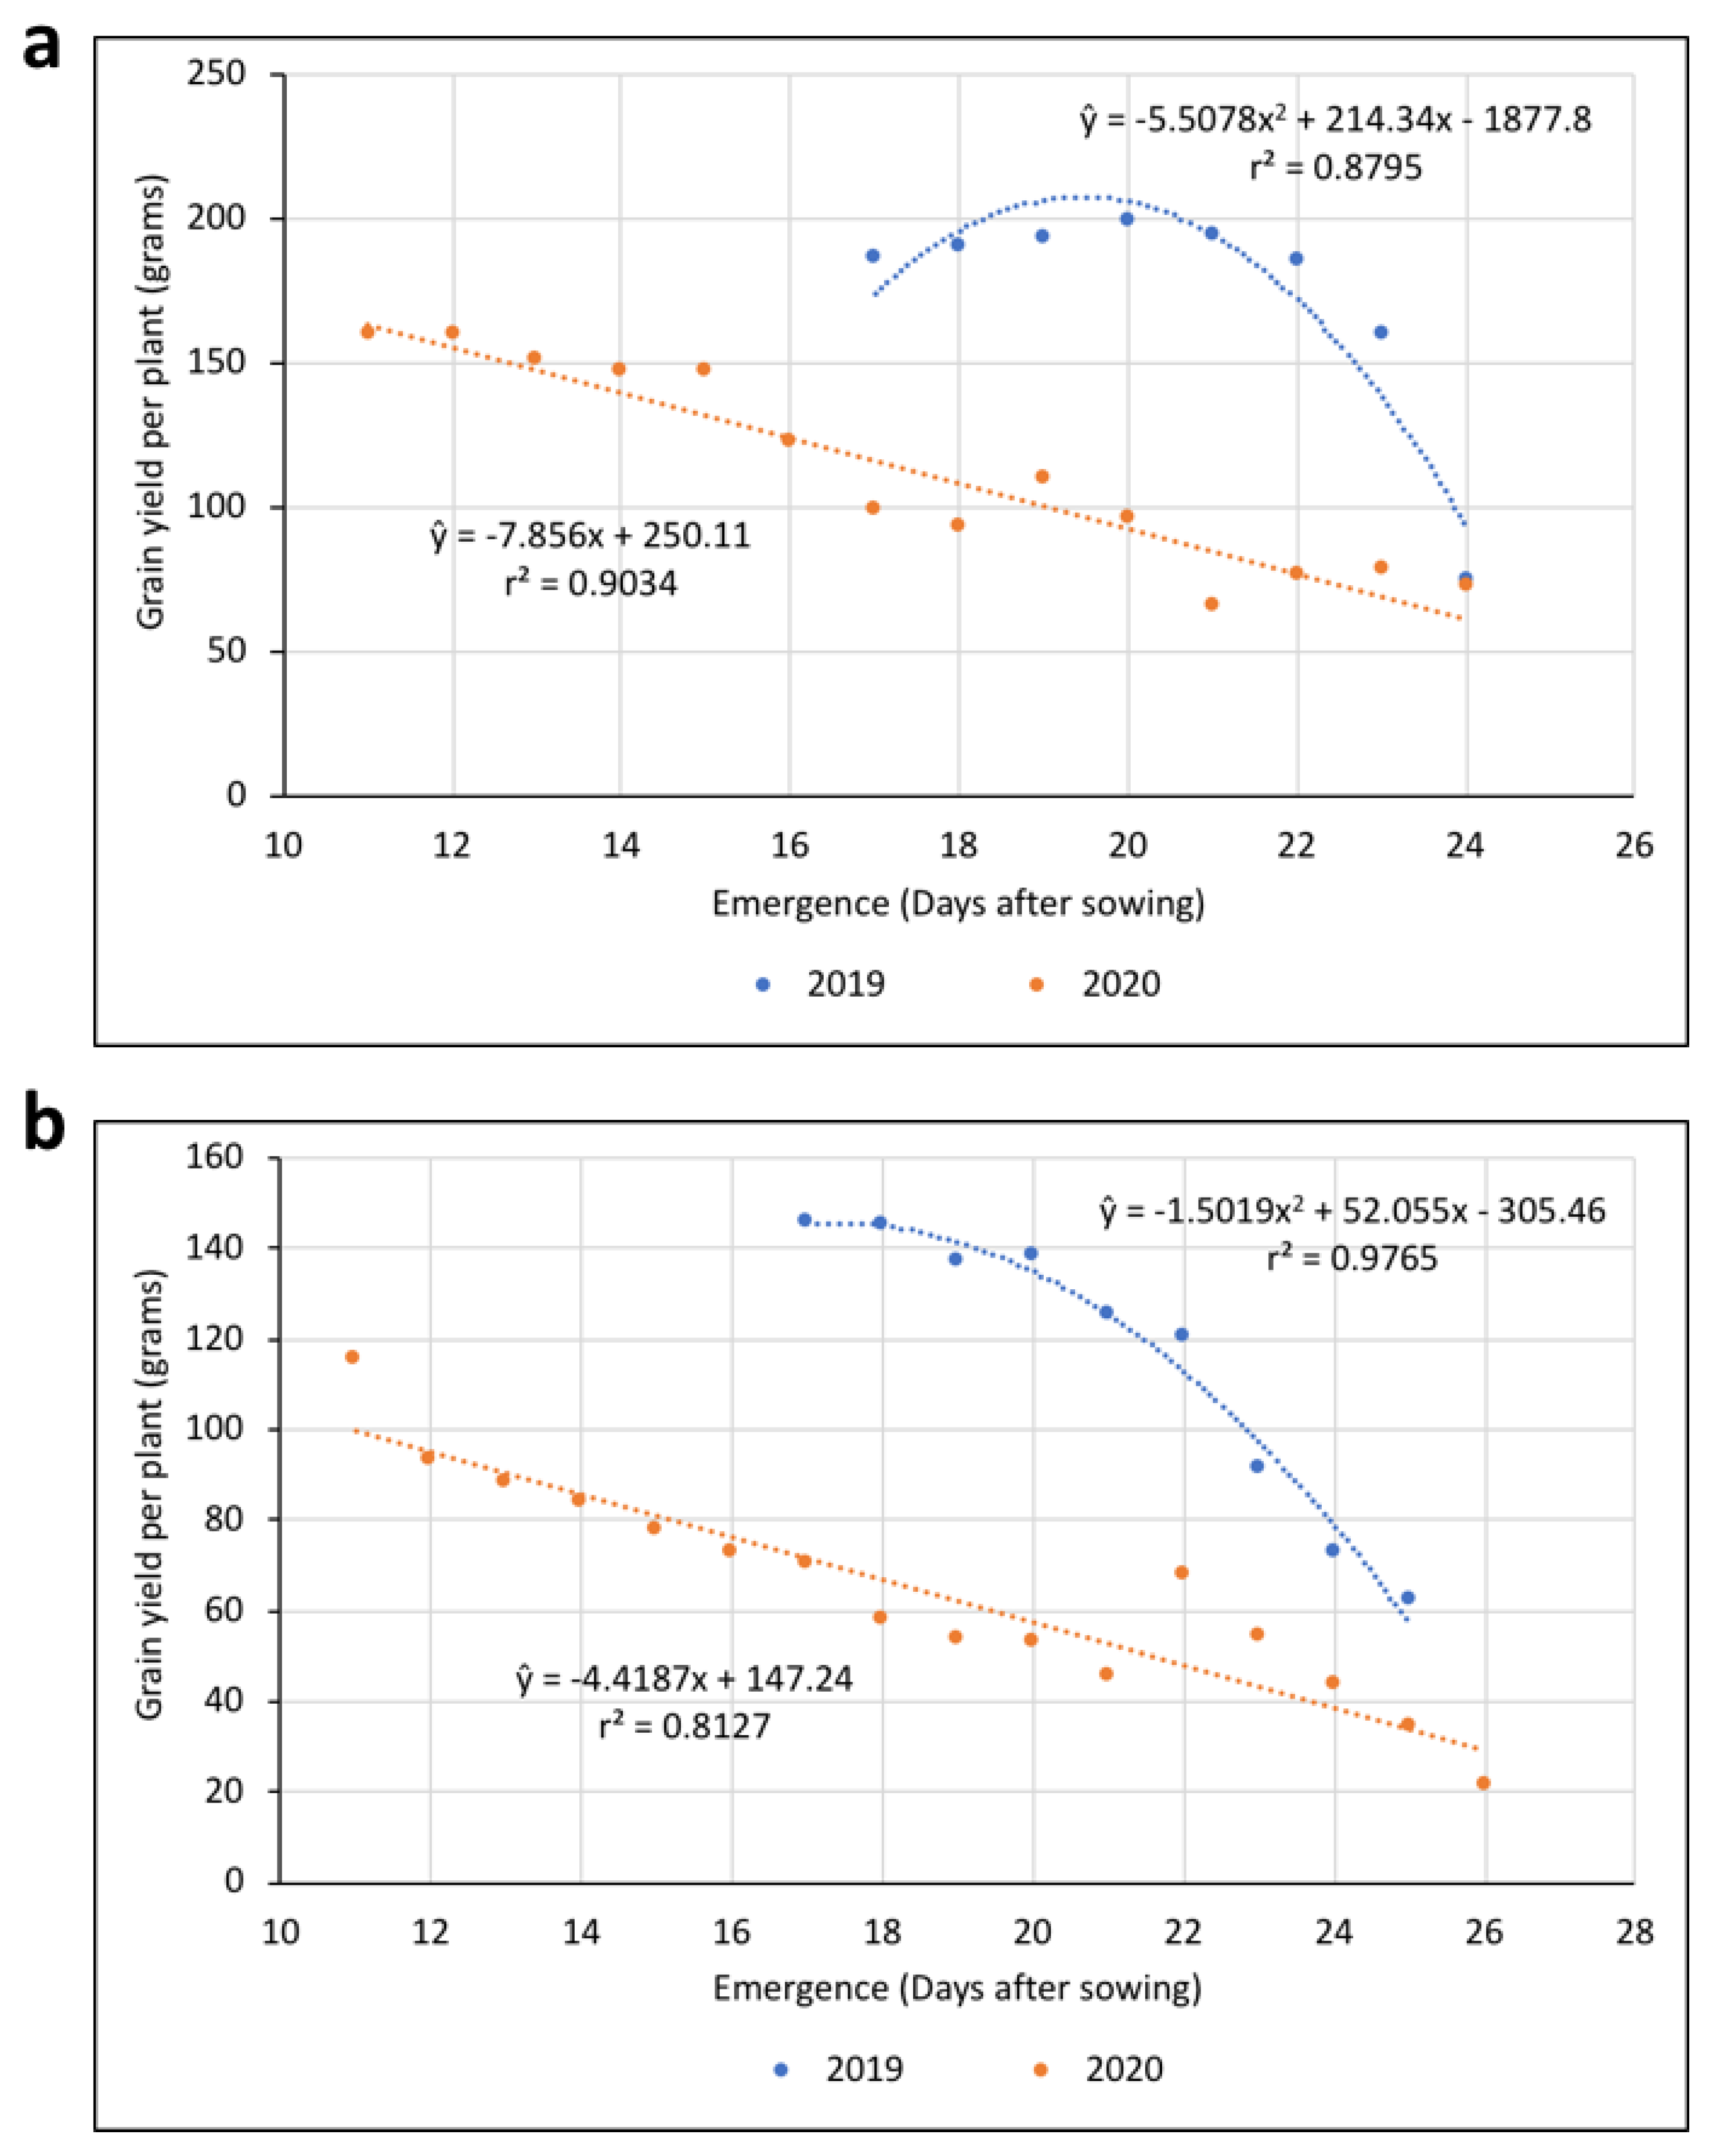
3.3.5. Yield Based on Normalized Emergence Date by Sowing Depth

Yield based on emergence date was normalized based on sowing depth. Figure 13 shows the relationship between single-plant yield based on normalized emergence date.
When the emergence date was normalized based on sowing depth, yield decline was more pronounced as emergence date was delayed. In 2019, corn yields in a bare soil system were stable for the first five emergence dates (168 GDU from sowing) (Figure 13a,b). After this initial period, yields of single plants decreased linearly as plants emerged later. A similar trend was observed for corn grown in KBG plots, but yield was only unchanged for the first two emergence dates (154 GDU from sowing). After these two days, yield began to decrease sharply following a linear trend. These normalized emergence models also showed that a delay in emergence of up to four days (12 GDU) was observed for seed planted at deeper depth (6.30 cm).
In 2020, seed planted at 6.30 cm began to emerge with a single-day delay (14 GDU) compared to seed planted at 3.15 cm. This delay was shorter in terms of days than in 2019, where emergence of the deeper sowing depth started four days after the shallow sowing depth began to emerge. Although there was a three-day difference in the start of emergence for the deeper sowing depth for each growing season, it only equated to a two GDU difference. Due to this smaller difference in emergence in 2020, the trend from yield based on normalized emergence was very similar to that of non-normalized emergence. The yield of each individual corn plant in the bare soil system showed a 7.9 g reduction in yield for each day of delayed emergence (GDU in Table 2). Yield of single corn plants grown in a KBG system had a 4.4 g decrease in yield for each day of delayed emergence. As these yield patterns based on emergence are different in the two growing seasons, we can attribute this to the differing weather patterns seen in each growing season.

3.3.6. Yield Based on Seed Size and Normalized Emergence

Data from normalized emergence based on seed size best fitted a linear model in 2020 and a quadratic model in 2019 for both cropping systems (Figure 14). A small effect of sized seed on the number of days where yield remained stable was observed for plants grown in KBG plots in 2019. Sized seed that emerged in the first 4–5 days (147–159 GDU) had stable yields, while yields from plants from unsorted seed from the bag only remained stable for two days. Sized seed not only had stable yields for a longer emergence window, sized seed also yielded more than seed from the bag. In the bare soil cropping system in 2019, no yield differences were observed for sized seed vs. unsorted seed from the bag. Corn yields remained stable in both seed sizes for the first six emergence dates (177 GDU) before yields began to decrease.
In 2020, no differences were observed between single-plant yield pattern based on emergence date for the two seed sizes. A linear yield decrease was observed in both cropping systems and both seed sizes (Figure 14b). Sized seed decreased 2.08 g and 0.81 g more per day of delayed emergence in the bare soil and KBG cropping system, respectively (GDU in Table 2). Results from normalized emergence data indicated seed size did not affect single-plant yield based on seed size.

4. Discussion

Differences in the seed size distribution within the bag were observed for both hybrids. These size differences could be a result of several factors. For example, companies’ specifications for acceptable size distribution could be different, hybrid genetics may determine production of smaller or larger seeds, seed production practices, and the environmental conditions during seed production influence seed fill [16,17]. Although a producer might request medium flat sized seed from the seed company, seeds are biological entities, and seed size within the bag may not be completely uniform [18]. Additionally, producers searching for the best seed at the best price, may buy seed from different companies each growing season. The seed size may vary from company to company [19]. Due to this, a producer’s sowing equipment must be able to handle a wide range of seed sizes to ensure consistent seed placement during sowing.
The seed lots from both hybrids used in this study were of high quality, as determined using standard germination and vigor laboratory tests. Further separating the seed lot into a narrower seed size distribution did not affect seed germination under ideal (standard germination, and speed of germination tests) or stressful (cold test) conditions. The ability of a seed lot to perform well under stressful cold germination conditions in the laboratory indicates that the seed lot is capable of germinating well when placed into non-ideal field conditions [20]. These results are comparable to other germination studies performed in the laboratory to assess the effect of seed size on germination [3,21]. However, other researchers who have tested seed size under stressful field conditions have observed a positive relationship between larger seed size and emergence rate and plant height [22,23]. In our study, however, seed size, and specifically seed size distribution, did not affect emergence rate or single-plant yield. Other environmental factors in the field could have played a role on the relationship between seed size and emergence.

4.1. Field Emergence

4.1.1. Emergence and Sowing Depth

Logistic models best described the emergence pattern of corn observed in both cropping systems. These emergence models follow a similar trend to those observed in other species [24,25]. Additionally, the logistic models showed that the delay in emergence for the deeper sowing depth (6.30 cm) was 12–14 GDU compared to the shallow sowing depth (3.15 cm). This emergence delay has been reported previously for corn and other grass species based on various sowing depths and soil temperatures [4,26,27]. Although producers do not typically vary sowing depth, this delay in emergence indicates that sowing depth is a crucial factor for uniform seedling emergence. Producers should focus on placing seed at a uniform depth throughout the field to ensure a more uniform emergence pattern and decrease plant to plant competition. Producers should identify planter technology and calibrations to ensure that seed is placed at very uniform depth.

Bare Soil vs. KBG Field Emergence

Corn emergence was delayed in the second growing season, 2020, for the KBG system. This delay in emergence could be associated with greater above and below ground KBG biomass volume present in 2020 than in 2019. In 2019, KBG was newly established, and less biomass was present. The KBG roots and rhizomes were less dense and possibly did not hold as much water when compared to 2020. Additionally, spring of 2019 had abundant rainfall and low temperatures post sowing, possibly slowing seed germination and emergence in both, bare soil and KBG plots. Kentucky bluegrass was two years old in 2020 and only strip tillage was used before sowing. KBG could have competed with corn for available nutrients and light. When a large amount of biomass is in close proximity to corn plants a red:far-red response is often observed. A red:far-red wavelength ratio response is known to slow establishment and growth as shaded plants became stunted [28,29]. Additionally, cover crop systems can change soil properties, inhibit germination, emergence, and slow plant development [30,31,32]. Soil below a suppressed living mulch has better water holding capacity and can store moisture, which could delay increase in soil temperature and slow the rate of seed germination and seedling emergence [33,34]. Even though temperatures post sowing were warmer in 2020, corn planted in KBG plots reached 50% emergence three days (17 GDU) later, and 95% emergence almost six days (29 GDU) later than corn planted in bare soil. This difference could be attributed to the slower soil temperature increase in the presence of a living cover crop mulch [35,36]. This delayed emergence in KBG plots indicates that balance between soil moisture content and temperature is critical for uniform corn emergence and establishment in a PGC system.

4.1.2. Seed Size

Seed size did not have an effect on emergence pattern in the field. This trend was consistent over both hybrids and both cropping systems. In 2020, moderate drought conditions occurred post sowing, and in 2019 greater amounts of rainfall and cool temperatures were recorded post sowing. Although slight differences in emergence patterns were observed, seed size did not significantly affect emergence patterns in either season. Our research supports prior findings that environmental conditions at sowing have a larger effect on seedling emergence patterns than seed size [37,38]. Consequently, producers should not be concerned with the small variation in seed size within a bag. This small variation in seed size does not affect single-plant and overall yield in corn [2,3,39]. Additionally, with the development of flat disk planter technology development, fewer corn seed sizes are necessary, because newer planters are less sensitive to seed size [40]. Planter calibration and seed placement at a uniform depth throughout the field are more important to obtain uniform seed emergence and higher yields than seed size.

4.2. Yield

4.2.1. Yield Based on Emergence Date in Bare Soil

Delayed corn emergence decreased single-plant yield. A uniform decrease in yield of 7.8 g per plant was observed with each additional day of delayed emergence in the 2020 growing season. Each additional day represented a loss of 6 GDU. This yield loss likely could be attributed to the semi drought conditions recorded in the 2020 growing season. These drought conditions possibly increased stress for late emerging plants, while earlier emerging plants were able to adapted due to an earlier seedling establishment and onset of photosynthesis. This earlier photosynthesis period allowed plants to develop deeper roots, allowing roots to find moisture, thus reducing stomatal closure due to water stress [41]. These results seem to support the producers’ speculation that just a few hours difference in corn emergence between plants can increase competition and decrease yield [42,43] when crops emerge under drought stress conditions. Conversely, a different yield response based on emergence date was observed in 2019. Weather conditions in 2019 were cold and wet directly following sowing. Greater amounts of rainfall and soil temperatures below 10 °C delayed emergence for a longer period. However, once the seedlings emerged, the weather conditions improved, and temperature and rainfall patterns were typical of spring in central Iowa. Under these weather conditions, single-plant yield remained stable for the first 5–6 days of emergence (21–30 GDU since emergence started). Stable yields for the first 5–6 days of emergence in bare soil cropping systems could be to the result of these ideal growing conditions for corn plants with no limiting factors post emergence in 2019. Consequently, post sowing and post emergence environmental factors seem to play a larger role on single-plant yield than do emergence date, seed size or sowing depth. Our results indicate that ideal environmental conditions following sowing and emergence have a strong influence on the stability of single-plant yields for a wider emergence window.

4.2.2. Yield Based on Emergence Date in the KBG Cropping System

Lower single-plant yield was observed in both 2019 and 2020 for corn plants growing in KBG plots compared to bare soil plots. In addition to lower yields, plants in these plots had a slightly faster decrease in single-plant yield for each additional day of delayed emergence. Lower overall yields and faster yield decline for corn plants in the KBG cropping system could be attributed to corn’s shade avoidance response associated with red:far-red wavelength light quality variation in the presence of KBG biomass. Corn thrives when it grows in full sun, where the visible light electromagnetic spectrum has about 30 percent more red wavelength light than far-red wavelength light [44]. As light is filtered through the canopy, light from the red wavelength is absorbed and only far-red wavelength light filters through, reducing the red:far-red ratio [45]. The higher proportion of far-red wavelength light converts the plants phytochrome into the inactive form, which in turn slows growth [28]. When corn is in competition with other biomass, such as in our study, the greater proportion of far-red wavelength in the light may have caused delayed growth [46]. This red:far-red response has been shown to slow germination and growth and lower yields [28,29,47].

4.2.3. Yield Based on Emergence Date and Seed Size

Single-plant yield decreased based on the emergence date, but not based on seed size. The same trend was observed for both hybrids, in both cropping systems, confirming that single-plant yield loss was affected by pre- and post-emergence environmental conditions in each growing season. These results confirm previous studies which reported that seed size distribution does not play a role on overall corn grain yield in a conventional bare soil system [1,2]. In the KBG cropping system, differing growing conditions in the two seasons caused slower emergence post sowing in 2019, but this delayed plant emergence produced higher single-plant yields. In contrast, the 2020 season had faster emergence rates but plants had lower yields. This difference could be attributed to the drought conditions post corn emergence in 2020 and seems to support that single-plant yield is affected more by post emergence environmental factors rather than by seed size [48,49]. Our results further indicate that seed size distribution within a bag of seed is ideal for achieving the highest yield for the producer in a bare soil and a KBG cropping system. The size distribution currently in a commercial bag of seed is adequate for maximizing single-plant yields. A wider seed size distribution could possibly have an additional benefit for producers because seed costs are lower than if seed needed further seed size refinement and greater seed sizes were discarded. Producers can feel confident in adopting PGC cropping systems knowing that current seed corn provided by seed companies will perform well in the new cropping system.

5. Conclusions

The results obtained in this study indicate that seed size does not play a role in corn emergence and single-plant yield. However, delayed seedling emergence does affect plant growth, competition and single-plant yield. In the bare soil system, plants emerging later than 6–30 GDU’s after initial emergence had lower single-plant yields depending on weather conditions. The window in which single-plant yields remained stable was shorter (7–9 GDU) for the KBG cropping system than the bare soil system. Producers should be aware that plants must emerge within these GDU windows for each cropping system, and that uniformity in emergence is affected by environmental factors rather than seed size.
Although deeper sowing depth delayed emergence, it did not affect overall yield. Producers should strive for uniform sowing depth and properly regulate sowing equipment to avoid delayed emergence and yield loss.
Furthermore, seed size did not affect yield. The seed size fractions currently used by seed companies are adequate and justified for uniform emergence and maximum grain yield. Our conclusions apply to common hybrids grown in the upper Midwest region of the U.S. Future studies should explore the effects of sowing seed corn at greater densities and the consequent response of red:far-red light ratio on crop yields in a KBG groundcover system.

Supplementary Materials

The following are available online at https://www.mdpi.com/article/10.3390/crops2010006/s1, Table S1: Logistic fit models for emergence and normalized emergence based on year, cover crop system, seed size, and hybrid, Table S2: Logistic fit models for emergence based on planting depth, year, and cover crop systems.

Author Contributions

Conceptualization: C.L.K., A.S.G. and K.J.M.; Formal analysis: C.L.K. and K.J.M.; Funding acquisition: A.S.G. and K.J.M.; Investigation: C.L.K., A.S.G. and K.J.M.; Methodology: C.L.K. and A.S.G.; Project administration: A.S.G. and K.J.M.; Writing—review and editing: C.L.K., A.S.G. and K.J.M. All authors have read and agreed to the published version of the manuscript.

Funding

Agriculture and Food Research Initiative Competitive Grant No.2021-68012-35923 from the National Institute of Food and Agriculture; Iowa State University - State of Iowa: Hatch Projects IOW03814, IOW04114, and IOW05594.

Data Availability Statement

All data is provided in the form of tables and figures within the article and Supplementary Materials.

Conflicts of Interest

The authors declare no conflict of interest.

References

  1. Graven, L.M.; Carter, P.R. Seed Size/Shape and Tillage System Effect on Corn Growth and Grain Yield. J. Prod. Agric. 1990, 3, 445–452. [Google Scholar] [CrossRef] [Green Version]
  2. Nafziger, E.D. Seed Size Effects on Yields of Two Corn Hybrids. J. Prod. Agric. 1992, 5, 538–540. [Google Scholar] [CrossRef]
  3. Hunter, R.B.; Kannenberg, L.W. Effects of Seed Size on Emergence, Grain Yield, and Plant Height in Corn. Can. J. Plant Sci. 1971, 52, 252–256. [Google Scholar] [CrossRef]
  4. Molatudi, R.; Mariga, I. The Effect of Maize Seed Size and Depth of Planting on Seedling Emergence and Seedling Vigour. J. Appl. Sci. Res. 2009, 5, 2234–2237. [Google Scholar]
  5. Martin, R.C.; Greyson, P.R.; Gordon, R. Competition between corn and a living mulch. Can. J. Plant Sci. 1999, 79, 579–586. [Google Scholar] [CrossRef] [Green Version]
  6. Flynn, E.S.; Moore, K.J.; Singer, J.W.; Lamkey, K.R. Evaluation of Grass and Legume Species as Perennial Ground Covers in Corn Production. Crop Sci. 2013, 53, 611–620. [Google Scholar] [CrossRef]
  7. Beyaert, R.P.; Schott, J.W.; White, P.H. Tillage effects on corn production in a coarse-textured soil in Southern Ontario. Agron. J. 2002, 94, 767–774. [Google Scholar] [CrossRef]
  8. Duvick, D.N. The contribution of breeding to yield advances in maize (Zea mays L.). Adv. Agron. 2005, 86, 82–145. [Google Scholar]
  9. Tokatlidis, I.S.; Koutroubas, S.D. A review of maize hybrids’ dependence on high plant populations and its implications for crop yield stability. F. Crop. Res. 2004, 88, 103–114. [Google Scholar] [CrossRef]
  10. Tollenaar, M.; Lee, E.A. Yield potential, yield stability and stress tolerance in maize. F. Crop. Res. 2002, 75, 161–169. [Google Scholar] [CrossRef]
  11. Pecinovsky, K.T. Corn Population Research. 2011. Available online: https://dr.lib.iastate.edu/handle/20.500.12876/36160 (accessed on 5 April 2019).
  12. Nielsen, R.L. Stand establishment variability in Corn. 1991. Available online: https://www.agry.purdue.edu/ext/pubs/AGRY-91-01_v5.pdf (accessed on 12 June 2019).
  13. Nielsen, R.L. Stand establishment variability in corn. In Proceedings of the 2006 Indiana CCA Conference, Indianapolis, IN, USA, 19 December 2006; pp. 1–10. [Google Scholar]
  14. Doerge, T.; Hall, T.; Gardner, D. Improved plant spacing in Corn. 2002. Available online: https://studylib.net/doc/7585349/benefits-of-improved-plant-spacing-uniformity (accessed on 25 March 2019).
  15. SAS Institute Inc. SAS Institute Inc. Version 9.4; SAS Institute Inc.: Cary, NC, USA, 2013. [Google Scholar]
  16. Delouche, J.C. Environmental Effects on Seed Development and Seed Quality. HortScience 1980, 15, 13–18. [Google Scholar]
  17. Castro, J.; Hodar, J.A.; Gomez, J.M. Handbook of Seed Science and Technology: Seed Size; CRC Press: Boca Raton, FL, USA, 2006. [Google Scholar]
  18. Wright, H. Commercial Hybrid Seed Production. In Hybridization of Crop Plants; DeKalb AgResearch, Inc.: DeKalb, IL, USA, 1980; pp. 161–176. [Google Scholar]
  19. USDA. Understanding Seeding Rates, Recommended Planting Rates, and Pure Live Seeds (PLS). 2009. Available online: https://www.nrcs.usda.gov/Internet/FSE_PLANTMATERIALS/publications/lapmctn9045.pdf (accessed on 20 March 2019).
  20. Copeland, L.O.; McDonald, M.B. Seed Vigor and Vigor Testing. In Principles of Seed Science and Technology; Springer: Boston, MA, USA, 2001. [Google Scholar]
  21. Varga, P.; Berzy, T.; Anda, A.; Ertsey, K. Relationship between seed harvesting method and seed physiological quality for a number of Pioneer maize hybrids. Maydica 2012, 57, 220–225. [Google Scholar]
  22. Gubbels, G.H. Growth of Corn Seedlings Under Low Temperatures As Affected By Genotype, Seed Size, Total Oil, and Fatty Acid Content of the Seed. Can. J. Plant Sci. 2010, 54, 425–426. [Google Scholar] [CrossRef]
  23. Bockstaller, C.; Girardin, P. Effects of seed size on maize growth from emergence to silking. Maydica 1994, 39, 213–218. [Google Scholar]
  24. Nash, H.M.; Selles, F. Seedling emergence as influenced by aggregate size, bulk density, and penetration resistance of the seedbed. Soil Tillage Res. 1995, 34, 61–76. [Google Scholar]
  25. Szparaga, A.; Kocira, S. Generalized logistic functions in modelling emergence of Brassica napus L. PLoS ONE 2018, 13, e0201980. [Google Scholar] [CrossRef]
  26. Gupta, S.C.; Schneider, E.C.; Swan, J.B. Planting Depth and Tillage Interactions on Corn Emergence. Soil Sci. Soc. Am. J. 1988, 1122–1127. [Google Scholar] [CrossRef] [Green Version]
  27. Newman, P.R.; Moser, L.E. Grass Seedling Emergence, Morphology, and Establishment as Affected by Planting Depth. Agron. J. 1988, 80, 383–387. [Google Scholar] [CrossRef] [Green Version]
  28. Devlin, P.F. Plants wait for the lights to change to red. Proc. Natl. Acad. Sci. USA 2016, 113, 7301–7303. [Google Scholar] [CrossRef] [Green Version]
  29. Flynn, E.S. Corn Production with Perennial Ground Covers: Evaluation of Cover Species and Their Effects on Corn Growth and Development. Ph.D. Thesis, Iowa State University, Ames, IA, USA, 2011. [Google Scholar]
  30. Fageria, N.K.; Baligar, V.C.; Bailey, B.A. Role of Cover Crops in Improving Soil and Row Crop Productivity Role of Cover Crops in Improving Soil. Commun. Soil Sci. Plant Anal. 2007, 36, 2733–2757. [Google Scholar] [CrossRef]
  31. Drury, C.F.; Tan, C.S.; Welacky, T.W.; Oloya, T.O.; Hamill, A.S.; Weaver, S.E. Red clover and tillage influence on soil temperature, water content, and corn emergence. Agron. J. 1999, 91, 101–108. [Google Scholar] [CrossRef]
  32. Bartel, C.A.; Banik, C.; Lenssen, A.W.; Moore, K.J.; Laird, D.A.; Archontoulis, S.V.; Lamkey, K.R. Establishment of perennial groundcovers for maize-based bioenergy production systems. Agron. J. 2017, 109, 822–835. [Google Scholar] [CrossRef] [Green Version]
  33. Wiggans, D.R.; Singer, J.W.; Moore, K.J.; Lamkey, K.R. Maize Water Use in Living Mulch Systems with Stover Removal Maize Water Use in Living Mulch Systems with Stover Removal. Crop Sci. 2012, 52, 327–338. [Google Scholar] [CrossRef] [Green Version]
  34. Alessi, J.; Power, J.F. Corn Emergence in Relation to Soil Temperature and Seeding Depth. Agron. J. 1971, 63, 717–719. [Google Scholar] [CrossRef] [Green Version]
  35. Adams, W.E.; Pallas, J.E.; Dawson, R.N.; Al, A.E.T. Tillage Methods for Corn-Sod Systems in the Southern Piedmont 1 Treatment Effects on Corn Germination. Agron. J. 1970, 62, 646–649. [Google Scholar] [CrossRef]
  36. Walters, S.A.; Young, B.G. Utility of Winter Rye Living Mulch for Weed Management in Zucchini Squash Production. Weed Technol. 2008, 22, 724–728. [Google Scholar] [CrossRef]
  37. Leishman, M.R.; Westoby, M. The Role of Seed Size in Seedling Establishment in Dry Soil Conditions–Experimental Evidence from Semi-Arid Species. J. Ecol. 1994, 82, 249–258. [Google Scholar] [CrossRef]
  38. Anderson, R.L.; Nielsen, D.C. Emergence Pattern of Five Weeds in the Central Great Plains. Weed Technol. 1996, 10, 744–749. [Google Scholar] [CrossRef]
  39. Gitaitis, R.; Walcott, R. The Epidemiology and Management of Seedborne Bacterial Diseases. Annu. Rev. Phytopathol. 2007, 45, 371–397. [Google Scholar] [CrossRef]
  40. Rectenwald, J. Seed Size and Planter Prep. Available online: https://ocj.com/2012/03/seed-size-and-planter-prep/ (accessed on 28 December 2018).
  41. Chaves, M.M.; Pereira, J.S.; Maroco, J.; Rodrigues, M.L.; Ricardo, C.P.P.; Osoario, M.L.; Carvalho, I.; Faria, T.; Pinheiro, C. How Plants Cope with Water Stress in the Field. Photosynthesis and Growth. Ann. Bot. 2002, 89, 907–916. [Google Scholar] [CrossRef] [Green Version]
  42. Dowdy, R.; Hess, A. Randy Dowdy: Eight Reasons for Uneven Corn Emergence. Available online: https://www.agdaily.com/crops/randy-dowdy-uneven-corn-emergence/ (accessed on 28 December 2018).
  43. Hart, J.; Dowdy, R.; Hula, D. Corn Yield Champions Hula and Dowdy Use Flags to Measure Emergence. Available online: https://www.farmprogress.com/grains/corn-yield-champions-hula-and-dowdy-use-flags-measure-emergence (accessed on 28 December 2018).
  44. Rajcan, I.; Chandler, K.J.; Swanton, C.J. Red-far-red ratio of reflected light: A hypothesis of why early-season weed control is important in corn. Weed Sci. 2004, 52, 774–778. [Google Scholar] [CrossRef]
  45. Holmes, M.G.; Smith, H. The function of phytochrome in plants growing in the natural environment. Nature 1975, 254, 512–514. [Google Scholar] [CrossRef]
  46. Afifi, M.; Swanton, C. Maize seed and stem roots differ in response to neighbouring weeds. Weed Res. 2011, 51, 442–450. [Google Scholar] [CrossRef]
  47. Markham, M.Y.; Stoltenberg, D.E. Red:Far-Red Light Effects on Corn Growth and Productivity in Field Environments. Weed Sci. 2009, 57, 208–215. [Google Scholar] [CrossRef]
  48. Ferreira, G.; Brown, A. Advances in Silage Prodution and Utilizations: Environmental Factors Affecting Corn Quality for Silage Production. 2016. Available online: https://www.intechopen.com/chapters/51614 (accessed on 25 March 2019).
  49. Toliver, D.K.; Larson, J.A.; Roberts, R.K.; English, B.C.; De La Torre Ugarte, D.G.; West, T.O. Effects of No-Till on Yields as Influenced by Crop and Environmental Factors. Agron. J. Soil Tillage Conserv. Manag. 2012, 104, 530–541. [Google Scholar] [CrossRef] [Green Version]
Figure 1. Schematic representation of field split-plot design in bare soils (white plots) and Kentucky bluegrass (KBG) groundcover (green plots) systems. The entire experiment was surrounded by KBG groundcover (green). Plots were numbered as follow: first number represents blocks (1 through 4) and second and third number represents plots within blocks (01 to 16). Hybrids and treatment combinations were randomly assigned to plots both, within the bare soils and KBG groundcover. The graph represents the eight treatment/factor combinations, including: two hybrids (P and BR); two seed sizes in the commercial bag of seed and a smaller seed size distribution obtained by re-sizing seed in the laboratory (denominated as IB and SD, respectively); and two sowing depths of 3.18 and 6.35 cm (denominated as 1.25 and 2.5, respectively).
Crops 02 00006 g001
Figure 2. Images of field plots in bare soils and Kentucky bluegrass perennial groundcover systems measuring seedling emergence (a), emergence date color-coded flagging (b,d,e), and recording plant-to-plant spacing (c) in the field.
Crops 02 00006 g002
Figure 3. Cumulative emergence in 2019 and 2020 in each cropping system. KBG is a Kentucky bluegrass perennial ground cover system and Bare Soil is conventional system. T50 and T95 are days to 50% and 95% emergence, respectively. Observed vs. predicted regression lines calculated using logistic model. Approximate R-squared values calculated by (1 − (SS Residual/SS Total)).
Crops 02 00006 g003
Figure 4. Cumulative emergence in 2019 and 2020 based on seed size in (a) bare soil and (b) KBG, a Kentucky bluegrass perennial ground cover cropping system. IB is “unsorted” seed size distribution in a commercials bag of seed and SD is a “sized” narrower seed size distribution used in this experiment. T50 and T95 are days to 50% and 95% emergence, respectively. Observed vs. predicted regression lines calculated using logistic model. Approximate R-squared values calculated by (1 − (SS Residual/SS Total)).
Crops 02 00006 g004
Figure 5. Cumulative emergence in 2019 and 2020 based on seed size and hybrid in (a) bare soil and (b) KBG, a Kentucky bluegrass perennial ground cover cropping system. IB is “unsorted” seed size distribution in a commercials bag of seed and SD is a “sized” narrower seed size distribution used in this experiment. T50 and T95 are days to 50% and 95% emergence, respectively. Observed vs. predicted regression lines calculated using logistic model. Approximate R-squared values calculated by (1 − (SS Residual/SS Total)).
Crops 02 00006 g005
Figure 6. Cumulative emergence in 2019 and 2020 based on sowing depth in (a) bare soil and (b) KBG, a Kentucky bluegrass perennial ground cover cropping system. “Shallow” is the 3.18 cm sowing depth and “Deep” is the 6.35 cm sowing depth. T50 and T95 are days to 50% and 95% emergence, respectively. Observed vs. predicted regression lines calculated using logistic model. Approximate R-squared values calculated by (1 − (SS Residual/SS Total)).
Crops 02 00006 g006aCrops 02 00006 g006b
Figure 7. Cumulative normalized emergence in 2019 and 2020 for bare soil and KBG, a Kentucky bluegrass perennial ground cover cropping system. Normalized emergence was calculated by making the first emergence date coincide for data from both sowing depths. T50 and T95 are days to 50% and 95% emergence, respectively. Predicted regression lines calculated using logistic model. Approximate R-squared values calculated by (1 − (SS Residual/SS Total)).
Crops 02 00006 g007
Figure 8. Cumulative normalized emergence in 2019 and 2020 based on seed size in (a) bare soil and (b) KBG, a Kentucky bluegrass perennial ground cover cropping system. IB is “unsorted” seed size distribution in bag of seed and SD is a “sized” narrower seed size distribution used in this experiment. T50 and T95 are days to 50% and 95% emergence, respectively. Observed vs. predicted regression lines calculated using logistic model. Approximate R-squared values calculated by (1 − (SS Residual/SS Total)).
Crops 02 00006 g008
Figure 9. Cumulative normalized emergence in 2019 and 2020 based on seed size in (a) bare soil and (b) KBG, a Kentucky bluegrass perennial ground cover cropping system. IB is “unsorted” seed size distribution in a bag of seed and SD is a “sized” narrower seed size distribution used in this experiment. T50 and T95 are days to 50% and 95% emergence, respectively. Observed vs. predicted regression lines calculated using logistic model. Approximate R-squared values calculated by (1 − (SS Residual/SS Total)).
Crops 02 00006 g009
Figure 10. Observed vs. predicted values for single-plant yield based on emergence date in (a) bare soil and (b) KBG, a Kentucky bluegrass perennial ground cover cropping system. Predicted regression lines calculated using a linear or and quadratic model. R-squared values calculated to determine goodness of fit.
Crops 02 00006 g010
Figure 11. Observed vs. predicted values for single-plant yield based on emergence date and seed size in 2019 (a) and 2020 (b) in (1) bare soil and (2) KBG, a Kentucky bluegrass perennial ground cover cropping system. IB = unsorted seed in bag, SD = sized seed with a smaller size distribution. Predicted regression lines calculated using a linear and quadratic model. R-squared values calculated to determine goodness of fit.
Crops 02 00006 g011
Figure 12. Observed vs. predicted values for single-plant yield based on emergence date and sowing depth in (a) 2019 and (b) 2020 in (1) bare soil and (2) KBG, a Kentucky bluegrass perennial cover cropping system. Predicted regression lines calculated using a linear and quadratic model. R-squared values calculated to determine goodness of fit.
Crops 02 00006 g012
Figure 13. Observed vs. predicted values for single-plant yield based on normalized emergence date in (a) bare soil and (b) KBG, a Kentucky bluegrass perennial ground cover cropping system. Predicted regression lines calculated using a linear and quadratic model. R-squared values calculated to determine goodness of fit.
Crops 02 00006 g013
Figure 14. Observed vs. predicted values for single-plant yield based on normalized emergence date and seed size in (a) 2019 and (b) 2020 in (1) bare soil and (2) KBG, a Kentucky bluegrass perennial ground cover cropping system. IB = unsorted seed in bag, SD = sized seed with smaller size distribution. Predicted regression lines calculated using a linear and quadratic model. R-squared values calculated to determine goodness of fit.
Crops 02 00006 g014
Table 1. Monthly mean temperature (°C), rainfall (mm) and growing degree units (GDU) on a base of 10 °C for the corn growing seasons in 2019 and 2020.
Mean Temperature (°C)Rainfall (mm)GDU (Base 50)
Month201920202019202020192020
April9.48.324.92.343.085.0
May13.914.4211.3134.1338.5346.5
June20.622.8100.839.9622.5729.5
July23.324.4117.170.9774.0778.5
August21.122.833.025.9637.5678.5
September20.016.7115.881.0609.5434.0
October8.3-133.1-148.0-
Planting was 24th April in 2019 and 2020, GDU, Rainfall, and Temperature in April are post planting. GDU base 50 calculation: [Daily Maximum Air Temperature (°F) + Daily Minimum Temperature (°F)/2–50 °F.
Table 2. Daily accumulated Growing Degree Units (GDU, Base 50) from days after sowing to completed seedling emergence recorded in research plots for 2019 and 2020.
Growing Season
20192020
Day after Planting (DAP)Accumulated GDUAccumulated GDU
11 112
12 126
13 129
14 129
15 134
16 141
17147145
18154153
19156155
20159160
21168166
22177169
23193177
24216189
25230203
26248209
27251218
Average GDU/day10.46.6
Emergence began 17 days after sowing in 2019 and 11 days after sowing in 2020. GDU base 50 calculation: [Daily Maximum Air Temperature (°F) + Daily Minimum Temperature (°F)/2] − 50 °F
Table 3. Average single-plant yield in grams at 15% grain moisture content for each hybrid and cropping system (bare soil and Kentucky bluegrass groundcover (KBG) cropping systems) in 2019 and 2020.
Average Single-Plant Yield at 15% Grain Moisture (g)
20192020
Bare Soil
Overall average191.41151.39
7016CNV171.00152.10
1197212.35150.78
KBG
Overall average138.2272.97
7016CNV132.9963.92
1197143.2579.91
Publisher’s Note: MDPI stays neutral with regard to jurisdictional claims in published maps and institutional affiliations.

