Article

Comparison of the Nutritional Composition of Quinoa (Chenopodium quinoa Willd.) Inflorescences, Green Leaves, and Grains

Cooperative Research, Department of Agriculture and Environmental Sciences, Lincoln University of Missouri, Jefferson City, MO 65102, USA
*
Author to whom correspondence should be addressed.
Crops 2024, 4(1), 72-81; https://doi.org/10.3390/crops4010006
Submission received: 19 January 2024 / Revised: 22 February 2024 / Accepted: 26 February 2024 / Published: 29 February 2024

Abstract

:
The nutritional composition of different parts of quinoa (Chenopodium quinoa Willd.), such as sprouts, green leaves, and grains, have previously been studied in detail. This study aimed to compare the nutritional values of quinoa inflorescences against those of quinoa leaves and grains. The assessment of nutritional composition includes crude protein, crude fat, fiber, ash, carbohydrates, essential amino acids, and minerals. The proximate analysis showed that on a dry weight (DW) basis, quinoa inflorescences contain higher amounts of protein, fiber, all essential amino acids, and minerals when compared to quinoa grains. However, quinoa green leaves have higher protein and fat contents than quinoa inflorescences, while retaining all essential amino acids and minerals. Inflorescences possess a higher fiber content and a lower fat content than green leaves and grains do. In this study, nutritional assessments of inflorescences typically ranked in the middle when compared to those of green leaves and grains. These findings emphasize the nutritional potential of quinoa inflorescences as prospective ingredients to develop healthy foods and supplements that provide health benefits beyond basic nutritional functions. Nevertheless, additional research is essential to confirm and substantiate these results.

1. Introduction

Quinoa (Chenopodium quinoa Willd.) is an important annual dicotyledonous grain crop of the Amaranthaceae family, initially domesticated in the Andean region of South America approximately 7000 years ago. It is one of the most nutritious foods currently known. Quinoa is grown in more than 100 countries, and more than 90% of its production occurs in Peru and Bolivia. Global quinoa production has reached about 175,000 t, with an average yield of 0.93 t ha−1 [1,2]. The United States is the world’s largest consumer and importer of quinoa.
Quinoa grains are gluten-free and contain high quantities of protein, essential amino acids, important minerals, and vitamins [3,4]. Notably, quinoa grains have more protein than cereal grains such as barley, oats, maize, and rice [5]. Quinoa grains are also rich in bioactive compounds such as flavonoids, phenolic acids, bioactive peptides, phytosterols, and saponins [6,7,8,9,10,11,12]. Having regained global popularity for its nutritional excellence, health benefits, richness in bioactive components, and adaptability to hostile climatic conditions, quinoa is referred to as a “superfood”. Its resilience and high nutritional quality led to quinoa being ranked as a potential strategic crop for food and nutritional security [13,14] and being recognized as “one of the grains of the 21st century” [15]. The quinoa plant is resistant to cold, salt, and drought, which leaves no doubt as to why it has been called the “golden grain” [16]. The National Aeronautics and Space Administration (NASA) has considered using quinoa for long-duration human space flights because of its high protein content and unique amino acid composition [17]. Recognizing its significance, the United Nations (UN) General Assembly declared 2013 as the “International Year of Quinoa”. Numerous research and review articles have been published regarding the nutritional qualities and bioactive components of quinoa grains [18,19,20,21,22,23,24].
Like quinoa grains, quinoa green leaves, sprouts, and microgreens are rich in nutritional value and health-promoting properties [25]. There are several articles regarding the nutritional and bioactive components of quinoa leaves evidenced by published studies [6,26,27]. However, only a few studies have explored the nutritional and bioactive components of quinoa inflorescence and infructescence (the fruiting stage of inflorescence). Debski et al. [11] reported that quinoa infructescence contains more antioxidants and minerals than quinoa leaves. Additionally, Khan and Javid [28] reported that quinoa inflorescence is a rich source of bioactive components with antimicrobial, antifungal, antibacterial, cancer-preventive, anti-inflammatory, and cytotoxic properties.
Previous studies have investigated the nutritional content of flowers and inflorescences from various plant species, including banana [29], coconut [30], cocoyam [31], fennel [32], industrial hemp [33], moringa [34,35], rape and cabbage [36], and torch ginger [37], and revealed a diverse array of nutrients, vitamins, minerals, bioactive components, and nutraceuticals. However, there remains limited information regarding the nutritional profile of quinoa inflorescences. Despite extensive studies of the nutritional composition of quinoa green leaves and grains, additional information about the nutritional content of quinoa inflorescences is required. This study aimed to fill this gap by evaluating the nutritional values of quinoa inflorescences and comparing them with those of quinoa green leaves and grains.

2. Materials and Methods

2.1. Study Location, Plant Material, Experimental Design, Field Preparation, and Seed Sowing

This study was conducted at Lincoln University (LU) George Washington Carver Farm (lat. 38°32′ N, long. 92°80′ W, and elevation 170 m) near Jefferson City, MO, USA. The texture of the soil was a well-drained and moderately permeable silt loam with 20% clay, 0.8% organic matter, and a soil pH from 6.5 to 6.8.
Three quinoa genotypes, namely, PI698747 (previous name Ames13724, origin New Mexico, USA), PI614885 (Chile), and PI665275 (Bolivia) were used in this study. These lines were selected based on their early vegetative growth yield of leafy greens and grains. Seeds of these lines were collected from the USDA-ARS Germplasm Resources Information Network (GRIN-North Central Research Plant Introduction Station, Ames, IA, USA).
The experimental design, field preparation, and planting procedures were conducted following the methodology described by Pathan et al. [38]. All-purpose NPK 12-12-12 fertilizer was applied at 42 kg per ha during the land preparation. Plots were irrigated at the rate of 596 L per hour (Lph) per 100 m or 0.61 Lph per dripper for an hour every two days using a drip irrigation system. When required, weeds were manually removed throughout the growing season (June to September). No herbicide was applied. After flowering, an insecticide named “sevin” (concentration 0.12 L per 3.78 L) was sprayed one time to control tarnished plant bugs called lygus bugs (Lygus lineolaris L.).

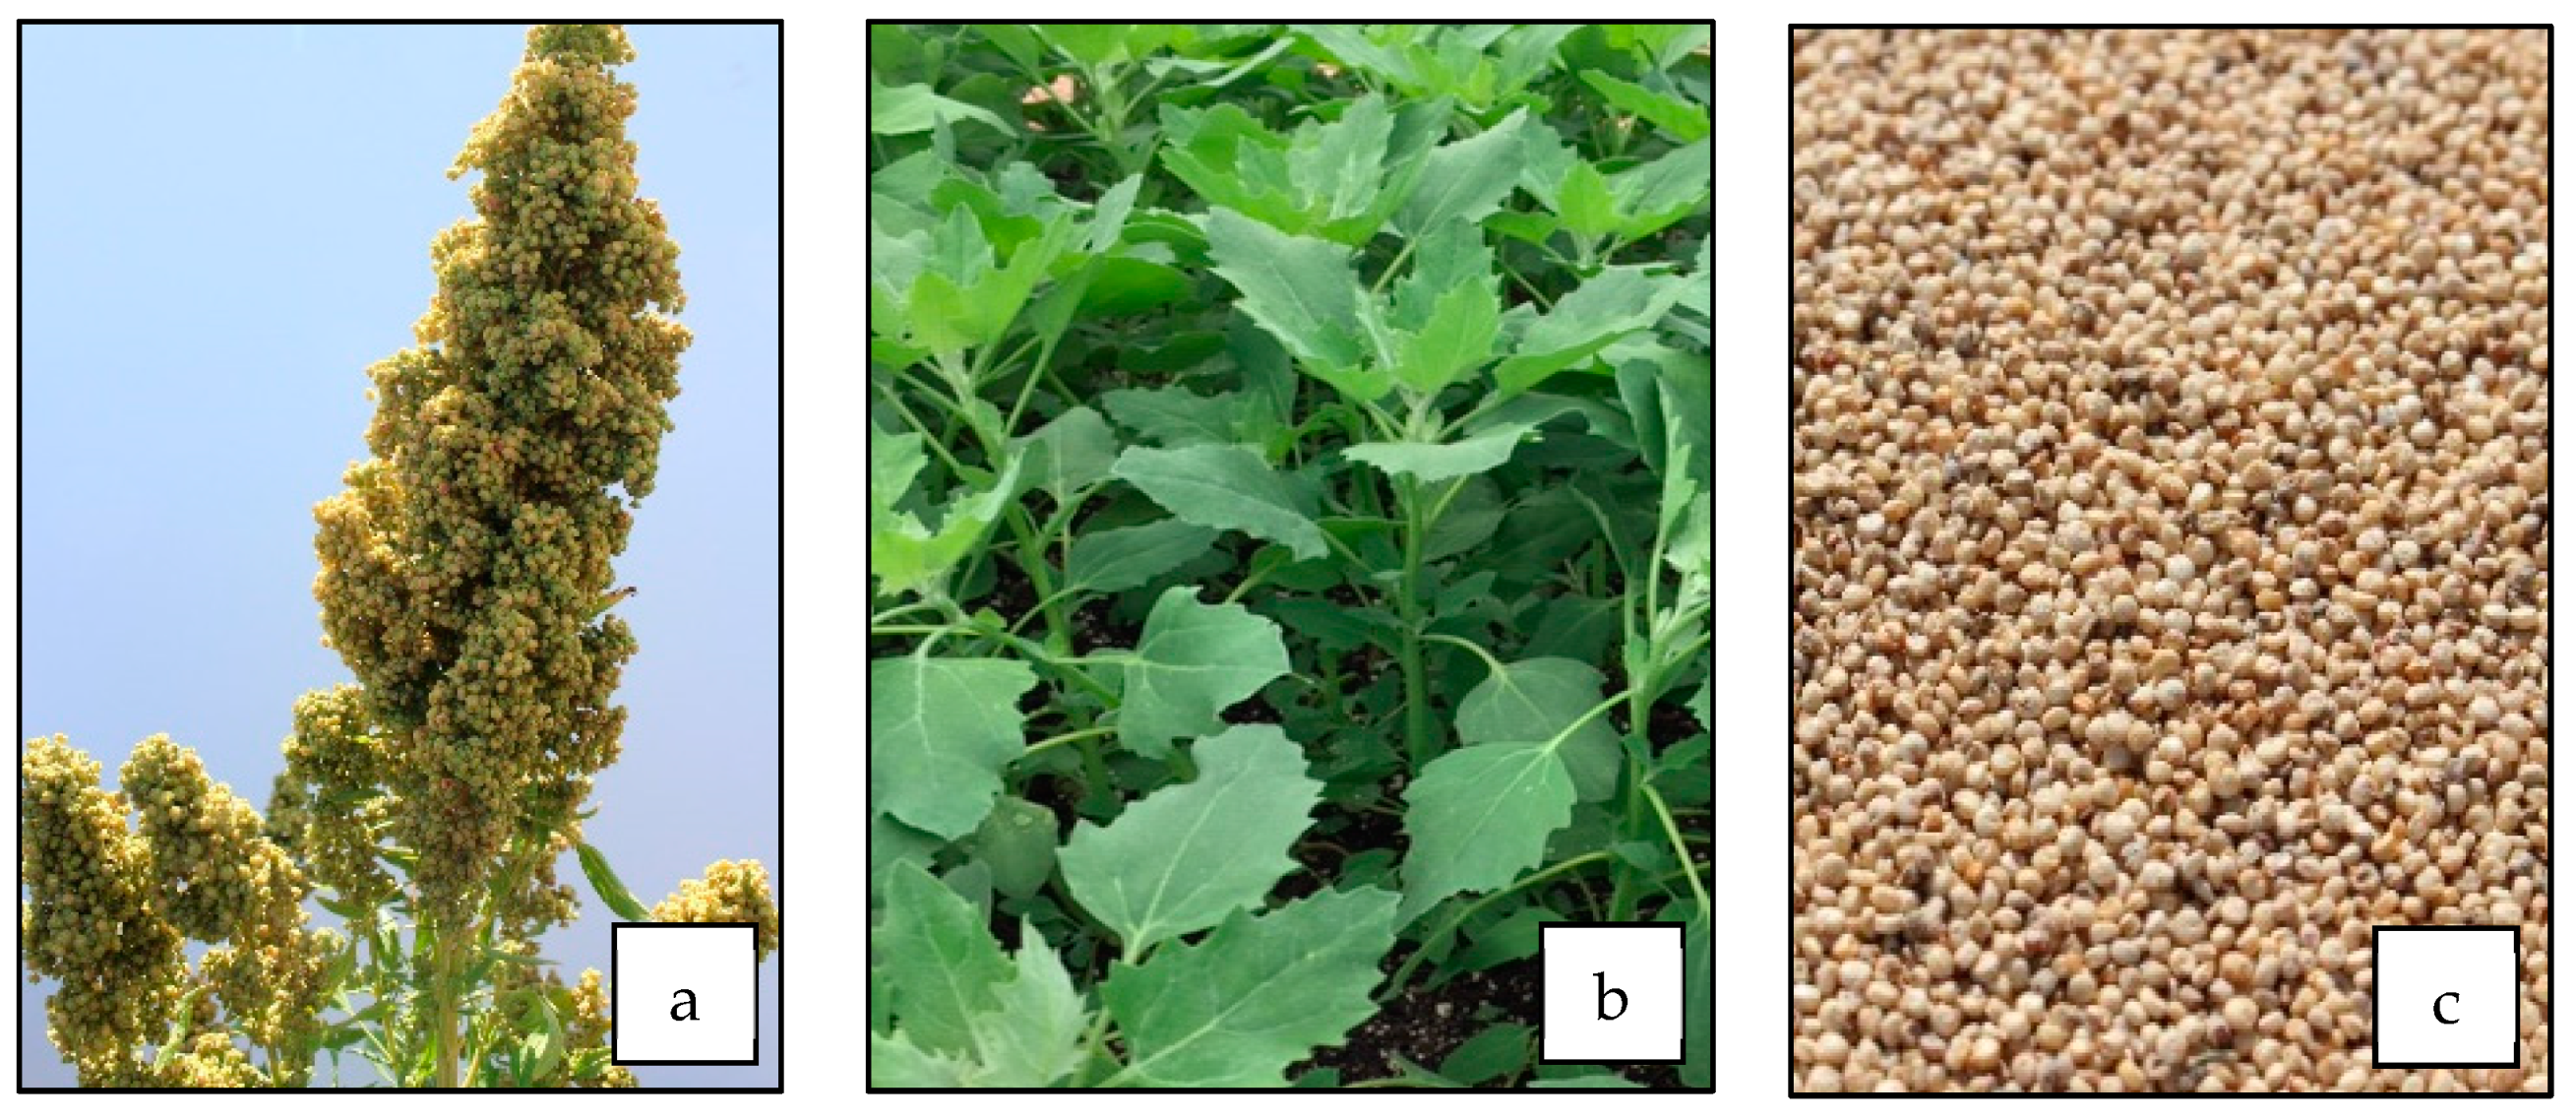
2.2. Sample Collection and Preparation

Samples of quinoa inflorescences, green leaves, and grains (Figure 1a–c) were collected at different times during the crop’s growing season from the same research plot at LU Carver Farm during the summer of 2022. Seeds were sown on June 1. Quinoa is a short-season crop, extending only 90–100 days from planting to grain harvesting. Four-week-old green leaves were collected in the last week of June, inflorescences in the first week of August, and grains in the second week of September (Figure 1). Quinoa green leaves, approximately one month old, weighing approximately 500 g, were collected from each replicated plot. These leaves were then washed with distilled water and allowed to air-dry at room temperature for an hour. The washed samples were later dried in an oven at 50 °C for 72 h. Each sample was separately ground into powder using a grinder (Cyclotec Mill Foss 1093, FSS A/S, Eden Prairie, MN, USA). Fresh samples of quinoa inflorescences (approximately 200 g) were collected from each plot (60–65 days after seedling emergence, at BBCH code stages 60–69). The collected inflorescences were washed, dried, and subsequently ground into a powder similar to that produced from the leaf samples. About 50 g of grains from each plot were washed for 5 min with distilled water to remove unfilled seeds and dust, then left to dry at room temperature for an hour, and later dried in an oven at 50 °C for 72 h. Each sample was separately ground into powder. All ground samples were placed in labeled plastic bags and stored in a cool, dry place until chemical analysis.

2.3. Chemical Analysis

Proximate, amino acid, and mineral analyses were conducted following Pathan et al. [38]. The food values of quinoa green leaves, inflorescences, and grains were calculated by multiplying their protein, fat, and carbohydrate contents by factors of 4, 9, and 4, respectively, and adding these values to obtain kcal per 100 g [39].

2.4. Statistical Analysis

The statistical procedure SAS Proc GLM was used to evaluate nutritional values using the quinoa green leaves, inflorescences, and grains dataset. Data were analyzed using SAS statistical software (Version 9.3) to realize variability among varieties and treatment groups for yield, all agronomic traits, and nutritional values [40]. Tukey’s honestly significance difference (HSD) test was used at the p ≤ 0.05 significance level to determine differences in nutritional components for different plant parts. Pearson’s correlation analysis was performed using the metan library in R software. JMP Pro 13 Software was used to perform principal component analysis (PCA) [41]. The PCA compared the quinoa lines and treatment groups according to their proximate, mineral, and amino acid compositions.

3. Results and Discussion

The analysis of variance revealed significant differences among quinoa green leaves, inflorescences, and grains regarding their protein (Pro), fat (Fat), fiber (Fib), ash (Ash), carbohydrate (Carb), calcium (Ca), potassium (K), magnesium (Mg), phosphorus (P), and zinc (Zn) contents. The variety-by-treatment group interaction was significant for Fat and Fib, as was variety for Fat, Fib, and Ash. Quinoa varieties had significantly different Fat, Fib, Ash, K, and Fe contents. The treatment-by-variety interaction was significantly influenced by Fat, Fib, Ca, K, Fe, and Zn composition (Table S1).

3.1. Proximate Analysis

The green leaves, inflorescences, and grains exhibited significant variations in crude protein, crude fat, fiber, ash, and carbohydrate contents, as shown in Table 1. Quinoa green leaves showed a significantly higher protein content of 33.40 g/100 g on a dry weight (DW) basis, compared to the 25.09 and 14.74 g/100 g found in inflorescences and grains, respectively. However, quinoa inflorescences showed significantly higher fiber content and lower fat content compared to both leaves and grains (Table 1).
The crude protein (CP) contents of quinoa green leaves and grains agreed with previous reports [21,23]. The ash content was at its lowest in quinoa grains, measuring 4.31 g, while in leaves and inflorescences it was higher, at 16.91 g/100 g and 15.37 g/100 g, respectively. The order of carbohydrate and energy content was grains > inflorescences > green leaves. As there is no information available regarding the nutritional composition of quinoa inflorescences to compare with CP and other assessed nutrients in this study, our discussion focuses more on inflorescences than green leaves and grains.
The CP content of quinoa inflorescences was higher (25.09 g) compared to those found in other inflorescences such as Moringa oleifera (20.48 g), torch ginger (12.6 g), and banana (15.82 g/100 g, DW) [26,34,35]. However, on a fresh weight (FW) basis (about 80% moisture content), much lower CPs were reported in other inflorescences such as rape and cabbage (4.19–4.40 g) and fennel (1.37 g/100 g, FW) [29,33]. The fat content of quinoa inflorescences, 2.80 g/100 g on a dry weight basis, exceeded that of Moringa oleifera (1.83 g) and banana (0.6 g). However, it was lower than the fat content of torch ginger, which was recorded at 18.2 g/100 g on a dry weight basis. Similar or lower ash and fiber contents were found in this study compared with those of torch ginger inflorescences. Quinoa inflorescences were found to have a lower energy content, 323 kcal/100 g, compared to rape and cabbage, which ranges between 383 and 388 kcal/100 g, as reported by Batista et al. [36].
The essential amino acids (EAAs) content (g/100 g protein) of quinoa inflorescences, green leaves, and grains, and published results, are presented in Table 2. The nine EAAs that humans cannot synthesize were found in good quantities in inflorescences. The results showed that total EAA contents were 30.95, 37.82, and 33.23 g/100 g of protein in quinoa inflorescences, leaves, and grains, respectively. The above results indicate that the order of EAAs concentration in quinoa is as follows: leaves > grains > inflorescences. Inflorescences exhibited higher concentrations of leucine (5.53 g), followed by lysine (5.24 g) and valine (4.20 g), with methionine (1.31 g) being the least abundant. Our findings agree with earlier reports [21,23].

3.2. Mineral

Mineral contents (mg/100 g DW) of quinoa inflorescences, leaves, and grains are presented in Table 3. No significant differences were found in the mineral content the three tested varieties, with the exception of K and Fe (Table S1). However, there were significant differences in the mineral content of quinoa’s different plant parts. Quinoa leaves contained a higher amount of Ca (1109.56 mg) and K (6755.56 mg), inflorescence contained Mg (622.78 mg) and P (615.33 mg), and the iron content was similar in all three plant parts (~10 mg).
Overall, mineral content values were higher in quinoa leaves than they were in quinoa grains [21,23]. In this study, the general order of mineral content was leaves > inflorescences > grains; for example, Ca content values were 1109.56 > 835.78 > 76.67 mg per 100 g DW, respectively, and K content values were 6755.56 > 6125.56 > 1516.67 mg per 100 g DW, respectively. Debski et al. [11] found higher amounts of Mg and Zn in quinoa leaves than in quinoa infructescence, but a higher amount of Fe in infructescence than in leaves. Variations in nutritional and mineral contents in different plant parts may be due to the presence of organ-specific physiological activities. Magnesium plays a crucial role as a vital nutrient in regulating photosynthesis, facilitating nutrient distribution among various plant components, and is indispensable for the transportation of N within the plant [42].

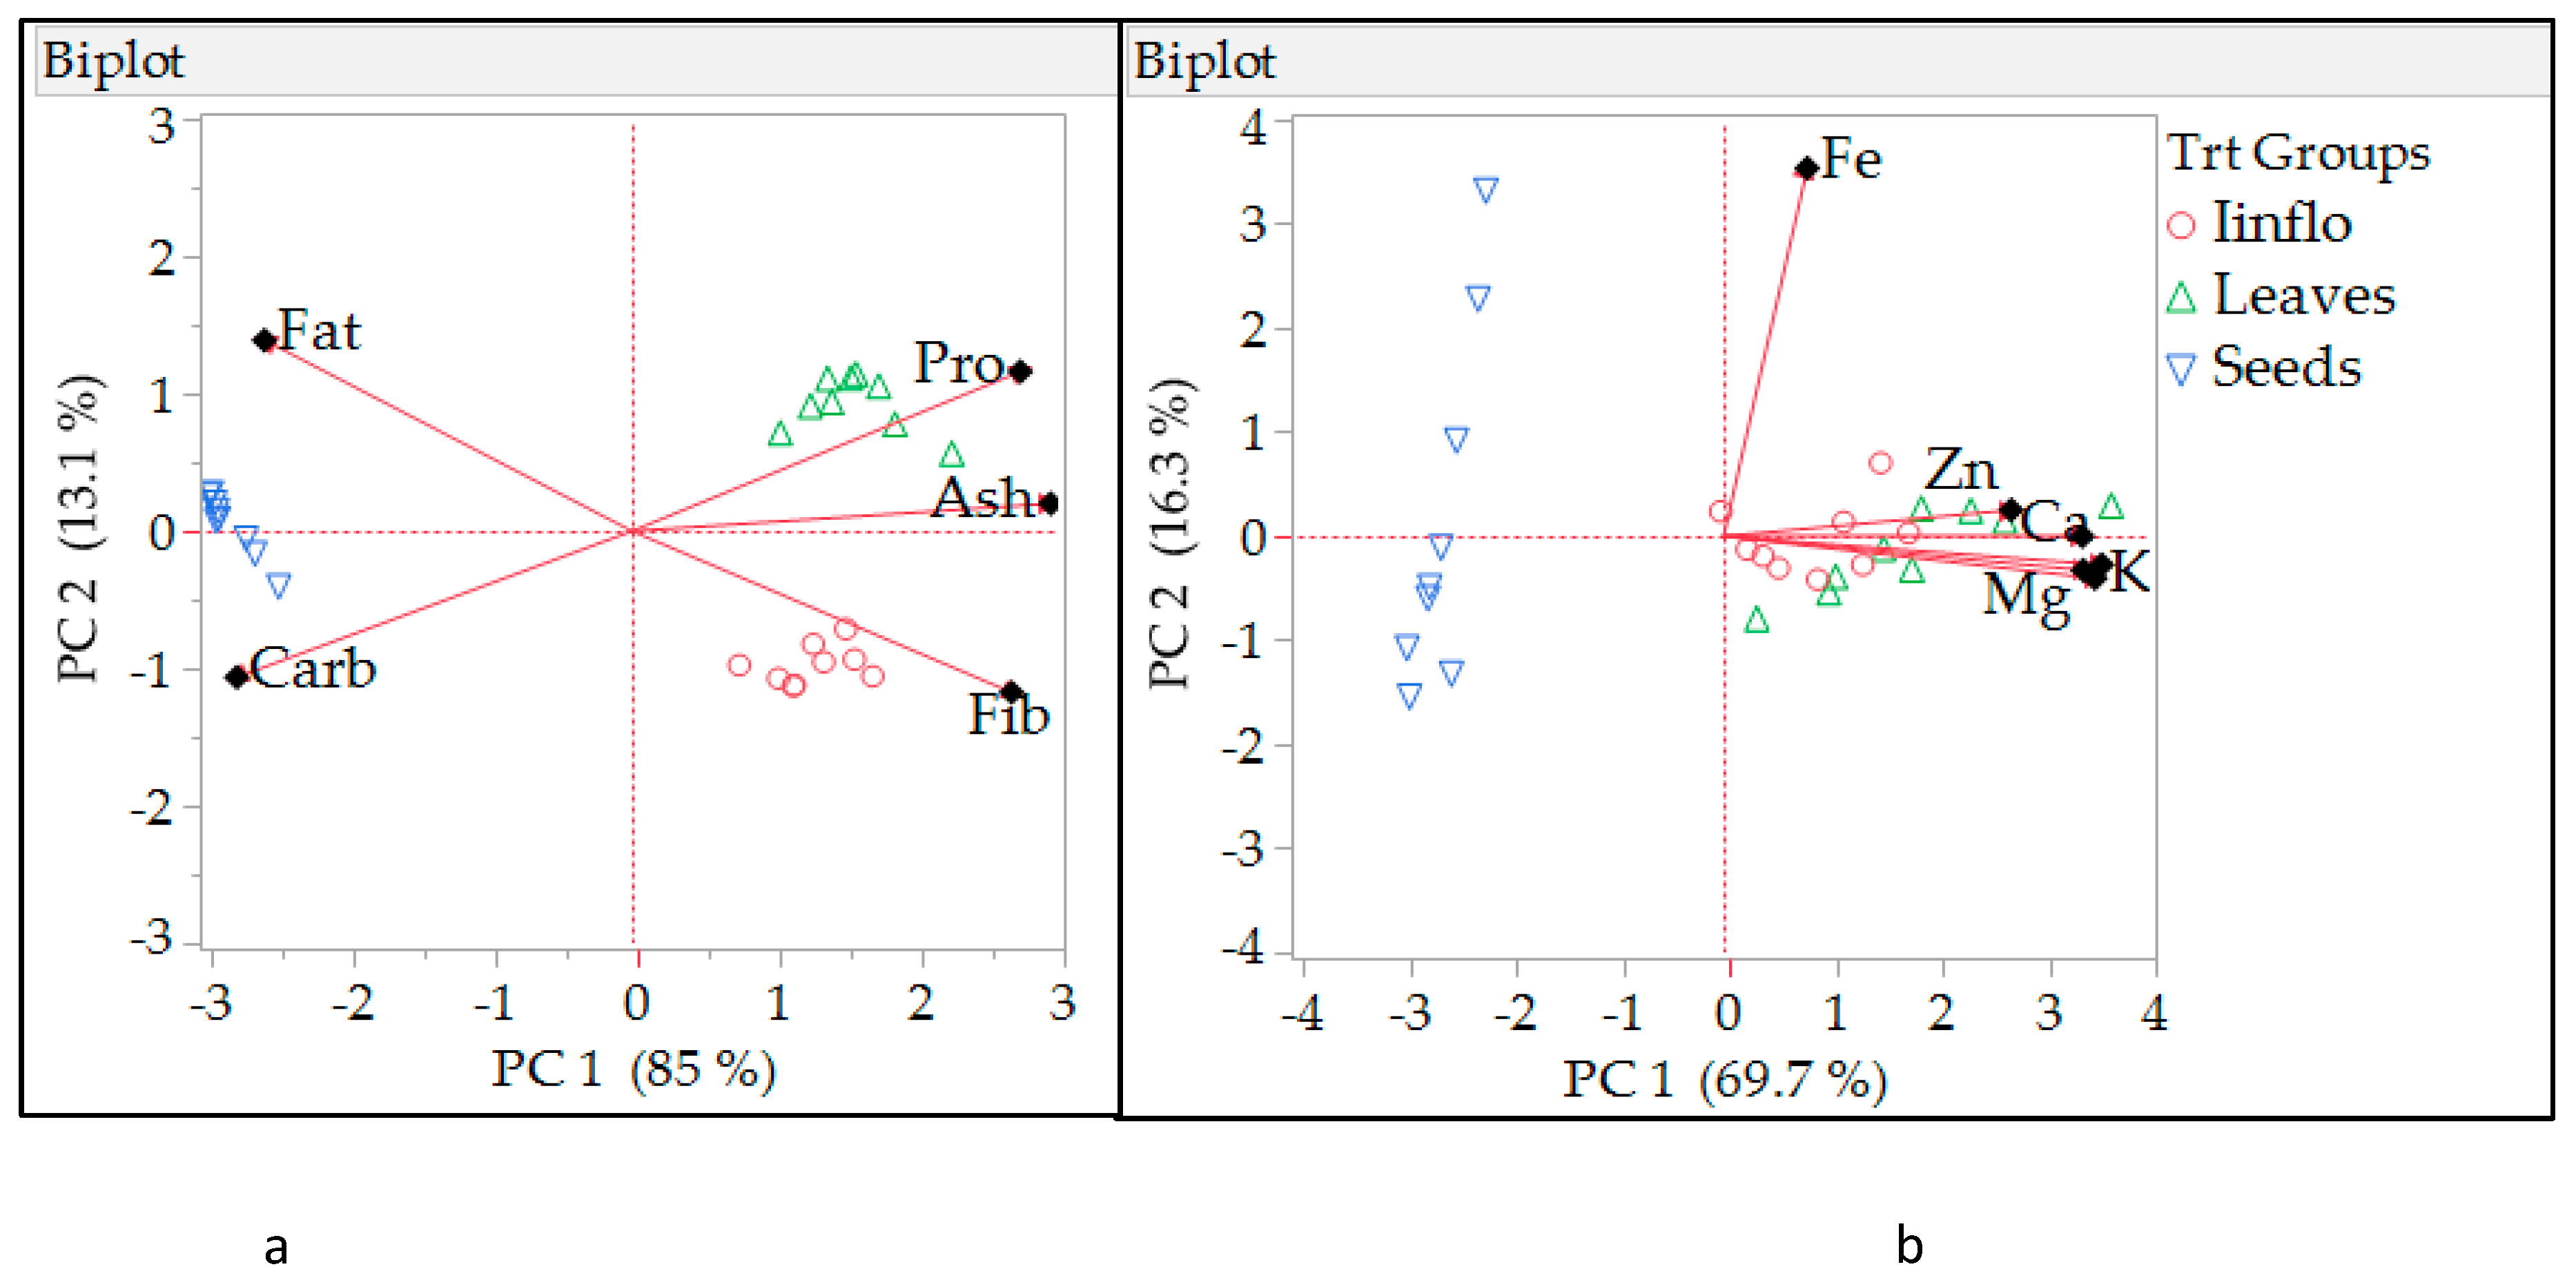
3.3. Principal Component Analysis (PCA)

Principal component analysis (PCA) recognized the grouping patterns of different nutrient and mineral components (Figure 2) of the quinoa green leaves, inflorescences, and grains. Utilizing PCA, data condensation was employed to reveal associations among the investigated nutritional aspects of quinoa. The predominant variability in the proximate dataset (Figure 2a) was primarily captured by the first principal component, which accounted for 85%. The PC1 demonstrated positive loadings for protein (Pro) and fiber (Fib), suggesting that there was a positive correlation between proximate and PC1. Samples with higher scores on the PC1 were likely to have higher protein and ash content compared to samples with lower PC1 scores. The PCA also showed patterns in these data that implied that PC1 captured the main pattern or trend in these data regarding protein and ash contents. Samples that were similar in terms of their protein and ash contents tended to have similar PC1 scores. PC1 can be considered an informative dimension that separated samples based on their protein and ash content. Also, the positive loading of protein on PC1 suggests that protein and ash contents were significant contributors to the overall variability captured by PC1. In summary, a positive loading for protein on PC1 indicates that protein and ash content were key factors influencing the variation observed in the dataset, and higher PC1 scores corresponded to higher protein and ash content in the analyzed samples. On the other hand, PC1 showed negative loadings for fat and carbohydrate (Carb), suggesting negative correlation with the underlying structure captured by PC1. The inverse relationship between the principal component (PC1) and fat and carbohydrate content suggests that PC1 captured some underlying structure or pattern in these data that were associated with variations in fat content.
The second component of the PCA explained only 13.1% of the total variation in the proximate dataset. PC2 exhibited positive loadings for protein and fat, coupled with negative loadings for fiber and carbohydrate (Figure 2a). PC1 showed a significant correlation with ash, while PC2 demonstrated a robust association with fat. The PCA biplot of the proximate analysis depicted a relationship between leaves and protein, ash, and fiber, whereas fat and carbohydrates correlated with quinoa grains.
The mineral content evaluation of quinoa through PCA explained 69.7% of the variation in the dataset under component 1 (Figure 2b), with positive loading for all minerals tested. On PC1, the length of eigenvectors for K, Mg, and P were similar and strongly associated with PC1. Component 2 explained 16.3% of the variability in these data; it loaded positively with Fe. Both inflorescence and leaf correlated with Ca, K, Mg, P, Fe, and Zn. K, P, Ca, and Mg are essential macronutrients for plants, and each play a crucial role.
Calcium is vital, as it constitutes a fundamental component of plant cell walls and significantly contributes to plant cell signaling [43]. Simultaneously, magnesium serves as a key nutrient in regulating photosynthesis and the distribution of nutrients among various plant parts. Moreover, magnesium is indispensable for nitrogen transport within the plant [40]. Examining the correlation of these essential nutrients with the inflorescences and leaves of quinoa, particularly when incorporated into salads, could potentially offer health benefits to the human body. Finally, quinoa grains correlated with Ca, K, Mg, and P mineral parameters. Eigenvalues, variability, and cumulative values are presented in Table S2.

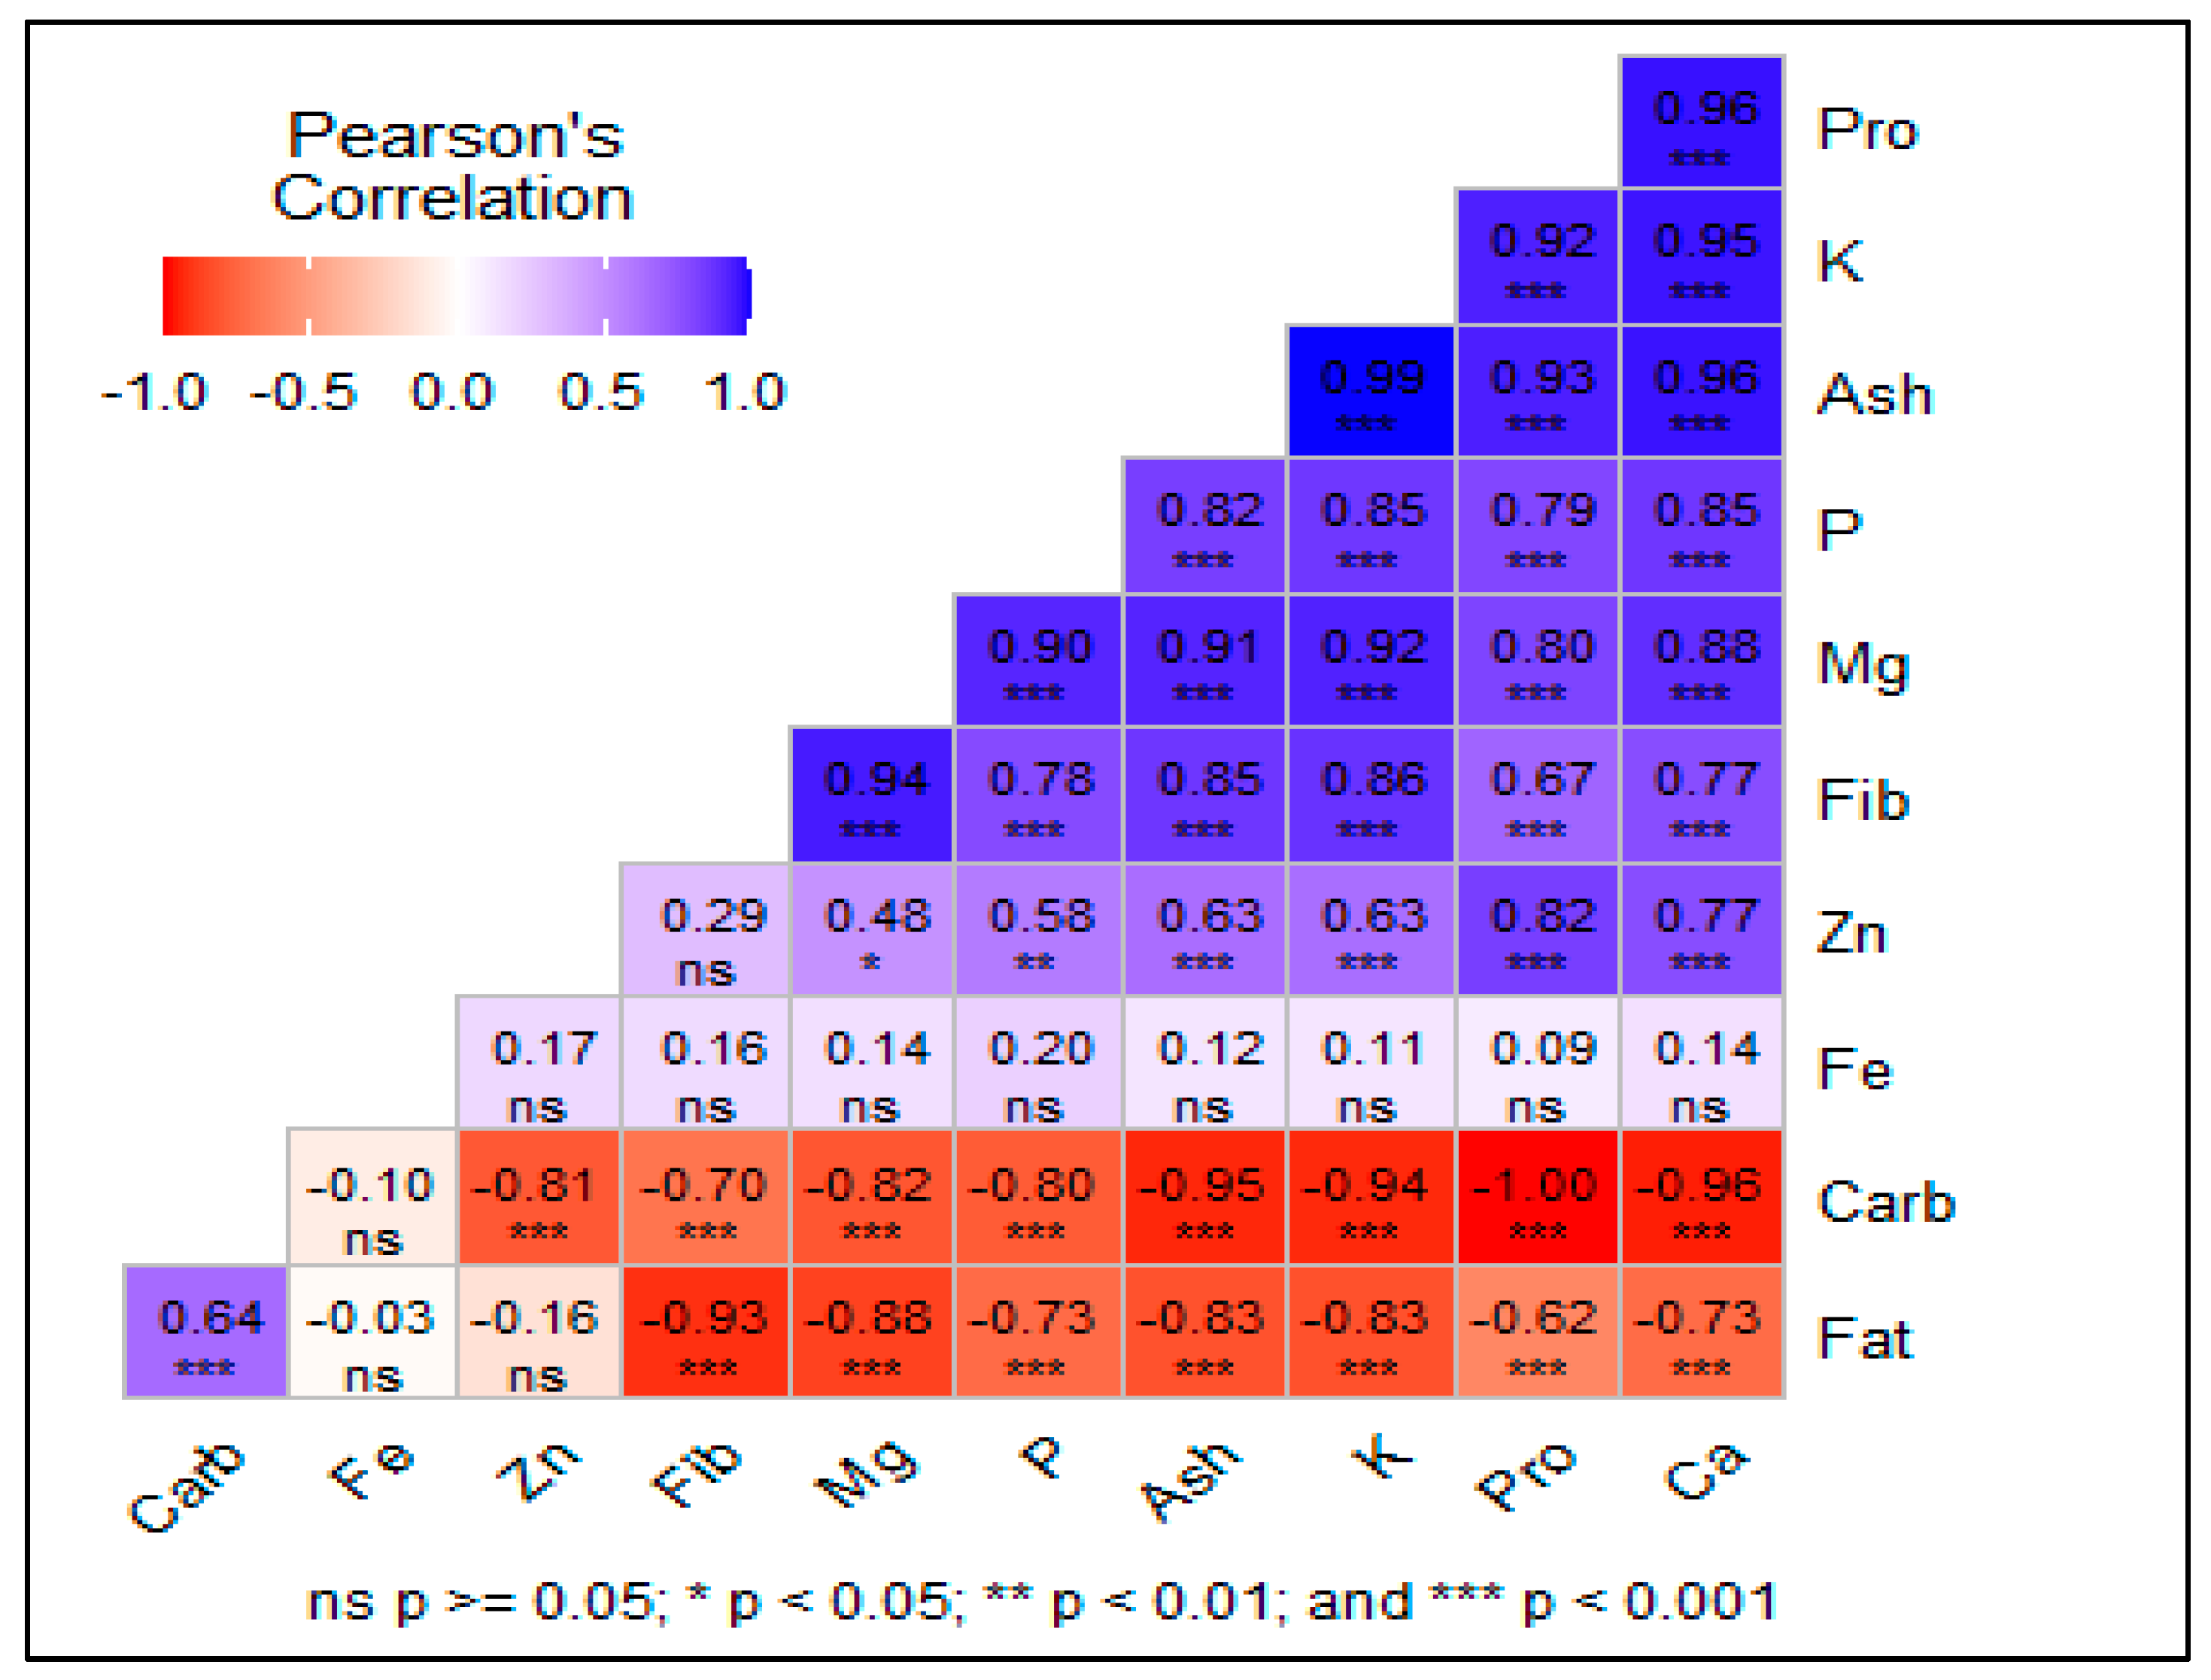
3.4. Correlation of Traits

Figure 3 shows the correlation between proximate and mineral nutrient values of quinoa. Notably, protein exhibited strong positive correlations with fiber (r = 0.67), ash (r = 0.93), zinc (r = 0.82), magnesium (r = 0.80), phosphorus (r = 0.79), and potassium (r = 0.92). A strong correlation between protein and phosphorus (P), magnesium (Mg), potassium (K), and ash content in quinoa can be attributed to several factors. As the plant synthesizes protein, it may also require adequate levels of phosphorus, magnesium, and potassium, leading to a correlated accumulation of these nutrients in the seeds. Quinoa naturally produces notable proteins in its grain leaves and florescence. Therefore, adequate levels of essential minerals, including phosphorus, magnesium, and potassium, are required for protein synthesis and overall plant health. The plant may regulate the uptake and allocation of these nutrients to ensure optimal protein production, resulting in a strong correlation between protein and phosphorus, magnesium, and potassium in the seeds. Protein displayed negative correlations with fat (r = −0.62) and carbohydrates (r = −1.00). Calcium displayed a substantial negative correlation with fat (r = −0.73) and carbohydrates (r = −0.96), while indicating positive correlations with all minerals (except iron), as well as the proximate nutritional values of quinoa. It has been reported that the protein content of both quinoa leaf and grain has a negative association with fat and carbohydrates [25,38]. Quinoa inflorescence and leaves contain less carbohydrates and fat compared to quinoa grain. However, all quinoa parts, including grains, are characterized by high protein content and low levels of carbohydrates and fats [25,38]. This nutritional profile makes quinoa a healthy food choice that can contribute to weight loss when required.

4. Conclusions

The results of this study provide essential information regarding the nutritional values of quinoa inflorescences, which demonstrate higher amounts of protein, fiber, all essential amino acids, and minerals (Ca, K, Mg, and P) when compared to quinoa grains.
Compared to quinoa leaves and grains, inflorescences exhibited significantly higher fiber content and lower fat content. However, quinoa green leaves contain higher amounts of protein, fat, and all essential amino acids than quinoa inflorescences do. Quinoa inflorescences have significant potential to develop into valuable food ingredients and nutraceuticals. From our unpublished data, preliminary findings indicate that quinoa stems bearing inflorescence exhibit significant potential as forage for livestock, which requires further investigation. Based on our knowledge and available reports, more research is required regarding the nutritional compositions of quinoa inflorescences, and the findings of this study will facilitate further investigations.

Supplementary Materials

The following supporting information can be downloaded at https://www.mdpi.com/article/10.3390/crops4010006/s1, Table S1. Analysis of variance; Table S2. Eigenvalues, variability, and cumulative values.

Author Contributions

Conceptualization, funding acquisition, project administration, data curation, methodology, investigation, formal analysis, writing—original draft, review, and editing, S.P.; investigation, formal analysis, validation, and writing—review and editing, A.G.A.; methodology and visualization, G.N. All authors have read and agreed to the published version of the manuscript.

Funding

This study was funded through the senior author (S.P.) by the USDA-NIFA Capacity Building Grant (#13471129) for “Assessment of Nutritional, Bioactive Components and Human Health Benefits of Green Leaves of Quinoa”. Additionally, partial support was provided through the USDA-NIFA Evans-Allen project (#1019846).

Institutional Review Board Statement

Not applicable.

Informed Consent Statement

Not applicable.

Data Availability Statement

Raw data supporting the results of this article will be made available by the authors without reservation.

Acknowledgments

The senior author (S.P.) would like to thank Lincoln University of Missouri for supporting this research and the USDA-NIFA for funding. Also, the authors would like to thank the USDA-Germplasm Resources Information Network (GRIN) for providing quinoa germplasm through the GRIN-North Central Research Plant Introduction Station, Ames, IA, USA. We extend our special thanks to Stephanie Cobian for her valuable contribution in editing this manuscript.

Conflicts of Interest

The authors declare no conflicts of interest.

References

  1. Alandia, G.; Rodriguez, J.; Jacobsen, S.-E.; Bazile, D.; Condori, B. Global expansion of quinoa and challenges for the Andean region. Glob. Food Secur. 2020, 26, 100429. [Google Scholar] [CrossRef]
  2. FAOSTAT. FAOSTAT Database. 2022. Available online: https://www.fao.org/faostat/en/#data/QCL (accessed on 12 March 2023).
  3. Bazile, D.; Baudron, F. The dynamics of the global expansion of quinoa growing in view of its high biodiversity. In State of the Art Report of Quinoa in the World in 2013; Bazile, D., Bertero, H.D., Nieto, C., Eds.; FAO: Rome, Italy; CIRAD: Rome, Italy, 2015; pp. 42–55. Available online: https://fao.org/3/a-i4042e.pdf (accessed on 25 October 2023).
  4. Bazile, D.; Pulvento, C.; Verniau, A.; Al-Nusairi, M.S.; Ba, D.; Breidy, J.; Hassan, L.; Mohammed, M.I.; Mambetov, O.; Otambekova, M.; et al. Worldwide evaluations of quinoa: Preliminary results from post international year of quinoa FAO projects in nine countries. Front. Plant Sci. 2016, 7, 850. [Google Scholar] [CrossRef] [PubMed]
  5. Sindhu, R.; Khatkar, B.S. Pseudocereals nutritional composition functional properties and food applications. Food Bioact. Funct. Appl. Hum. Health 2019, 28, 410. [Google Scholar]
  6. Abd El-Samad, E.; Hussin, S.; El-Naggar, A.; El-Bordeny, N.; Eisa, S. The potential use of quinoa as a new non-traditional leafy vegetable crop. Biosci. Res. 2018, 15, 3387–3403. [Google Scholar]
  7. Alvarez-Jubete, L.; Wijngaard, H.; Arendt, E.; Gallagher, E. Polyphenol composition and in vitro antioxidant activity of amaranth, quinoa, buckwheat and wheat as affected by sprouting and baking. Food Chem. 2010, 119, 770–778. [Google Scholar] [CrossRef]
  8. Chacaliaza-Rodríguez, L.; Espinoza-Begazo, G.; Ramos-Escudero, F.; Servan, K. Proximate chemical composition and content of biologically active components in leaves of two quinoa cultivars (Salcedo and Altiplano) produced in Peru. Res. J. Med. Plant. 2016, 10, 450–456. [Google Scholar] [CrossRef]
  9. Chen, H.-L.; Lan, X.-Z.; Wu, Y.-Y.; Ou, Y.-W.; Chen, T.C.; Wu, W.-T. The antioxidant activity and nitric oxide production of extracts obtained from the leaves of Chenopodium quinoa Willd. Biomedicine 2017, 7, 24–28. [Google Scholar] [CrossRef] [PubMed]
  10. Choque-Quispe, D.; LigardaSamanez, C.A.; RamosPacheco, B.S.; Legu’ıaDamiano, S.; CallaFlórez, M.; ZamalloaPuma, L.M.; ColqueCondeña, L. Phenolic compounds, antioxidant capacity, and protein content of three varieties of germinated quinoa (Chenopodium quinoa Willd). Ing. Investig. 2021, 41, e89831. [Google Scholar] [CrossRef]
  11. Debski, B.; Gralak, M.A.; Bertrandt, J.; Klos, A. Comparison of antioxidant potential and mineral composition of quinoa and lamb’s quarters weed (Chenopodium album). Probl. High Epidemiol. 2018, 99, 88–93. [Google Scholar]
  12. Olivera, L.; Best, I.; Paredes, P.; Perez, N.; Chong, L.; Marzano, A. Nutritional value, methods for extraction and bioactive compounds of quinoa. In Pseudocereals; IntechOpen: London, UK, 2022; p. 107. [Google Scholar]
  13. FAO. Resolution. Quinoa: An Ancient Crop to Contribute with World Food Security, FAO Regional Office for Latin America and the Caribbean Ed. Santiago de Chile. 2011. Available online: http://www.fao.org/3/aq287e/aq287e.pdf (accessed on 28 October 2023).
  14. Rojas, W.; Pinto, M.; Alanoca, C.; Gómez, P.L.; Leon-Lobos, P.; Alercia, A.; Diulgheroff, S.; Padulosi, S.; Bazile, D. Quinoa genetic resources and ex-situ conservation. In State of the Art Report on Quinoa around the World in 2013; Bazile, D., Bertero, H.D., Nieto, C., Eds.; FAO: Rome, Italy, 2015; pp. 56–82. ISBN 978-92-5-108558-5. Available online: http://fao.org/quinoa-2013/publications/detail/en/item/278923/icode/?no_mobile=1 (accessed on 11 October 2023).
  15. Vilcacundo, R.; Hernández-Ledesma, B. Nutritional and biological value of quinoa (Chenopodium quinoa Willd.). Curr. Opin. Food Sci. 2017, 14, 1–6. [Google Scholar] [CrossRef]
  16. Angeli, V.; Miguel Silva, P.; Crispim Massuela, D.; Khan, M.W.; Hamar, A.; Khajehei, F.; Graeff-Hönninger, S.; Piatti, C. Quinoa (Chenopodium quinoa Willd.): An overview of the potentials of the “golden grain” and socio-economic and environmental aspects of its cultivation and marketization. Foods 2020, 9, 216. [Google Scholar] [CrossRef] [PubMed]
  17. Schlick, G.; Bebenheim, D.L. Quinoa—An Emerging New Crop with Potential CELSS. NASA Technical Report. NASA-TP-3422. 1993. Available online: http://ntrs.nasa.gov/citations/19940015664 (accessed on 10 September 2023).
  18. Bhargava, A.; Shukla, S.; Deepak, O. Chenopodium quinoa: An Indian perspective. Ind. Crops Prod. 2006, 23, 73–87. [Google Scholar] [CrossRef]
  19. Craine, E.B.; Murphy, K.M. Seed composition and amino acid profiles for quinoa grown in Washington State. Front. Nutr. 2020, 7, 126. [Google Scholar] [CrossRef] [PubMed]
  20. Hernández-Ledesma, B. Quinoa (Chenopodium quinoa Willd.) as source of bioactive compounds: A review. Bioact. Comp. Health Dis. 2019, 2, 27–47. [Google Scholar] [CrossRef]
  21. Jancurová, M.; Minarovičová, L.; Dandár, A. Quinoa-A Review. Czech J. Food Sci. 2009, 27, 71–79. [Google Scholar] [CrossRef]
  22. Melini, V.; Melini, F. Functional components and anti-nutritional factors in gluten-free grains: A focus on quinoa seeds. Foods 2021, 10, 351. [Google Scholar] [CrossRef] [PubMed]
  23. Nowak, V.; Du, J.; Charrondière, R.J. Assessment of the nutritional composition of quinoa (Chenopodium quinoa Willd.). Food Chem. 2016, 193, 47–54. [Google Scholar] [CrossRef]
  24. Ruiz, K.B.; Biondi, S.; Oses, R.; Acuña-Rodríguez, I.S.; Antognoni, F.; Martinez-Mosqueira, E.A.; Coulibaly, A.; Canahua-Murillo, A.; Pinto, M.; Zurita-Silva, A.; et al. Quinoa biodiversity and sustainability for food security under climate change. A review. Agron. Sustain. Dev. 2014, 34, 349–359. [Google Scholar] [CrossRef]
  25. Pathan, S.; Ndunguru, G.; Islam, M.R.; Jhumur, S.; Ayele, A. Production of quinoa leafy greens in high tunnel for season extension in Missouri. Horticulturae 2023, 9, 209. [Google Scholar] [CrossRef]
  26. Pathan, S.; Eivazi, F.; Valliyodan, B.; Paul, K.; Ndunguru, G.; Clark, K. Nutritional composition of the green leaves of quinoa (Chenopodium quinoa Willd.). J. Food Res. 2019, 8, 55–65. [Google Scholar] [CrossRef]
  27. Pathan, S.; Siddiqui, R. Nutritional composition and bioactive components in quinoa greens—A Review. Nutrients 2022, 14, 558. [Google Scholar] [CrossRef] [PubMed]
  28. Khan, I.H.; Javaid, A. Anticancer, antimicrobial and antioxidant compounds of quinoa inflorescence. Adv. Life Sci. 2020, 8, 68–72. [Google Scholar]
  29. Lau, B.F.; Kong, K.W.; Leong, K.H.; Sun, J.; He, X.; Wang, Z.; Mustafa, M.R.; Ling, T.C.; Ismail, A. Banana inflorescence: Its bio-prospects as an ingredient for functional foods. Trends Food Sci. Technol. 2020, 97, 14–28. [Google Scholar] [CrossRef]
  30. Femi, B.; Malhija, N.; Mary, T.S.; Kumaran, T. Coconut (Cocos nucifera) inflorescences sap nutritional characteristics and health effects. J. Basic Appl. Res. Biomed. 2020, 6, 50–52. [Google Scholar]
  31. Okechukwu, K.E.; Lawretta, P.I.; Eberechukwu, A.C.; Stanley, O.K.; Egbuta, K.C.; Joel, N.C. Nutritive and anti-nutritive evaluation of cocoyam (Colocasia Esculenta L. Schott) inflorescence. Am. J. Food Sci. Technol. 2020, 8, 42–48. [Google Scholar]
  32. Barros, L.; Carvalho, A.M.; Ferreira, I. The nutritional composition of fennel (Foeniculum vulgare): Shoots, leaves, stems and inflorescences. LWT-Food Sci. Technol. 2010, 43, 814–818. [Google Scholar] [CrossRef]
  33. Spano, M.; Di Matteo, G.; Ingallina, C.; Sobolev, A.P.; Giusti, A.M.; Vinci, G.; Cammarone, S.; Tortora, C.; Lamelza, L.; Prencipe, S.A.; et al. Industrial hemp (Cannabis sativa L.) inflorescences as novel food: The effect of different agronomical practices on chemical profile. Foods 2022, 11, 3658. [Google Scholar] [CrossRef]
  34. Meireles, D.; Gomes, J.; Lopes, L. A review of properties, nutritional and pharmaceutical applications of Moringa oleifera: Integrative approach on conventional and traditional Asian medicine. Adv. Tradit. Med. 2020, 20, 495–515. [Google Scholar] [CrossRef]
  35. Upadhyay, P.; Yadav, M.K.; Mishra, S.; Sharma, P.; Purohit, S. Moringa oleifera: A review of the medical evidence for its nutritional and pharmacological properties. Int. J. Res. Pharm. Sci. 2015, 5, 12–16. [Google Scholar]
  36. Batista, C.; Barros, L.; Carvalho, A.M.; Ferreira, I. Nutritional, and nutraceutical potential of rape (Brassica napus L., var. napus) and ‘tronchuda’ cabbage (Brassica oleraceae L., var. costata) inflorescences. Food Chem. Toxicol. 2011, 49, 1208–1214. [Google Scholar] [CrossRef]
  37. Wijekoon, M.M.; Karim, A.A.; Bhat, R. Evaluation of nutritional quality of torch ginger (Etlingera elatior Jack.) inflorescence. Int Food Res. J. 2011, 18, 1415–1420. [Google Scholar]
  38. Pathan, S.; Ndunguru, G.; Clark, K.; Ayele, A. Yield and nutritional responses of quinoa (Chenopodium quinoa Willd.) genotypes to irrigated, rainfed, and droughts tress environments. Front. Sustain. Food Syst. 2023, 7, 1242187. [Google Scholar] [CrossRef]
  39. Indrayan, A.K.; Sharma, S.; Durgapal, D.; Kumar, N.; Kumar, M. Determination of nutritive value and analysis of mineral elements for somemedicinally valued plants from Uttaranchal. Curr. Sci. 2005, 89, 1252–1255. [Google Scholar]
  40. SAS Software, Version 9.3; SAS: Cary, NC, USA, 2011.
  41. JMP, Version Pro 13; The SAS Institute Inc.: Cary, NC, USA, 2013.
  42. White, P.J. Calcium. In Handbook of Plant Nutrition; Barker, A.V., Pilbeam, D.J., Eds.; CRC Press: Boca Raton, FL, USA, 2015; pp. 165–198. [Google Scholar]
  43. Grzebisz, W. Crop response to magnesium fertilization as affected by nitrogen supply. Plant Soil 2013, 368, 23–39. [Google Scholar] [CrossRef]
Figure 1. Quinoa (a) inflorescences, (b) one-month-old green leaves, and (c) grains.
Crops 04 00006 g001
Figure 2. Principal component analysis (PCA) biplot (grouping and score/scatter plots) of (a) protein (Pro), fat (Fat), fiber (Fib), ash (Ash), and carbohydrate (Carb) and (b) calcium (Ca), potassium (K), magnesium (Mg), phosphorus (P), iron (Fe), and zinc (Zn).
Crops 04 00006 g002
Figure 3. Pearson’s correlation coefficient (r) shows the relationship between proximate analysis and mineral nutrient values of quinoa.
Crops 04 00006 g003
Table 1. Mean values (n = 9) for each trait of quinoa inflorescences (Inflor.), leaves, and grains (g/100 g DW) presented with published results.
This StudyPublished
TraitsInflor.LeavesGrains1 Leaves2 Grains
Range
Protein25.09 b33.40 a14.74 c37.059.10–15.70
Moisture7.38 b9.07 a6.90 b4.008.20–13.10
Fat2.80 c4.16 b6.06 a4.504.00–7.60
Fiber11.43 a8.40 b2.71 c6.931.00–9.20
Ash15.37 b16.91 a4.31 c20.042.00–7.70
Carbohydrate49.36 b36.46 c67.98 a34.0348.50–69.80
Energy323317385325331–381
(kcal/100 g)
Different letters suggest a significant difference among means within a line indicated by Tukey’s honestly significant difference (HSD) test at p ≤ 0.05. 1 Pathan et al. [26]; 2 Nowak et al. [23].
Table 2. Mean values (n = 9) of essential amino acids of quinoa inflorescences (Inflor.), leaves, and grains (g/100 g protein) reported with published results.
This StudyPublished
Amino AcidsInflo.LeavesGrainsLeaves 1Grains 2
Mean, Range
His2.09 b2.14 b2.92 a1.892.70, 1.40–5.40
Ile3.71 b4.57 a3.83 b4.353.10, 0.80–7.40
Leu5.53 c7.46 a5.95 b7.156.00, 2.30–9.40
Lys5.24 c6.07 a5.69 b5.14.80, 2.40–7.80
Met1.31 c1.78 b1.93 a1.621.90, 0.30–9.10
Phe4.14 b4.84 a3.84 c4.836.30, 2.70–10.30
Thr3.26 c4.01 a3.38 b3.913.70, 2.10–8.90
Trp1.47 b1.81 a1.24 c3.320.90, 0.60–1.90
Val4.20 c5.14 a4.45 b4.973.70, 0.80–6.10
Total EAAs30.9537.8233.2337.14
Different letters suggest a significant difference among means within a line indicated by Tukey’s honestly significant difference (HSD) test at p ≤ 0.05. 1 Pathan et al. [26]; 2 Nowak et al. [23].
Table 3. Mean values (n = 9) and standard deviations for studied minerals of quinoa inflorescence (Inflor.), leaves, and grains (mg/100 g DW) reported with published results.
This Study Published
MineralsInflor.LeavesGrains1 Leaves2 Grains
Range
Ca835.78 b1109.56 a76.67 c1535.0028–149
K6125.56 b6755.56 a1516.67 c8769.00207–502
Mg622.78 a575.11 b268.33 c902.00656–1475
P615.33 a625.56 a511.33 b405.62350–482
Fe10.30 a9.88 a9.56 a11.552.60–15.00
Zn6.94 b9.22 a6.58 b6.790.79–4.00
Different letters suggest a significant difference among means within a line indicated by Tukey’s honestly significant difference (HSD) test at p ≤ 0.05. 1 Pathan et al. [26]; 2 Nowak et al. [23].
Disclaimer/Publisher’s Note: The statements, opinions and data contained in all publications are solely those of the individual author(s) and contributor(s) and not of MDPI and/or the editor(s). MDPI and/or the editor(s) disclaim responsibility for any injury to people or property resulting from any ideas, methods, instructions or products referred to in the content.

