Article

A Genome-Wide Association Study of Seed Morphology-Related Traits in Sorghum Mini-Core and Senegalese Lines

1
United States Department of Agriculture, Agricultural Research Service, Sustainable Perennial Crops Laboratory, Beltsville Agricultural Research Center, Beltsville, MD 20705, USA
2
United States Department of Agriculture, Agricultural Research Service, Animal Genomics and Improvement Laboratory, Beltsville, MD 20705, USA
3
Molecular Plant Sciences, Washington State University, Pullman, WA 99164, USA
4
Department of Biotechnology, Korea University, Seoul 02841, Republic of Korea
5
Department of Plant Pathology, University of Minnesota, St. Paul, MN 55108, USA
6
United States Department of Agriculture, Agricultural Research Service, Southern Plains Agricultural Research Center, College Station, TX 77845, USA
7
Department of Plant Pathology and Microbiology, Texas A&M University, College Station, TX 77843, USA
*
Authors to whom correspondence should be addressed.
These authors contributed equally to this work.
Crops 2024, 4(2), 156-171; https://doi.org/10.3390/crops4020012
Submission received: 8 February 2024 / Revised: 27 March 2024 / Accepted: 7 April 2024 / Published: 11 April 2024

Abstract

:
Sorghum (Sorghum bicolor L.) ranks fifth as the most crucial cereal crop globally, yet its seed morphology remains relatively unexplored. This study investigated seed morphology in sorghum based on 115 mini-core and 130 Senegalese germplasms. Eight seed morphology traits encompassing size, shape, and color parameters were assessed. Statistical analyses explored potential associations between these traits and resistance to three major sorghum diseases: anthracnose, head smut, and downy mildew. Furthermore, genome-wide association studies (GWAS) were conducted using phenotypic data from over 24,000 seeds and over 290,000 publicly available single nucleotide polymorphisms (SNPs) through the Genome Association and Prediction Integrated Tool (GAPIT) R package. Significant SNPs associated with various seed morphology traits were identified and mapped onto the reference sorghum genome to identify novel candidate defense genes.

1. Introduction

Sorghum [Sorghum bicolor (L.) Moench] is a major cereal grain, ranking fifth globally in production and cultivated area [1]. It uses less water and endures climate change better than other cereals. In light of climate change, sorghum could be a feasible solution for farmers to grow due to its heat and drought tolerance [2]. Due to its high nutritional content, drought tolerance, minimal input requirements, and remarkable environmental adaptability, sorghum is a crucial crop for food security [3,4,5]. This versatile crop is a widely cultivated crop grown in over 100 countries, particularly in dry, hot, and arid regions [6]. The largest sorghum producers are the U.S., Nigeria, Sudan, Mexico, Ethiopia, and India [7]. In the U.S., the ‘Sorghum Belt’, which includes Kansas, Texas, Colorado, Oklahoma, and South Dakota, is a major sorghum producer. These states provide both rainfed and dry conditions on ultisol and mollisol soil types [8,9].
Sorghum contains important nutrients and phytochemicals, including protein, fiber, essential minerals, fatty acids (linoleic, oleic, palmitic, linolenic, and stearic), B vitamins, and fat-soluble vitamins (A, D, E, and K) [10]. Sorghum also contains valuable secondary metabolites (phenolic acids, flavonoids, sterols, policosanols) and antioxidants [11,12]. Sorghum is rich in resistant and slowly digestible starches, which help manage blood sugar levels by reducing post-meal spikes compared to other major cereal grains [13]. Sorghum’s diverse bioactive polyphenols can lower the risk of nutrition-linked chronic diseases. Additionally, its high-molecular-weight tannins are known to alter the functionality of proteins and starch, offering the potential for developing novel bioactive ingredients and enhancing food quality [14]. The factors mentioned above make sorghum a rare crop that is resilient to climate change and can play a crucial role in ensuring nutritional security.
Sorghum is a multipurpose crop used in biofuel production, forage, ethanol production, and fodder preservation. In particular, sweet sorghum is gaining attention as a biofuel crop due to its high sugar content, ease of extractability, and low input requirements as a C4 crop [15]. After human consumption, the remainder of sorghum is mainly utilized for animal feed [16]. The ideal mineral and fatty acid balance of sorghum and its protein source suitability for aquafeed production have recently increased its popularity as an aquafeed [17].
The International Crops Research Institute for the Semi-Arid Tropics (ICRISAT) GeneBank has almost 37,000 Sorghum accessions, 2247 of which were selected to form a smaller group of germplasm known as the core collection. However, this core collection was also overwhelming. The core collection was evaluated for 11 qualitative and 10 quantitative traits, yielding 21 hierarchical groupings. From each cluster, about 10% or at least one accession was selected to create a mini-core of 242 accessions [18]. The sorghum mini-core contains 10% of the core’s accessions, or 1% of the entire collection, representing homogeneity for geographical origin, biological races, qualitative features, means, variances, phenotypic diversity indices, and phenotypic correlation. As a result, it is widely used in current genomic studies to evaluate various agronomic traits and biotic and abiotic resistant traits [18,19,20].
Senegalese sorghum germplasm lines are particularly well-known for resistance to biotic stresses such as fungal diseases [21]. Extensive genome-wide association studies (GWAS) have dissected sorghum resistance against various fungal pathogens in the germplasms [21,22,23]. However, research on other agronomically important traits, such as seed morphology, has received limited attention.
Morphological variation in seed traits includes variations in seed size and shape. The morphology of seeds is a crucial agricultural characteristic as it reflects a combination of genetic, physiological, and environmental aspects, all of which significantly impact crop yield, quality, and market value [24]. Apart from market value, seed morphology has proved beneficial in determining taxonomic relationships in plant families. As a result, both seed shape and size are relevant parameters for assessing plant biodiversity [24]. In addition, investigating the biodiversity of seeds can help characterize intra- and inter-species variation, genotypic discrimination, and correlation—all of which are important for breeding to achieve the target levels of seed yield and quality [24,25].
Wang et al. [26] evaluated sorghum mini-core panel in multiple locations with 6,094,317 single nucleotide polymorphism (SNP) markers and identified one locus for recurving peduncles and eight loci for panicle length, width, and compactness. Sakamoto et al. [27] used multi-trait GWAS to analyze 329 sorghum germplasms from different origins and found SNPs that may be related to seed morphology, such as SNP loci S01_50413644, S04_59021202, and S05_9112888. GWAS conducted on the 300 diverse accessions of the sorghum association panel (SAP) with 265,487 SNPs identified 30 SNPs that were strongly associated with traits measured at the seedling stage under cold stress, and 12 SNPs were significantly associated with seedling traits under heat stress [28].
Building upon our previous work, which evaluated 162 Senegalese germplasm accessions for eight seed morphology traits (seed area size, length, width, length-to-width ratio, perimeter, circularity, the distance between the intersection of length and width (IS) and center of gravity (CG), and seed darkness and brightness) and identified candidate genes potentially associated with these traits using 193,727 publicly available SNPs [29], this study investigated seed morphology in genetically diverse sorghum accessions, encompassing a subset of mini-core collection (115 lines including IS19975 originated from Senegal) and germplasms from Senegal (130 lines excluding IS19975). Eight key quantitative traits related to seed size, shape, and color were evaluated in over 24,000 seeds. The selection of these accessions prioritized the public availability of SNP data, facilitating GWAS to map genetic determinants of the observed phenotypic variation. To explore potential associations between seed morphology and resistance to major sorghum diseases, this study employed statistical analyses to investigate anthracnose, head smut, and downy mildew within the mini-core lines. Lastly, employing the Genome Association and Prediction Integrated Tool (GAPIT) R package, this study conducted GWAS using phenotypic data from the seeds and over 290,000 publicly available SNPs. This analysis identified SNPs linked to various seed morphology traits in the reference sorghum genome.

2. Materials and Methods

2.1. Phenotypic Evaluations for Seed Morphology-Related Traits

Following the methodology of Ahn et al. [29], sorghum seed morphology was evaluated in 245 mini-core and Senegalese germplasm lines (accession details in Supplementary Data S1) from the USDA-ARS Plant Genetic Resources Conservation Unit, Griffin, Georgia, to quantify and compare variation in key seed morphology traits. Seed area size (mm²), length (mm), width (mm), length-to-width ratio (LWR), perimeter (mm), circularity (0–1 range, 0: not circular to 1: complete circle), distance between the intersection of length and width (IS) and center of gravity (CG), and seed color brightness (0–255 scale, 0: darkest, 255: brightest) were measured using digital image analysis with ImageJ 1.54d software [18]. Data from BTx623 [29] were included as a control, representing a sorghum line with well-characterized seed morphology.
A comprehensive evaluation of seed morphology was conducted across 245 sorghum cultivars. Each cultivar had between 75 and 120 individual seeds analyzed for morphological traits. High-resolution images of the seeds were captured using a Canon imageRUNNER ADVANCE C7270 scanner (Canon Inc., Tokyo, Japan) and saved in JPEG format. SmartGrain (version 1.3) high-throughput phenotyping software quantified key traits: area size, length, width, LWR, perimeter, circularity, and distance between IS and CG [18]. Any potential errors identified in the SmartGrain output were corrected by manually inspecting each image. ImageJ software (version 1.54d) was employed on 50 seeds per accession to assess seed color variation, applying a multi-point function to measure darkness and brightness levels across the accessions [19].

2.2. Statistical Analysis

Following Ahn et al. [29], we performed Tukey’s HSD test in JMP Pro 15 (SAS Institute, Cary, NC, USA) to analyze statistical differences among all tested accessions for each trait. Pearson’s correlation coefficient analysis was used in JMP Pro 15 to identify potential pairwise correlations between seed morphology-related traits. To leverage existing data, we obtained phenotypic information on mini-core lines for resistance against anthracnose, head smut, and downy mildew, as collected in a recent study by Ahn et al. [19]. Student’s t-tests were performed in JMP Pro 15 to compare seed morphology traits between resistant and susceptible cultivars for each of the three diseases. Additionally, a principal component analysis (PCA) and clustering variables analysis were conducted using phenotypic data to explore relationships between all traits, followed by logistic regression analysis between seed morphology traits and disease resistance traits in sorghum mini-core lines.

2.3. GWAS

Genome-Wide Association Study

The SNP data were extracted from an integrated sorghum SNPs dataset based on the sorghum reference genome version 3.1.1, which was genotyped initially using genotyping-by-sequencing (GBS) [30,31,32]. Missing data were imputed using Beagle 4.1 [33], and further filtering was performed, ensuring a minor allele frequency of at least 0.05. We conducted genome-wide association analyses using the R-package, GAPIT version 3 [34]. The analyses employed the Fixed and Random Model Circulating Probability Unification (FarmCPU) [35]. Population stratification was corrected by PCA, with the optimal number of principal components determined through a Bayesian information criterion-based analysis within GAPIT. For the association analysis in GAPIT, the following parameters were used: PCA total = 3 and model = FarmCPU; all other parameters were kept at their default values. To identify significant SNP-trait associations, we applied a stringent Bonferroni correction, with a threshold of -log10 (p-value) of 6.77 or greater. Subsequently, we estimated pairwise LD (r2) between the significant SNPs and nearby SNPs located within 100 kb both upstream and downstream of each significant SNP. LD blocks were defined by merging SNPs that exhibited an r2 value of at least 0.5. LD blocks represent genomic regions where SNPs are co-inherited due to strong LD. If an LD block was smaller than 20 kb, it was extended up to 20 kb. Within these regions, candidate genes were identified based on gene annotations from the sorghum reference genome publicly available at the Phytozome 12 (https://phytozome.jgi.doe.gov) (accessed on 15 January 2024) (version 3.1.1, GCF_000003195.3) [36].

3. Results

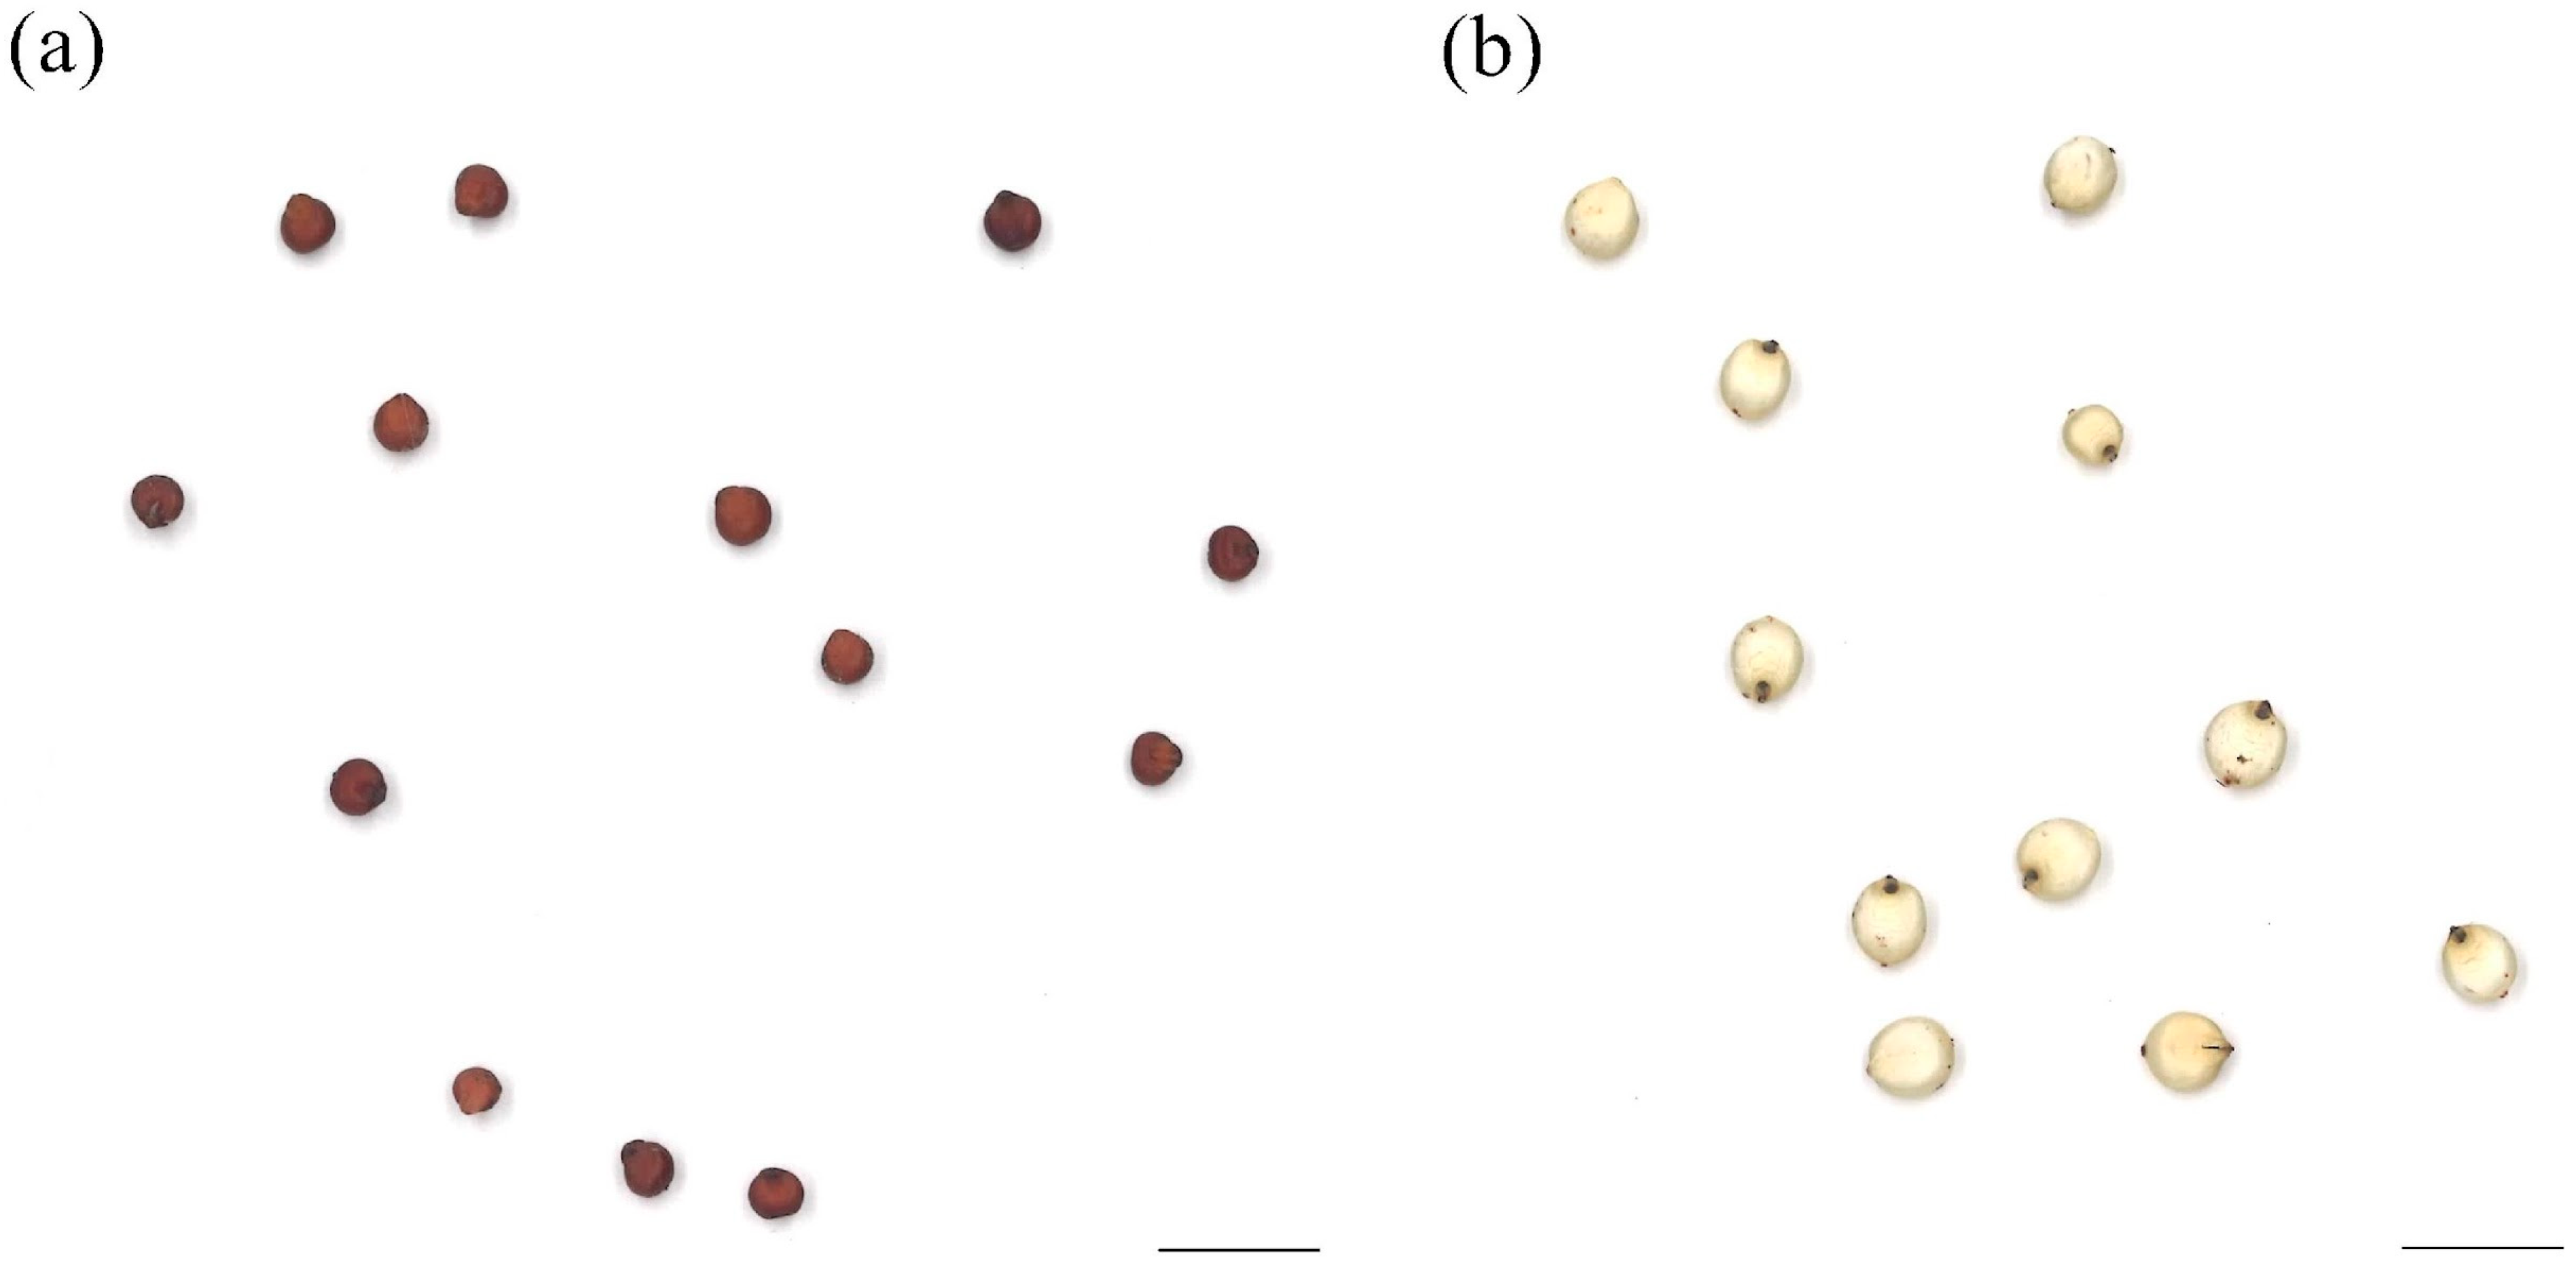
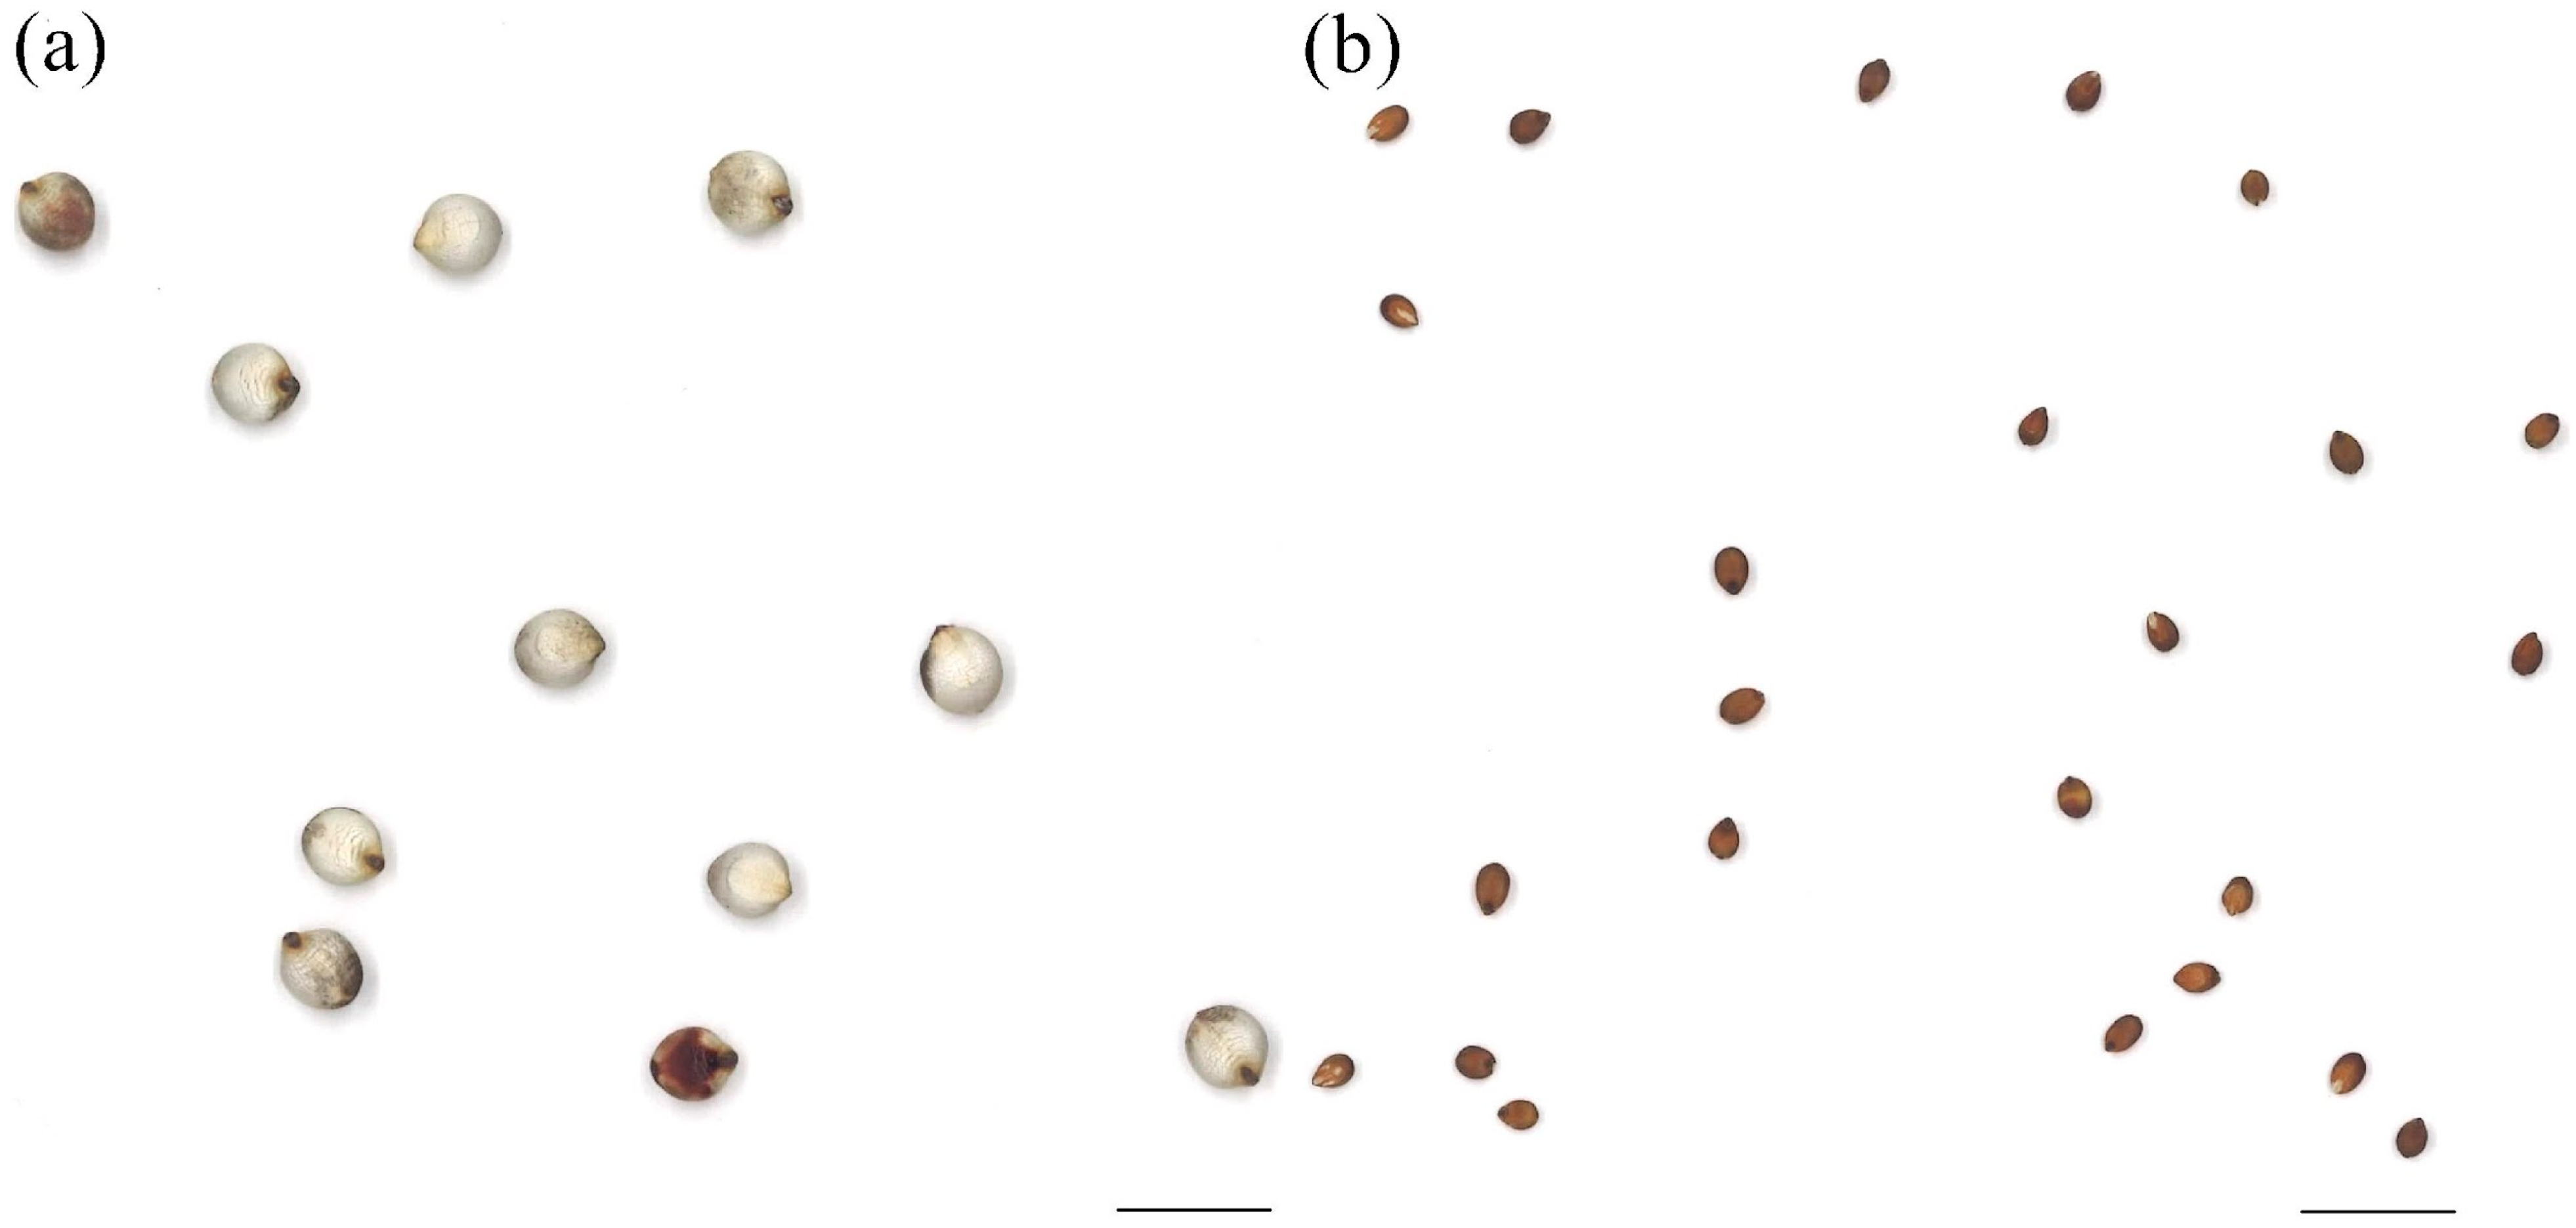
3.1. Seed Morphologies

A two-tailed ANOVA was conducted on the 246 accessions, including the control accession BTx623, which displayed statistical significance with p < 0.0001 for all evaluated traits (Supplementary Data S1). Table 1 lists the top five accessions for each quantitative trait, and phenotypic data are also available in Supplementary Data S1. For instance, the average area size of IS11473 was 25.60 ± 1.60 mm2, while that of IS12697 was 4.92 ± 0.83 mm2 (Table 1 and Figure 1). Similarly, the seed colors based on the brightness of IS7987 and IS9108 demonstrated the most significant contrast among the tested accessions (Table 1 and Figure 2). Significant morphological variations were identified across the population for other traits as well.

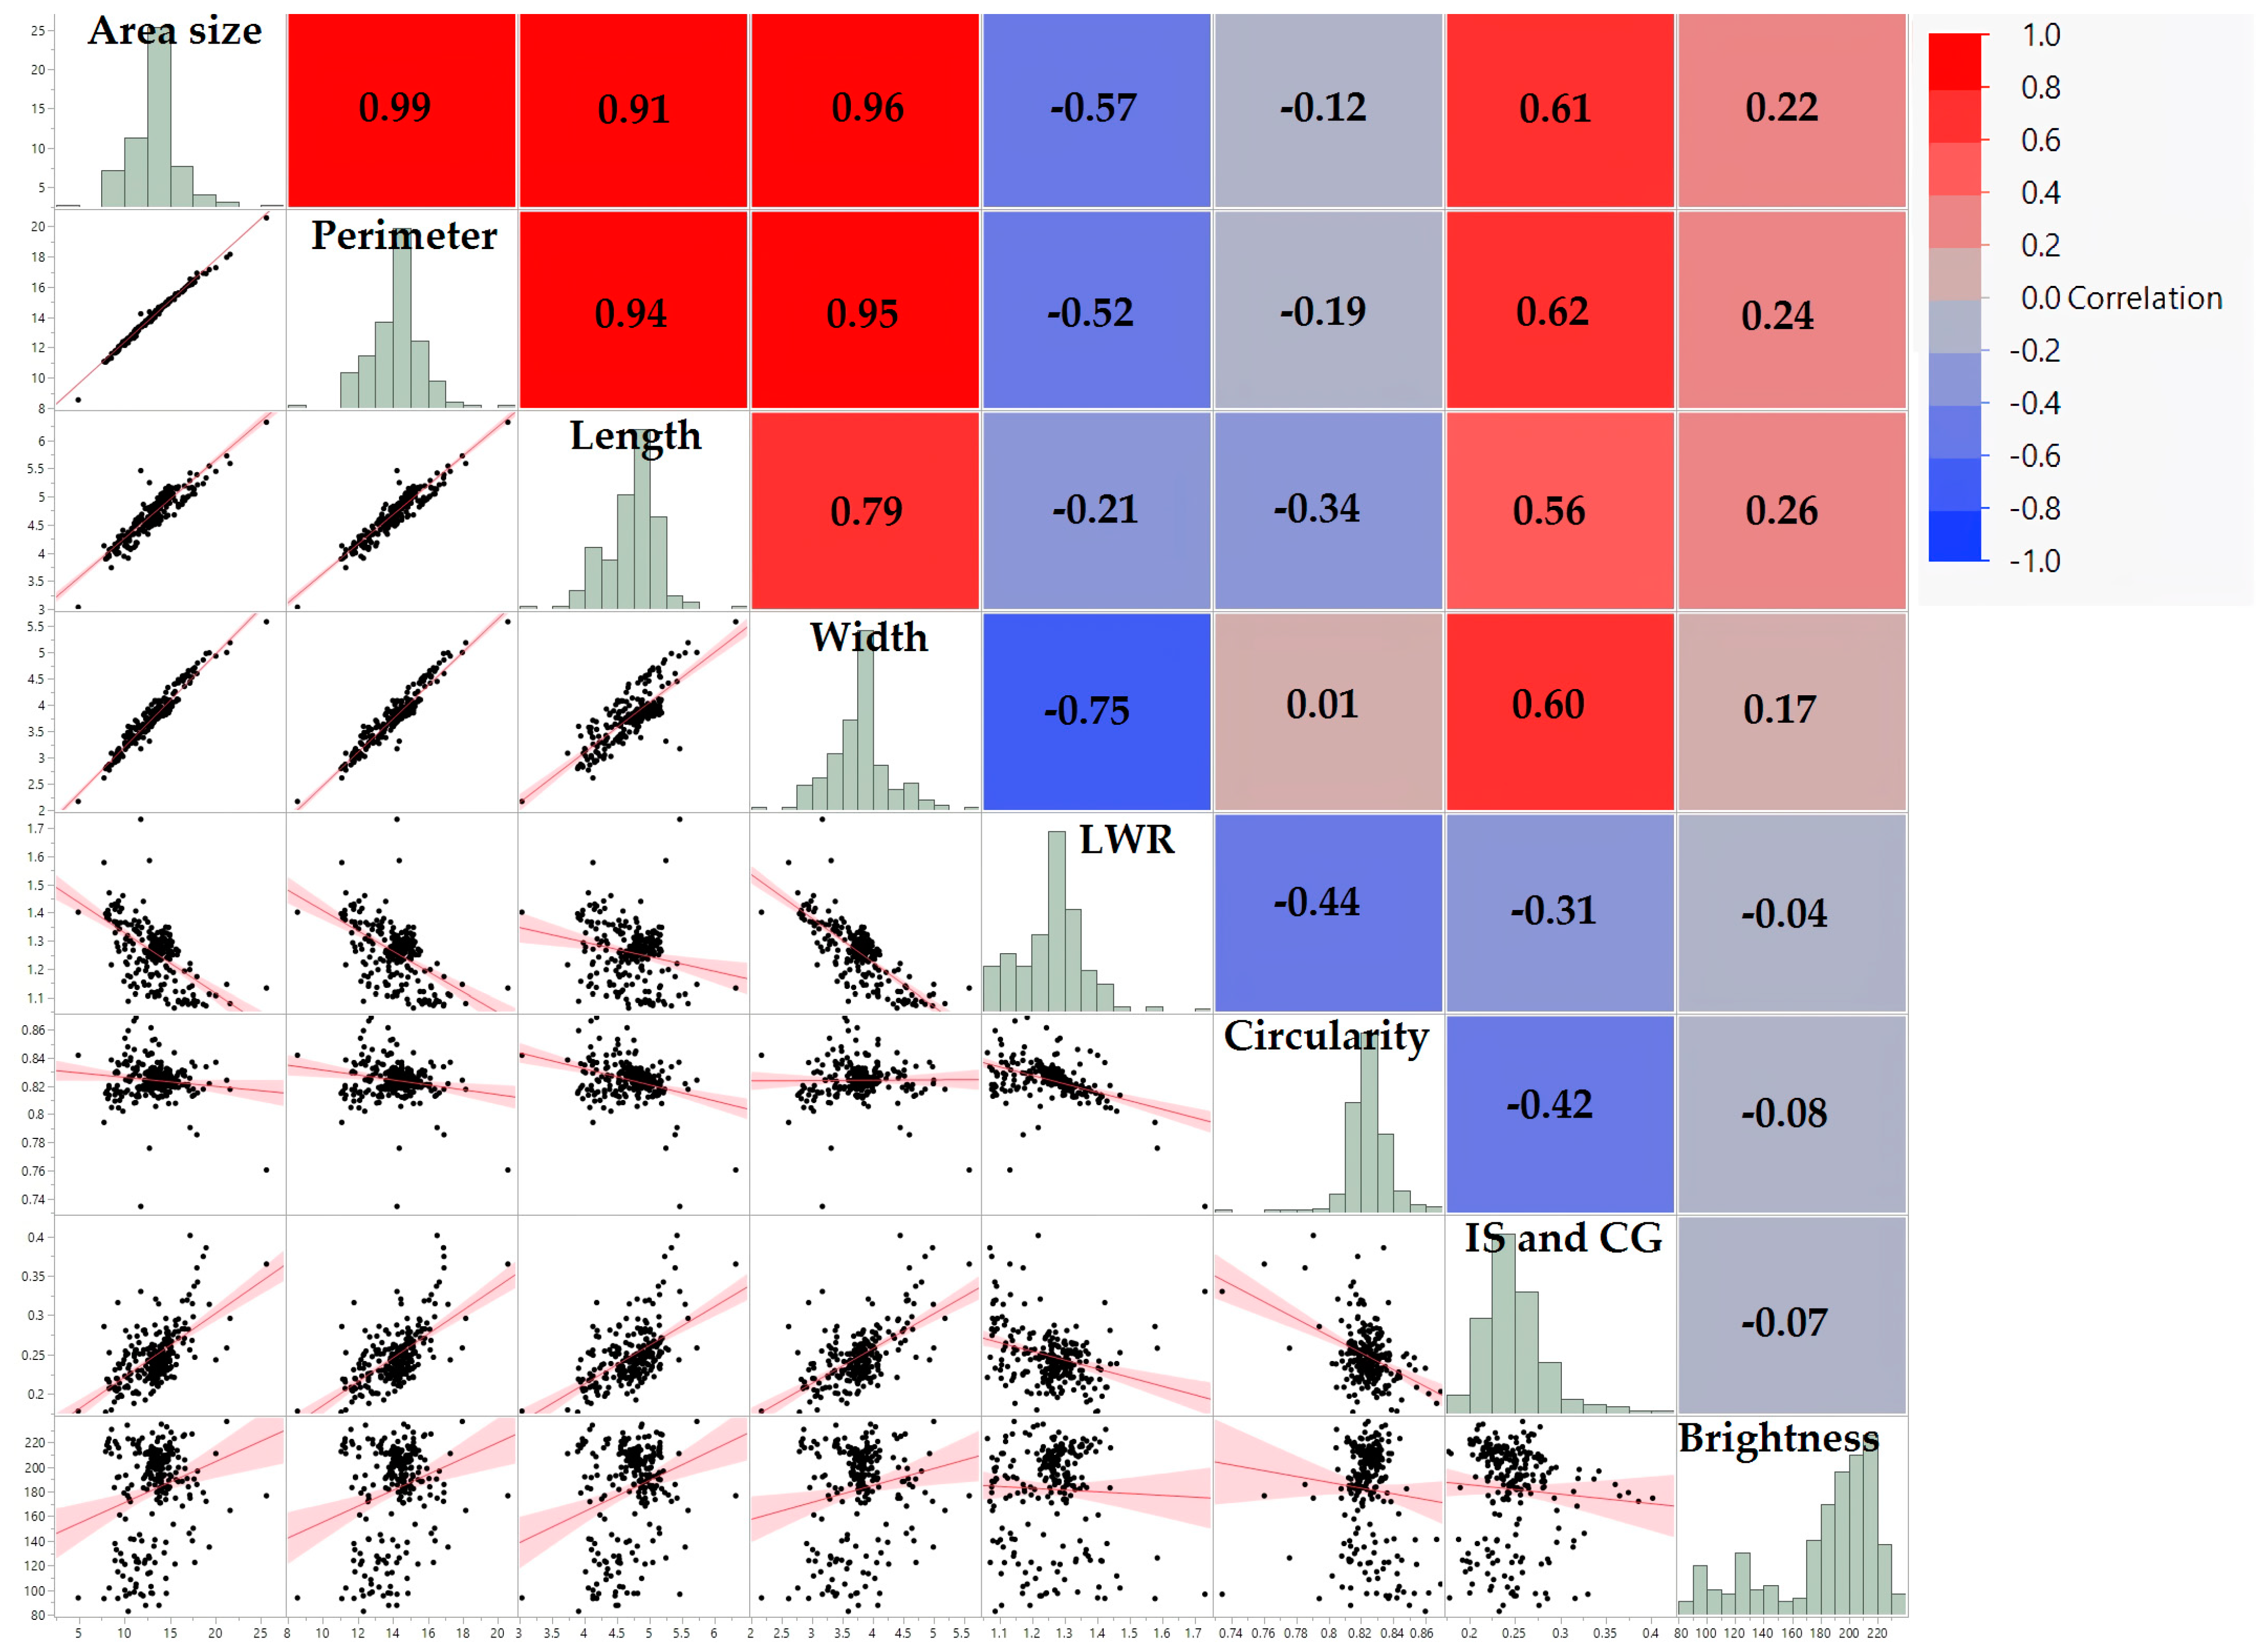
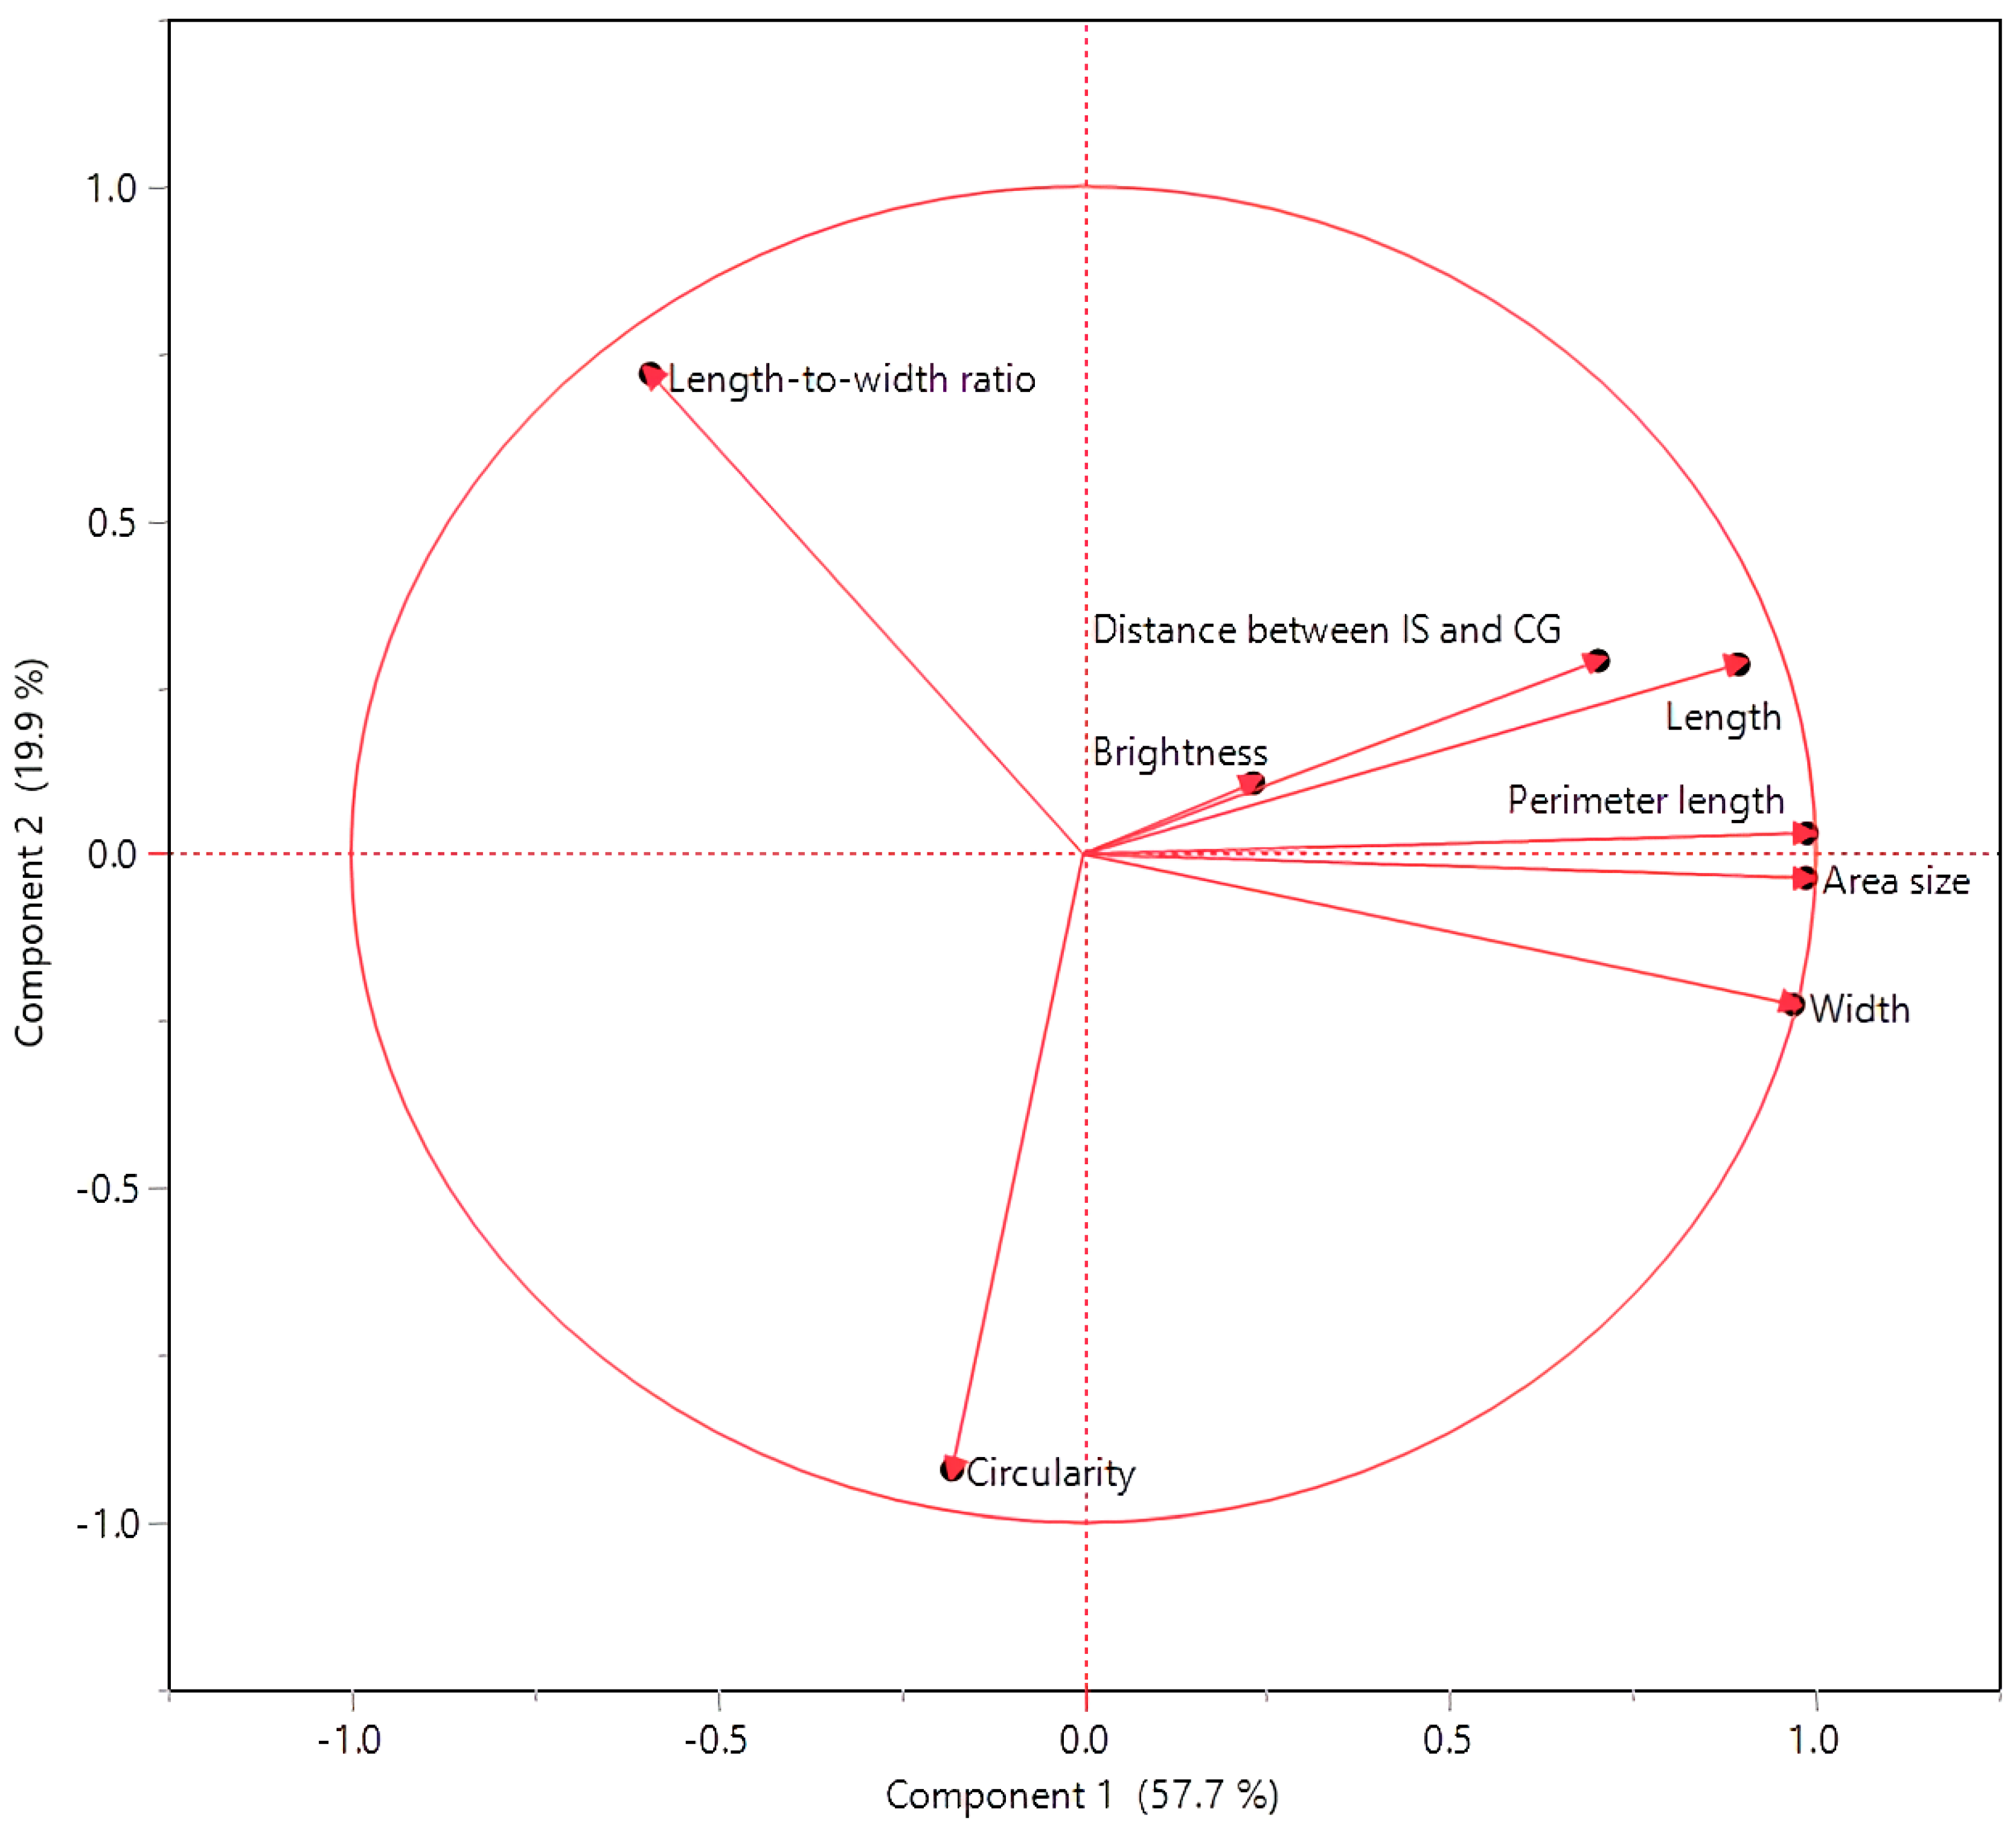
3.2. Interconnections among Seed Morphology Traits

Pearson’s correlation analysis revealed relationships between seed morphology-related traits in the mini-core and Senegalese sorghum lines (Figure 3 and Table 2). Interestingly, seed brightness exhibited positive correlations with area size, perimeter, length, and width, contrasting with a previous study by Ahn et al. [29], which found no association in 162 Senegalese germplasms. Furthermore, PCA identified two major principal components (PC1 and PC2) accounting for 77.6% of the total variance in seed morphology (Figure 4). The partial contribution of variables (Figure 5) revealed that PC1 is primarily driven by seed size-associated traits (area size, perimeter, length, and width). In contrast, PC2 reflects differences in seed shape, encompassing both circularity and length-to-width ratio. PC3, explaining less variance, is mainly associated with seed color. This result is consistent with the previous study on the Senegalese line by Ahn et al. [29]. Cluster analysis of the phenotypic data in Table 3 formed three groups, with grain size, shape, and color being separated, similar to the results obtained from PCA analysis.

3.3. Associations between Seed Morphology Traits and Resistance to Anthracnose, Head Smut, and Downy Mildew in Mini-Core Lines
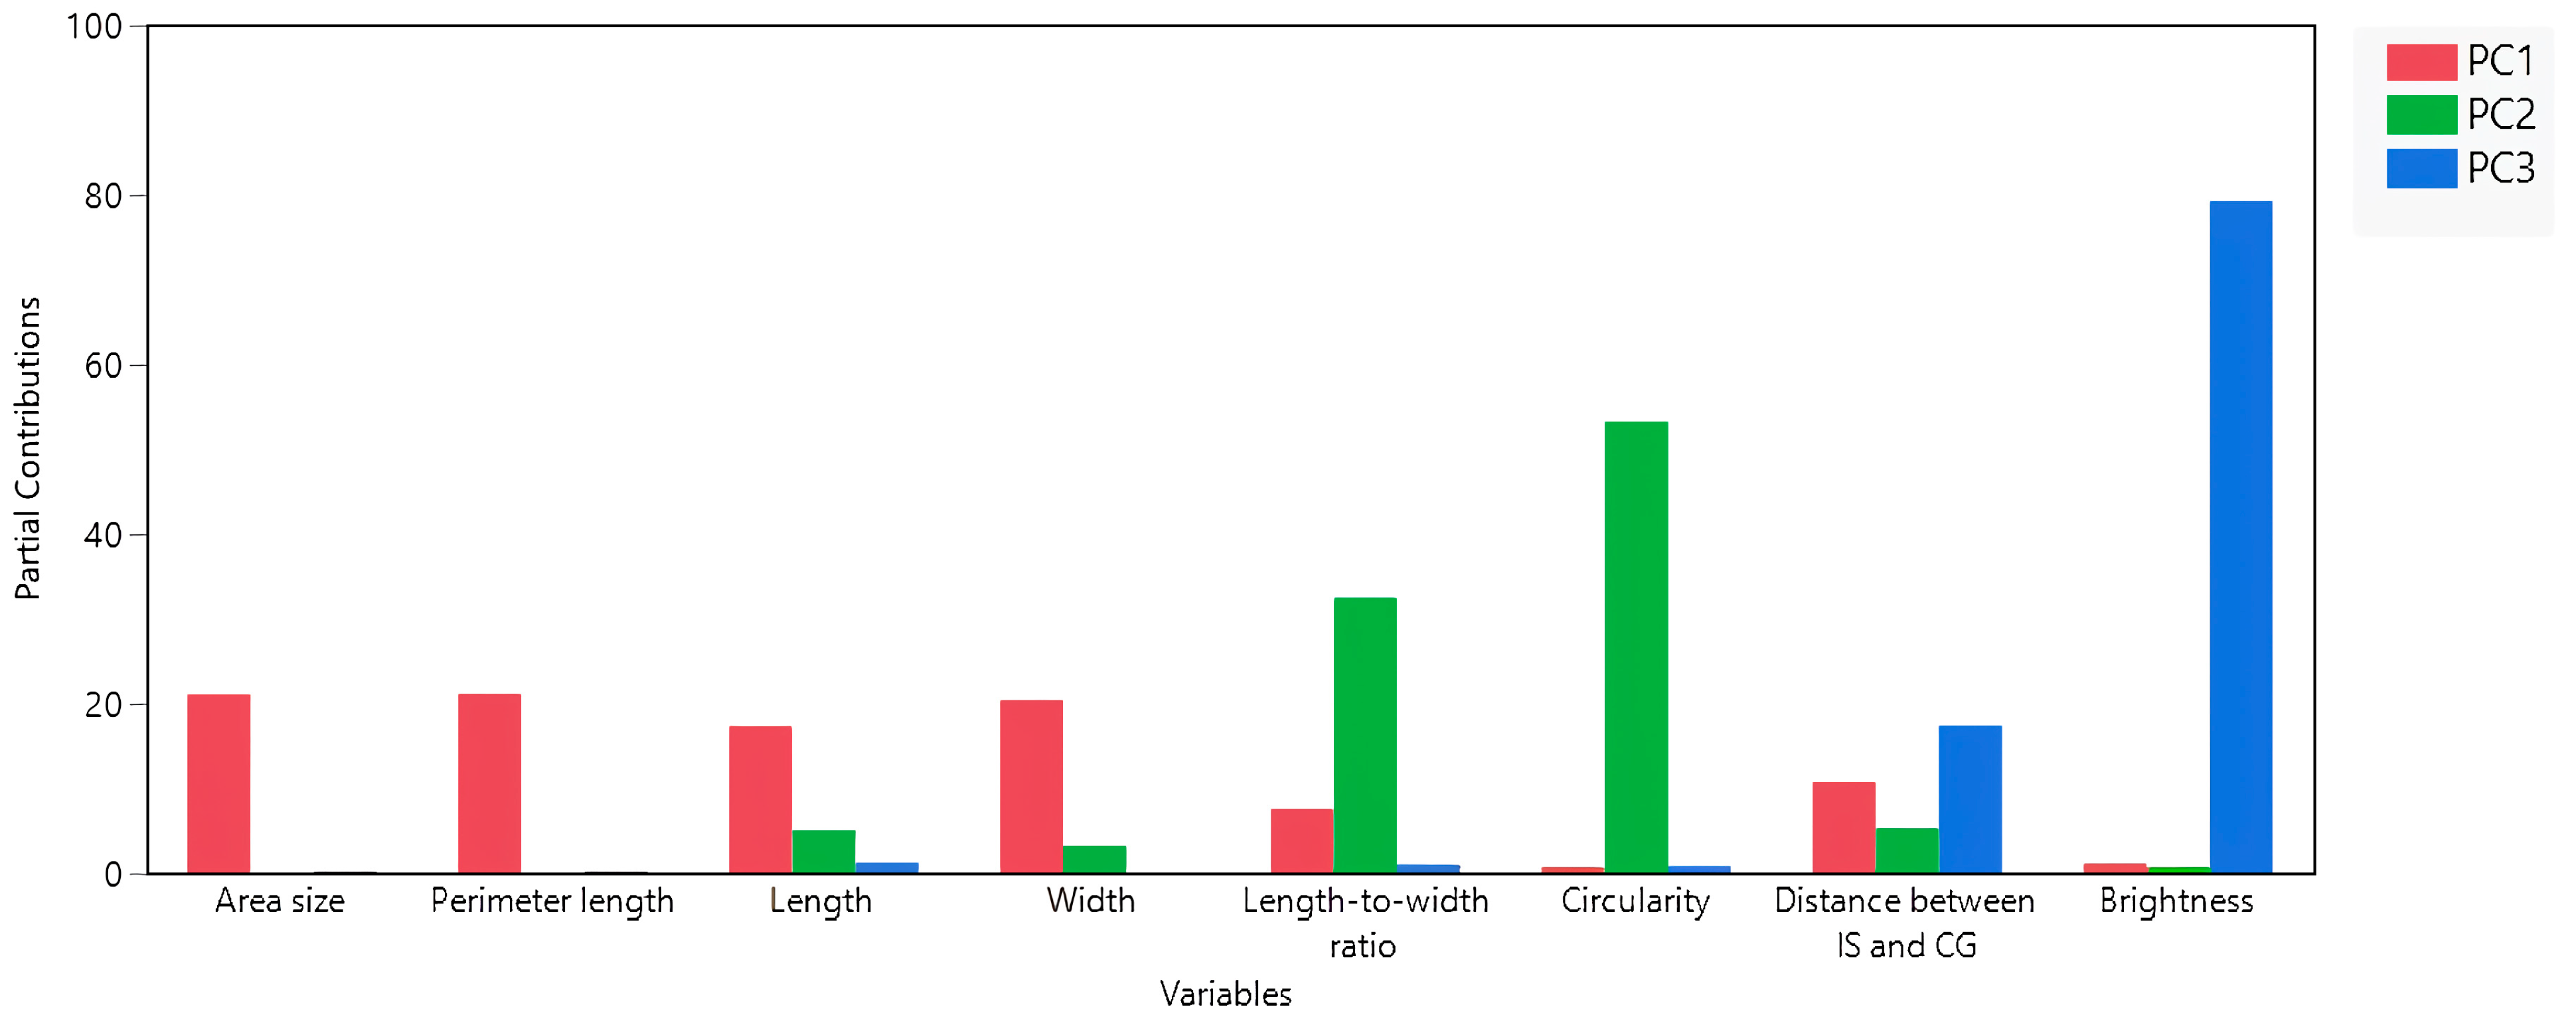
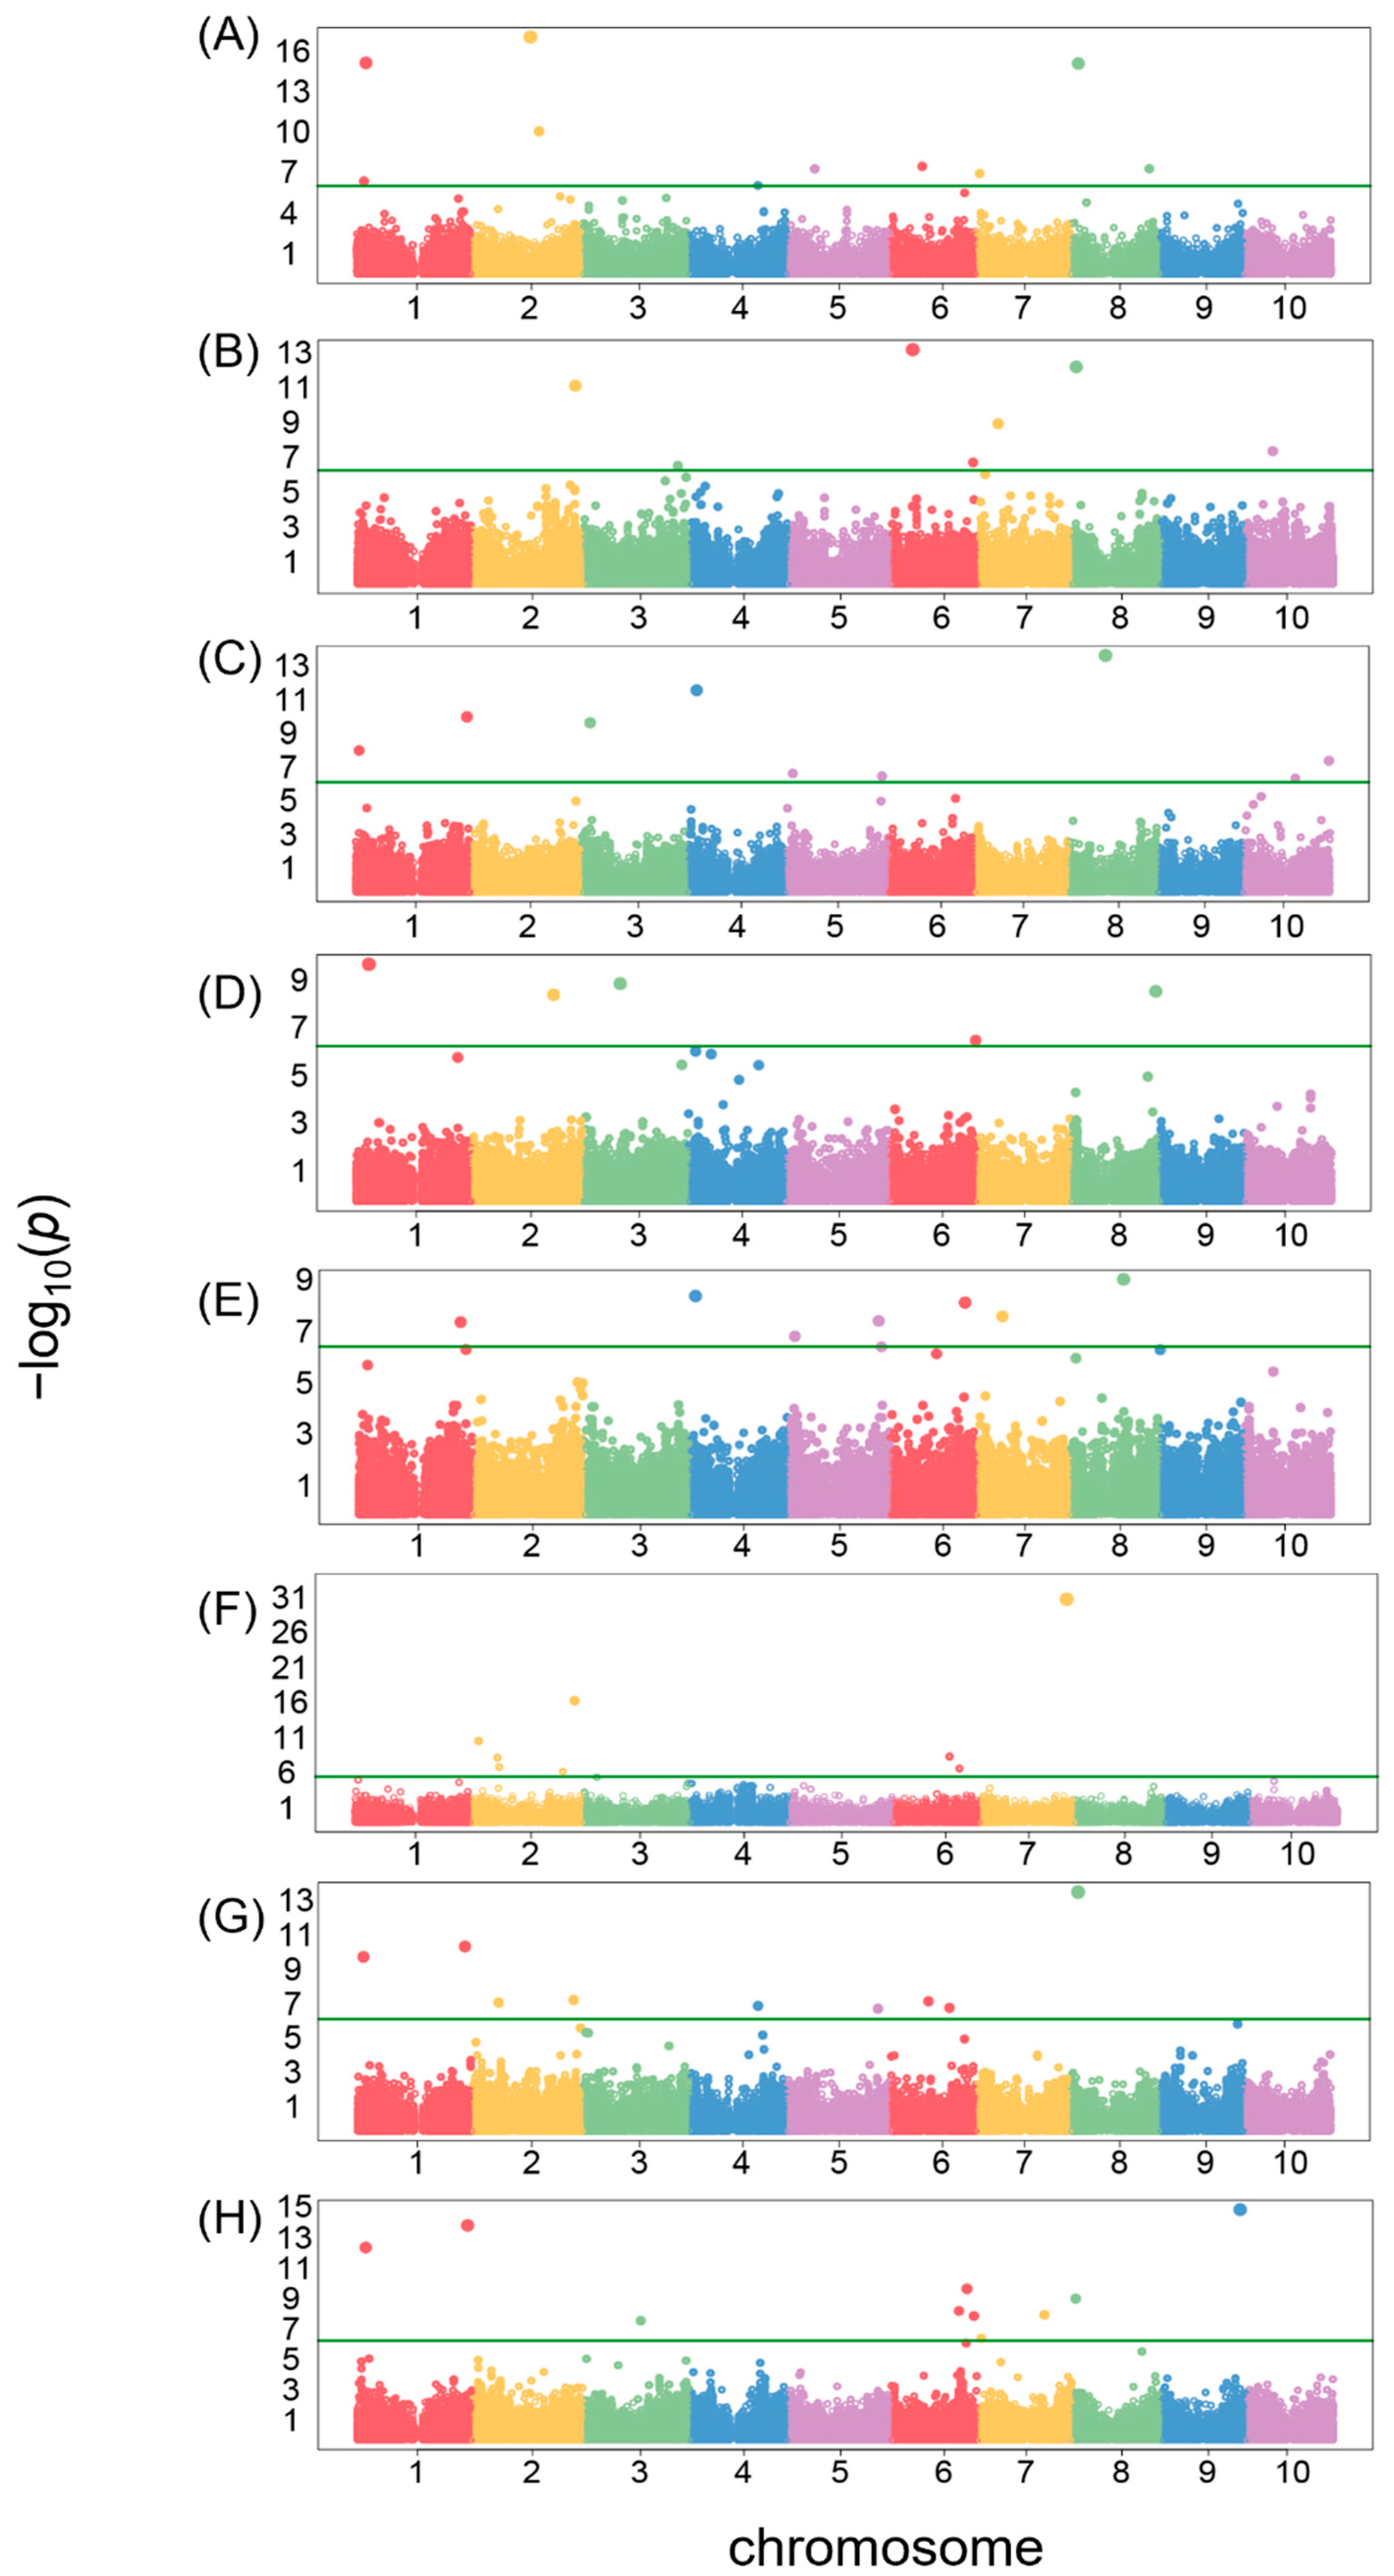
We compared eight seed morphology traits between resistant and susceptible cultivars for anthracnose, head smut, and downy mildew in mini-core lines using a two-tailed Student’s t-test, but no statistical significance was detected for anthracnose and downy mildew. However, for head smut, five of the eight traits exhibited associations with susceptibility (Table 4). Resistant lines had significantly larger area size, perimeter, and width than susceptible lines. Additionally, the resistant group displayed a slightly more circular shape, as indicated by both LWR and circularity. Notably, seed brightness did not show any significant difference between the groups.
Similarly, logistic regression analyses revealed relationships between seed morphology traits and disease resistance in the mini-core sorghum lines (Table 5). The distance between IS and CG was statistically connected with anthracnose and downy mildew. Identical to the t-test in Table 3, head smut was associated with the five traits but not with length, IS and CG, and brightness. These results suggest that larger, wider, and more circular seeds might be more resistant to head smut infection in these sorghum germplasms.

3.4. GWAS

In sum, 68 single-nucleotide polymorphisms (SNPs) surpassed the Bonferroni correction threshold for association with seed morphology traits. The number of identified SNPs varied across traits, ranging from 5 for IS and CG to 13 for area size. A detailed list of significant SNPs for each trait is provided in Table S1, while Manhattan plots visualizing their genomic distribution are presented in Figure 6. Furthermore, we identified over 100 genes potentially associated with the significant SNPs based on their location within the LD block of these SNPs in the genome. These candidate genes are detailed in Table S2, and representative genes are listed in Table 6. Along with genes known to be associated with plant development, such as zinc finger, many uncharacterized proteins were found to be top candidates.

4. Discussion

Seed morphology significantly impacts various biological and ecological processes, such as seed dormancy, germination, dispersal, persistence, evolution, and adaptation [37]. Despite its versatility, high-stress tolerance, and diverse applications as grain, forage, and biomass [38], sorghum seed morphology remains relatively unexplored. Correlation analysis of mini-core and Senegalese accessions identified significance among the traits, identical to the patterns observed in previous studies with Senegalese germplasm [29]. Both PCA plots and partial contribution analyses yielded highly similar results, strengthening the consistency of these findings [29]. The observed consistency in correlation patterns across both studies could be attributed to the overlap of some Senegalese accessions. However, analyzing just the mini-core accessions in this study yielded nearly identical results, suggesting a broader generalizability of these findings (data available in Supplementary Data S1).
Furthermore, recent studies identified potential linkages between sorghum seed morphology traits and host resistance against fungal pathogens. Significant negative correlations between grain mold severity and seed weight in sorghum were identified in a recent study [39]. Similarly, Ahn et al. [29] identified correlations between seed morphology traits (circularity and the distance between IS and CG) and the formation of spots on seedling leaves. These spots appeared when seedlings were inoculated with Sporisorium reilianum, a causal pathogen causing head smut, and submerged under water [40]. Though spotted plants are considered susceptible, the cause of the spots is unclear. They might be a direct result of fungal infection or, alternatively, a defense mechanism triggered by the seedlings. Regardless of their origin, the association between spot appearance rate and seed morphology traits is notable. While no statistically significant links between seed morphology and anthracnose/downy mildew susceptibility were found except for IS and CG, five out of eight tested traits exhibited associations with head smut susceptibility. The head smut data applied in this study are from syringe needle inoculation (hypodermic injection), with resistance/susceptibility confirmed by the occurrence or absence of infected heads in mature plants [19]. The observed correlations between seed morphology and head smut resistance might be rooted in the distinct infection processes of S. reilianum. Unlike anthracnose caused by Colletotrichum sublineola, which involves direct contact infection by conidia, head smut relies on systemic fungal growth originating from soilborne spores infecting plants during seed germination and seedling emergence [41]. This suggests that certain seed morphological traits may influence plant structures or defenses that impact internal fungal spread, but the precise mechanism remains unknown.
The GWAS analysis revealed over 100 candidate genes linked to seed morphology traits (Table S2). Intriguingly, several genes with similar functions appeared as top candidates for multiple traits, suggesting shared genetic influences as suggested in correlation analysis. For example, UDP-glycosyltransferases ranked among the top hits for area size, circularity, and distance between IS and CG, indicating their potential impact on seed size and shape. Grain size and abiotic stress tolerance in rice are regulated by UDP-glucosyltransferase, with this regulation being associated with metabolic flux redirection [42]. Genes associated with zinc finger motifs emerged as candidates for length and LWR, indicating their potential influence on grain size and shape. This is further supported by the C2H2 zinc-finger protein LACKING RUDIMENTARY GLUME 1 (LRG1) in rice, which directly regulates spikelet formation and consequently impacts grain size and yield [43]. Likewise, F-box genes associated with LWR and brightness support findings in rice, where the F-box protein FBX206 and OVATE family proteins form a regulatory network in the brassinosteroid signal pathway to control plant architecture, grain size, and grain yield [44]. Furthermore, leucine-rich repeat protein genes linked to length and brightness and the cytochrome P450 superfamily associated with area size and circularity support their roles in plant development, stress responses, and metabolism [29,45,46,47,48]. Notably, GW10, a P450 subfamily member, regulates grain size and number in rice [49]. NDR1/HIN1-like proteins were associated with seed shape. NDR1/HIN1-like genes are known to be associated with pathogen-induced plant responses to biotic stress and their possible roles in plant development [50]. This dual function in plant defense and development among candidate genes could explain why seed morphology is associated with fungal defense. The primary function of the plant cell wall is to act as a defense mechanism against both biotic and abiotic stressors [51]. A GWAS combined with transcriptome data in maize revealed that cell wall protein IFF6-like was an important candidate gene for kernel size and development [52]. This protein is a candidate gene connected to seed brightness in this study, indicating one gene can be associated with seed size, shape, color, and even defense response altogether. These examples, alongside the entire candidate gene list in Table S2, offer valuable resources for future research and potential candidates for breeding programs aiming to improve sorghum seed morphology and grain yield. Multiple genes previously identified as top candidates in our earlier work [29] resurfaced as key genes in this study: Homeobox-leucine zipper, glycosyltransferase, zinc finger, and cytochrome P450 genes were consistently identified across our previous and current work. This repeated association strongly suggests their genuine involvement in shaping seed morphology traits. These genes warrant particular attention for further functional validation studies to explore their roles in determining seed morphology.

5. Conclusions

Through the analysis of 245 mini-core and Senegalese accessions, significant phenotypic diversity and correlations were discovered among the seed morphology traits. Additionally, the potential linkage between seed morphology and disease resistance in sorghum was investigated. Seed morphology traits associated with head smut resistance, as observed through both seedling leaf spot appearance rate and systemic syringe inoculation response [29], suggest a potential link between morphology and sorghum response. Furthermore, SNPs potentially linked to seed morphology were identified through GWAS analysis, and these can be targeted for functional validation using gene-editing tools like Transcription Activator-Like Effector Nucleases (TALENs), Zinc Finger Nucleases (ZFNs), and CRISPR-Cas9 [53,54]. Similarly, base editors exhibit diverse applications in various plant species, which mediate precise base pair conversions without generating undesirable double-stranded breaks [55]. Prime editing is a genome-editing technology that is highly flexible but known for its low editing efficiency [56]. In recent studies, prime editors were optimized, which resulted in substantially improved editing efficiency in plants [56,57]. The rapid development of gene editing tools is expected to find applications in recalcitrant monocot plants like sorghum in the near future. These tools will aid in further studies to enhance our understanding of seed morphology and its connection to defense mechanisms against fungal pathogens.

Supplementary Materials

The following supporting information can be downloaded at https://www.mdpi.com/article/10.3390/crops4020012/s1. Supplementary Data (Excel spreadsheets in a zip file) S1: <Phenotypic data>; Table S1: SNPs significantly associated with traits of interest identified through GWAS; Table S2: List of candidate genes associated with traits of interest.

Author Contributions

E.A.: Conceptualization, Project Administration, Funding Acquisition, Supervision, Data Curation, Investigation, and Writing—Original Draft. S.P.: Software, Supervision, Validation, Formal Analysis, and Writing—Review and Editing. Z.H.: Software, Formal Analysis, and Writing—Review and Editing. V.E.: Methodology and Writing—Review and Editing. M.C.: Writing—Review and Editing. Y.L.: Methodology and Writing—Review and Editing. L.K.P.: Methodology and Writing—Review and Editing. C.M.: Conceptualization, Supervision, and Writing—Review and Editing. All authors have read and agreed to the published version of the manuscript.

Funding

This research was funded by AFRI, NIFA, USDA grant number 20156800423492 and by The Feed the Future Innovation Lab for Collaborative Research on Sorghum and Millet, a United States Agency for International Development Cooperative grant number AID-OAA-A-13-00047 with the title name Enabling marker-assisted selection for sorghum disease resistance in Senegal and Niger. EA, SP, ZH, and LKP were supported by the U.S. Department of Agriculture, Agricultural Research Service. Mention of any trade names or commercial products in this article is solely for the purpose of providing specific information and does not imply recommendation or endorsement by the U. S. Department of Agriculture. USDA is an equal opportunity provider and employer, and all agency services are available without discrimination.

Institutional Review Board Statement

Not applicable.

Informed Consent Statement

Not applicable.

Data Availability Statement

Data are contained within the article and supplementary materials.

Acknowledgments

We express our gratitude to the reviewers for their valuable feedback.

Conflicts of Interest

The authors declare that they have no known competing financial interests or personal relationships that could have influenced the work reported in this paper.

References

  1. FAOSTAT. Crops and Livestock Products. Available online: http://www.fao.org/faostat/en/#data/QCL (accessed on 16 September 2023).
  2. Chadalavada, K.; Kumari, B.D.R.; Kumar, T.S. Sorghum mitigates climate variability and change on crop yield and quality. Planta 2021, 253, 113. [Google Scholar] [CrossRef]
  3. Abreha, K.B.; Enyew, M.; Carlsson, A.S.; Vetukuri, R.R.; Feyissa, T.; Motlhaodi, T.; Ng’uni, D.; Geleta, M. Sorghum in Dryland: Morphological, Physiological, and Molecular Responses of Sorghum under Drought Stress. Planta 2022, 255, 20. [Google Scholar] [CrossRef] [PubMed]
  4. Enyew, M.; Feyissa, T.; Carlsson, A.S.; Tesfaye, K.; Hammenhag, C.; Seyoum, A.; Geleta, M. Genome-wide analyses using multi-locus models revealed marker-trait associations for major agronomic traits in Sorghum bicolor. Front. Plant Sci. 2022, 13, 999692. [Google Scholar] [CrossRef] [PubMed]
  5. Jankowski, K.J.; Sokólski, M.M.; Dubis, B.; Załuski, D.; Szempliński, W. Sweet sorghum—Biomass production and energy balance at different levels of agricultural inputs. A six-year field experiment in north-eastern Poland. Eur. J. Agron. 2020, 119, 126119. [Google Scholar] [CrossRef]
  6. Khalifa, M.; Eltahir, E.A.B. Assessment of global sorghum production, tolerance, and climate risk. Front. Sustain. Food Syst. 2023, 7, 1184373. [Google Scholar] [CrossRef]
  7. USDA FAS. Sorghum Explorer. Available online: https://ipad.fas.usda.gov/cropexplorer/cropview/commodityView.aspx?cropid=0459200 (accessed on 1 January 2024).
  8. Demarco, P.A.; Mayor, L.; Rotundo, J.L.; Prasad, P.V.V.; Morris, G.P.; Fernandez, J.A.; Tamagno, S.; Hammer, G.; Messina, C.D.; Ciampitti, I.A. Retrospective study in U.S. commercial sorghum breeding: II. Physiological changes associated to yield gain. Crop Sci. 2023, 63, 867–878. [Google Scholar] [CrossRef]
  9. Dille, J.A.; Stahlman, P.W.; Thompson, C.R.; Bean, B.W.; Soltani, N.; Sikkema, P.H. Potential Yield Loss in Grain Sorghum (Sorghum bicolor) with Weed Interference in the United States. Weed Technol. 2020, 34, 624–629. [Google Scholar] [CrossRef]
  10. Tanwar, R.; Panghal, A.; Chaudhary, G.; Kumari, A.; Chhikara, N. Nutritional, Phytochemical and Functional Potential of Sorghum: A Review. Food Chem. Adv. 2023, 3, 100501. [Google Scholar] [CrossRef]
  11. Frankowski, J.; Przybylska-Balcerek, A.; Stuper-Szablewska, K. Concentration of Pro-Health Compound of Sorghum Grain-Based Foods. Foods 2022, 11, 216. [Google Scholar] [CrossRef]
  12. Khalid, W.; Ali, A.; Arshad, M.S.; Afzal, F.; Akram, R.; Siddeeg, A.; Kousar, S.; Rahim, M.A.; Aziz, A.; Maqbool, Z. Nutrients and bioactive compounds of Sorghum bicolor L. used to prepare functional foods: A review on the efficacy against different chronic disorders. Int. J. Food Prop. 2022, 25, 1045–1062. [Google Scholar] [CrossRef]
  13. Taylor, J.R.N.; Duodu, K.G. Resistant-Type Starch in Sorghum Foods—Factors Involved and Health Implications. Starch 2022, 75, 2100296. [Google Scholar] [CrossRef]
  14. Teferra, T.F.; Awika, J.M. Sorghum as a Healthy Global Food Security Crop: Opportunities and Challenges. Available online: https://www.cerealsgrains.org/publications/cfw/2019/September-October/Pages/CFW-64-5-0054.aspx (accessed on 16 September 2023).
  15. Mathur, S.; Umakanth, A.V.; Tonapi, V.A.; Sharma, R.; Sharma, M.K. Sweet sorghum as biofuel feedstock: Recent advances and available resources. Biotechnol. Biofuels 2017, 10, 146. [Google Scholar] [CrossRef] [PubMed]
  16. Osman, A.; Abd El-Wahab, A.; Ahmed, M.F.E.; Buschmann, M.; Visscher, C.; Hartung, C.B.; Lingens, J.B. Nutrient Composition and In Vitro Fermentation Characteristics of Sorghum Depending on Variety and Year of Cultivation in Northern Italy. Foods 2022, 11, 3255. [Google Scholar] [CrossRef] [PubMed]
  17. Zarei, M.; Amirkolaei, A.K.; Trushenski, J.T.; Sealey, W.M.; Schwarz, M.H.; Ovissipour, R. Sorghum as a Potential Valuable Aquafeed Ingredient: Nutritional Quality and Digestibility. Agriculture 2022, 12, 669. [Google Scholar] [CrossRef]
  18. Upadhyaya, H.D.; Pundir, R.P.S.; Dwivedi, S.L.; Gowda, C.L.L.; Reddy, V.G.; Singh, S. Developing a mini core collection of sorghum for diversified utilization of germplasm. Crop Sci. 2009, 49, 1769–1780. [Google Scholar] [CrossRef]
  19. Ahn, E.; Hu, Z.; Perumal, R.; Prom, L.K.; Odvody, G.; Upadhyaya, H.D.; Magill, C.W. Genome wide association analysis of sorghum mini core lines regarding anthracnose, downy mildew, and head smut. PLoS ONE 2019, 14, e0216671. [Google Scholar] [CrossRef] [PubMed]
  20. Upadhyaya, H.D.; Vetriventhan, M.; Azevedo, V.C.R. Variation for photoperiod and temperature sensitivity in the global mini core collection of sorghum. Front. Plant Sci. 2021, 12, 571243. [Google Scholar] [CrossRef] [PubMed]
  21. Cuevas, H.E.; Prom, L.K.; Rosa-Valentin, G. Population Structure of the NPGS Senegalese Sorghum Collection and Its Evaluation to Identify New Disease Resistant Genes. PLoS ONE 2018, 13, e0191877. [Google Scholar] [CrossRef]
  22. Ahn, E.; Fall, C.; Prom, L.K.; Magill, C. Genome-Wide Association Study of Senegalese Sorghum Seedlings Responding to a Texas Isolate of Colletotrichum Sublineola. Sci. Rep. 2022, 12, 13025. [Google Scholar] [CrossRef] [PubMed]
  23. Ahn, E.; Prom, L.K.; Hu, Z.; Odvody, G.; Magill, C. Genome-wide Association Analysis for Response of Senegalese Sorghum Accessions to Texas Isolates of Anthracnose. Plant Genome 2021, 14, e20097. [Google Scholar] [CrossRef]
  24. Cervantes, E.; Martín, J.J.; Saadaoui, E. Updated Methods for Seed Shape Analysis. Scientifica 2016, 2016, 5691825. [Google Scholar] [CrossRef] [PubMed]
  25. Dong, R.; Guo, Q.; Li, H.; Li, J.; Zuo, W.; Long, C. Estimation of morphological variation in seed traits of Sophora moorcroftiana using digital image analysis. Front. Plant Sci. 2023, 14, 1185393. [Google Scholar] [CrossRef] [PubMed]
  26. Wang, L.; Upadhyaya, H.D.; Zheng, J.; Liu, Y.; Singh, S.K.; Gowda, C.L.L.; Kumar, R.; Zhu, Y.; Wang, Y.-H.; Li, J. Genome-wide association mapping identifies novel panicle morphology loci and candidate genes in sorghum. Front. Plant Sci. 2021, 12, 743838. [Google Scholar] [CrossRef]
  27. Sakamoto, L.; Kajiya-Kanegae, H.; Noshita, K.; Takanashi, H.; Kobayashi, M.; Kudo, T.; Yano, K.; Tokunaga, T.; Tsutsumi, N.; Iwata, H. Comparison of shape quantification methods for genomic prediction, and genome-wide association study of sorghum seed morphology. PLoS ONE 2019, 14, e0224695. [Google Scholar] [CrossRef] [PubMed]
  28. Chopra, R.; Burow, G.; Burke, J.J.; Gladman, N.; Xin, Z. Genome-wide association analysis of seedling traits in diverse Sorghum germplasm under thermal stress. BMC Plant Biol. 2017, 17, 12. [Google Scholar] [CrossRef] [PubMed]
  29. Ahn, E.; Botkin, J.; Ellur, V.; Lee, Y.; Poudel, K.; Prom, L.K.; Magill, C. Genome-Wide Association Study of Seed Morphology Traits in Senegalese Sorghum Cultivars. Plants 2023, 12, 2344. [Google Scholar] [CrossRef]
  30. Elshire, R.J.; Glaubitz, J.C.; Sun, Q.; Poland, J.A.; Kawamoto, K.; Buckler, E.S.; Mitchell, S.E. A Robust, Simple Genotyping-by-Sequencing (GBS) Approach for High Diversity Species. PLoS ONE 2011, 6, e19379. [Google Scholar] [CrossRef]
  31. Hu, Z.; Olatoye, M.O.; Marla, S.; Morris, G.P. An integrated genotyping-by-sequencing polymorphism map for over 10,000 sorghum Genotypes. Plant Genome 2019, 12, 180044. [Google Scholar] [CrossRef] [PubMed]
  32. Upadhyaya, H.D.; Wang, Y.H.; Gowda, C.L.L.; Sharma, S. Association mapping of maturity and plant height using SNP markers with the sorghum mini core collection. Theor. Appl. Genet. 2013, 126, 2003–2015. [Google Scholar] [CrossRef]
  33. Browning, B.L.; Browning, S.R. Genotype imputation with millions of reference samples. Am. J. Hum. Genet. 2016, 98, 116–126. [Google Scholar] [CrossRef]
  34. Lipka, A.E.; Tian, F.; Wang, Q.; Peiffer, J.; Li, M.; Bradbury, P.J.; Gore, M.A.; Buckler, E.S.; Zhang, Z. GAPIT: Genome association and prediction integrated tool. Bioinformatics 2012, 28, 2397–2399. [Google Scholar] [CrossRef]
  35. Liu, X.; Huang, M.; Fan, B.; Buckler, E.S.; Zhang, Z. Iterative usage of fixed and random effect models for powerful and efficient genomewide association studies. PLoS Genet. 2016, 12, e1005767. [Google Scholar] [CrossRef] [PubMed]
  36. McCormick, R.F.; Truong, S.K.; Sreedasyam, A.; Jenkins, J.; Shu, S.; Sims, D.; Kennedy, M.; Amirebrahimi, M.; Weers, B.D.; McKinley, B.; et al. The Sorghum bicolor reference genome: Improved assembly, gene annotations, a transcriptome atlas, and signatures of genome organization. Plant J. 2018, 93, 338–354. [Google Scholar] [CrossRef] [PubMed]
  37. Diantina, S.; McGill, C.; Millner, J.; Nadarajan, J.; Pritchard, H.W.; Clavijo McCormick, A. Comparative Seed Morphology of Tropical and Temperate Orchid Species with Different Growth Habits. Plants 2020, 9, 161. [Google Scholar] [CrossRef] [PubMed]
  38. Takanashi, H. Genetic Control of Morphological Traits Useful for Improving Sorghum. Breed. Sci. 2023, 73, 57–69. [Google Scholar] [CrossRef]
  39. Prom, L.K.; Ahn, E.; Isakeit, T.; Magill, C. Correlations among grain mold severity, seed weight, and germination rate of sorghum association panel lines inoculated with Alternaria alternata, Fusarium thapsinum, and Curvularia lunata. J. Agric. Crops 2022, 8, 7–11. [Google Scholar] [CrossRef]
  40. Ahn, E.; Prom, L.K.; Fall, C.; Magill, C. Response of Senegalese Sorghum Seedlings to Pathotype 5 of Sporisorium reilianum. Crops 2022, 2, 142–153. [Google Scholar] [CrossRef]
  41. Wright, P.J.; Fullerton, R.A.; Koolaard, J.P. Fungicide control of head smut (Sporisorium reilianum) of sweetcorn (Zea mays). N. Z. J. Crop Hortic. Sci. 2006, 34, 23–26. [Google Scholar] [CrossRef]
  42. Dong, N.Q.; Sun, Y.; Guo, T.; Shi, C.L.; Zhang, Y.M.; Kan, Y.; Xiang, Y.H.; Zhang, H.; Yang, Y.B.; Li, Y.C. UDP-glucosyltransferase regulates grain size and abiotic stress tolerance associated with metabolic flux redirection in rice. Nat. Comm. 2020, 11, 2629. [Google Scholar] [CrossRef]
  43. Xu, Q.K.; Yu, H.P.; Xia, S.S.; Cui, Y.J.; Yu, X.Q.; Liu, H.; Zeng, D.L.; Hu, J.; Zhang, Q.; Gao, Z.Y. The C2H2 zinc-finger protein LACKING RUDIMENTARY GLUME 1 regulates spikelet development in rice. Sci. Bull. 2020, 65, 753–764. [Google Scholar] [CrossRef]
  44. Sun, X.; Xie, Y.; Xu, K.; Li, J. Regulatory networks of the F-box protein FBX206 and OVATE family proteins modulate brassinosteroid biosynthesis to regulate grain size and yield in rice. J. Exp. Bot. 2023, 75, 789–801. [Google Scholar] [CrossRef] [PubMed]
  45. Osakabe, Y.; Maruyama, K.; Seki, M.; Satou, M.; Shinozaki, K.; Yamaguchi-Shinozaki, K. Leucine-Rich Repeat Receptor-Like Kinase1 Is a Key Membrane-Bound Regulator of Abscisic Acid Early Signaling in Arabidopsis. Plant Cell 2005, 17, 1105–1119. [Google Scholar] [CrossRef] [PubMed]
  46. Shahollari, B.; Vadassery, J.; Varma, A.; Oelmüller, R. A Leucine-Rich Repeat Protein Is Required for Growth Promotion and Enhanced Seed Production Mediated by the Endophytic Fungus Piriformospora indica in Arabidopsis thaliana. Plant J. 2007, 50, 1–13. [Google Scholar] [CrossRef] [PubMed]
  47. Xu, J.; Wang, X.; Guo, W. The Cytochrome P450 Superfamily: Key Players in Plant Development and Defense. J. Integr. Agric. 2015, 14, 1673–1686. [Google Scholar] [CrossRef]
  48. Hansen, C.C.; Nelson, D.R.; Møller, B.L.; Werck-Reichhart, D. Plant Cytochrome P450 Plasticity and Evolution. Mol. Plant 2021, 14, 1244–1265. [Google Scholar] [CrossRef] [PubMed]
  49. Zhan, P.; Wei, X.; Xiao, Z.; Wang, X.; Ma, S.; Lin, S.; Li, F.; Bu, S.; Liu, Z.; Zhu, H. GW10, a member of P450 subfamily regulates grain size and grain number in rice. Theor. Appl. Genet. 2021, 134, 3941–3950. [Google Scholar] [CrossRef]
  50. Bao, Y.; Song, W.-M.; Pan, J.; Jiang, C.-M.; Srivastava, R.; Li, B.; Zhu, L.-Y.; Su, H.-Y.; Gao, X.-S.; Liu, H.; et al. Overexpression of the NDR1/HIN1-Like Gene NHL6 modifies seed germination in response to abscisic acid and abiotic stresses in Arabidopsis. PLoS ONE 2016, 11, e0148572. [Google Scholar] [CrossRef] [PubMed]
  51. Ihsan, M.Z.; Ahmad, S.J.N.; Shah, Z.H.; Rehman, H.M.; Aslam, Z.; Ahuja, I.; Bones, A.M.; Ahmad, J.N. Gene Mining for Proline Based Signaling Proteins in Cell Wall of Arabidopsis thaliana. Front. Plant Sci. 2017, 8, 233. [Google Scholar] [CrossRef] [PubMed]
  52. Ma, J.; Wang, L.; Cao, Y.; Wang, H.; Li, H. Association mapping and transcriptome analysis reveal the genetic architecture of maize kernel size. Front. Plant Sci. 2021, 12, 273. [Google Scholar] [CrossRef]
  53. Malzahn, A.; Lowder, L.; Qi, Y. Plant genome editing with TALEN and CRISPR. Cell Biosci. 2017, 7, 21. [Google Scholar] [CrossRef] [PubMed]
  54. Petolino, J.F. Genome editing in plants via designed zinc finger nucleases. In Vitro Cell. Dev. Biol. 2015, 51, 1–8. [Google Scholar] [CrossRef] [PubMed]
  55. Wang, G.; Xu, Z.; Wang, F.; Huang, Y.; Xin, Y.; Liang, S.; Li, B.; Si, H.; Sun, L.; Wang, Q.; et al. Development of an efficient and precise adenine base editor (ABE) with expanded target range in allotetraploid cotton (Gossypium hirsutum). BMC Biol. 2022, 20, 45. [Google Scholar] [CrossRef] [PubMed]
  56. Zong, Y.; Liu, Y.; Xue, C.; Li, B.; Li, X.; Wang, Y.; Li, J.; Liu, G.; Huang, X.; Cao, X.; et al. An engineered prime editor with enhanced editing efficiency in plants. Nat. Biotechnol. 2022, 40, 1394–1402. [Google Scholar] [CrossRef] [PubMed]
  57. Jin, S.; Lin, Q.; Gao, Q.; Gao, C. Optimized Prime Editing in Monocot Plants Using PlantPegDesigner and Engineered Plant Prime Editors (EPPEs). Nat. Protoc. 2023, 18, 831–853. [Google Scholar] [CrossRef] [PubMed]
Figure 1. A comparison of the area sizes for IS11473 (PI329738) and IS12697 (PI302116). The seed of (a) IS11473 has one of the largest areas among the seeds compared, while the seed of (b) IS12697 has one of the smallest areas. The scale bars on the bottom right corner indicate 1 cm for (a,b).
Crops 04 00012 g001
Figure 2. A contrast of the seed colors for IS9108 (PI682465) and IS7987 (PI685210). The seed of (a) IS9108 has one of the darkest colors among the mini-core and Senegalese germplasms, while the seed of (b) IS7987 has one of the brightest colors. The scale bar represents 1 cm in both (a,b).
Crops 04 00012 g002
Figure 3. Scatter plots displaying correlations (Pearson’s r) between two traits. The correlations are additionally shown with a heatmap and fit lines.
Crops 04 00012 g003
Figure 4. The principal component analysis of all seed morphology-related traits from tested sorghum germplasms. The plot displays PC1 vs. PC2.
Crops 04 00012 g004
Figure 5. The partial contributions of variables to seed morphology in sorghum accessions comprised of sorghum mini-core and Senegalese lines are shown. The partial contributions toward PC1 (red), PC2 (green), and PC3 (blue) are displayed for each trait.
Crops 04 00012 g005
Figure 6. Manhattan plots of GWAS results: significant SNPs associated with eight phenotypic traits across the genome. The traits included the following: (A) area size; (B) brightness; (C) circularity; (D) distance between IS and CG; (E) length; (F) length-to-width ratio; (G) perimeter length; (H) width. The colored dots represent SNP markers. The green line indicates a Bonferroni-corrected p-value threshold of 1.7 × 10⁻⁷ (-log10(p) = 6.8).
Crops 04 00012 g006
Table 1. Top seed morphology accessions across the accessions.
AccessionMean ± S.D.AccessionMean ± S.D.
Largest Area Size (mm2)Smallest Area Size (mm2)
IS1147325.60 ± 1.60IS126974.92 ± 0.83
PI51440421.61 ± 3.75IS132647.76 ± 1.26
IS798721.24 ± 2.70PI5143947.93 ± 1.00
PI25398620.04 ± 3.63PI5143088.07 ± 0.89
IS2814119.32 ± 2.75PI5144748.18 ± 0.78
Longest perimeter (mm)Shortest perimeter (mm)
IS1147320.57 ± 0.65IS126978.54 ± 0.75
PI51440418.16 ± 1.70PI51439411.04 ± 0.72
IS798717.96 ± 1.21IS1326411.08 ± 1.20
PI25398617.28 ± 1.54PI51430811.13 ± 0.63
IS2814117.15 ± 1.21PI51447411.25 ± 0.57
Longest length (mm)Shortest length (mm)
IS114736.32 ± 0.24IS126973.03 ± 0.29
IS79875.73 ± 0.37PI5144343.74 ± 0.23
PI5144045.59 ± 0.49PI5143943.89 ± 0.24
IS281415.55 ± 0.41PI5143083.90 ± 0.20
IS128045.46 ± 0.41IS91083.91 ± 0.28
Longest width (mm)Shortest width (mm)
IS114735.59 ± 0.23IS126972.17 ± 0.18
PI5144045.19 ± 0.48IS132642.61 ± 0.18
IS79875.01 ± 0.35IS31212.76 ± 0.26
IS281415.00 ± 0.39PI5143942.79 ± 0.20
IS110264.99 ± 0.29PI5144742.82 ± 0.15
Highest LWRLowest LWR
IS128041.73 ± 0.17IS103021.06 ± 0.03
IS12331.59 ± 0.08IS110261.07 ± 0.05
IS132641.58 ± 0.21PI5143231.07 ± 0.04
IS31211.47 ± 0.11PI5142831.08 ± 0.05
PI5144711.46 ± 0.08PI5142881.08 ± 0.04
Highest circularity (0–1 scale)Lowest circularity (0–1 scale)
IS132940.87 ± 0.01IS128040.73 ± 0.05
IS28720.87 ± 0.01IS114730.76 ± 0.03
IS138930.86 ± 0.01IS12330.78 ± 0.02
IS91080.86 ± 0.01IS140900.79 ± 0.03
IS129370.85 ± 0.01IS270340.79 ± 0.03
The longest distance between IS and CG (mm)The shortest distance between IS and CG (mm)
IS270340.40 ± 0.20PI5143940.18 ± 0.12
IS110260.39 ± 0.19IS126970.18 ± 0.10
PI5142880.37 ± 0.24PI5144340.18 ± 0.10
IS114730.37 ± 0.19IS28720.19 ± 0.11
IS140900.36 ± 0.18PI5144680.19 ± 0.12
Brightest (0–255 scale)Darkest (0–255 scale)
IS7987237.14 ± 6.64IS9108 82.80 ± 10.00
IS32439234.96 ± 11.57IS11619 87.62 ± 13.74
IS32349234.14 ± 12.62IS9177 87.68 ± 9.00
IS7305232.78 ± 17.78IS1326493.12 ± 22.34
PI514446230.68 ± 12.47PI1137493.30 ± 12.03
Table 2. Detailed info regarding correlations in eight seed morphology-related traits. *** = p < 0.0001, ** = p < 0.001, and * = p < 0.01.
Area Size Perimeter LengthWidthLWRCircularityIS and CGBrightness
Area size (mm2)1.00 ***0.99 ***0.91 ***0.96 ***−0.57 ***−0.120.61 ***0.22 **
Perimeter (mm)0.99 ***1.00 ***0.94 ***0.95 ***−0.52 ***−0.19 *0.62 ***0.24 **
Length (mm)0.91 ***0.94 ***1.00 ***0.79 ***−0.21 **−0.34 ***0.56 ***0.26 ***
Width (mm)0.96 ***0.95 ***0.79 ***1.00 ***−0.75 ***0.010.60 ***0.17 **
LWR−0.57 ***−0.52 ***−0.21 **−0.75 ***1.00 ***−0.44 ***−0.31 ***−0.04
Circularity−0.12−0.19 *−0.34 ***0.01−0.44 ***1.00 ***−0.42 ***−0.08
IS and CG0.61 ***0.62 ***0.56 ***0.60 ***−0.31 ***−0.42 ***1.00 ***−0.07
Brightness0.22 **0.24 **0.26 ***0.17 **−0.04−0.08−0.071.00 ***
Table 3. Cluster variables analysis among the seed morphology-related traits. Three clusters were formed based on seed characteristics: Size, color, and shape.
ClusterMembersR2 with Its Own ClusterR2 with the Next Closest1 − R2
1Perimeter length0.980.060.02
Area size0.970.070.03
Width0.90.20.12
Length0.860.070.15
Distance between IS and CG0.520.010.49
2Circularity0.720.050.29
Length-to-width ratio0.720.270.38
3Brightness10.040
Table 4. Comparison of seed morphology traits in sorghum mini-core lines between head smut resistant and susceptible groups. * = p < 0.05; ND = no significant difference.
Area Size (mm2) Perimeter (mm) Length (mm)Width (mm)LWRCircularity (0–1 Scale)IS and CG (mm)Brightness (0–255 Scale)
Resistant14.114.514.7341.190.830.26152.12
Susceptible12.7613.824.593.751.240.820.25160
Significance based on p-value**ND***NDND
Table 5. Logistic regression analysis of seed morphology traits and disease resistance in sorghum mini-core lines. * = p < 0.05 (Chi-square test); NS = no significant association.
Area Size (mm2) Perimeter (mm) Length (mm)Width (mm)LWRCircularity (0–1 Scale)IS and CG (mm)Brightness (0–255 Scale)
AnthracnoseNSNSNSNSNSNS*NS
Head smut**NS***NSNS
Downy mildewNSNSNSNSNSNS*NS
Table 6. Representative genes located in proximity to the most significant SNPs identified by GWAS for each seed morphology trait based on the p-value. A detailed list of genes is available in Table S2.
TraitsGenomic Region (Chr:Start:End)Genbank AccGeneFunctional Description
Area size2:46,909,052:47,000,446XP_002462114.1LOC8063481Uncharacterized protein LOC8063481
XP_021309157.1LOC8062049Obtusifoliol 14-alpha demethylase
XP_021307796.1LOC8062051Uncharacterized protein LOC8062051
Brightness6:15,369,645:15,389,645XP_002447605.1LOC8086462Probable carbohydrate esterase At4g34215
Circularity4:6,234,171:6,254,171XP_002451702.2LOC8079462Uncharacterized protein LOC8079462
Distance between IS and CG1:9,022,825:9,058,954XP_002466572.1LOC8063379Exportin-2
XP_002466573.1LOC8063380Mitogen-activated protein kinase kinase 9
XP_002463995.1LOC8063381NADH dehydrogenase [ubiquinone] iron-sulfur protein 1, mitochondrial
XP_021309701.1LOC8062905Uncharacterized protein LOC8062905 isoform X2
XP_002463997.1LOC8062906Uncharacterized protein LOC8062906
XP_021309690.1LOC110432893Dynamin-related protein 1C
XP_002466574.1LOC8062907Threonine dehydratase biosynthetic, chloroplastic
Length4:3,896,951:3,916,951XP_002451576.1LOC8074663Probable leucine-rich repeat receptor-like protein kinase At1g35710
XP_002453340.2LOC8074664Opioid growth factor receptor
LWR7:59,797,465:59,817,465XP_002444553.1LOC8054827Zinc finger protein 593 homolog
XP_021320741.1LOC110437031Uncharacterized protein LOC110437031
XP_021320742.1LOC110437032Protein MAINTENANCE OF MERISTEMS-like
Perimeter 8:5,758,743:5,781,871XP_021321624.1LOC8076292Uncharacterized protein LOC8076292
XP_002442907.1LOC8076293Transmembrane 9 superfamily member 1
Width9:55,101,547:55,133,329XP_002440093.1LOC8067532Probable transcriptional regulatory protein At2g25830
XP_002441399.1LOC8082991Dolichyl-diphosphooligosaccharide--protein glycosyltransferase subunit STT3A
XP_021303951.1LOC8067925Probable peptidyl-tRNA hydrolase 2 isoform X3
XP_002440094.1LOC8068943GATA transcription factor 12
Disclaimer/Publisher’s Note: The statements, opinions and data contained in all publications are solely those of the individual author(s) and contributor(s) and not of MDPI and/or the editor(s). MDPI and/or the editor(s) disclaim responsibility for any injury to people or property resulting from any ideas, methods, instructions or products referred to in the content.

