Article

Genotypic Variability in Root Morphological Traits in Canola (Brassica napus L.) at the Seedling Stage

UWA School of Agriculture and Environment, UWA Institute of Agriculture, The University of Western Australia, Perth, WA 6009, Australia
*
Author to whom correspondence should be addressed.
Crops 2025, 5(2), 18; https://doi.org/10.3390/crops5020018
Submission received: 27 January 2025 / Revised: 24 March 2025 / Accepted: 31 March 2025 / Published: 6 April 2025

Abstract

:
Canola (Brassica napus L.) is a vital oilseed crop, but its sustainable production is increasingly challenged by climate change. Characterizing genotypic variation in root morphological traits in canola provides a basis for breeding new varieties with root traits that enhance soil nutrient uptake, water use efficiency, and adaptation to stress. This study evaluated genotypic variation in 25 root morphological traits and 2 shoot traits across 173 canola genotypes using a semi-hydroponic phenotyping platform under controlled conditions. Large genotypic variation was observed in the majority of root traits. Nineteen traits with a coefficient of variation greater than 0.3 were selected for further analysis. Principal component analysis identified five components with eigenvalues > 1, collectively accounting for 87.9% of the total variability. Hierarchical cluster analysis classified the 173 genotypes into five distinct clusters. The broad genotypic variations in root morphological traits among genotypes offer significant potential for future research aimed at identifying molecular markers and genes associated with key morphological traits. This study provides a strong foundation for the genetic improvement of canola to enhance resource-use efficiency and tolerance to environmental stresses, such as drought and heat stress.

1. Introduction

Canola is a major temperate oilseed crop and the largest oilseed crop in Australia [1]. Australia first began cultivating canola in the 1960s, with commercial production starting in 1969 using seeds imported from Canada [2]. By 1999, Australia had become one of the world’s largest producers and exporters of canola [2]. However, between 1998 and 2014, the area under canola cultivation in Australia declined, primarily due to climate change, with the most significant reductions occurring in Western Australia [2,3]. Climate change affects crops in multiple ways, inducing a wide range of stresses such as drought, heat, and salt stress [4]. As the first plant organs to encounter environmental stresses [5], roots play a critical role in sensing changes in the soil’s physical and chemical properties and adapting growth accordingly [6]. The morphological and architectural traits of roots are essential for these adaptations. Root traits exhibit better resilience to water stress and improved water and nutrient use efficiency.
Genetic variation in crops is crucial for selecting varieties with desirable traits and enhanced adaptability [7]. Identifying and selecting phenotypes with advantageous root traits is essential for breeding programs. Although numerous studies have evaluated traits in canola, research on root traits requires further expansion [8]. Root phenotyping of large-scale genotype collections is challenging, as traditional methods such as hydroponics, aeroponics, agar plate systems [9], soil-filled root observation chambers, and growth pouches [10,11] have limitations that hinder the efficient phenotyping of extensive root systems. These methods are destructive and laborious [12], and large-scale phenotyping is difficult to perform [13,14]. In this study, a semi-hydroponic phenotyping system [15] was utilized. As a semi-hydroponic system, it does not require additional aeration and plant roots are not deprived of oxygen, offering distinct advantages over traditional aeroponic and hydroponic systems [9]. This system combines features of both aeroponics and hydroponics, reducing hypoxic stress while allowing for rapid changes to the nutrient solution and enabling precise analysis of root traits [15]. Additionally, this soil-independent system prevents root contamination and damage during washing, allowing for efficient analysis of diverse genotypes.
Due to the importance of canola and root system traits in future breeding programs, there is increasing demand for a better understanding of genotypic variation among a large number of canola genotypes. Therefore, the primary aim of this study was to characterize the root morphological variability in a collection of canola (Brassica napus L.) genotypes under controlled conditions using the semi-hydroponic phenotyping system. Correlation, principal component, and cluster analyses were conducted to explore associations among various root traits, providing a framework for future research and breeding efforts.

2. Materials and Methods

2.1. Canola Genotypes

This study evaluated a set of 173 canola (Brassica napus L.) genotypes, including 19 Australian canola cultivars, 24 cultivars or breeding lines from China, 9 cultivars or breeding lines from European countries, 57 newly resynthesized lines, 20 introgressed lines, and 44 recurrent selection lines (Table S1). These genotypes represent a large diversity of cultivars in major canola-producing countries and some new breeding materials. The genotypes are being tested for drought and heat tolerance.

2.2. Root Phenotyping System

The semi-hydroponic phenotyping system comprises a mobile bin on wheels, a support stand with an integrated piping system, growth units, and an irrigation system. The bin has a volume of 240 L, with dimensions of 75 cm × 58 cm at the opening and a height of 108 cm. It is equipped with wheels for easy mobility. The support stand, made of stainless steel, has 20 slots to hold the growth units, with the piping system securely attached to the frame. Each phenotyping system accommodates 20 growth units. Each growth unit is constructed from a 5 mm thick acrylic sheet, measuring 26 cm × 48 cm, and is wrapped with black cloth as detailed in Chen et al. (2009 and 2020) [15,16]. The irrigation system features an automatic pump and 5 mm PVC tubing to provide continuous moisture to the growth units (Figure S1). Each bin contained 40 L of nutrient solution with the following composition (in µM): N (1000), P (40), K (1220), S (1802), Ca (600), Mg (200), Cu (0.2), Zn (0.75), Mn (0.75), B (5), Co (0.2), Na (0.06), Mo (0.03), and Fe (20) [15].

2.3. Experiment Layouts and Performance

The experiment was conducted in three rounds starting in September 2023 to facilitate measurements at harvest. Each round included 61, 71, and 51 genotypes, respectively, with five genotypes (AV_Ruby, Stingray, Tanami, YM11, and ZY001) used as checks across all three rounds to account for environmental variation (Table S1).
Prior to transplanting, canola seeds were germinated in Petri dishes after their surfaces were sterilized. Fifteen evenly sized seeds from each genotype were selected and placed at equal intervals in Petri dishes lined with wet filter paper for germination. The Petri dishes were kept in a dark room at a constant temperature of 25 °C for 2 days to promote germination. Once germinated, uniform seedlings with similar shoot and root size of the same genotype were selected for transplanting into the growth units.
Four seedlings of each genotype were selected and carefully transplanted into four different growth units of four bin systems, representing four replications. Each root system was gently inserted vertically between the black cloth and the acrylic sheet. The four plants of each genotype were distributed across four separate bins, which served as replicates. The nutrient solution in each bin was refreshed weekly. The existing solution was drained, the bin was rinsed with DI water, and 40 L of fresh nutrient solution was added. Hygiene was maintained throughout the experiment to avoid the development of mold.

2.4. Data Collection

Canola plants were grown in the phenotyping system for 28 days, with an average temperature below 24 °C (Table S2). After this period, the plants were photographed using a Nikon D5200 camera (Nikon Corporation, Tokyo, Japan) positioned perpendicularly to the plants. Prior to photographing, the black cloth covering the growth units was removed to capture detailed images of root system morphology. At harvest, root depth, maximum root width, and root angle were measured using a ruler (Figure S2). Following photography, the shoot of each plant was separated from its root system. The shoot was placed in a paper bag and dried in an oven at 70 °C for 72 h. The dried shoots were then weighed to determine dry mass.
Root subsamples were collected in 20 cm segments from the base of the plant (top 0–20 cm, middle 20–40 cm, and bottom 40 cm and beyond). These samples were stored in plastic bags and kept in a cool room before scanning for further analysis.

2.5. Image and Data Analysis

Root subsamples collected at harvest were scanned in 8-bit grayscale at 400 dpi using an Epson Perfection V800 desktop scanner (Long Beach, CA, USA). After scanning, the three root sections from each plant were combined into a single sample and dried in a forced-air oven at 70 °C for 72 h to determine the root dry mass per plant. Root images were analyzed using WinRHIZO software (v2009, Regent Instruments, Montreal, QC, Canada), with the debris removal filter set to exclude objects smaller than 1 mm2 and those with a length-to-width ratio lower than 10. The generated data included total root length, root surface area, root volume, and average root diameter for each section. Additional traits, such as specific root length (root length per unit root dry mass), were calculated based on the morphological traits and dry mass. In total, 27 traits were measured, comprising 25 root traits and 2 shoot traits (Table 1).
Given the extended duration of greenhouse work, the temperature in the greenhouse could not be kept perfectly constant, and temperature has a stabilizing effect on traits such as root length and dry weight in canola [17]. Therefore, data calibration was essential to account for temperature variations. Five genotypes were included in each experimental round to serve as a reference for data correction (Table S2). A standard curve was generated to represent the relationship between the traits of these genotypes and the average temperature for each round. This curve was then used to adjust the trait data, minimizing the effects of temperature fluctuations. The normalized data provide a more accurate representation of trait measurements under varying environmental conditions.
Both shoot and root trait data with four replications were subjected to one-way analysis in IBM SPSS v.22. Pearson’s correlation coefficients were used to test the relationships among the phenotypic traits, and cluster analysis was used to separate genotypes into different groups based on the root trait data.

3. Results

3.1. Global Root Traits

Canola root and shoot growth were vigorous in the semi-hydroponic phenotyping system. Notable genotypic variation in root growth was observed, with significant differences in root length and maximum root width (Figure S3).
All tested genotypes displayed a primary root with the first order of branching (Figure S1). A total of 27 traits were measured or calculated, comprising 25 root traits and 2 shoot traits. These included 15 global traits (at the whole root system level) and 12 local (segmental) traits (at the root section level) (Table 1). Significant differences were observed among genotypes. Most canola genotypes exhibited robust root growth, with an average growth rate of 1.48 cm d−1, ranging from 0.69 to 2.24 cm d−1 (Table 2). The average root depth was 48.09 cm, ranging from 19.40 cm (SN07-1) to 75.88 cm (RMNL035-2) (Table 2). The genotype with the greatest root depth had roots 3.82 times longer than the genotype with the shortest roots. The top five genotypes with the largest root depth are RMNL035-2, YM14, RMNL085-2, SN55, and RMNL005-3, and the bottom five genotypes with the smallest root depths are SN07-1, NCA4-4, RR002-NCA2, Alku, and Liho-3 (Table S3).
Total root length varied widely, ranging from 55.96 cm (Stingray) to 573.61 cm (RR013-NCA1) (Figure 1), with an average length of 223.72 cm. The genotype with the longest total root length was 10.25 times longer than the genotype with the shortest. Genotypes RR013-NCA1, YM14, RMNL067-2, RMNL005-3, and RMNL005-3 had the longest roots, while genotypes Stingray, RMNL027-2, SN30, Chinese_6, and SN07-1 had the shortest roots (Table S3). Root width and angle also showed significant genotypic variation. Root width ranged from 2.56 cm (RMNL027-2) to 17.96 cm (NCA10-5), with an average of 7.10 cm. Root angle ranged from 61.15° (RMNL049-3) to 128.77° (Spectrum), with an average angle of 98.48°.
The variability among root traits differed in magnitude. Traits with a coefficient of variation (CV) below 0.3 were considered to have low variability. In this study, there were seven traits with a CV below 0.3: root depth (RD, CV = 0.22), root angle (RA, CV = 0.13), average root diameter (ARD, CV = 0.15), average root diameter for section 1 (ARDS 1, CV = 0.09), average root diameter for section 2 (ARDS 2, CV = 0.08), average root diameter for section 3 (ARDS 3, CV = 0.19), root growth rate (RGR, CV = 0.17), and the root length ratio of the top 20 cm to total root length (RLR/TRL, CV = 0.12) (Table 2).
Canola roots are generally very fine, with minimal variation in diameter across genotypes (CV = 0.15) (Table 2). The average root diameter ranged from 0.074 mm (SN07-1) to 0.21 mm (NCA5-5), with a median of 0.16 mm. The mean root diameter for the entire root system and for sections 1, 2, and 3 were consistent at 0.15 mm, 0.16 mm, 0.15 mm, and 0.15 mm, respectively.
Specific root length (SRL) varied significantly, ranging from 2.55 cm mg−1 (RMNL027-2) to 13.24 cm mg−1 (YM08-1), with an average SRL of 6.19 cm mg−1 (Figure S4). Genotypes NS08, NS06, and Charlton exhibited higher SRL values, indicating that these genotypes have relatively lower root dry mass.

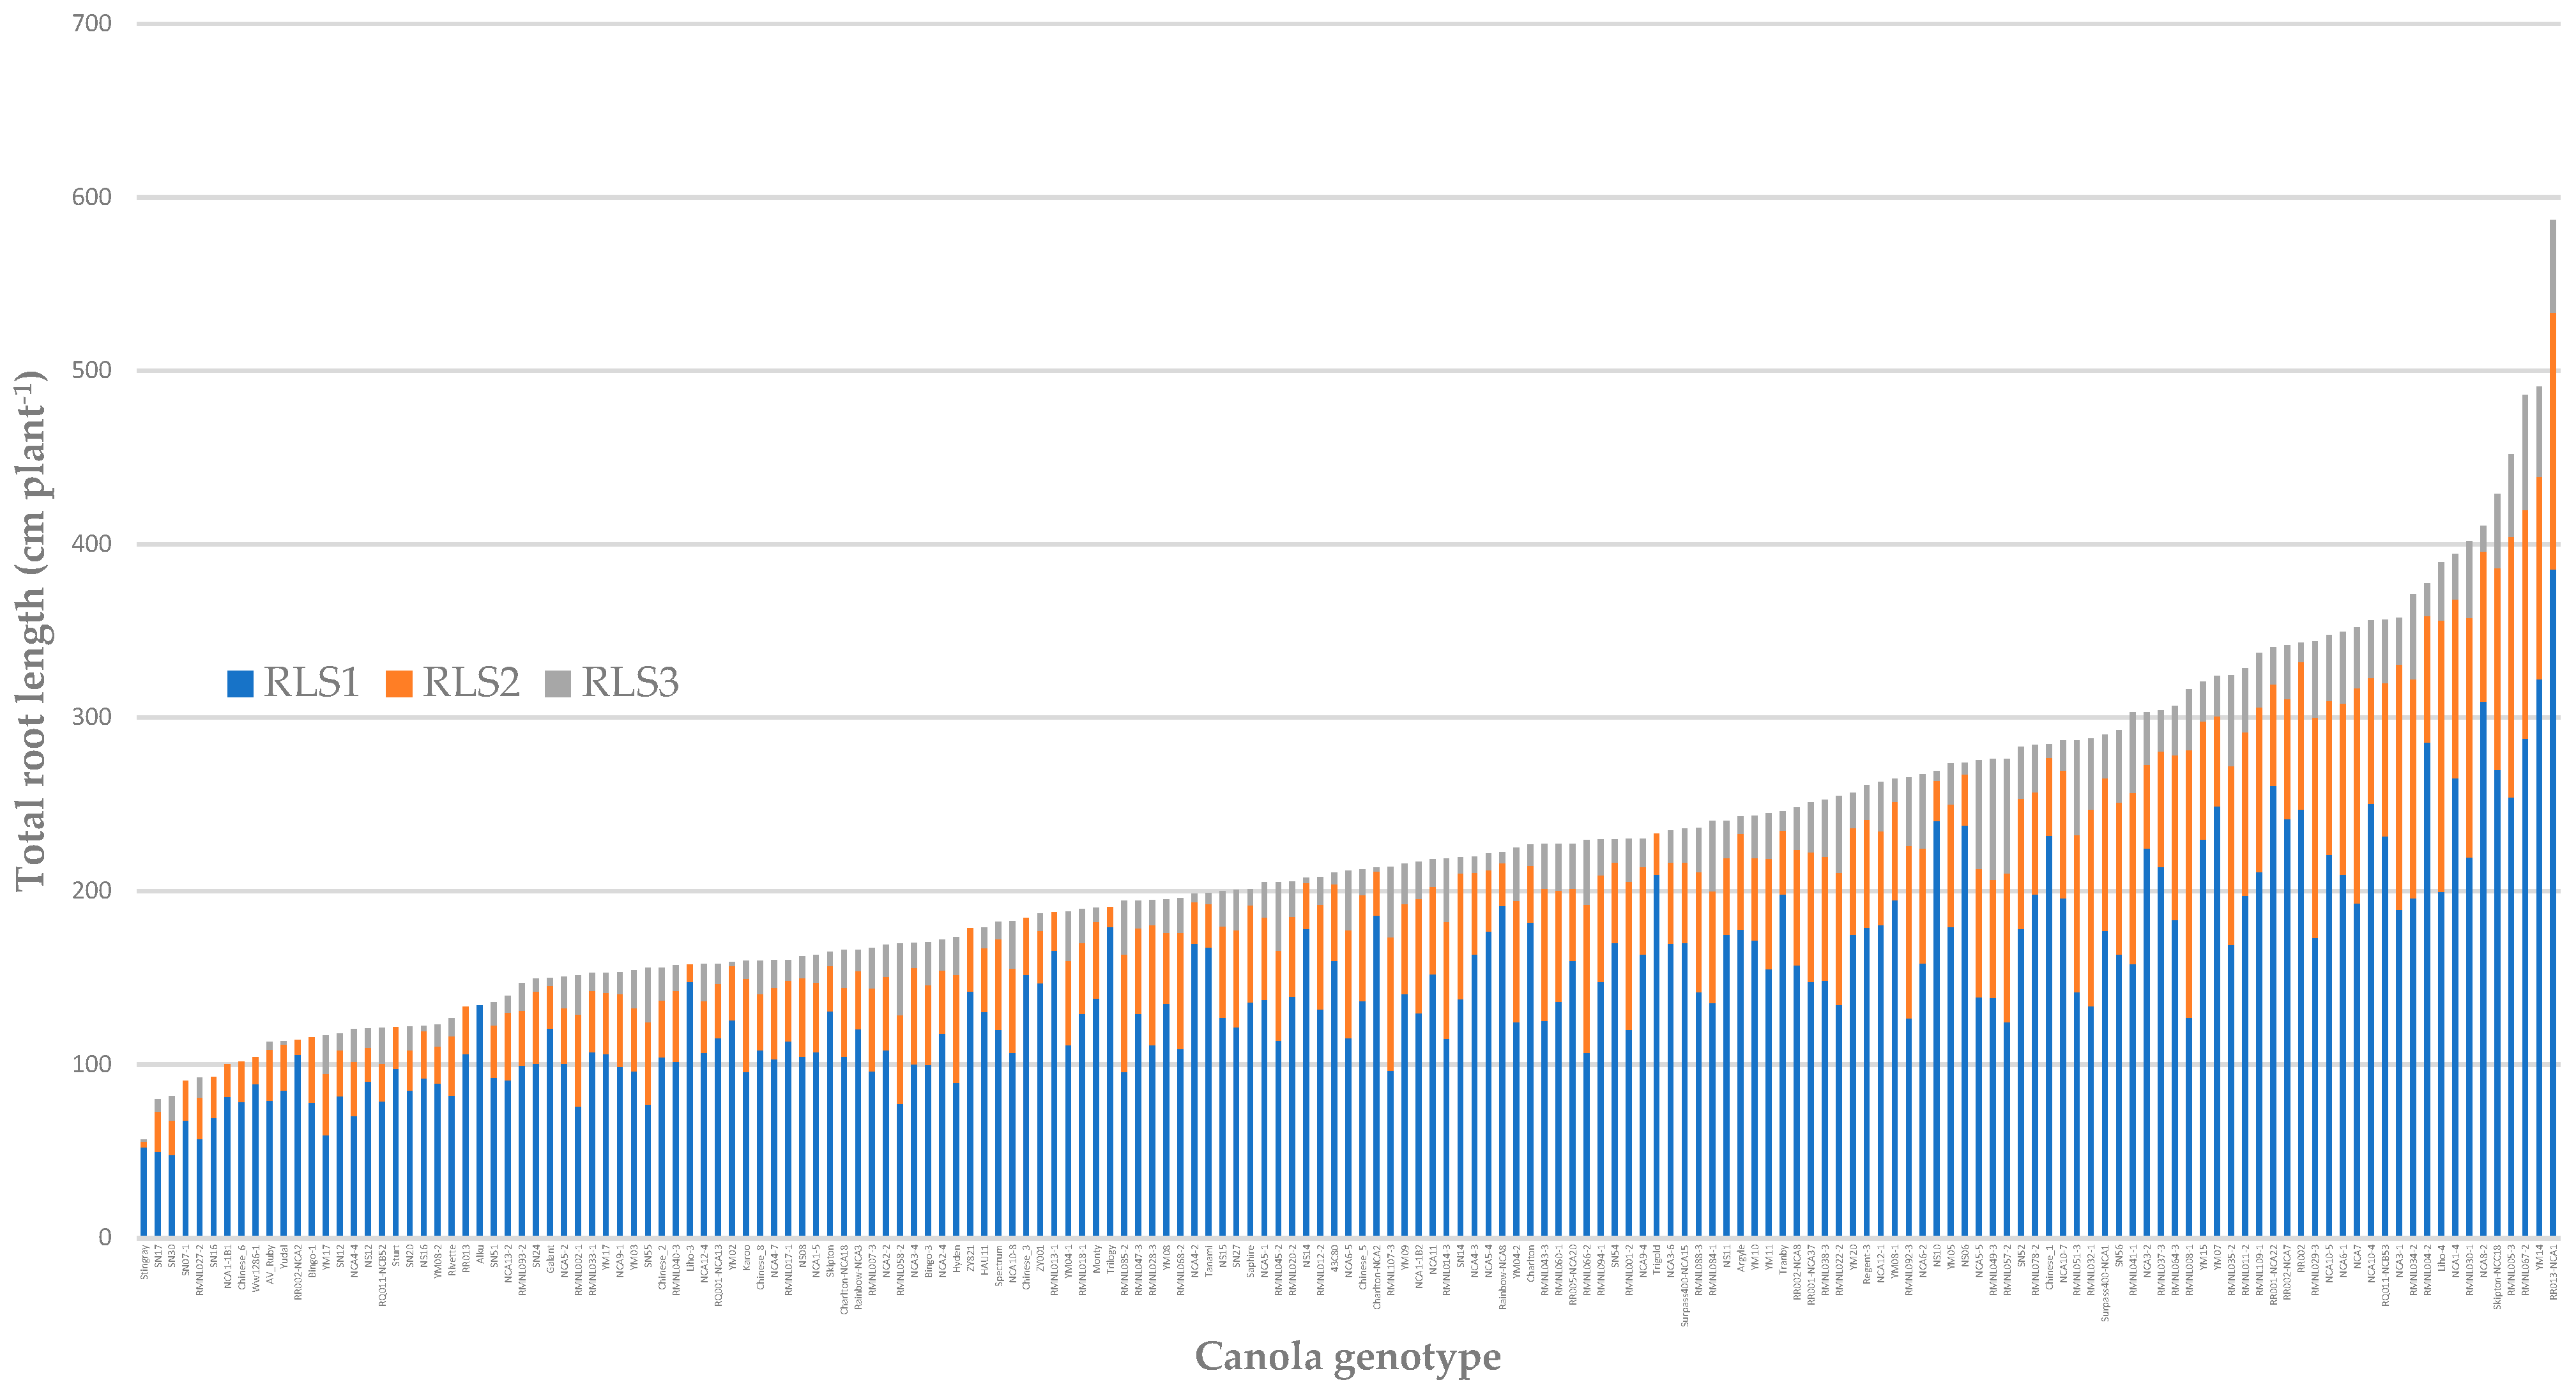
3.2. Local Root Traits

Variability in local root traits is associated with genotypes, with distinct differences in trait variability across root system segments (as reflected in differing CVs). Local trait variability for root length, root surface area, and root volume exhibited higher variability (CV > 0.3). Overall, the local traits showed greater variability than the global traits of the root system, including the more stable root average diameter. The variability for the global trait of total root system length and the three segmented local traits was as follows: root length (RL CV = 0.41, RLS 1 CV = 0.39, RLS 2 CV = 0.56, RLS 3 CV = 0.62); root surface area (RSA CV = 0.44, RSAS 1 CV = 0.42, RSAS 2 CV = 0.58, RSAS 3 CV = 0.71); root average diameter (AVRD CV = 0.15, AVRDS 1 CV = 0.09, AVRDS 2 CV = 0.08, AVRDS 3 CV = 0.19); and root volume (RV CV = 0.49, RVS 1 CV = 0.59, RVS 2 CV = 0.52, RVS 3 CV = 0.89) (Table 2).

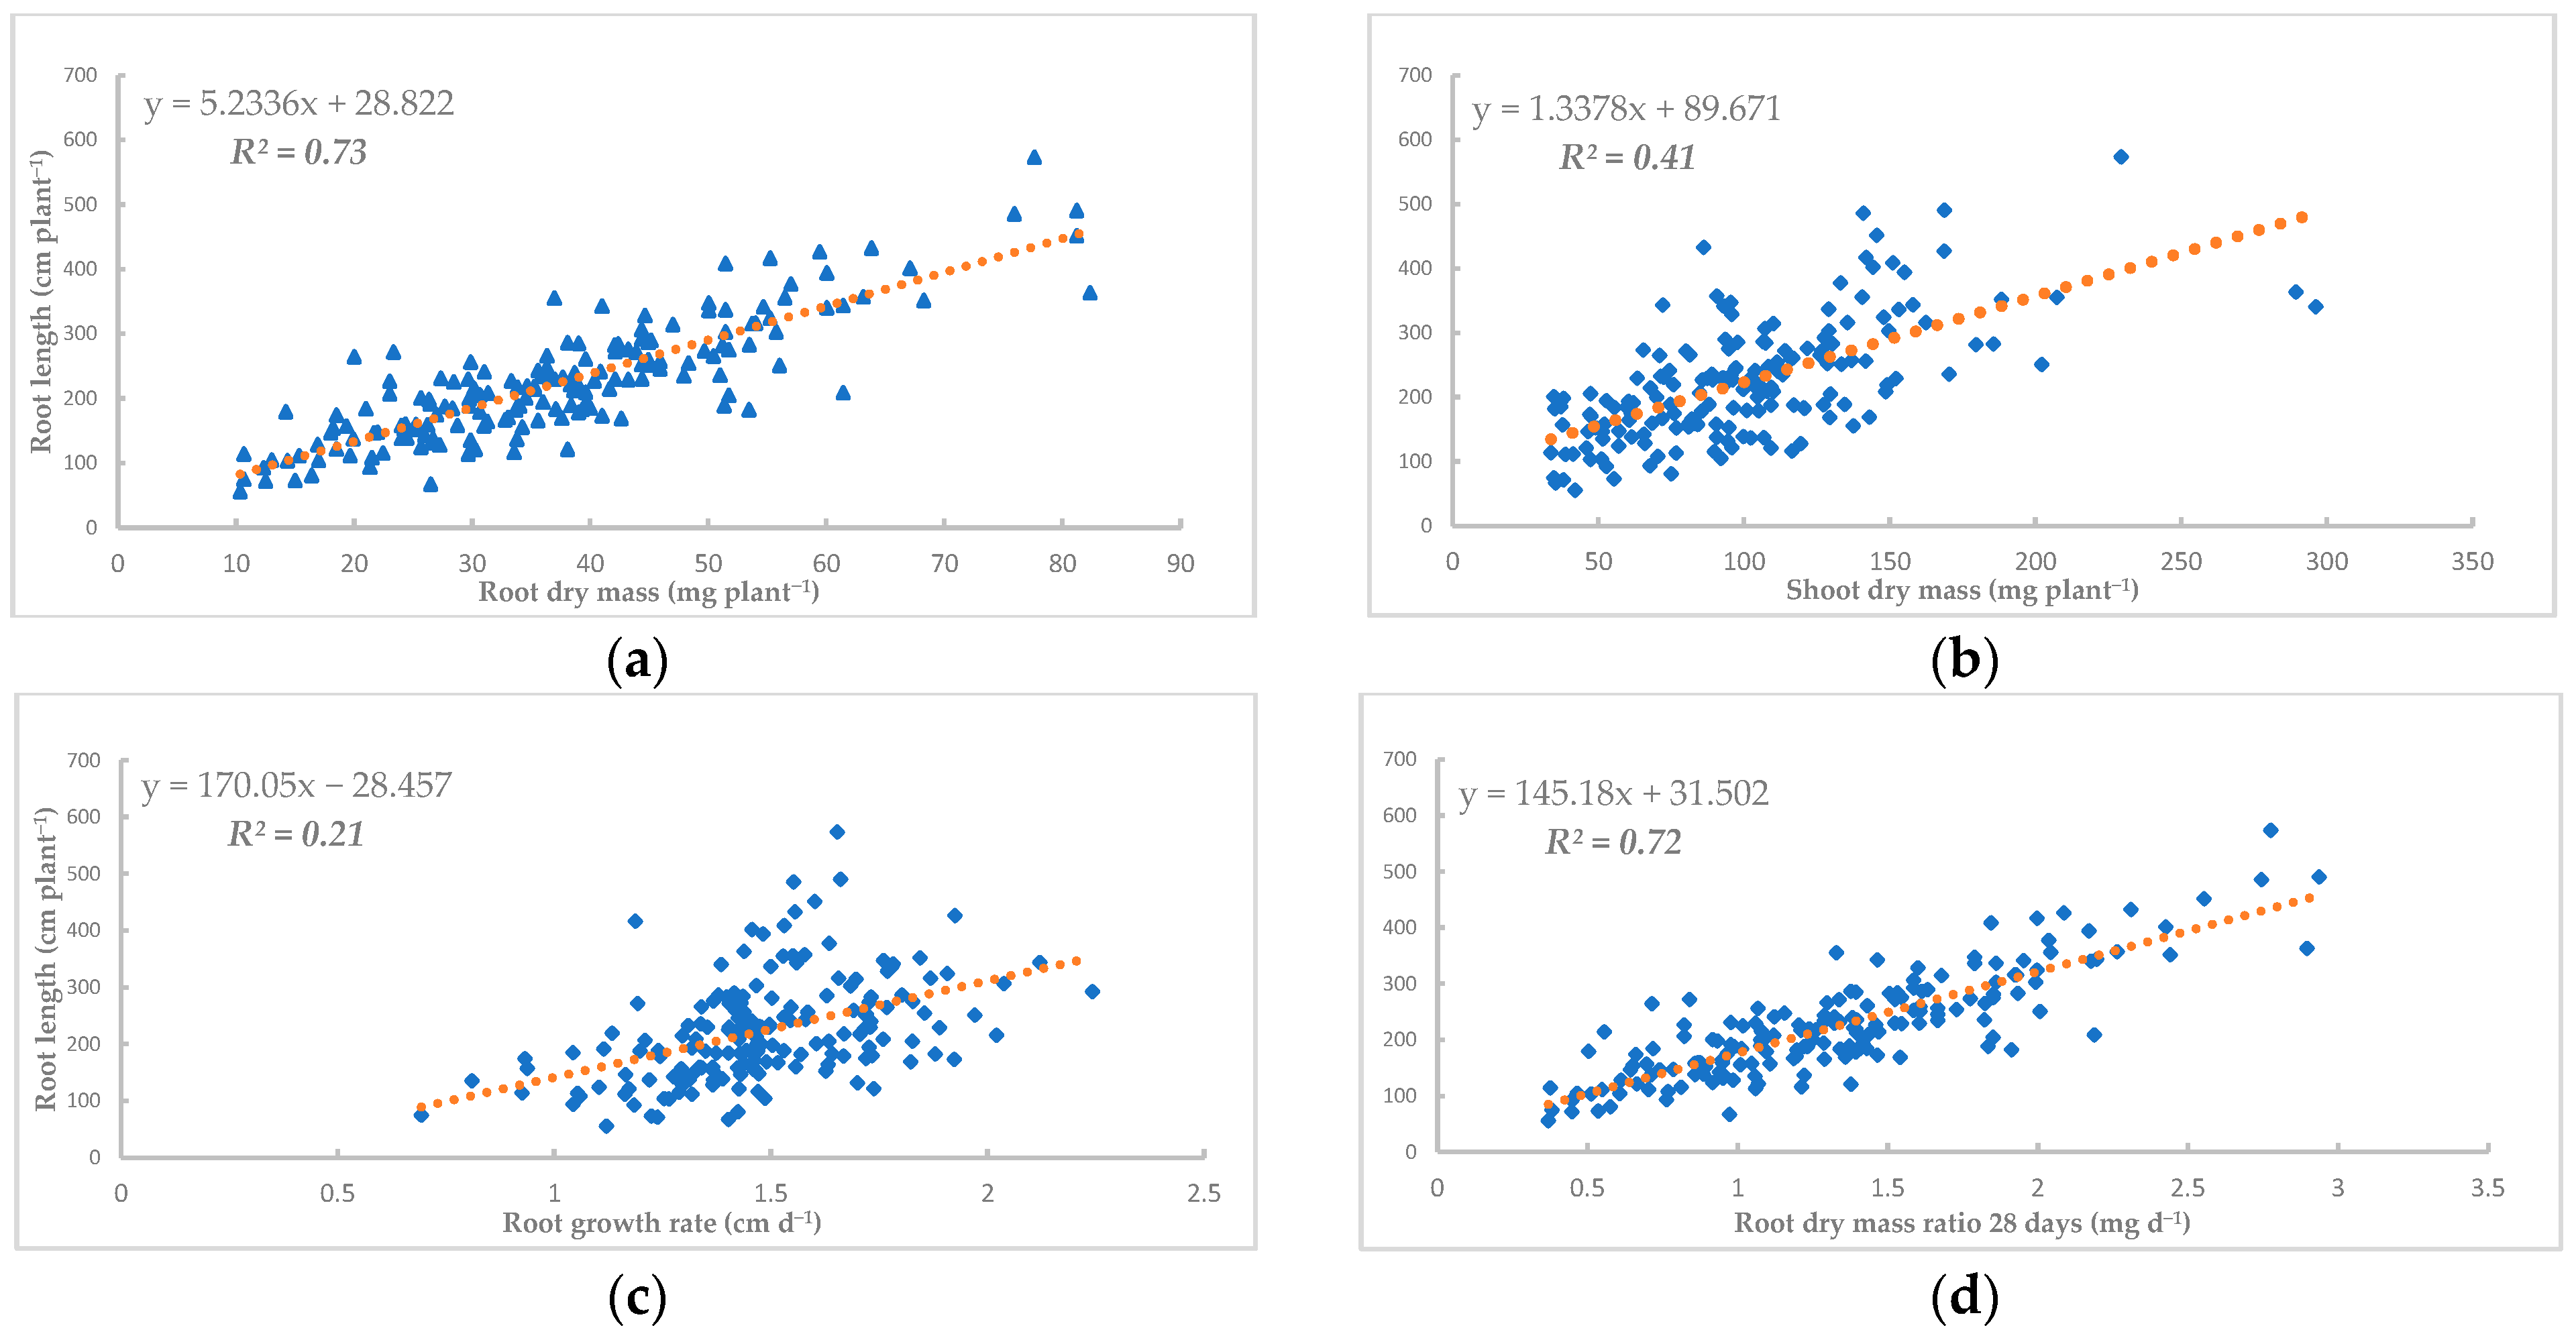
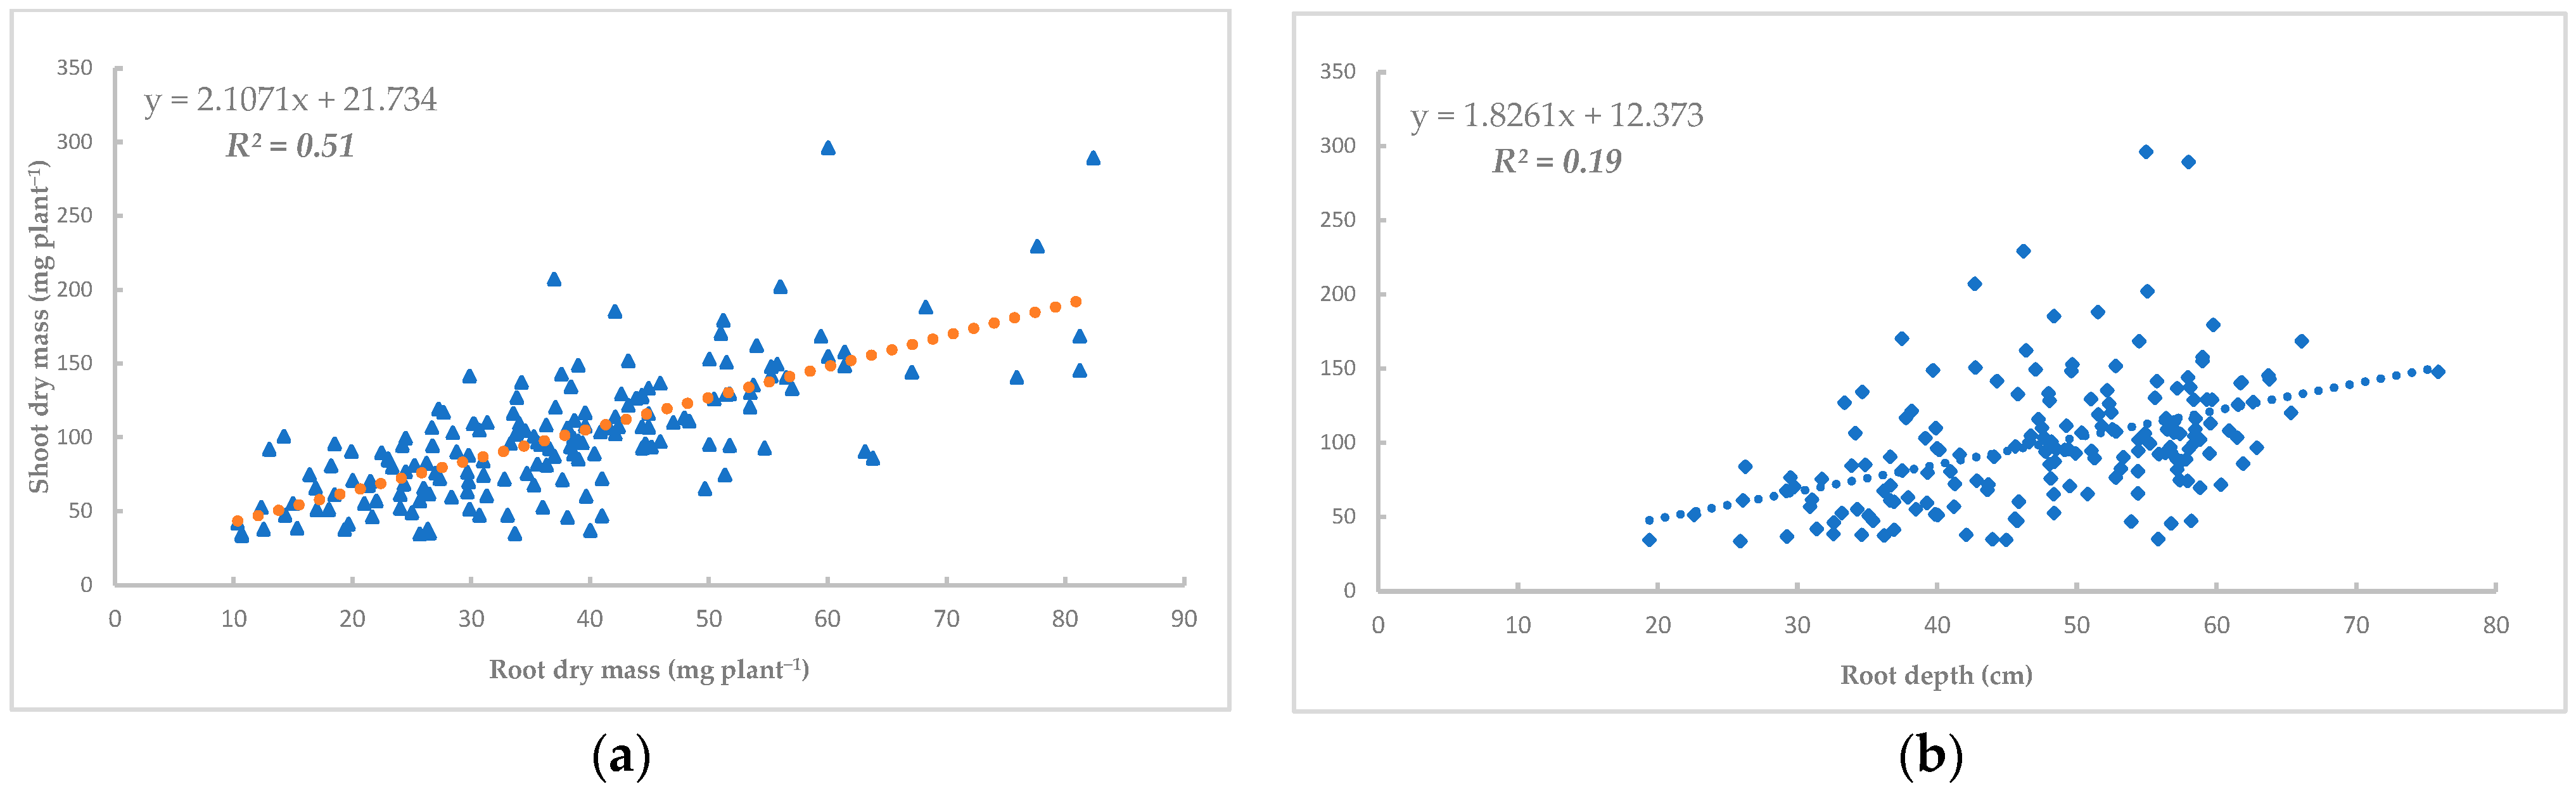
3.3. Correlations Between Different Traits

In our experiment, we categorized the 20 genotypes with the largest total root length as “large root genotypes”, the 20 genotypes with the smallest total root length as “small root genotypes”, and the remaining genotypes as “medium root genotypes”. Among the 20 large root genotypes, 10 also had the maximum total root length in the S1 segment, 15 had the maximum root dry mass, 9 had the maximum shoot dry mass, and 4 had the maximum root growth rate (Table S4). Among the 20 small root genotypes, 15 also had the smallest total root length in the S1 segment, 11 had the minimum root dry mass, 7 had the minimum shoot dry mass, and 7 had the minimum root growth rate (Table S3).
In this experiment, we selected 19 traits with high coefficients of variation (CV ≥ 0.3), including 17 root traits and 2 shoot traits, to establish Pearson correlation coefficient matrices. These traits showed strong correlations with one another (p < 0.01).
We found that total root length was highly correlated with root dry mass (R2 = 0.73, Figure 2a) and root dry mass ratio after 28 days (R2 = 0.72, Figure 2d). Total root length was also positively correlated with shoot dry mass (R2 = 0.41, Figure 2b) and root growth rate (R2 = 0.21, Figure 2c). Additionally, we found a strong positive correlation between root dry mass and shoot dry mass (R2 = 0.51, Figure 3a). Shoot dry mass also showed a positive correlation with root depth (R2 = 0.19, Figure 3b). Notably, the root–shoot ratio (RSR) was a distinct trait, and although it exhibited a significant coefficient of variation, it showed a negative correlation with specific root length (SRL) (p < 0.01) (Figure S5). Moreover, SRL and root dry mass were negatively correlated. Maximum root width was positively correlated only with the shape of the shallow root segments, likely because maximum root width occurs mainly in the shallower root segments (0–20 cm). A positive correlation was observed between leaf number and both root dry mass and shoot dry mass (Figure S5).

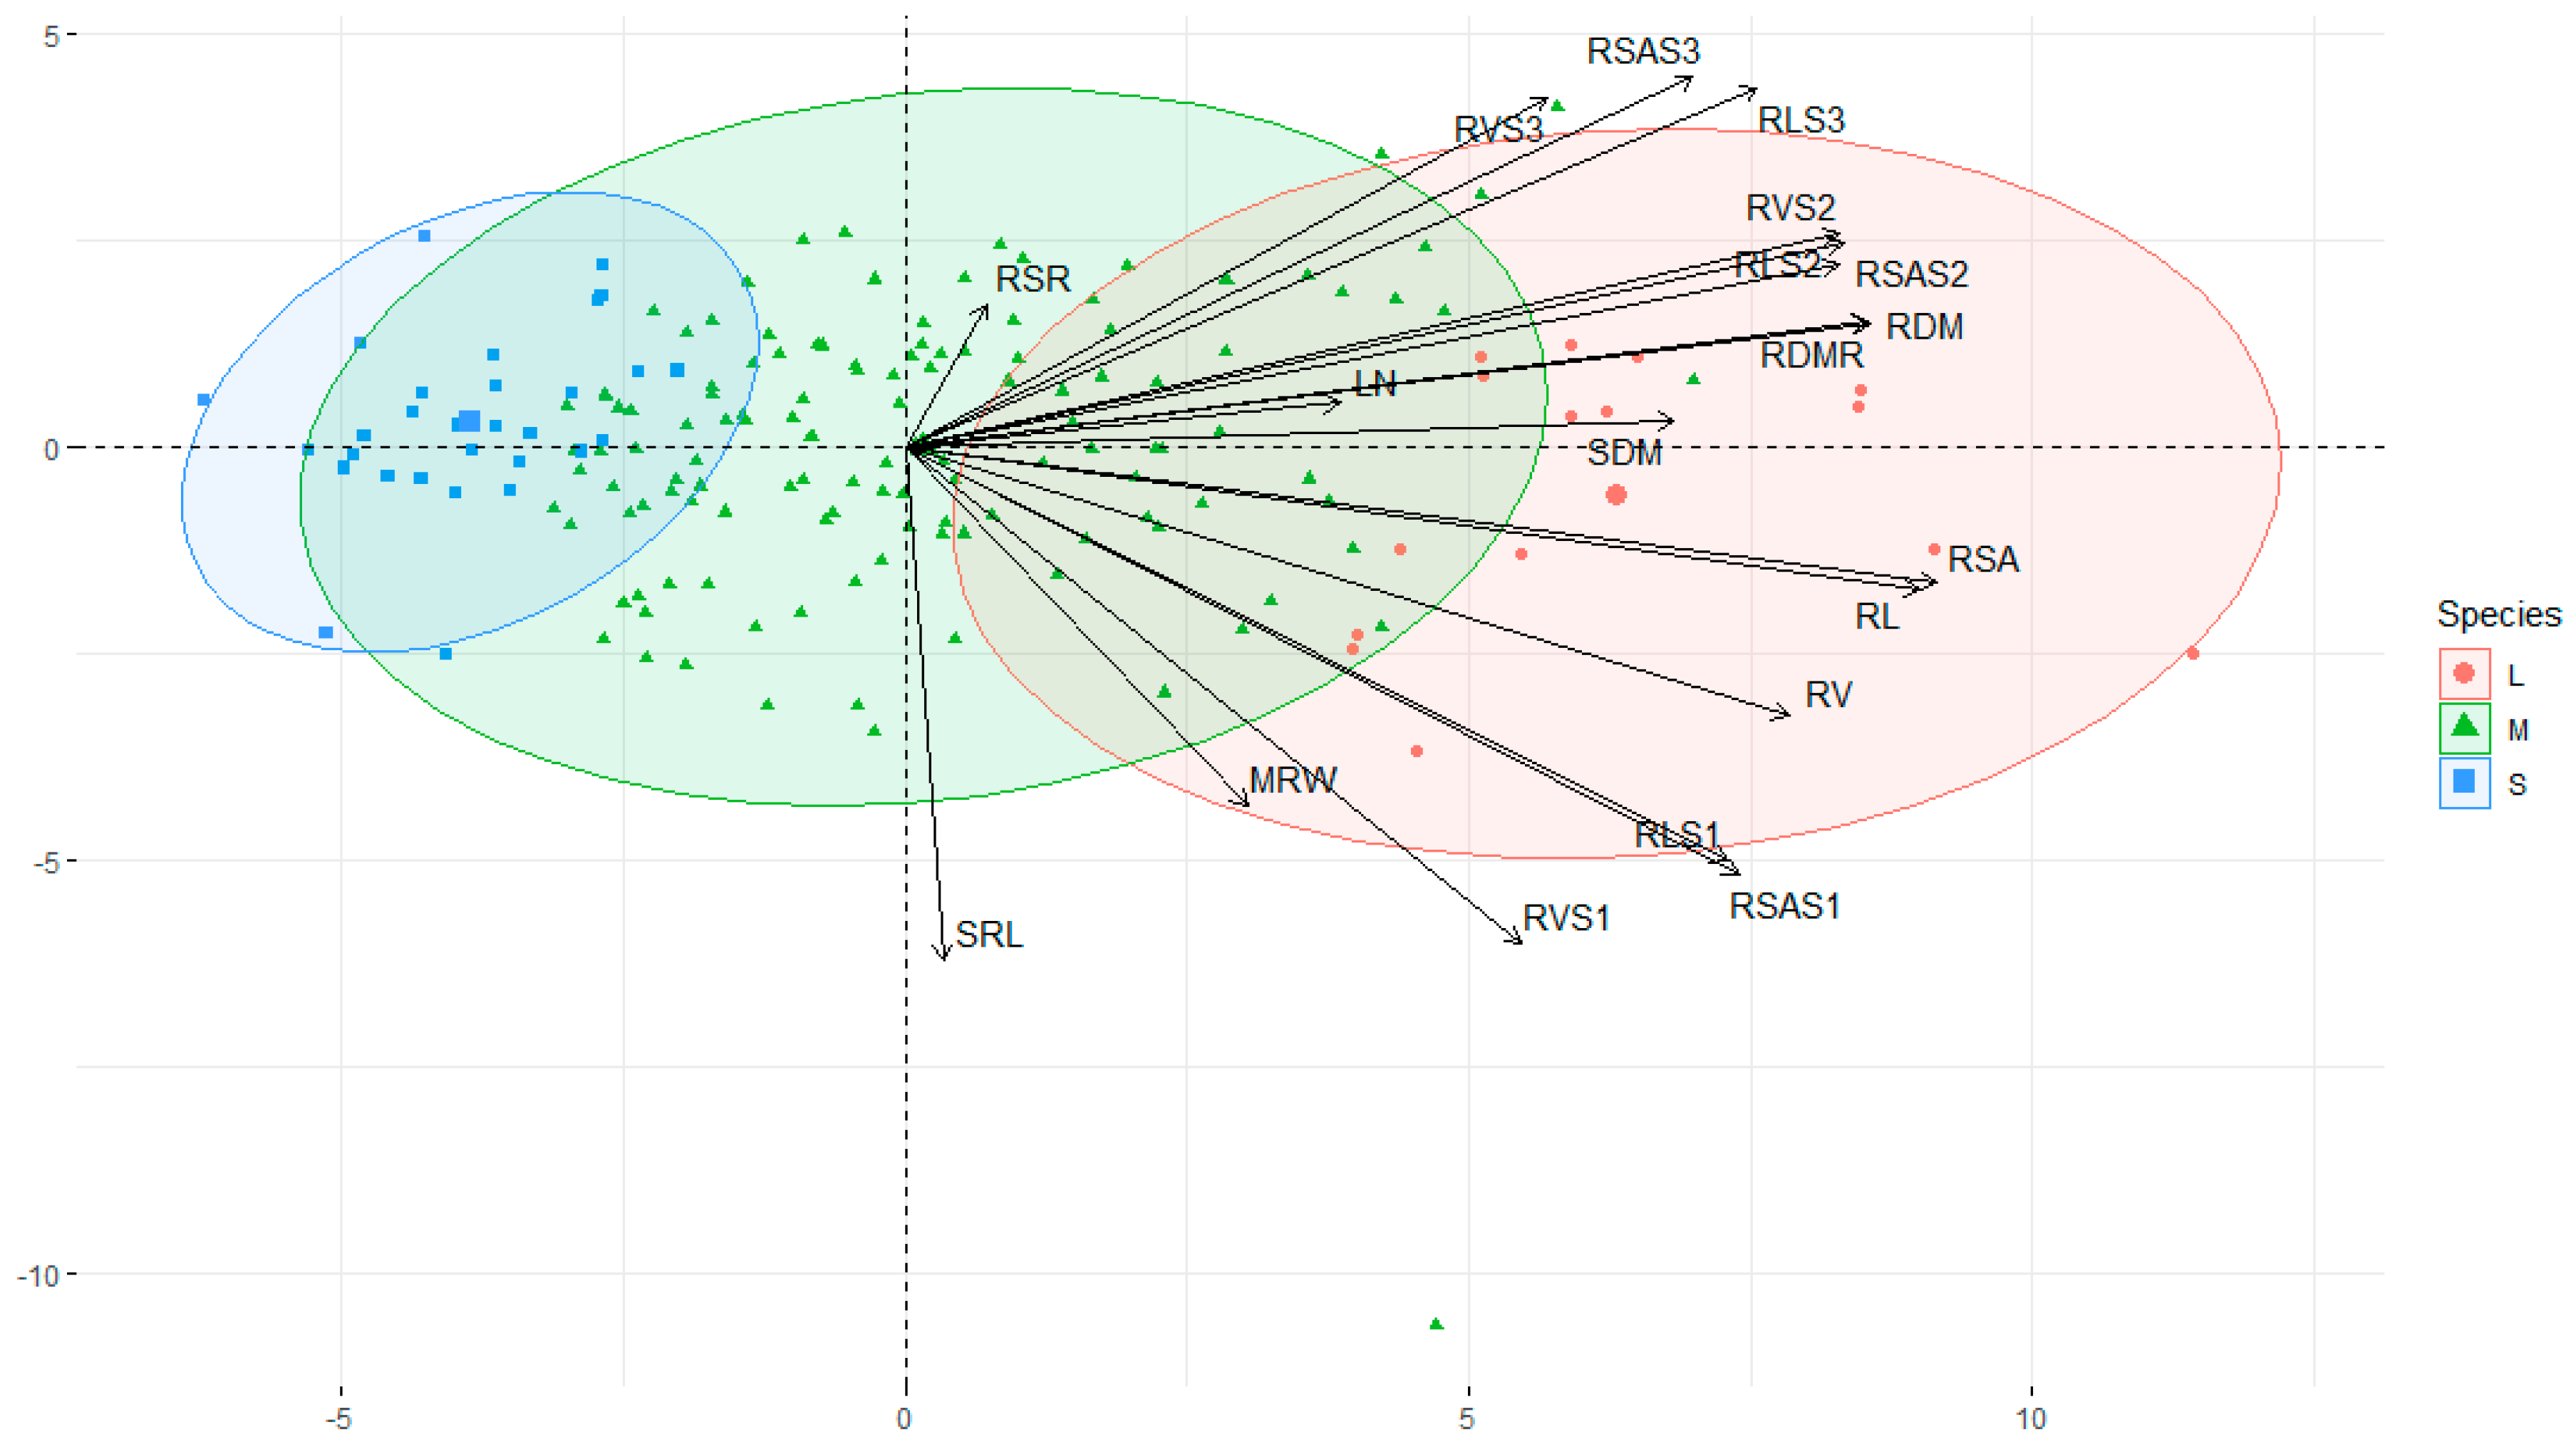
3.4. Principal Component Analysis for High Coefficient of Variation Traits

Principal component analysis (PCA) of the 19 traits with high coefficients of variation revealed five principal components (PCs) with eigenvalues greater than 1. PC1 accounted for 54.3% of the total variation and included 15 traits: shoot dry mass, root dry mass, total and segmented root length, root surface area and segmented root surface area, root volume and segmented root volume, and root growth rate. PC2 accounted for 14.3% of the total variation and included two traits: maximum root width and specific root length. PC3 explained 7.7% of the total variance and included only one trait, the shoot-to-root ratio. PC4 explained 6.1% of the total variance and included only one trait, leaf number (Table 3).
We conducted principal component analysis on different genotypes of oilseed rape based on the analysis reported by Villanueva and Chen [18], and found that the three root length classifications could be grouped into three distinct regions. The small and medium root systems were closely grouped together, while the extensive root systems were more distant from the other two groups (Figure 4).
Hierarchical cluster analysis classified all 173 genotypes into five clusters: Cluster 1 included only one genotype (NS06), Cluster 2 included 58 genotypes, Cluster 3 included 4 genotypes, Cluster 4 included 51 genotypes, and Cluster 5 included 59 genotypes (Figure 5).

4. Discussion

It is well known that drought, soil compaction, and low fertility can restrict crop production [19]. These stresses primarily affect the root system more than the above-ground parts, making the root system a key organ in the defense response to drought and other environmental stresses [20,21].
Many researchers are seeking root traits that confer efficiency in resource acquisition and adaptation to edaphic stresses, especially in drying soil environments. However, phenotyping root traits efficiently is challenging. Automated phenotyping platforms enhance the accuracy and efficiency of genetic data collection. This study characterizes a range of root architecture traits in 173 canola genotypes using a semi-hydroponic phenotyping platform [15]. The root system is plastic and sensitive to GxE effects, adapting to various conditions and varying between genotypes and growth environments [22,23]. Therefore, phenotyping root traits with high variability can support the screening and breeding of new canola cultivars. The different canola genotypes in our semi-hydroponic system grew well over the 28-day period, indicating a suitable environment for root development.
Genetic variation in the root system contributes to drought tolerance at the seedling stage in canola. This study focuses on 27 traits related to root growth (e.g., total root length and root mass), root distribution (e.g., root length and maximum root length), shoot growth (e.g., shoot dry mass and leaf number), and root size (including total root length and total root dry mass). The correlation between root depth during early growth and early root vigor benefits the crop’s light capture and biomass yield [24,25]. Rice genotypes with robust root systems have higher cold tolerance and nitrogen accumulation, without increasing the harvest index under irrigation [26]. Deep-rooted rice performs better in terms of photosynthesis and enhanced drought tolerance under water-limited conditions. Genotypes with deep roots are better suited for drought-prone areas [27]. Specific root length (SRL) is a critical metric used to characterize root system quality and nutrient acquisition [28]. Crops with higher SRLs, which have finer root systems, can increase the surface area per root unit, thereby improving nutrient uptake efficiency [29,30]. In comparison, crops with larger SRLs are thought to be better adapted to arid environments [29].
Studies have shown that longer primary roots [31] and steeper lateral roots [32] lead to deeper root systems and increased radial water conductivity [33,34]. However, in potatoes, yield under drought stress was negatively correlated with root length, root surface area, and root mass [35]. Canola genotypes with efficient phosphorus uptake also have well-developed lateral roots with root fields. Genotypes with larger RLR/TRL exhibit high phosphorus uptake efficiencies in canola studies [36]. Nutrient utilization efficiency, however, is influenced by multiple factors, including RLR/TRL [36].
At the seedling stage, total root length plays a key role in drought tolerance [37]. In chickpea, root length positively correlates with root growth rate [38]. In this study, we observed a positive trend between RL and shoot dry mass. However, some genotypes with larger shoot mass did not necessarily have larger roots. Conflicting relationships between traits such as root extent and aboveground biomass (e.g., plant height) have been observed or have lower correlation in studies of spring wheat [39,40]. Root growth deep underground is often constrained by one or more factors that affect the plant’s ability to acquire water and nutrients from the soil [41].
One study indicated that deep root mass, total root mass, and root length are associated with canola yield under water deficit field conditions [42]. Under drought, high-yielding genotypes exhibit steeper root growth angles than low-yielding genotypes [43]. Shoot dry mass and root mass at the seedling stage can highlight phenotypic differences among genotypes. These root trait results can be used for future studies focused on breeding varieties for specific environments. Some root anatomical features, such as the root cortex and root cortex recharging, are associated with drought resistance [44]. The root tip is the primary site for nutrient and water uptake, and the exudates produced by the root tip attract soil organisms [45]. Furthermore, root tips provide anchorage in the soil, and larger root systems with extensive root surface area offer better anchorage [46].
Salinity is also an abiotic stress and a growing global concern [47]. The risk of crop failure rises as agricultural yields decrease under salinity conditions. Reducing the primary root tip can limit the passage of sodium ions through the soil from roots to shoots [48,49]. In canola, further research into the relationship between root-related traits and productivity or nutrient and water use efficiency is necessary [50]. This study utilized the semi-hydroponic phenotyping system, which has previously shown consistent rankings for important root traits in narrow-leafed lupin [51], soybean [52,53], wheat [54], and barley [55] under various growth conditions. However, further studies are needed to investigate root system traits in different environments, including farmland. Additionally, accurate studies on the identification of genes and/or QTLs controlling specific root traits will help advance the understanding of genetic mechanisms influencing root development and functions.
Root trait dynamics are significantly influenced by genotype, and there are common QTLs between root traits and seed yield or nutrient utilization [49]. A recent review indicated that root traits under drought and salinity stresses are associated with multiple gene loci [56]. A QTL called DRO1 is thought to control the angle of root extension and root depth in rice, and marker-assisted selection could improve root traits and water efficiency in early rice. DRO1 is also considered a drought tolerance QTL [57]. DRO1 homologues have also been found in other crops such as maize and sorghum [58]. This suggests that phenotypic studies of root systems can help to determine the potential for yield improvement in a crop. In addition to this, the study of disease resistance mechanisms in crops has depended on many studies on QTLs, and a recent study has uncovered the mechanism of resistance to leaf rust in wheat [59]. Rapid breeding is seen as a valuable tool that can combat climate change and harsh environments [60]. The use of morphological studies [61] and genomics [62] allows for rapid improvement of varieties.

5. Conclusions

Root traits in canola exhibited significant variation among genotypes under controlled conditions. This study investigated 27 root traits in 173 canola genotypes, which are strongly associated with the plant’s adaptation to its environment. Principal component analysis identified five components with eigenvalues greater than 1, collectively accounting for 87.9% of the total variability. Hierarchical cluster analysis classified the 173 genotypes into five clusters. The data from our experiment can help future researchers carry out further studies, such as GWAS and QTL testing, and can also be used to develop new canola varieties that are more resistant to stress. The broad genotypic variation in root architecture among these canola genotypes offers significant potential for future research aimed at identifying molecular markers and genes associated with key morphological traits. This study provides a strong foundation for genetically improving canola to enhance nutrient use efficiency and tolerance to environmental stresses such as drought and heat. This experiment focused solely on the morphological variation of the canola root system. However, further studies are needed to explore structural changes in the root system, as well as alterations in the nutrient content of both the root and shoot portions.

Supplementary Materials

The following supporting information can be downloaded at: https://www.mdpi.com/article/10.3390/crops5020018/s1. Table S1: List of 173 canola (Brassica napus) genotypes used in this study. Plants were grown in a semi-hydroponic phenotyping system in three different rounds, except five genotypes (Bn001 to Bn005), which were grown in all three rounds to validate environmental effects among the three rounds. Table S2: Average temperature for the experimental periods for the three rounds. Table S3: The five genotypes with the largest and smallest root depth, root length, and root angle. Table S4: Other traits (RLS1, RDM, SDM, RGR) in the 20 largest and 20 smallest genotypes for root length at the highest or lowest. Figure S1: A close view of a semi-hydroponic system showing the layout of 40 canola seedlings grown in the growth unit formed by the black cloth and acrylic panel and the irrigation system. Figure S2: An example root system of a canola plant showing the taproot and the 1st-order branches. Measurements of root angle, root width and root depth are shown. Figure S3: Representative root systems of four different genotypes showing root morphological variations in root depth, root angel, and branching (lateral root numbers). White bar = 5 cm. Figure S4: Phenotypic variation in specific root length (SRL) among 173 canola genotypes 28 days after transplanting in a semi-hydroponic phenotyping platform. Data were plotted from the lowest to the highest SRL values Figure S5: Pearson’s correlation matrix for 19 traits (17 root and 2 shoot traits) in 174 canola genotypes. Traits with CVs ≥ 0.3 were included in the analyses (see Table 3). The correlation significance was indicated at the 0.05 (*), 0.01 (**) and 0.001 (***) level.

Author Contributions

Conceptualization, Y.C.; methodology, Y.C., S.C., Y.P. and A.C.; software, Y.P.; investigation, Y.P. and A.C.; data curation, Y.P. and A.C.; writing—original draft preparation, Y.P. and A.C.; writing—review and editing, Y.C., S.C., Y.P. and A.C.; supervision, Y.C. and S.C.; project administration, Y.C.; funding acquisition, Y.C. and S.C. All authors have read and agreed to the published version of the manuscript.

Funding

This study was supported by the Australian Research Council (FT 210100902) and the Grains Research & Development Corporation (UWA1905-007RTX).

Data Availability Statement

Data are available unpon request.

Acknowledgments

Rob Creasy, Bill Piasini, Shuo Liu, Xunzhe Yang, Ye Ai, Zhenyu Liu, and Milad Mousavi provided assistance in the glasshouse experiment.

Conflicts of Interest

The authors declare no conflicts of interest. The funders had no role in the design of the study; in the collection, analyses, or interpretation of data; in the writing of the manuscript; or in the decision to publish the results.

References

  1. Kirkegaard, J.A.; Lilley, J.M.; Berry, P.M.; Rondanini, D.P. Canola. In Crop Physiology Case Histories for Major Crops; Elsevier: Amsterdam, The Netherlands, 2021; pp. 518–549. [Google Scholar]
  2. Kirkegaard, J.A.; Lilley, J.M.; Morrison, M.J. Drivers of trends in Australian canola productivity and future prospects. Crop Pasture Sci. 2016, 67, i–ix. [Google Scholar] [CrossRef]
  3. Verdon-Kidd, D.; Kiem, A.; Moran, R. Links between the Big Dry in Australia and hemispheric multi-decadal climate variability–implications for water resource management. Hydrol. Earth Syst. Sci. 2014, 18, 2235–2256. [Google Scholar] [CrossRef]
  4. Rivero, R.M.; Mittler, R.; Blumwald, E.; Zandalinas, S.I. Developing climate-resilient crops: Improving plant tolerance to stress combination. Plant J. 2022, 109, 373–389. [Google Scholar]
  5. Porterfield, D.M. Environmental sensing and directional growth of plant roots. In Plant Roots; CRC Press: Boca Raton, FL, USA, 2002; pp. 733–758. [Google Scholar]
  6. Gao, H.-J.; Yang, H.-Q.; Wang, J.-X. Arginine metabolism in roots and leaves of apple (Malus domestica Borkh.): The tissue-specific formation of both nitric oxide and polyamines. Sci. Hortic. 2009, 119, 147–152. [Google Scholar]
  7. Yu, Z.; Fredua-Agyeman, R.; Hwang, S.-F.; Strelkov, S.E. Molecular genetic diversity and population structure analyses of rutabaga accessions from Nordic countries as revealed by single nucleotide polymorphism markers. BMC Genom. 2021, 22, 442. [Google Scholar]
  8. Wang, J.; Kuang, L.; Wang, X.; Liu, G.; Dun, X.; Wang, H. Temporal genetic patterns of root growth in Brassica napus L. revealed by a low-cost, high-efficiency hydroponic system. Theor. Appl. Genet. 2019, 132, 2309–2323. [Google Scholar] [CrossRef] [PubMed]
  9. Gregory, P.J.; Bengough, A.G.; Grinev, D.; Schmidt, S.; Thomas, W.B.T.; Wojciechowski, T.; Young, I.M. Root phenomics of crops: Opportunities and challenges. Funct. Plant Biol. 2009, 36, 922–929. [Google Scholar] [PubMed]
  10. Liao, H.; Yan, X.; Rubio, G.; Beebe, S.E.; Blair, M.W.; Lynch, J.P. Genetic mapping of basal root gravitropism and phosphorus acquisition efficiency in common bean. Funct. Plant Biol. 2004, 31, 959–970. [Google Scholar] [CrossRef]
  11. Nelson, S.K.; Oliver, M.J. A soil-plate based pipeline for assessing cereal root growth in response to polyethylene glycol (PEG)-induced water deficit stress. Front. Plant Sci. 2017, 8, 1272. [Google Scholar]
  12. Wu, Q.; Wu, J.; Zheng, B.; Guo, Y. Optimizing soil-coring strategies to quantify root-length-density distribution in field-grown maize: Virtual coring trials using 3-D root architecture models. Ann. Bot. 2018, 121, 809–819. [Google Scholar]
  13. Benjamin, J.; Nielsen, D. A method to separate plant roots from soil and analyze root surface area. Plant Soil 2004, 267, 225–234. [Google Scholar]
  14. Maqbool, S.; Hassan, M.A.; Xia, X.; York, L.M.; Rasheed, A.; He, Z. Root system architecture in cereals: Progress, challenges and perspective. Plant J. 2022, 110, 23–42. [Google Scholar]
  15. Chen, Y.L.; Dunbabin, V.M.; Diggle, A.J.; Siddique, K.H.; Rengel, Z. Development of a novel semi-hydroponic phenotyping system for studying root architecture. Funct. Plant Biol. 2011, 38, 355–363. [Google Scholar]
  16. Chen, Y.; Zhou, T.; Siddique, K.H. Method for characterization of root traits in chickpea germplasm for legume genomics and breeding. In Legume Genomics: Methods and Protocols; Humana: New York, NY, USA, 2020; pp. 269–275. [Google Scholar]
  17. He, F. Effects of Root Temperature on Food Quality of Horticultural Crops. Ph.D. Thesis, Universitäts-und Landesbibliothek Bonn, Bonn, Germany, 2021. [Google Scholar]
  18. Villanueva, R.A.M.; Chen, Z.J. ggplot2: Elegant Graphics for Data Analysis (2nd ed.). Meas. Interdiscip. Res. Perspect. 2019, 17, 160–167. [Google Scholar] [CrossRef]
  19. Lynch, J.P. Roots of the second green revolution. Aust. J. Bot. 2007, 55, 493–512. [Google Scholar]
  20. Hashimoto, M.; Kisseleva, L.; Sawa, S.; Furukawa, T.; Komatsu, S.; Koshiba, T. A novel rice PR10 protein, RSOsPR10, specifically induced in roots by biotic and abiotic stresses, possibly via the jasmonic acid signaling pathway. Plant Cell Physiol. 2004, 45, 550–559. [Google Scholar] [CrossRef] [PubMed]
  21. Jeong, J.S.; Kim, Y.S.; Baek, K.H.; Jung, H.; Ha, S.-H.; Do Choi, Y.; Kim, M.; Reuzeau, C.; Kim, J.-K. Root-specific expression of OsNAC10 improves drought tolerance and grain yield in rice under field drought conditions. Plant Physiol. 2010, 153, 185–197. [Google Scholar]
  22. Nguyen, V.L.; Luu, H.N.; Phan, T.H.N.; Nguyen, V.L.; Chu, D.H.; Bertero, D.; Curti, N.; McKeown, P.C.; Spillane, C. Genotype by environment interaction across water regimes in relation to cropping season response of quinoa (Chenopodium quinoa). PLoS ONE 2024, 19, e0309777. [Google Scholar]
  23. Wade, L.J.; Bartolome, V.; Mauleon, R.; Vasant, V.D.; Prabakar, S.M.; Chelliah, M.; Kameoka, E.; Nagendra, K.; Reddy, K.K.; Varma, C.M.K. Environmental response and genomic regions correlated with rice root growth and yield under drought in the OryzaSNP panel across multiple study systems. PLoS ONE 2015, 10, e0124127. [Google Scholar]
  24. Ayalew, H.; Liu, H.; Yan, G. Identification and validation of root length QTLs for water stress resistance in hexaploid wheat (Titicum aestivum L.). Euphytica 2017, 213, 126. [Google Scholar]
  25. Wilson, P.; Rebetzke, G.; Condon, A. Pyramiding greater early vigour and integrated transpiration efficiency in bread wheat; trade-offs and benefits. Field Crops Res. 2015, 183, 102–110. [Google Scholar] [CrossRef]
  26. Kulkarni, M.; Soolanayakanahally, R.; Ogawa, S.; Uga, Y.; Selvaraj, M.G.; Kagale, S. Drought response in wheat: Key genes and regulatory mechanisms controlling root system architecture and transpiration efficiency. Front. Chem. 2017, 5, 106. [Google Scholar] [CrossRef]
  27. Lynch, J.P.; Wojciechowski, T. Opportunities and challenges in the subsoil: Pathways to deeper rooted crops. J. Exp. Bot. 2015, 66, 2199–2210. [Google Scholar] [CrossRef] [PubMed]
  28. Lynch, J.P. Root phenotypes for improved nutrient capture: An underexploited opportunity for global agriculture. New Phytol. 2019, 223, 548–564. [Google Scholar] [CrossRef]
  29. Roumet, C.; Urcelay, C.; Díaz, S. Suites of root traits differ between annual and perennial species growing in the field. New Phytol. 2006, 170, 357–368. [Google Scholar] [CrossRef]
  30. Yang, Z.; Zhou, B.; Ge, X.; Cao, Y.; Brunner, I.; Shi, J.; Li, M.-H. Species-specific responses of root morphology of three co-existing tree species to nutrient patches reflect their root foraging strategies. Front. Plant Sci. 2021, 11, 618222. [Google Scholar] [CrossRef] [PubMed]
  31. Wasson, A.P.; Richards, R.; Chatrath, R.; Misra, S.; Prasad, S.S.; Rebetzke, G.; Kirkegaard, J.; Christopher, J.; Watt, M. Traits and selection strategies to improve root systems and water uptake in water-limited wheat crops. J. Exp. Bot. 2012, 63, 3485–3498. [Google Scholar] [CrossRef] [PubMed]
  32. Lynch, J.P. Steep, cheap and deep: An ideotype to optimize water and N acquisition by maize root systems. Ann. Bot. 2013, 112, 347–357. [Google Scholar] [CrossRef]
  33. Akhatar, J.; Banga, S.S. Genome-wide association mapping for grain yield components and root traits in Brassica juncea (L.) Czern & Coss. Mol. Breed. 2015, 35, 48. [Google Scholar]
  34. Choi, H.-S.; Cho, H.-T. Root hairs enhance Arabidopsis seedling survival upon soil disruption. Sci. Rep. 2019, 9, 11181. [Google Scholar] [CrossRef]
  35. Zarzyńska, K.; Boguszewska-Mańkowska, D.; Nosalewicz, A. Differences in size and architecture of the potato cultivars root system and their tolerance to drought stress. Plant Soil Environ. 2017, 63, 159–164. [Google Scholar]
  36. Pongrac, P.; Castillo-Michel, H.; Reyes-Herrera, J.; Hancock, R.D.; Fischer, S.; Kelemen, M.; Thompson, J.A.; Wright, G.; Likar, M.; Broadley, M.R. Effect of phosphorus supply on root traits of two Brassica oleracea L. genotypes. BMC Plant Biol. 2020, 20, 368. [Google Scholar]
  37. Ahmed, H.G.M.-D.; Sajjad, M.; Li, M.; Azmat, M.A.; Rizwan, M.; Maqsood, R.H.; Khan, S.H. Selection criteria for drought-tolerant bread wheat genotypes at seedling stage. Sustainability 2019, 11, 2584. [Google Scholar] [CrossRef]
  38. Chen, Y.; Ghanem, M.E.; Siddique, K.H. Characterising root trait variability in chickpea (Cicer arietinum L.) germplasm. J. Exp. Bot. 2017, 68, 1987–1999. [Google Scholar]
  39. Chen, Y.; Palta, J.; Prasad, P.V.; Siddique, K.H. Phenotypic variability in bread wheat root systems at the early vegetative stage. BMC Plant Biol. 2020, 20, 185. [Google Scholar]
  40. Li, P.; Chen, J.; Wu, P.; Zhang, J.; Chu, C.; See, D.; Brown-Guedira, G.; Zemetra, R.; Souza, E. Quantitative trait loci analysis for the effect of Rht-B1 dwarfing gene on coleoptile length and seedling root length and number of bread wheat. Crop Sci. 2011, 51, 2561–2568. [Google Scholar]
  41. Hodge, A.; Berta, G.; Doussan, C.; Merchan, F.; Crespi, M. Plant root growth, architecture and function. Plant Soil 2009, 321, 153–187. [Google Scholar] [CrossRef]
  42. Zaman, M.A.U.; Rahman, M. A comparative study on root traits of spring and winter canola (Brassica napus L.) under controlled and water stressed conditions. J. Agric. Sci. 2017, 9, 58. [Google Scholar]
  43. Pires, M.V.; de Castro, E.M.; de Freitas, B.S.M.; Lira, J.M.S.; Magalhães, P.C.; Pereira, M.P. Yield-related phenotypic traits of drought resistant maize genotypes. Environ. Exp. Bot. 2020, 171, 103962. [Google Scholar] [CrossRef]
  44. Comas, L.H.; Becker, S.R.; Cruz, V.M.V.; Byrne, P.F.; Dierig, D.A. Root traits contributing to plant productivity under drought. Front. Plant Sci. 2013, 4, 442. [Google Scholar]
  45. Curlango-Rivera, G.; Hawes, M.C. Root tips moving through soil: An intrinsic vulnerability. Plant Signal. Behav. 2011, 6, 726–727. [Google Scholar] [CrossRef] [PubMed]
  46. Bengough, A.G.; Loades, K.; McKenzie, B.M. Root hairs aid soil penetration by anchoring the root surface to pore walls. J. Exp. Bot. 2016, 67, 1071–1078. [Google Scholar] [CrossRef] [PubMed]
  47. Shahid, S.A.; Zaman, M.; Heng, L.; Shahid, S.A.; Zaman, M.; Heng, L. Soil salinity: Historical perspectives and a world overview of the problem. In Guideline for Salinity Assessment, Mitigation and Adaptation Using Nuclear and Related Techniques; Springer: Cham, Switzerland, 2018; pp. 43–53. [Google Scholar]
  48. Munns, R.; Tester, M. Mechanisms of salinity tolerance. Annu. Rev. Plant Biol. 2008, 59, 651–681. [Google Scholar] [CrossRef]
  49. Yang, C.; Fredua-Agyeman, R.; Hwang, S.-F.; Gorim, L.Y.; Strelkov, S.E. Optimizing the evaluation of root system architectural traits in Brassica napus. Can. J. Plant Sci. 2024, 104, 265–269. [Google Scholar] [CrossRef]
  50. Arifuzzaman, M.; Oladzadabbasabadi, A.; McClean, P.; Rahman, M. Shovelomics for phenotyping root architectural traits of rapeseed/canola (Brassica napus L.) and genome-wide association mapping. Mol. Genet. Genom. 2019, 294, 985–1000. [Google Scholar] [CrossRef] [PubMed]
  51. Chen, Y.L.; Dunbabin, V.M.; Diggle, A.J.; Siddique, K.H.; Rengel, Z. Assessing variability in root traits of wild Lupinus angustifolius germplasm: Basis for modelling root system structure. Plant Soil 2012, 354, 141–155. [Google Scholar] [CrossRef]
  52. Liu, S.; Begum, N.; An, T.; Zhao, T.; Xu, B.; Zhang, S.; Deng, X.; Lam, H.-M.; Nguyen, H.T.; Siddique, K.H. Characterization of root system architecture traits in diverse soybean genotypes using a semi-hydroponic system. Plants 2021, 10, 2781. [Google Scholar] [CrossRef]
  53. Salim, M.; Chen, Y.; Ye, H.; Nguyen, H.T.; Solaiman, Z.M.; Siddique, K.H. Screening of soybean genotypes based on root morphology and shoot traits using the semi-hydroponic phenotyping platform and rhizobox technique. Agronomy 2021, 12, 56. [Google Scholar] [CrossRef]
  54. Figueroa-Bustos, V.; Palta, J.A.; Chen, Y.; Siddique, K.H. Characterization of root and shoot traits in wheat cultivars with putative differences in root system size. Agronomy 2018, 8, 109. [Google Scholar] [CrossRef]
  55. Wang, J.; Chen, Y.; Zhang, Y.; Zhang, Y.; Ai, Y.; Feng, Y.; Moody, D.; Diggle, A.; Damon, P.; Rengel, Z. Phenotyping and validation of root morphological traits in barley (Hordeum vulgare L.). Agronomy 2021, 11, 1583. [Google Scholar] [CrossRef]
  56. Sui, J.; Tian, H.; Ding, Z.; Kong, X. Crop Designs: The ideal root architecture for future crop breeding. New Crops 2024, 1, 100030. [Google Scholar] [CrossRef]
  57. Uga, Y.; Sugimoto, K.; Ogawa, S.; Rane, J.; Ishitani, M.; Hara, N.; Kitomi, Y.; Inukai, Y.; Ono, K.; Kanno, N. Control of root system architecture by DEEPER ROOTING 1 increases rice yield under drought conditions. Nat. Genet. 2013, 45, 1097–1102. [Google Scholar] [CrossRef] [PubMed]
  58. Kitomi, Y.; Hanzawa, E.; Kuya, N.; Inoue, H.; Hara, N.; Kawai, S.; Kanno, N.; Endo, M.; Sugimoto, K.; Yamazaki, T. Root angle modifications by the DRO1 homolog improve rice yields in saline paddy fields. Proc. Natl. Acad. Sci. USA 2020, 117, 21242–21250. [Google Scholar] [CrossRef]
  59. Tene, M.; Adhikari, E.; Cobo, N.; Jordan, K.W.; Matny, O.; del Blanco, I.A.; Roter, J.; Ezrati, S.; Govta, L.; Manisterski, J.; et al. GWAS for Stripe Rust Resistance in Wild Emmer Wheat (Triticum dicoccoides) Population: Obstacles and Solutions. Crops 2022, 2, 42–61. [Google Scholar] [CrossRef]
  60. Potts, J.; Jangra, S.; Michael, V.N.; Wu, X. Speed Breeding for Crop Improvement and Food Security. Crops 2023, 3, 276–291. [Google Scholar] [CrossRef]
  61. Ghosh, S.; Watson, A.; Gonzalez-Navarro, O.E.; Ramirez-Gonzalez, R.H.; Yanes, L.; Mendoza-Suárez, M.; Simmonds, J.; Wells, R.; Rayner, T.; Green, P.; et al. Speed breeding in growth chambers and glasshouses for crop breeding and model plant research. Nat. Protoc. 2018, 13, 2944–2963. [Google Scholar] [CrossRef]
  62. Rana, M.M.; Takamatsu, T.; Baslam, M.; Kaneko, K.; Itoh, K.; Harada, N.; Sugiyama, T.; Ohnishi, T.; Kinoshita, T.; Takagi, H.; et al. Salt Tolerance Improvement in Rice through Efficient SNP Marker-Assisted Selection Coupled with Speed-Breeding. Int. J. Mol. Sci. 2019, 20, 2585. [Google Scholar] [CrossRef]
Figure 1. Cumulative barplot showing phenotypic variation in root length among 173 canola genotypes grown in a semi-hydroponic phenotyping platform 28 days after transplanting. Data were plotted from the lowest to the highest total root length (RL). For each genotype, root lengths for the three sections (depths from the top of the root system) were plotted in three different colors. RLS1, total root length in section 1 (0–20 cm, blue bars); RLS2, total root length in section 2 (20–40 cm, orange bars); RLS3, total root length in section 3 (below 40 cm, gray bars).
Crops 05 00018 g001
Figure 2. Correlations between (a) root length and root dry mass, (b) root length and shoot dry mass, (c) root length and root growth rate, and (d) root dry mass ratio 28 days in 173 canola genotypes grown in a semi-hydroponic phenotyping platform 28 days after transplanting.
Crops 05 00018 g002
Figure 3. Correlations (a) between shoot dry mass and root dry mass, (b) shoot dry mass and root depth in 173 canola genotypes grown in a semi-hydroponic phenotyping platform 28 days after transplanting.
Crops 05 00018 g003
Figure 4. Principal component analysis of 19 traits (17 root-related and 2 shoot traits) with genotypes presented by root system size, among 173 canola genotypes grown in a semi-hydroponic phenotyping platform, 28 days after transplanting. The position of each trait is shown for PC1 vs. PC2, representing 68.6%. The red circle is the largest 20 genotypes (L) based on root length; the blue circle is the smallest 20 genotypes (S) based on root length.
Crops 05 00018 g004
Figure 5. Dendrogram of agglomerative hierarchical clustering of 173 canola genotypes using the average linkage method with squared Euclidean distance as the interval measurement on 19 root traits with CVs ≥ 0.3. Genotypes were classified into four different groups indicated by different colour.
Crops 05 00018 g005
Table 1. Traits measured in a canola core collection grown in semi-hydroponic phenotyping system.
TraitsAbbreviationsTrait DescriptionUnits
Shoot dry massSDMTotal shoot dry mass per plantmg
Root dry massRDMTotal root dry mass per plantmg
Root depthRDTotal root depth per plantcm
Maximal root widthMRWMaximal root width per plantcm
Root angleRARoot angledegree
Total root lengthRLRoot lengthcm
Root length section 1RLS 1Root length 0–20 cmcm
Root length section 2RLS 2Root length 20–40 cmcm
Root length section 3RLS 3Root length 40 cm and beyondcm
Total Root surface areaRSARoot surface areacm2
Root surface area section 1RSAS 1Root surface area 0–20 cmcm2
Root surface area section 2RSAS 2Root surface area 20–40 cmcm2
Root surface area section 3RSAS 3Root surface area 40 and beyondcm2
Total average root diameterARDAverage root diametermm
Average root diameter section 1ARDS 1Average root diameter 0–20 cmmm
Average root diameter section 2ARDS 2Average root diameter 20–40 cmmm
Average root diameter section 3ARDS 3Average root diameter 40 cm and beyondmm
Total root volumeRVWhole root volumecm3
Root volume section 1RVS 1Root volume top 0–20 cmcm3
Root volume section 2RVS 2Root volume middle 20–40 cmcm3
Root volume section 3RVS 3Root volume bottom 40 cm and beyondcm3
Specific root lengthSRLRoot mass/Root lengthcm mg−1
Root–shoot ratioRSRRoot mass/Shoot mass
Root growth rateRGRRoot growth rate cm d−1
Root dry mass ratio RDMRRoot dry mass ratio mg d−1
Root length ratio of top 20 cm/total root lengthRLR/TRLsRoot length ratio of top 20 cm/Total root length
Leaf numberLNNumber of leaves per plant
Table 2. Statistical summary of 27 measured traits (25 root traits and 2 shoot traits) in 173 canola genotypes grown in a semi-hydroponic phenotyping system.
AbbreviationMinimumMaximumMeanMedianStd. DeviationCVp
SDM33.67296.19100.2095.7143.780.440.000
RDM10.3382.3337.2436.3114.840.400.000
RD19.4075.8848.0949.2410.360.220.000
MRW2.5617.967.106.602.590.360.000
RA61.15128.7798.4899.4812.750.130.016
RL55.96573.61223.72214.4891.060.410.000
SRL 147.69385.48146.62135.7957.850.390.000
RLS 20.00156.6356.2248.5231.420.560.000
RLS 30.0069.8022.9520.4114.150.620.000
RSA2.7433.8612.1011.045.270.440.000
RSAS 12.5424.227.917.443.350.420.000
RSAS 20.008.912.972.611.730.580.000
RSAS 30.006.301.331.150.950.710.000
ARD0.070.210.150.150.020.150.039
RARD 10.130.260.160.160.010.090.050
ARDS 20.000.180.150.150.010.080.072
ARDS 30.000.350.160.160.030.190.102
RV0.010.220.050.040.020.490.000
RVS 10.010.210.030.030.020.590.000
RVS 20.000.030.020.010.010.520.000
RVS 30.000.050.010.010.000.890.000
RSR0.131.200.430.390.190.440.000
SRL2.5513.246.196.082.440.400.000
RGR0.692.241.481.460.250.170.000
RDMR0.372.941.321.290.530.400.000
RLR/TRL0.451.000.790.800.090.120.002
LN0.502.671.501.500.460.300.000
Table 3. Factor analysis of 19 root traits with CVs ≥ 0.3 using the principal component analysis (PCA) extraction method. For each trait, the largest variable loading score crossing the two components is presented in bold form. Five principal components with eigenvalues > 1 are presented and considered significant.
TraitPC 1PC 2PC 3PC 4PC 5
SDM0.719−0.033−0.047−0.410−0.416
RDM0.904−0.1580.318−0.049−0.136
MRW0.3200.4580.1030.311−0.630
RL0.9490.1830.0480.028−0.024
RLS10.7700.5290.1690.044−0.085
RLS20.874−0.233−0.008−0.0090.127
RLS30.797−0.458−0.2660.097−0.011
RSA0.9650.175−0.0720.0270.015
RSAS10.780.5470.0180.045−0.009
RSAS20.879−0.260−0.06−0.0110.092
RSAS30.737−0.471−0.3730.179−0.037
RV0.8270.344−0.0810.0410.269
RVS10.5770.6360.002−0.0040.296
RVS20.874−0.2720.026−0.0430.154
RVS30.602−0.445−0.3990.288−0.014
RSR0.076−0.1820.6610.6240.281
SRL0.0360.657−0.560.1190.209
RDMR0.901−0.1590.314−0.06−0.135
LN0.407−0.0570.271−0.5870.298
Variation proportion Eigenvalue12.9940.8010.0640.6300.244
Variance (%)54.314.37.76.15.5
Cumulative variability (%)54.368.676.382.487.9
Rotation converged in 25 iterations using Varimax with Kaiser normalization. For each trait, the large variable loading score crossing the six components appears in bold. Five principal components with eigenvalues > 1 were extracted and considered significant.
Disclaimer/Publisher’s Note: The statements, opinions and data contained in all publications are solely those of the individual author(s) and contributor(s) and not of MDPI and/or the editor(s). MDPI and/or the editor(s) disclaim responsibility for any injury to people or property resulting from any ideas, methods, instructions or products referred to in the content.

