Article

Bioactivity of Mupirocin Nanoparticle-Loaded Hydrogel against Methicillin-Resistant Staphylococcus aureus (MRSA)

by
Sukanjana Kamlungmak
1,2,
Monwadee Wonglapsuwan
3,
Komwit Surachat
4,
Panchalika Deachamag
3 and
Teerapol Srichana
1,5,*
1
Drug Delivery System Excellence Center, Prince of Songkla University, Hat Yai 90112, Songkhla, Thailand
2
Department of the Thai Traditional Medicine, Faculty of Health and Sports Sciences, Thaksin University, Papayom 93110, Phatthalung, Thailand
3
Department of Molecular Biotechnology and Bioinformatics, Faculty of Science, Prince of Songkla University, Hat Yai 90112, Songkhla, Thailand
4
Information and Communication Technology Programme, Faculty of Science, Prince of Songkla University, Hat Yai 90112, Songkhla, Thailand
5
Department of the Pharmaceutical Technology, Faculty of Pharmaceutical Sciences, Prince of Songkla University, Hat Yai 90112, Songkhla, Thailand
*
Author to whom correspondence should be addressed.
Appl. Microbiol. 2022, 2(1), 260-271; https://doi.org/10.3390/applmicrobiol2010019
Submission received: 23 January 2022 / Revised: 27 February 2022 / Accepted: 28 February 2022 / Published: 3 March 2022

Abstract

:
This novel study investigated the loading of mupirocin nanoparticles into a hydrogel which was expected to enhance the antibacterial activity of mupirocin. The inhibition of isoleucyl-tRNA synthetase and global gene expression in methicillin-resistant Staphylococcus aureus (MRSA) by the mupirocin nanoparticle-loaded hydrogel (MLH) and by pure mupirocin was compared. MLH and mupirocin rapidly inhibited the growth of bacterial populations after 1 h of treatment. At 12 h, mupirocin and MLH inhibited isoleucyl-tRNA synthetase in MRSA. Transcriptome profiles of MRSA showed that gene expression alterations after treatment with mupirocin were similar to those after treatment with MLH at MICs. These alterations included changes to DNA transcription, translation, and replication pathways, and the fold changes in these genes decreased more rapidly with MLH than with mupirocin only after 1 h of treatment. MLH released the mupirocin from the nanoparticles and hydrogel systems and then the drug permeated the cell wall and bound to bacterial isoleucyl-tRNA synthetase. The research also showed that MLH could be further developed for use in clinics for infected wounds.

Graphical Abstract

1. Introduction

The appearance of bacterial infection is a crucial problem for burn wounds. Although there may be no infection 48 h after injury, Gram (+) bacteria, such as Staphylococcus aureus and Streptococcus species, may later be found in burn wounds. One week post burn Gram (−) bacteria appear to dominate. There is also an emerging antibiotic-resistant bacteria-like methicillin-resistant Staphylococcus aureus (MRSA) that has been discovered in burn wounds. The increasing prevalence of MRSA poses an emerging global health threat and is associated with high rates of morbidity and mortality [1,2,3]. MRSA bacteremia may be treated with common topical antibiotics, such as silver sulfadiazine, neomycin, bacitracin, and mupirocin [4,5]. Mupirocin is produced by the bacterium Pseudomonas fluorescens. It is highly effective against Gram-positive bacteria, such as S. aureus, including MRSA. The mechanism of action is protein synthesis inhibition by binding to isoleucyl-tRNA synthetase. Mupirocin formulations are commercially available drugs used to treat skin wound infections in operative wounds, burn wounds, and diabetic wounds. Mupirocin is available as a cream and an ointment. However, the cream and ointment-based medications have disadvantages, such as greasiness and viscosity, which are undesirable for the drug user [6]. Moreover, 2% mupirocin ointment with polyethylene glycol requires application three times daily, leading to poor patient compliance. Furthermore, mupirocin is slowly metabolized by the skin to an inactive form. Therefore, controlled release of topical delivery of mupirocin will improve its efficacy and decrease the frequency of application to once daily [7,8]. In previous reports on mupirocin retardation of wound healing, liposomes in hydrogel [9] and nano-liposomes [10] were developed to improve therapeutics [11] and reduce toxicity compared with mupirocin alone. Nevertheless, there are limitations to the approaches, such as the sensitivity of liposomes to high temperatures during sterilization. When the temperature rises above 25 °C, the liposomes release the drug and other constituents [11].
In our previous study, mupirocin nanoparticle-loaded hydrogels (MLHs) were successfully developed which were expected to enhance or improve the antibacterial activity of mupirocin [12]. Previous work on the antibacterial activity of mupirocin has primarily focused on in vitro conditions, such as minimum inhibitory concentration (MIC) and the minimum antimicrobial concentration needed to eradicate infectious organisms, or minimum biocidal concentration (MBC). These studies confirmed the antibacterial activity of mupirocin and its mechanism of action, together with gene expression analysis. To date, systematic studies of gene expression after treatment with mupirocin formulated in hydrogels have not been reported. This is probably because the bacterial gene expression purification of quantities sufficient to obtain bacterial RNA is technically difficult. RNA sequencing (RNA-seq) can offer data analysis of the entire transcriptome of a sample and can be used to investigate levels of gene expression. Gene expression analysis can be used to monitor response genes to compare the treatment of pure mupirocin with MLH. The study of gene expression can also interlace the profiles of several gene expressions to explain the similarities or differences in MRSA genes after mupirocin or MLH treatment. This technique provides a strong alternative to employing microarrays in examinations of the gene expression of MRSA. Therefore, this study investigated the inhibition of isoleucyl-tRNA synthetase and global gene expression in MRSA by MLH compared with mupirocin. MRSA was stained with fluorescein diacetate (FDA) dye to monitor cell viability, and gene expression was studied via high-throughput RNA-seq. The evidence for MLH therapeutics is considered and discussed.

2. Materials and Methods

2.1. Materials

Kolliphor® P407, poly(ethylene glycol)-block-poly(propylene glycol)-block-poly(ethylene glycol), (EO98-PO64-EO98; P407) was a gift from the Vita Company Limited (Bangkok, Thailand). Poly(vinyl alcohol), average MW 31,000–50,000, 87–89% hydrolyzed product, was obtained from Sigma-Aldrich (Dorset, UK). Sodium borate gelatin was received from the PC Drug Center Co., Ltd. (Bangkok, Thailand). Mupirocin was purchased from Kirsh Pharma Asia Pacific Pte. Ltd. (International Business Park, Singapore). TRIzol® Reagent (Life Technologies, Carlsbad, CA, USA), a Qubit 2.0 fluorometer and Qubit RNA assay kits (Life Technologies, Carlsbad, CA, USA), AMPure XP beads (Agencourt BioSciences Corporation, Beverly, MA, USA), and an Illumina® TruSeq™ RNA Sample Preparation Kit for paired-end reads sequencing on a HiSeq 2000 were all purchased from Illumina, San Diego, CA, USA. The solvents, chemicals, and biochemicals used in each study were of analytical grade.

2.2. Bacterial Strains

MRSA (DMST 20646) was purchased from the Thailand Institute of Scientific and Technological Research (WDCM 383; Bangkok, Thailand).

2.3. Preparation of MLH

The hydrogel was prepared by dispersing the P407 in ultrapure water by mechanical stirring (400 rpm). Then, the stock solutions were stored in a refrigerator at 4 °C for at least 24 h. The crosslinking PVA hydrogel was produced by adding sodium borate into PVA solution. Blending formulations of P407 hydrogel and cPVA hydrogel were prepared by mixing P407 and cPVA in ratio of 80:20. The ratios of 80:20 of P407:cPVA hydrogel were selected for loading with mupirocin nanoparticles. Mupirocin nanoparticles were obtained by spray drying mupirocin with gelatin. Mupirocin nanoparticles (2% w/w mupirocin) were loaded into the hydrogel formulation. The mupirocin nanoparticles containing mupirocin were slowly added into the P407:cPVA hydrogel and the MLHs were stirred with a glass rod for 5 min [12]. The MLH formulation is given in the Supplementary Materials (Table S1).

2.4. Minimum Inhibitory Concentration (MIC) and Minimum Biocidal Concentration (MBC)

The MIC was determined by the resazurin microtiter assay 96-well plate method as follows: standardization of bacterial inoculum was prepared by stepwise dilution of an overnight-grown culture using sterile Mueller–Hinton broth to obtain a bacterial concentration of 5 × 10⁶ CFU mL−1. The antimicrobial substance was used within 15 min of preparation. Then, the plates were incubated at 37 °C to observe any color change. After incubation, resazurin dye solution was added within 4 h. After completion of the incubation, MIC values were scored from columns with no color change (blue resazurin color remained unchanged). Direct plating of the content of the wells with concentrations higher than the MIC value was used to determine the MBC value. Finally, the plates without colonies of bacteria were scored.

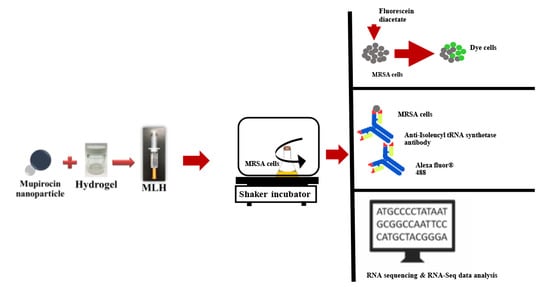
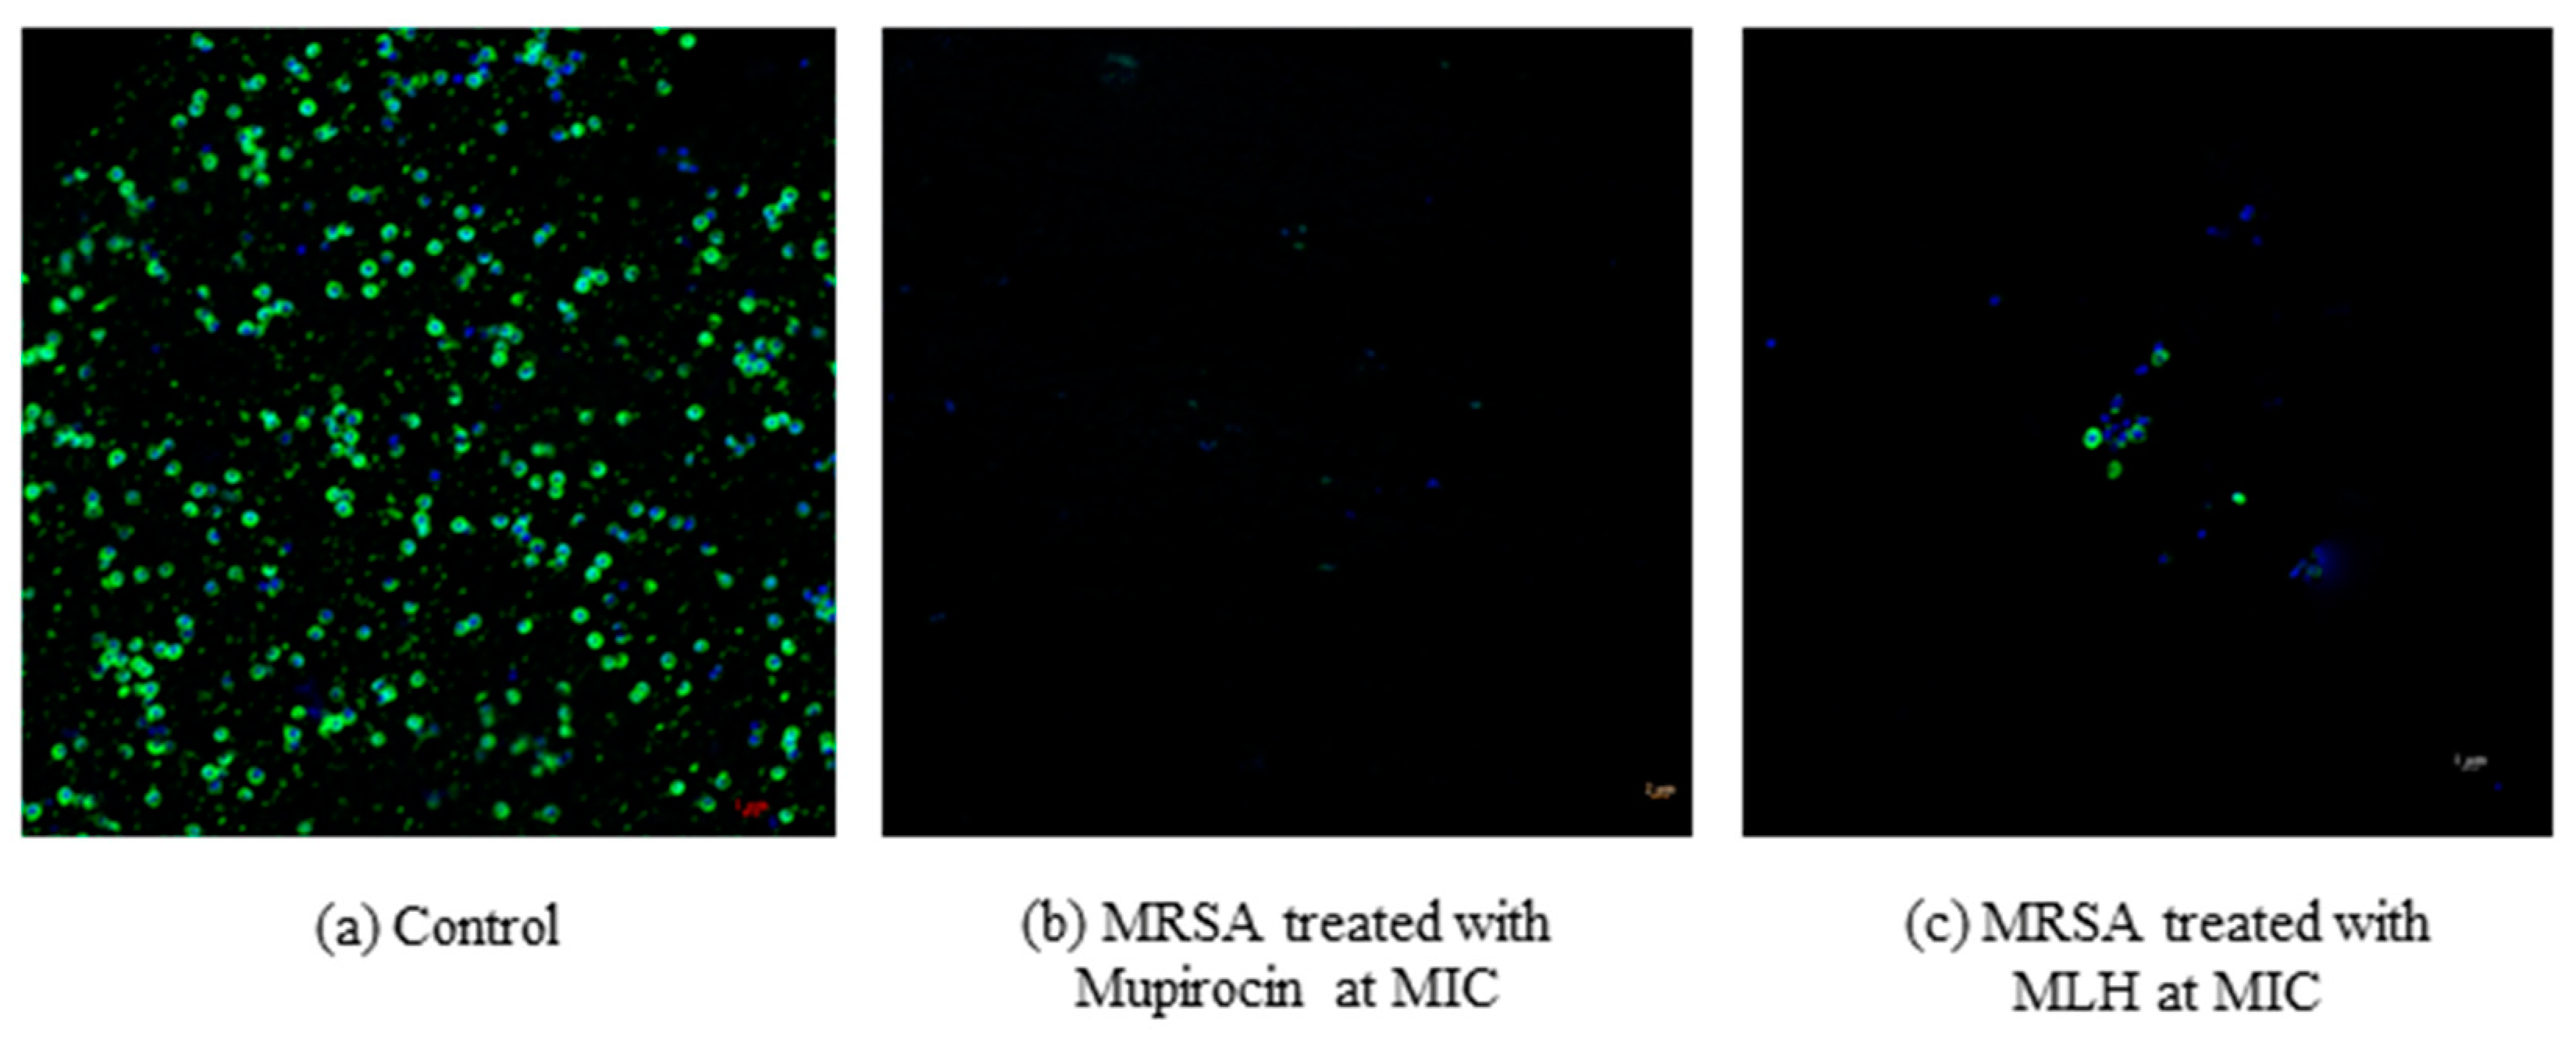
2.5. Bacterial Viability Using Flow Cytometry

For the bacterial culture, MRSA colonies were inoculated into Luria–Bertani broth (Oxoid, Basingstoke, UK) using a sterilized loop. The broth was mixed well using a vortex mixer to prevent MRSA aggregation, followed by incubation overnight at 37 °C in an incubator shaker. Then, the broth was diluted with fresh antibiotic-free medium and cultured to mid-exponential phase. Next, we diluted the bacteria to a final concentration of 5 × 10⁶ CFU mL−1. Inhibitory concentrations of mupirocin (MIC = 0.31 μg mL−1) and MLH (MIC = 0.31 μg mL−1) were added to MRSA in Luria–Bertani broth. Then, the tubes were placed in a rotary incubator at 37 °C and 200 rpm for 24 h. The bacteria were cultured from experiments performed in triplicate. Cells were harvested at 0, 6, 12, 18, and 24 h after treatment with samples in parallel with control cultures.
Bacterial cells were collected by centrifugation at 5000× g for 5 min from the batch culture, washed three times with filtered DI water, and diluted to an OD546 of approximately 0.01 (corresponding to 1 × 10⁷ to 5 × 10⁷ cells mL−1). For inactivation, 10 mL of bacterial suspensions were exposed to MLH for 24 h. Each sample well (500 µL) was taken and loaded into centrifuge tubes containing 500 µL of FDA (500 ng mL−1) in PBS at pH 7.4. Before measurements in the flow cytometry analysis, sample cells and FDA solution were incubated at 37 °C for 15 min.
Fluorescein diacetate (FDA) is taken up by live cells in the presence of mupirocin or its derivatives, and the non-fluorescent FDA is converted into green fluorescent metabolites by esterases in the cells [13,14]. FDA was employed to monitor cell viability by flow cytometry measurements. Flow cytometric (Beckman Coulter, PCL Holding Co., Ltd., Brea, CA, USA) measurements were operated at an excitation laser wavelength of 488 nm with a blue laser. Optical filters were selected such that red fluorescence was measured above 630 nm (FL3) and green fluorescence was measured at 520 nm (FL1). Each sample replicate was recorded at least three times.

2.6. Inhibition of Isoleucyl-tRNA Synthetase in MRSA by MLH

MRSA was cultured in media containing 3 mL of brain heart infusion broth with 50 µg/mL ampicillin maintained at 37 °C and shaken at 140 rpm overnight. Next, the cultured cells were mixed and diluted 1:1000 into 3 mL fresh brain heart infusion broth, then incubated at 37 °C and shaken at 140 rpm for 6 h. Bacterial cells were collected by centrifugation and washed twice with PBS buffer at pH 7.4. For inactivation, samples of bacterial suspension were exposed to 50 mg MLH and incubated at 37 °C, after which they were added to mid-exponentially growing MRSA cells (at 5 h) in Luria–Bertani broth. Cells were harvested at 0, 1, and 5 h after treatment with samples or 5, 6, and 12 h of growth curve in parallel with control cultures and cell density was measured at OD600 nm. The sample cells were fixed with 4% paraformaldehyde (10 min) and incubated in 1% bovine serum albumin, 10% normal goat serum, and 0.3 M glycine in 0.1% PBS-Tween for 1 h to permeabilize the cells and block non-specific protein–protein interactions. The cells were then incubated with anti-isoleucyl-tRNA synthetase antibody at a 1/1000 dilution overnight at 4 °C. The secondary antibody (green) was Alexa Fluor® 488 goat anti-rabbit IgG, which was used at a 1/1000 dilution for incubation of 1 h. Alexa Fluor® 594 WGA was used to label plasma membranes (red) at a 1/200 dilution for 1 h, and 4′,6-diamidino-2-phenylindole (DAPI) was used to stain the cell nuclei (blue) at a concentration of 1.43 M. Confocal laser scanning microscopy (CLSM; Zeiss LSM 800, Jena, Germany) was used to record all confocal images.

2.7. Effects of MLH on Gene Expression in MRSA

For RNA extraction, MRSA cells were harvested at 0, 1, and 5 h after treatment, with samples at 5, 6, and 12 h of the growth curve. The ODs at 600 nm were adjusted to 0.5 for normalization. TRIzol® (0.75 mL) reagent was added to 0.25 mL of each sample to form a pellet. The samples were mixed vigorously and then centrifuged at 12,000× g at 4 °C for 5 min. The clear supernatant was then transferred to a new tube. Chloroform (0.2 mL) was added to 1 mL of TRIzol® Reagent for lysis [15] and the tube was securely capped. The samples were incubated at −80 °C for 1 h, then centrifuged at 12,000× g for 15 min at 4 °C. The mixture separated into three phases: a lower red phenol–chloroform, an interphase, and a colorless aqueous phase. The RNA contained in the aqueous phase was moved to a new tube. The pellet was resuspended in 1 mL of 75% ethanol per 1 mL of TRIzol® Reagent for lysis. The sample was vortexed briefly, then centrifuged for 5 min at 7500× g at 4 °C. The supernatant was discarded. The RNA pellets were placed into a vacuum for 5–10 min. DNase I was used to prevent DNA contamination. The purity and concentration of RNA was confirmed by a Thermo Fisher Scientific™ NanoDrop 2000 and Qubit™ RNA Assay Kits with an Agilent 2100 BioAnalyzer (Agilent Technologies, Palo Alto, CA, USA) [16].
RNA sequencing was performed at Prince of Songkla University, Thailand. The Ribo-Zero™ Magnetic Kit (Epicentre Biotechnologies, Madison, WI, USA) was used to deplete non-coding RNAs from the samples. Then, the Epicentre ScriptSeq v2 RNA-Seq Library Preparation Kit (Catalogue No. 20021533) was used to prepare RNA-seq libraries that were started with 20–25 ng of enriched RNA. After 13 cycles of amplification, AMPure XP beads were used to purify the RNA-seq libraries. Finally, RNA-seq libraries were unified in equimolar amounts and the quantity and quality of each unit were adjudicated by a Bioanalyzer. The resultant pools were subsequently sequenced on an Illumina NextSeq 550 system that yielded a total of 25,783,620 paired reads. The quality trimmed FASTQ files were used to calculate the total number of paired reads, the average Phred quality scores, and the average GC content [17].
The standard method for measuring and comparing levels of gene expression is high-throughput sequencing of messenger RNA (RNA-seq). RNA-seq experiments reduce the raw read data to comprehensible results that generate very large, complex data sets using software. The free open-source software tools HISAT, StringTie, and Ballgown were used for comprehensive analysis of RNA-seq experiments. Paired-end 250 bp reads were aligned with the S. aureus subsp. aureus NCTC 8325 (accession no. NC_007795.1) using HISAT2 (v. 2.1.0) and then we quantified gene abundance using StringTie (v. 2.1.1) [17]. Finally, statistical analysis of differential gene expression was conducted using R software (v. 3.0.1) with the Ballgown package (v. 2.2.0) [17]. Differential gene expression was defined as such when the false discovery rate was ≤0.05 and differential expression ≥2.

2.8. Data Availability

The sequence read archive data are available from the National Center for Biotechnology Information under accession number PRJNA634329. The data can be accessed using this link: http://www.ncbi.nlm.nih.gov/bioproject/634329 (accessed on 21 January 2022).

Statistical Analysis

All data are presented as means ± standard deviation (SD) of at least three replicates. Paired or unpaired Student’s t-tests were used to compare significant differences between groups. The post hoc analysis of variance was employed to interpret significant differences between the means of multiple groups and a p-value < 0.005 was considered statistically significant.

3. Results

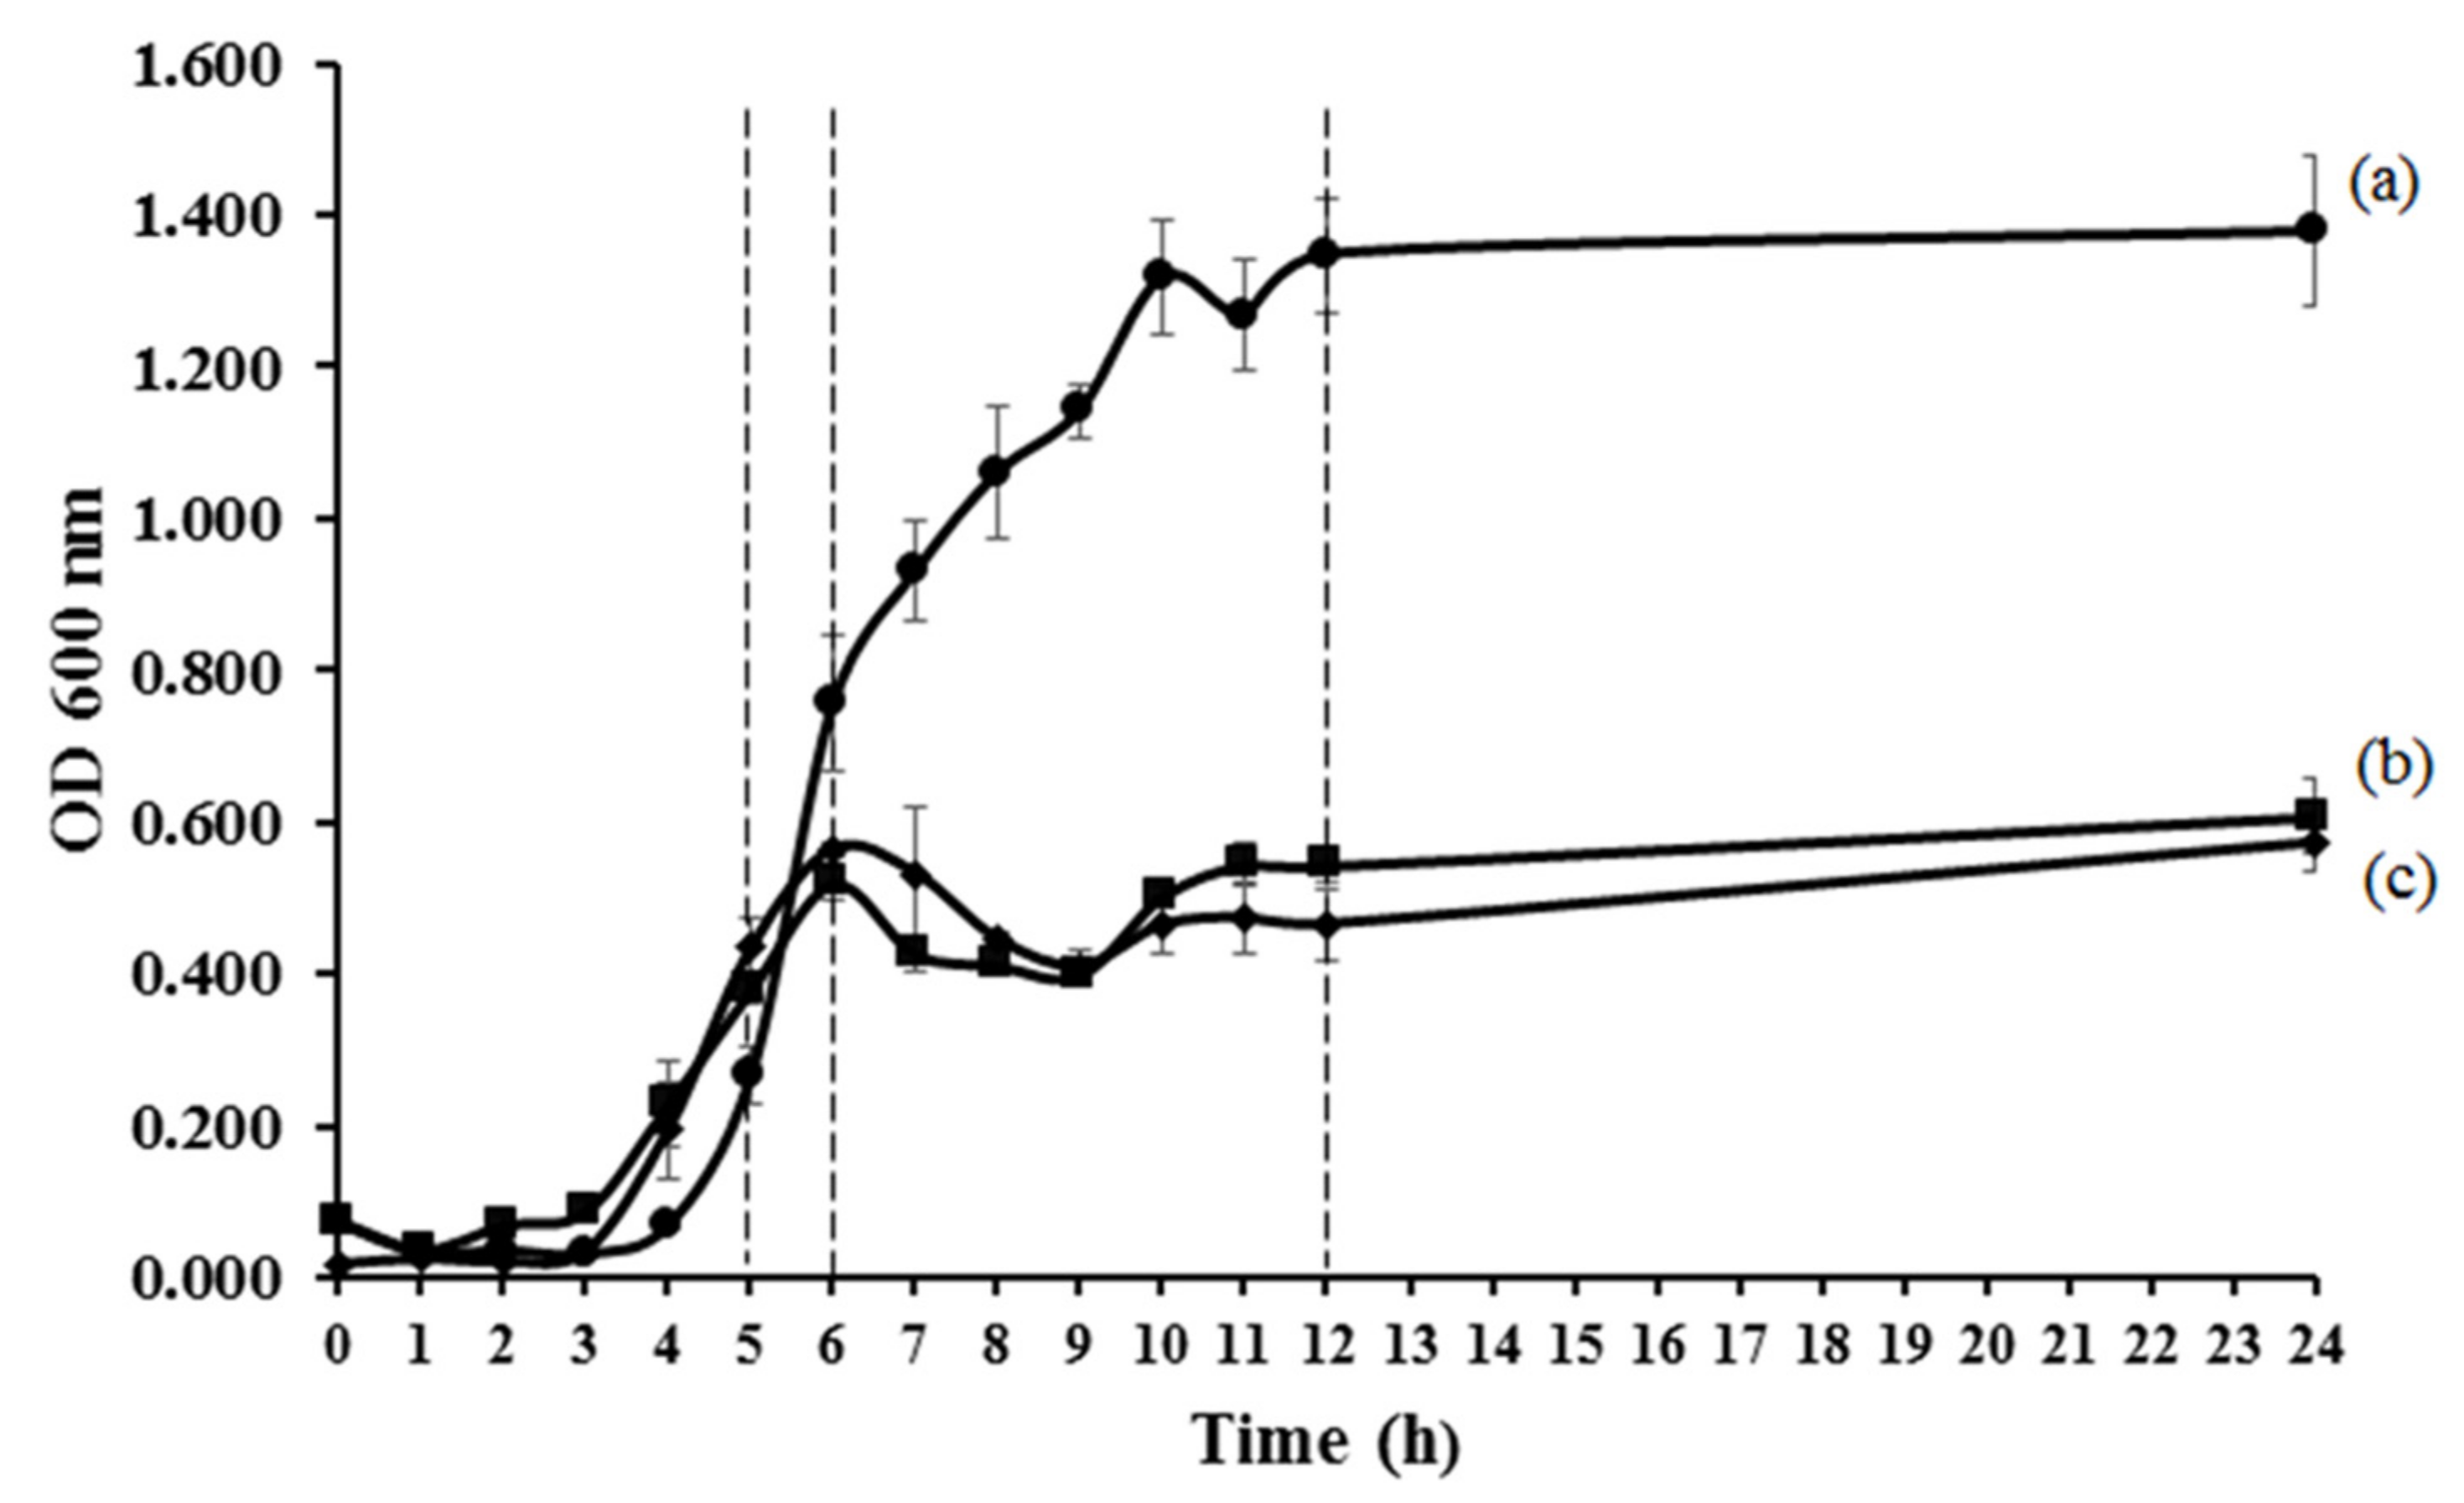
3.1. Antibacterial Activities of MLH

The MLH was more effective as an inhibitory agent than the mupirocin ointment. The MLH and mupirocin inhibited the growth of all bacteria tested. The results indicated that the MIC and MBC of MLH were 0.31 µg mL−1 and 2.44 µg mL−1, respectively (Table 1).
In addition, the MIC and MBC of MLH from flow cytometry were 0.30 µg mL−1 and 2.44 µg mL−1, respectively. The live-cell counts obtained within 24 h showed a decrease in the number of viable bacteria. At 6 h after treatment, the MLH showed a greater decrease in the number of viable bacteria than mupirocin only, but at 24 h after treatment both compounds gave similar results. The results were similar to the treated mupirocin at the MICs. At 24 h, the viable bacteria for the MIC and MBC were 44–49% and 0.2–1.8%, respectively (Figure 1). Based on the flow cytometric analysis, it was found that the MBC of mupirocin and MLH killed the MRSA bacteria at 24 h.
The effect of the MIC (0.30 µg mL−1) concentration of MLH on MRSA is shown in Figure 2. Different sampling times were chosen to observe the inhibition of isoleucyl-tRNA synthetase in MRSA by MLH (5, 6, and 12 h). The mid-exponential phase was at 5 h of the growth curve [18] for all group samples. MRSA growth was inhibited after treatment with mupirocin for 1 h. Moreover, the control cells were in the exponential phase, but the treatment cells showed the beginnings of reduced growth during the stringent response after 6 h of the growth curve. The control cells and the treatment cells were in the stationary phase at 12 h. The effect on MRSA growth up to 24 h was significant between control cells and treatment cells. For OD600 measurements, the control cells at 5 h approached 0.3, whereas the treatment cells with MIC of mupirocin and MIC of MLH remained constant at 0.40 and 0.41, respectively, which was not a significant difference (p ≤ 0.005). Mupirocin and MLH had significant effects at 6 h of the cultures (p ≤ 0.005). The OD600 value for the control cells reached 0.78, whereas the OD600 values for the treated cells at the MIC of mupirocin and the MIC of MLH were 0.52 and 0.54, respectively. After 12 h, both the control cells and the treated cells were in the stationary phase. Mupirocin and MLH had highly significant effects (p ≤ 0.0005). The OD600 for the control cells reached 1.358, whereas the OD600 values of the treated cells at the MICs of mupirocin and MLH were 0.49 and 0.44, respectively (Figure 2).
The inhibition of isoleucyl-tRNA synthetase in MRSA at the MICs of mupirocin and MLH was recorded using confocal laser scanning microscopy (Figure 3). The sample stained with Alexa Fluor® showed the isoleucyl-tRNA synthetase in green and the DAPI staining showed the cell nuclei in blue (Figure 3). At 12 h, mupirocin and MLH could inhibit isoleucyl-tRNA synthetase in MRSA compared with the control. The control shows isoleucyl-tRNA synthetase stained directly with the second antibody (Alexa Fluor®) as a positive control, whereas mupirocin and MLH show a few cells appearing to be stained.

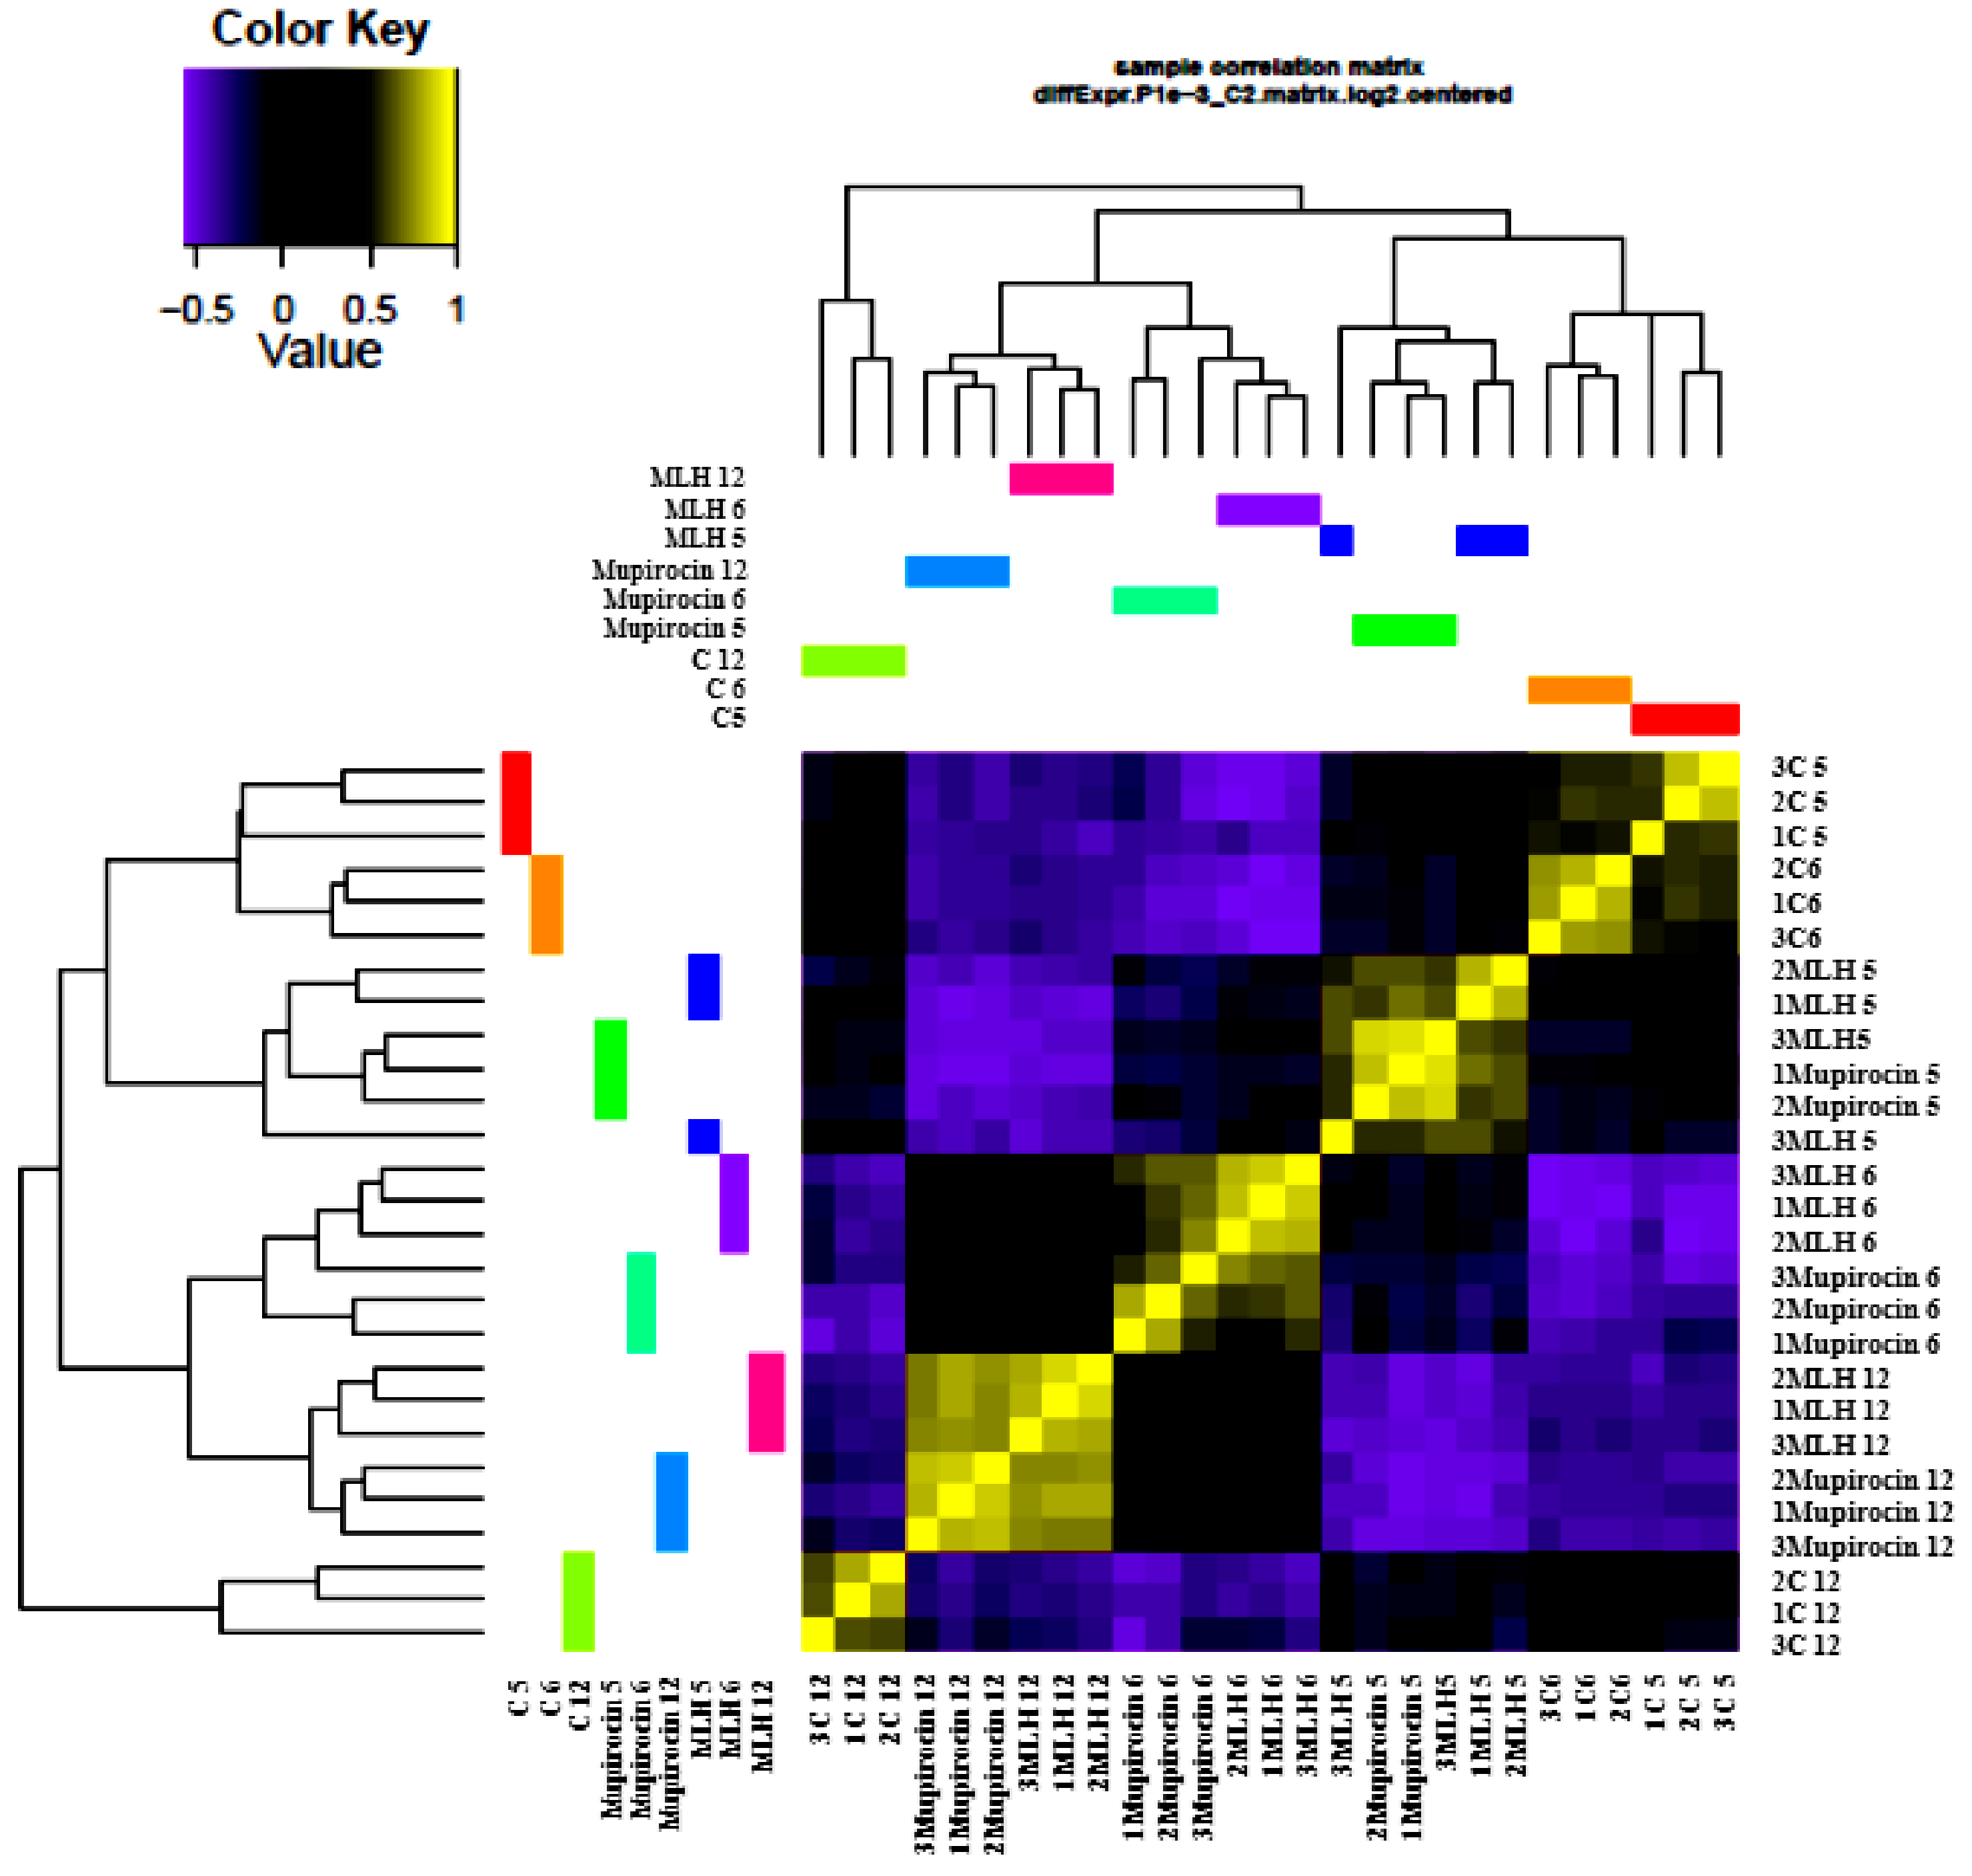
3.2. Gene Expression

Transcription profiles were obtained depending on the change of expression level. Differential gene expression was compared to observe correlations between all samples, presented as a heatmap in Figure 4. The sample correlation matrix shows the corresponding gene expression levels between treated samples and controls, where yellow squares indicate high correlation and blue squares indicate low correlation. We computed RNA-seq data correlations across all samples. Then, we found high correlations among the sample type replicates (value > 0.6) and low correlations across different samples (value < −0.2). Thus, this heatmap can be used to represent gene expression among the control, mupirocin and MLH (Figure 4).
The relationships between gene expression profiles of the control, MLH, and mupirocin were investigated and verified the hierarchical clustering of RNA-seq transcriptome data that was performed (Figure 4). The clustering heat map presents distinct groups of specific genes expressed by each sample type that appear as blocks in Figure 4. The gene expression levels of MLH and mupirocin were similar except for the sub-groups of gene expression. Apparent differences between the control, MLH, and mupirocin can be seen at 12 h which appear as a light-green block. This is an expression of another clustering group in which MLH and mupirocin inhibit or down-regulate the MRSA genes. The top 42 enriched genes are shown in a heatmap (Figure 5).

3.3. Comparison of Gene Expression in MLH, Mupirocin, and Control Samples

Differential MRSA gene expression during the time of treatment with MLH and mupirocin at the MIC for 2965 genes was obtained at all three time points (5, 6, and 12 h of the growth curve). After 0 h of exposure to MIC of MLH or at 5 h of the growth curve, differential expression between controls and cell treatments were found in 1452 genes: 50.5% (733 genes) were up-regulated and 49.5% (719 genes) down-regulated. With treatment with mupirocin, differential expression between controls and cell treatment was found for 1466 genes: 52% (762 genes) were up-regulated and 48% (704 genes) were down-regulated. After 1 h of MIC of MLH exposure or at 6 h of the growth curve, differential expression between controls and cell treatments was found in 1425 genes (1.9%, a decrease from 0 h): 52.6% (748 genes) of the genes were up-regulated and 47.4% (673 genes) were down-regulated. After 1 h of treatment with mupirocin, the number of differentially expressed genes increased by 0.6% compared with gene expression levels at 0 h: 1475 genes were differentially expressed between controls and the treated samples: 56% (826 genes) were up-regulated and 44% (647 genes) were down-regulated. After 7 h of MIC of MLH exposure or at 12 h of the growth curve, differential expression between controls and cell treatments were found in 1586 genes (9.2% increase from 0 h): 42.2% (670 genes) of the differentially expressed genes were up-regulated and 57.8% (916 genes) were down-regulated. After 7 h of treatment with mupirocin, the number of differentially expressed genes increased by 7.7% compared with gene expression levels at 0 h: differential expression between controls and cell treatments was found in 1579 genes: 40.7% (642 genes) were up-regulated and 59.3% (937 genes) were down-regulated (Table 2).
Down-regulation of genes after 0 h of exposure with mupirocin and MLH included large decreases in DNA replication and translation as well as structural constituents of ribosomes and activation of amino acid/protein synthesis, carbohydrate metabolism, nucleotide transport, metabolism, and the cell cycle (Table S2). After 1 h exposure with mupirocin and MLH, the genes were down-regulated by more than 2-fold relative to the MRSA control cells, but the fold changes in the genes due to MLH decreased more rapidly than those with mupirocin, as shown in Table 2. After 7 h exposure with mupirocin and MLH, the genes were still down-regulated, yet the amount of down-regulation was less than that after 1 h of treatment. The up-regulated genes after 0 h of mupirocin and MLH treatment were involved in transcription/stress response and translation as well as activation of amino acid/protein synthesis and biosynthetic processes (Table S3). In addition, the ileS gene encoding isoleucyl-tRNA synthetase was up-regulated after 0, 1, and 7 h, respectively. After 0 h, the mupirocin up-regulated isoleucyl-tRNA synthetase more than MLH but after 1 and 7 h of exposure at MIC, the MLH up-regulated isoleucyl-tRNA synthetase more than mupirocin only (Table S4). Down-regulation associated with the GTPase enzymes, encoded by the obgE genes, are interesting. Furthermore, stress response induced the encoding of addiction module toxins by the nrdR gene, spxA gene, and others. Whereas the ileS gene was strongly upregulated (p < 0.005), the genes that encode leucyl tRNA and alanyl-tRNA synthetase were significantly downregulated (p < 0.005) (Tables S5 and S6).

4. Discussion

It is estimated that hundreds of thousands of bacterial species exist in the environment. From the point of view of human medicine, MRSA is a notable species as it frequently colonizes the skin and mucosal surfaces [19]. This pathogen is the causes of the clinical symptoms of infections form a number of extracellular enzymes and exotoxins. Previous studies showed that MLH could release a drug from the nanoparticle and hydrogel systems [10] that permeated the cell wall and bound to the bacterial isoleucyl-tRNA synthetase. The isoleucyl-tRNA formation with mupirocin form isoleucine obstructs incorporation of isoleucine into protein chains, resulting in inhibition of protein synthesis [20,21]. Mupirocin was found to be highly effective against Gram-positive cocci, such as MRSA, in this study [20]. It is clearly shown that the MBC is drug concentration- and exposure time-dependent. MLH showed superior activity against MRSA compared with mupirocin, indicating that the nanoparticle in the hydrogel system promoted more drug transport into the bacterial cells.
Given the RNA-seq data analysis, it is possible that, with the MLH, mupirocin, having been released from the hydrogel system, affected MRSA cells after 1 h of exposure by up-regulating the ileS more highly than mupirocin alone at 1 and 7 h. The MLH can release mupirocin which is able to permeate the cell wall and bind to bacterial isoleucyl-tRNA synthetase. Since the S. aureus ileS gene is a member of the T-box family [22], we can predict that the expression is induced in response to limitations of isoleucine or inhibition of isoleucyl-tRNA synthetase enzyme activity, since accumulation of uncharged tRNAIle is expected to occur in this study. A greater than 10-fold induction of the read-through ileS gene transcriptome in response to mupirocin caused inhibition of isoleucyl-tRNA synthetase, as found in other work [23]. The charge of isoleucyl-tRNA with isoleucine is blocked by the addition of mupirocin which leads to the gathering of uncharged isoleucyl-tRNAs and reduction of the amino-acetylated isoleucyl-tRNA pool. Hence, the increase in accumulation of uncharged tRNAs related to the destitution of amino acids for the bacterial cell stimulated a stringent response, as previously observed by Hughes and Mellows, and Geiger [19,24]. Most prokaryotic microorganisms exhibit the stringent response that is a base global adaptation program [25]. The general shutdown of energy consuming processes is necessary for survival under stringent control when MRSA growth is inhibited by mupirocin. The molecular target of mupirocin has been widely observed to be isoleucyl-tRNA synthetase. It is therefore possible that intracellular levels of leucine, isoleucine, and valine slightly increased after mupirocin or MLH treatment compared to the control and that this is caused by inhibition of biosynthesis pathways. Of particular interest, down-regulation of genes of the GTPase enzymes, coded by the obgE gene, occurring within a cell, was also actuated through the process of (p)ppGpp synthesis [19]. The transcription of all rRNA genes started with guanosine nucleotides, the expression of which was influenced by levels of intracellular guanosine triphosphate (GTP) [22]. With the initiation of their primary promoters, at the beginning of transcription of rRNA in MRSA, they have been mapped and have verified the part of GTP, which can explain the impact of low GTP concentrations on gene expression [23].

5. Conclusions

In conclusion, the MLH at MICs can inhibit isoleucyl-tRNA synthetase in MRSA as well as mupirocin only as observed by CLSM. The MICs of mupirocin only and MLH were able to trigger a stringent response in MRSA which led to the up- and down-regulation of genes during the exponential phase of MRSA growth. Transcriptome profiles of MRSA showed that global transcriptional alterations after treatment with mupirocin were similar to those treated with MLH at MICs, including genes involved in the regulation of transcription, translation, and replication pathways, though the fold changes in these genes decreased more rapidly with MLH than with mupirocin after only 1 h of treatment. The inhibition of mupirocin and MLH prevented incorporation of isoleucine into the protein chains, resulting in inhibition of protein synthesis, whereas induction of GTP resulted in growth inhibition. Finally, MLH can be successfully developed for use as an antibacterial skin formulation and can replace mupirocin ointment. A future study will focus on an animal model for studies of safety and efficacy.

Supplementary Materials

The following supporting information can be downloaded at: https://www.mdpi.com/article/10.3390/applmicrobiol2010019/s1, Table S1: Preparation of MLH, Table S2: Decreases in the expression of genes involved in important functions following exposure to MICs of mupirocin and MLH compared with the control at 5, 6, and 12 h, Table S3: Increases in the expression of genes involved in important functions following exposure to MICs of mupirocin and MLH compared with the control at 5, 6, and 12 h, Table S4: Increases in the expression of genes involved in important functions following exposure to MICs of mupirocin and MLH at 5 h and decreases in gene expression at 6 and 12 h compared with the control, Table S5: Increases in the expression of genes involved in important functions following exposure to MICs of mupirocin and MLH at 5 and 6 h and decreases in gene expression at 12 h compared with the control, Table S6: Decreases in the expression of genes involved in important functions following exposure to MICs of mupirocin and MLH at 5 and 6 h and increases in gene expression at 12 h compared with the control.

Author Contributions

Conceptualization, S.K. and T.S.; investigation, S.K., M.W. and P.D.; resources, M.W. and T.S.; data analysis, K.S. and S.K.; writing—original draft preparation, S.K.; writing—review and editing, T.S.; visualization, S.K.; supervision, T.S.; project administration, T.S.; funding acquisition, S.K. and T.S. All authors have read and agreed to the published version of the manuscript.

Funding

This work was supported by the Royal Golden Jubilee Ph.D. program of the Thailand Research Fund; PHD/0088/2559 for K. Sukanjana and the National Research Council of Thailand (PHA610372S).

Institutional Review Board Statement

Not applicable.

Informed Consent Statement

Not applicable.

Data Availability Statement

The sequence read archive data are available from the National Center for Biotechnology Information under accession number PRJNA634329. The data can be accessed using this link: http://www.ncbi.nlm.nih.gov/bioproject/634329 (accessed on 21 January 2022).

Acknowledgments

This research was supported by the Royal Golden Jubilee Ph.D. program of the Thailand Research Fund; PHD/0088/2559 for K. Sukanjana and the National Research Council of Thailand (PHA610372S). We are grateful to the Drug Delivery System Excellence Center (DDESC), Faculty of Pharmaceutical Sciences, Prince of Songkla University for the use of research facilities. We would like to thank Maria Mullet for her English editing.

Conflicts of Interest

The authors declare no conflict of interest. The funders had no role in the design of the study; in the collection, analyses, or interpretation of data; in the writing of the manuscript.

References

  1. Chong, Y.P.; Park, S.J.; Kim, H.S.; Kim, E.S.; Kim, M.N.; Park, K.H.; Kim, S.H.; Lee, S.O.; Choi, S.H.; Jeong, J.Y.; et al. Persistent Staphylococcus aureus bacteremia: A prospective analysis of risk factors, outcomes, and microbiologic and genotypic characteristics of isolates. Medecine 2013, 92, 98–108. [Google Scholar] [CrossRef] [Green Version]
  2. Le Moing, V.; Alla, F.; Doco-Lecompte, T.; Delahaye, F.; Piroth, L.; Chirouze, C.; Tattevin, P.; Lavigne, J.P.; Erpelding, M.L.; Hoen, B.; et al. Staphylococcus Aureus bloodstream infection and endocarditis—A prospective cohort study. PLoS ONE 2015, 10, e0127385. [Google Scholar] [CrossRef] [Green Version]
  3. Hassoun, A.; Linden, P.K.; Friedman, B. Incidence, Prevalence, and management of mrsa bacteremia across patient populations-a review of recent developments in mrsa management and treatment. Crit. Care 2017, 21, 211. [Google Scholar] [CrossRef] [PubMed] [Green Version]
  4. Fowler, V.G.; Boucher, H.W.; Corey, G.R.; Abrutyn, E.; Karchmer, A.W.; Rupp, M.E.; Levine, D.P.; Chambers, H.F.; Tally, F.P.; Vigliani, G.A.; et al. Daptomycin versus standard therapy for bacteremia and endocarditis caused by Staphylococcus aureus. N. Engl. J. Med. 2006, 355, 653–665. [Google Scholar] [CrossRef] [PubMed] [Green Version]
  5. Kullar, R.; Davis, S.L.; Levine, D.P.; Rybak, M.J. Impact of Vancomycin exposure on outcomes in patients with methicillin-resistant Staphylococcus aureus bacteremia: Support for consensus guidelines suggested targets. Clin. Infect. Dis. 2011, 52, 975–981. [Google Scholar] [CrossRef] [Green Version]
  6. Hurler, J.; Sørensen, K.K.; Fallarero, A.; Vuorela, P.; Škalko-Basnet, N. Liposomes-in-hydrogel delivery system with mupirocin: In vitro antibiofilm studies and in vivo evaluation in mice burn model. BioMed Res. Int. 2013, 2013, 1–8. [Google Scholar] [CrossRef] [Green Version]
  7. Amrutiya, N.; Bajaj, A.; Madan, M. Development of microsponges for topical delivery of mupirocin. AAAPS Pharmscitech. 2009, 10, 402–409. [Google Scholar] [CrossRef] [Green Version]
  8. Goldmann, O.; Cern, A.; Müsken, M.; Rohde, M.; Weiss, W.; Barenholz, Y.; Medina, E. Liposomal mupirocin holds promise for systemic treatment of invasive Staphylococcus aureus infections. J. Control. Release 2019, 316, 292–301. [Google Scholar] [CrossRef]
  9. Ishida, M.; Nambu, N.; Nagai, T. Ointment-type oral mucosal dosage form of carbopol containing prednisolone for treatment of aphtha. Chem. Pharm. Bull. 1983, 31, 1010–1014. [Google Scholar] [CrossRef] [Green Version]
  10. Cern, A.; Nativ-Roth, E.; Goldblum, A.; Barenholz, Y. Effect of solubilizing agents on mupirocin loading into and release from pegylated nanoliposomes. J. Pharm. Sci. 2014, 103, 2131–2138. [Google Scholar] [CrossRef]
  11. Torchilin, V.; Weissig, V. Liposomes: A Practical Approach; R.R.C. New, Ed.; Oxford University Press: Oxford, UK, 2003. [Google Scholar]
  12. Kamlungmak, S.; Rugmai, S.; Tinpun, K.; Nakpheng, T.; Srichana, T. Phase Behavior, in vitro drug release, and antibacterial activity of thermoresponsive poloxamer– polyvinyl alcohol hydrogel-loaded mupirocin nanoparticles. J. Appl. Polym. Sci. 2020, 137, 49325. [Google Scholar] [CrossRef]
  13. Lundgren, B. Fluorescein diacetate as a stain of metabolically active bacteria in soil. Oikos 1981, 36, 17–22. [Google Scholar] [CrossRef]
  14. Boyd, V.; Cholewa, O.M.; Papas, K.K. Limitations in the use of fluorescein diacetate/propidium iodide (fda/pi) and cell permeable nucleic acid stains for viability measurements of isolated islets of langerhans. Curr. Trends Biotechnol. Pharm. 2008, 2, 66–84. [Google Scholar]
  15. Simms, D.; Cizdziel, P.; Chomczynski, P. TRIzol: A new reagent for optimal single-step isolation of RNA. Focus 1993, 15, 99–102. [Google Scholar] [CrossRef]
  16. O’Neill, M.; McPartlin, J.; Arthure, K.; Riedel, S.; McMillan, N.D. Comparison of the TLDA with the nanodrop and the reference qubit system. J. Phys. Conf. Ser. 2011, 307, 102047. [Google Scholar] [CrossRef]
  17. Pertea, M.; Kim, D.; Pertea, G.; Leek, J.T.; Salzberg, S.L. Transcript-level expression analysis of RNA-seq experiments with hisat, stringtie, and ballgown. Nat. Protoc. 2019, 176, 139–148. [Google Scholar] [CrossRef]
  18. Zwietering, M.H.; Jongenburger, I.; Rombouts, F.M.; Riet, K.V. Modeling of the bacterial growth curve. Appl. Environ. Microbiol. 1990, 56, 1875–1881. [Google Scholar] [CrossRef] [Green Version]
  19. Geiger, T.; Goerke, C.; Fritz, M.; Schäfer, T.; Ohlsen, K.; Liebeke, M.; Lalk, M.; Wolz, C. Role of the (p)PpGpp Synthase RSH, a RelA/SpoT Homolog, in stringent response and virulence of Staphylococcus aureus. Infect. Immun. 2010, 78, 1873–1883. [Google Scholar] [CrossRef] [Green Version]
  20. Spann, C.T.; Taylor, S.C.; Weinberg, J.M. Topical antimicrobial agents in dermatology. Clin. Dermatol. 2003, 21, 70–77. [Google Scholar] [CrossRef]
  21. Tenover, F.C. Mechanisms of antimicrobial resistance in bacteria. Am. J. Infect. Control 2006, 34, S3–S10. [Google Scholar] [CrossRef]
  22. Crosse, A.M.; Greenway, D.L.A.; England, R.R. Accumulation of PpGpp and PpGp in Staphylococcus aureus 8325-4 Following Nutrient Starvation. Lett. Appl. Microbiol. 2000, 31, 332–337. [Google Scholar] [CrossRef] [Green Version]
  23. Sonenshein, A.L. CodY, a Global regulator of stationary phase and virulence in gram-positive bacteria. Curr. Opin. Microbiol. 2005, 8, 203–207. [Google Scholar] [CrossRef]
  24. Hughes, J.; Mellows, G. On the mode of action of pseudomonic acid: Inhibition of protein synthesis in Staphylococcus aureus. J. Antibiot. 1978, 31, 330–335. [Google Scholar] [CrossRef] [Green Version]
  25. Alhoufie, S.T.S.; Foster, H.A. Effects of sub-lethal concentrations of mupirocin on global transcription in Staphylococcus aureus 8325-4 and a model for the escape from inhibition. J. Med. Microbiol. 2016, 65, 858–866. [Google Scholar] [CrossRef]
Figure 1. Flow cytometric analysis of methicillin-resistant Staphylococcus aureus (MRSA) treated with a minimum inhibitory concentration (MIC) of mupirocin, MIC of MLH, MBC of MLH, and MBC of mupirocin at 24 h with fluorescein diacetate (FDA, 10 µg/mL in PBS at pH 7.4), along with controls; MRSA stained with FDA. Flow cytometry used an FL1 detector and 515–545 nm fluorescence of FDA.
Applmicrobiol 02 00019 g001
Figure 2. Growth curve of (a) MRSA (control) and (b) MRSA treated with a MIC of mupirocin and (c) MRSA treated with a MIC of MLH at mid-exponential growth (5 h) (mean ± SD, n = 3).
Applmicrobiol 02 00019 g002
Figure 3. Confocal microscopy of MRSA treated with MICs of mupirocin (b) and MLH (c) along with the control (a) at 12 h stained with Alexa fluor® 488 goat anti-rabbit igg (in green) and DAPI (4′,6-diamidino-2-phenylindole) (in blue).
Applmicrobiol 02 00019 g003
Figure 4. Sample correlation heatmap based on the level of correlation between the corresponding samples (control, mupirocin, and MLH).
Applmicrobiol 02 00019 g004
Figure 5. Sample correlation heatmap based on changes in gene expression of MRSA treated with a MIC of MLH and mupirocin at 5, 6, and 12 h compared with control samples at the same times.
Applmicrobiol 02 00019 g005
Table 1. MIC (µg/mL) and MBC (µg/mL) of mupirocin nanoparticle-loaded hydrogel, mupirocin ointment, and vancomycin.
Antibacterial ActivitiesSample
HydrogelMLHMupirocin OintmentVancomycinMupirocin (Pure Drug)
MIC-0.310.611.560.31
MBC-2.449.761.562.44
Table 2. Gene expression with bacterial cell treatment with MLH and mupirocin at 5, 6, and 12 h of the growth curve.
Treatment% Down-Regulated% Up-Regulated
5 h6 h12 h5 h6 h12 h
MLH50.552.642.249.547.457.8
Mupirocin52.056.040.748.044.059.3
Publisher’s Note: MDPI stays neutral with regard to jurisdictional claims in published maps and institutional affiliations.

